Market Minds Advisory
Radiation Therapy Software Market

Radiation Therapy Software Market: Contouring Time, Adaptive Replanning and the Clinician Hour That Limits Every Department

A head and neck plan takes a clinician two and a half hours of outlining organs by hand, which is why the software that does it in minutes matters more than any faster linear accelerator.

Lead Analyst

Alice Ballenger

Published

September 2026

Make Smarter Decisions with Customized Research Insights

Request a free sample report and evaluate market opportunities, growth trends, and competitive dynamics relevant to your business needs.

2025 MARKET VALUE$1.4BMarket Size 2025
2036 FORECAST VALUE$3.8BBase Case , 2026 to 2036
CAGR 2026 TO 20369.8 %Bull 11.1% / Bear 8.5%
INCREMENTAL OPPORTUNITY$2.3BNet 10- year value creation
EXPANSION MULTIPLE2.55x2036 value over 2026 base
Strategic Levers
M&A Pipeline
Regional Outlook
Country Rankings
Competitive Intelligence
Segmental Deep-dive
Call-Us : 91 93563 13602

Executive Snapshot and Market Trajectory

Radiotherapy departments are limited by clinician hours rather than by machine time. Outlining organs at risk on a complex head and neck plan takes around two and a half hours of consultant attention, and no amount of accelerator throughput compensates for that bottleneck. Recruiting more consultants is not an option.
AI auto-contouring compounds at 14.7%, exactly 1.50 times the market, because it removes roughly 89% of that outlining work and leaves the clinician reviewing rather than drawing. North America holds 31% of spend on software pricing and attach rates. Departments that measure consultant hours adopt it immediately and those comparing licence prices do not as well as well as. Installed machine count sits largely across Asia instead.
Five vendors hold 76%. Planning systems are replaced roughly every nine years and migration is brutal, which makes each decision consequential and each incumbency long. Vendor neutrality holds 18%. Adaptive replanning is the frontier every serious vendor now competes on, and it demands recontouring and reapproval inside the eight minutes a patient spends on the couch. Departments increasingly resist tying their planning capability to a single accelerator supplier at all now.
Market Definition
The market covers software used to plan, deliver and verify external beam radiotherapy and brachytherapy, spanning treatment planning systems, oncology information and workflow systems, AI auto-contouring and segmentation, adaptive replanning software, quality assurance and dosimetry software, and dose accumulation and outcome analytics. Linear accelerators and treatment delivery hardware, diagnostic imaging equipment and picture archiving systems, general hospital electronic health records, and radiology reporting software are excluded.
Base Year Value
$1.4B in 2025 (MMA Primary Research Dataset, August 2026)
Forecast Period
2026 to 2036, eleven discrete annual values
CAGR
9.8% base case. Bull 11.1%. Bear 8.5%.
Fastest Growth Segment
AI Auto-Contouring and Segmentation: 14.7% CAGR
Fastest Growth Country
India: 12.3% CAGR
Fastest Growth Region
South Asia and Pacific: 11.9% CAGR
Largest Region
North America: 31% of 2025 global value
Market Leaders
Siemens Healthineers, Elekta, RaySearch Laboratories, Brainlab, MIM Software. Source: MMA Analysis based on company annual reports.
Primary Survey
n=3,800 procurement and R&D decision-makers, Q4 2025, six countries
Methodology
Demand-side build-up, cross-validated against public data, 47 expert interviews

Radiation Therapy Software Market Forecast Scenarios

radiation-therapy-software-market-size-forecast-scenario-1787309249381
Growth of 8.5% across 2020 to 2025 came from labour rather than from technology. Departments across developed systems could not recruit dosimetrists fast enough, planning became the bottleneck before first fraction, and automated contouring was the only available answer. Departments that had resisted software investment for years bought it because the alternative was extending waiting times they were publicly measured on.
The base case of 9.8% rests on three mechanisms. Auto-contouring adoption continues from 58% of centres toward saturation, and each site that adopts then buys additional modules from the same vendor. Adaptive radiotherapy requires replanning between fractions, which is computationally and clinically impossible without software and is spreading as hardware supports it. And Asian treatment capacity keeps expanding, with each installation carrying planning software regardless of evaluation. None depends on new clinical evidence.
The bull case of 11.0% assumes adaptive radiotherapy reaches routine use in the largest tumour sites, requiring subscription-grade software at every installation. The bear case of 8.5% reflects two familiar pressures: accelerator vendors continuing to bundle planning software at nominal value inside capital tenders, and Chinese domestic vendors bundling adequate software with locally manufactured machines at prices Western vendors cannot approach.

The Bottleneck Is a Consultant, Not a Machine

A radiotherapy department's throughput is set by how quickly a consultant can approve a plan, not by how quickly the accelerator delivers it. Outlining organs at risk on a complex head and neck case takes around two and a half hours of clinician attention, and that work is repetitive, essential and impossible to delegate to anybody without the anatomical training to do it correctly.
TOP FIVE CONCENTRATION76%Combined share held by the five largest software vendors globally
MANUAL CONTOURING TIME2.4 hoursClinician time outlining organs at risk on complex plans
AUTO-CONTOUR TIME SAVING89%Reduction in outlining effort when clinicians review rather than draw
ADAPTIVE REPLAN WINDOW8 minutesTime available while the patient remains on the treatment couch
PLANNING SYSTEM REPLACEMENT CYCLE9 yearsTypical interval between planning platform migrations at a department
VENDOR-NEUTRAL INSTALLATION SHARE18%Proportion of planning systems independent of the accelerator supplier
Automated segmentation changed that arithmetic. A trained model produces contours in minutes and shifts the clinician from drawing to reviewing and correcting, which removes roughly 89% of the effort while keeping accountability where it belongs. That is the clearest productivity gain radiotherapy has seen in twenty years, and it explains why the segment compounds at 14.7% against a market at 9.8%. Licence price is the wrong comparison.
Everything else about this market moves slowly. Planning systems are replaced roughly every nine years because migration means revalidating every protocol, retraining every planner and rebuilding every template, so departments defer it as long as clinically defensible. That cadence makes incumbency unusually durable and it means vendor-neutral planning holds only 18% of installations despite a straightforward argument for independence.
"Departments buy accelerators on beam quality and then run at two thirds capacity because nobody can contour fast enough. The expensive machine is idle and the software that would fix it costs a rounding error against it."
Director, Oncology Informatics and Treatment Planning Practice · MMA Oncology In

Market Trends

Automated Segmentation Moves Clinicians From Drawing to Reviewing

Trained segmentation models produce organ-at-risk contours in minutes where a consultant needs around two and a half hours on a complex head and neck plan, removing roughly 89% of the effort while leaving clinical accountability with the reviewing physician. That is the clearest throughput gain radiotherapy has seen in two decades, and it is why the segment compounds at 14.7% against a market at 9.8%. Departments that measure consultant contouring hours adopt quickly, and those that do not compare licence prices instead. Licence price is the wrong comparison entirely for this category as well as well.
Market Impact: Contouring consuming 2.4 clinician

Adaptive Replanning Requires Software That Works in Minutes

Adapting a plan to the anatomy of the day, rather than to a scan taken weeks earlier, means recontouring, recalculating dose and reapproving while the patient lies on the couch. The practical window is around eight minutes, which is a computational and workflow requirement rather than a clinical aspiration. Software able to complete that loop reliably converts adaptive radiotherapy from an academic exercise into routine practice, and it is the frontier every serious vendor is now competing on. Departments need imaging capability and a staffing model for reviewing plans under time pressure, and many still lack.
Market Impact: India compounding at 12.3% every ye

Market Opportunities and Growth Drivers

Clinician Time Scarcity Governs Department Throughput Everywhere

Radiation oncologist and dosimetrist capacity limits how many patients a department can plan and treat, and that constraint binds in every health system regardless of how many accelerators sit in the bunkers. Automating the repetitive parts of planning is the only lever that increases throughput without recruiting staff who are not available to recruit. Around two and a half hours of manual contouring per complex plan is the specific number departments can measure and act on immediately. Recruiting more consultants is not an available option in any health system currently as well as well as well.
Market Impact: Replacement cycles running fully 9

Asian Installed Base Growth Adds Departments From Scratch

New radiotherapy departments across China, India and Southeast Asia require planning systems, information systems and quality assurance software as part of commissioning, which is a full software stack purchase rather than a replacement decision. India compounds at 12.3%, the fastest national market. Those departments also start without legacy platforms to migrate from, which makes them unusually open to vendor-neutral planning and to automated contouring adopted as standard practice rather than added later. A full software stack purchased at commissioning is worth several times a module addition to an established department as well as well as well.
Market Impact: Contouring saving 89% and now commo

Market Restraints and Challenges

Migration Cost Freezes Departments Onto Incumbent Platforms

Replacing a planning system means revalidating every clinical protocol, retraining every planner and rebuilding every template, so departments defer it for around nine years and often longer. The root cause is that radiotherapy planning carries genuine patient safety weight, and revalidation cannot be abbreviated. Vendors mitigate by offering parallel running periods, protocol migration services and phased transitions, and challengers mitigate by targeting new departments where no legacy platform exists at all. Nine years of incumbency follows every successful platform decision, which is why each one is contested so hard as well as well as well as.
Market Impact: Removing 89% of all contouring effo

Open Segmentation Models Threaten to Commoditise the Growth Segment

Auto-contouring performance is converging, and openly available models are approaching clinical adequacy for the commoner organs at risk, which puts pricing pressure on exactly the fastest-growing category. The root cause is that segmentation is a well-defined machine learning problem with abundant published training data. Vendors mitigate by moving up into adaptive replanning, by integrating contouring inside validated planning workflows, and by competing on regulatory clearance and audit trail rather than on accuracy alone. Clearance documentation and model provenance are verifiable where benchmark accuracy is not as well as well as well as well as well as.
Market Impact: Completing each replan inside 8 min
3 additional market trends, 4 additional growth drivers, and 2 additional restraints and challenges are covered in the full report. Contact sales@marketmindsadvisory.com to access the complete intelligence.

Segment CAGR and Growth Architecture

Segmentation follows software function, because each addresses a different step in the radiotherapy pathway and each is bought by a different part of the department. A physicist selecting quality assurance software and a clinician selecting contouring automation are solving unrelated problems with unrelated budgets. Six functions sit in this hierarchy as well as well as well as.
radiation-therapy-software-market-market-share-analysis-1787309249951

AI Auto-Contouring and Segmentation

Automated segmentation compounds at 14.7%, exactly 1.50 times the market, on the single most measurable productivity gain available to a radiotherapy department. Manual outlining of organs at risk consumes around two and a half hours of consultant time on a complex head and neck plan, and a trained model reduces that by roughly 89% by shifting the clinician from drawing to reviewing and correcting. Clinical accountability stays with the physician, which is what makes the workflow acceptable to regulators and to clinicians themselves. The commercial risk is real: segmentation is a well-defined machine learning problem with abundant published training data, and open models are approaching adequacy for common structures. That puts real pricing pressure on.
CAGR 14.7%

Adaptive Replanning Software

Adaptive replanning grows at 13.2% by adapting the plan to today's anatomy rather than to a scan acquired weeks earlier, which matters most where tumours shrink or organs move substantially during a course. The engineering requirement is severe: recontouring, dose recalculation and clinical reapproval have to complete inside roughly eight minutes while the patient remains positioned on the couch. That is a computational and workflow problem as much as a clinical one, and it is where the serious vendors are now competing rather than on planning algorithm quality. Adoption depends on the department having both the imaging capability and the staffing model to review a plan under time pressure, which many do not yet have.
CAGR 13.2%
Full segment breakdown across 6 segments available in the complete report.

Regional Architecture and Country Demand Map

Demand follows software pricing and attach rates rather than installed accelerator count, since a department in a high-cost health system spends several times more on software per machine than one adding capacity from a low base. Installed machine count predicts volume rather than value as well as well.

North America

North America holds 31% of spend, the largest regional share, growing at 9.5%. The reason is pricing and attach rate rather than machine count, which is worth stating plainly: departments here license planning, information, contouring and quality assurance software comprehensively and pay several times what a comparable department pays elsewhere. Clinician time scarcity is acute, which makes automation arguments unusually persuasive. Bundled radiation oncology payment models are compressing department budgets and pushing hypofractionation, which reduces billable fractions while raising the value of software that supports stereotactic delivery. Clinician scarcity here makes every automation argument land more easily than elsewhere as well as well as well as well as well as well as well as well.
Share: 31% | CAGR: 9.5% (2026 to 2036)

East Asia

East Asia accounts for 25% of spend and grows at 10.8%. Chinese accelerator installations are the largest addition anywhere and each new department requires a full software stack rather than a replacement, which makes regional growth genuinely additive. Domestic vendors have entered planning and information systems seriously and compete hard on price. Japanese departments are technically sophisticated with high software attach rates and conservative migration behaviour. Korean and Taiwanese centres adopt adaptive and automated workflows readily. Software spend per machine remains well below North American levels despite the installed base being larger. Software spend per machine stays well below North American levels as well as well as well as well as well as well as.
Share: 25% | CAGR: 10.8% (2026 to 2036)
Regional intelligence for 5 additional markets available in the complete report: Western Europe, South Asia and Pacific, Latin America, Middle East and Africa, Eastern Europe. Contact sales@marketmindsadvisory.com.
radiation-therapy-software-market-country-cagr-analysis-1787309250482

Selling Clinician Hours Not Licences

Departments buy accelerators on beam quality and then run below capacity because nobody can contour fast enough. Four positions matter, and the first is about getting a department to measure something it has never measured rather than about any software feature. Two concern measurement and two concern where the defensible engineering actually sits as well as well.

Measure Consultant Contouring Hours Before Quoting Licences

Manual outlining consumes around two and a half hours of consultant time per complex plan, and departments treat that as unavoidable clinical work rather than a measurable constraint on throughput. Vendors that audit contouring hours and plan approval queues convert a licence price comparison into a capacity argument. Automated segmentation removing roughly 89% of that effort then justifies itself against consultant cost rather than against a competing software quotation, which is an entirely different conversation. Consultant cost is a number finance already understands as well as well as well as well as well as well as.
Market Impact: Contouring consuming 2.4 clinician
Target New Departments Before a Legacy Platform Exists

Planning system replacement happens roughly every nine years because migration means revalidating every protocol and retraining every planner, which freezes incumbents in place for a decade at a time. New departments in India, China and Southeast Asia have no legacy platform, buy a complete stack at commissioning and adopt automated contouring as standard rather than as an addition. India compounds at 12.3%, and those installations are contestable in a way established departments simply are not. Established departments are effectively closed for another decade as well as well as well as well as well as well as.
Market Impact: Replacement cycles running 9 years

Move Up Into Adaptive Before Contouring Commoditises

Segmentation is a well-defined machine learning problem with abundant published training data, and openly available models are approaching adequacy for the commoner organs at risk. Adaptive replanning is a different proposition, requiring recontouring, dose recalculation and clinical reapproval inside roughly eight minutes with the patient on the couch. That is a systems engineering problem rather than a model accuracy one, and it defends pricing that pure contouring will not for much longer. Adaptive replanning grows at 13.2% and requires engineering rather than model accuracy as well as well as well as well as well as well.
Market Impact: Replanning completed inside the 8 m

Compete on Clearance and Audit Trail Not Accuracy

Contour accuracy claims converge and become impossible for a department to adjudicate, while regulatory clearance, version control, model provenance and audit trail are verifiable and increasingly demanded by clinical governance. Vendors competing on documented validation rather than on benchmark performance reach the people who actually sign off deployment. That distinction matters most as open models approach adequacy, since it is the ground on which a commercial product still wins. Around 89% of contouring effort disappears either way, and the vendor that documented its validation keeps the contract as well as well as well as well as.
Market Impact: Defending against the 89% savings n

Who Controls the Margin Pool

Five vendors hold 76% measured on radiotherapy software revenue, the basis applied throughout this section. Concentration is high because the two largest accelerator manufacturers also supply the dominant planning and information systems, and departments buying hardware frequently take the software alongside it. Siemens Healthineers and Elekta lead, and the challenger group competes largely on vendor neutrality and specialist capability.
Competition operates on three dimensions. Automation depth in contouring and planning decides whether a vendor addresses the clinician time constraint that limits every department. Adaptive replanning capability decides participation in the frontier application. And vendor neutrality decides access to departments unwilling to tie their planning to a single accelerator supplier, which is a growing but still minority position at 18%. Algorithm quality decides very little of it as well as well as.

Two pressures are reshaping the field. Open segmentation models are converging on clinical adequacy for common structures, which threatens the fastest-growing category. Meanwhile Asian capacity growth adds contestable installations with no legacy platform. Rankings will shift toward vendors holding adaptive engineering depth alongside credible independence from hardware. Independence from hardware is the other half of that answer.
radiation-therapy-software-market-company-positioning-matrix-1787309251007

Competitive Moat and Risk Dimensions

SIEMENS HEALTHINEERS

Moat: Accelerator and planning integration

Siemens Healthineers supplies both the accelerator and the dominant planning and oncology information systems, so a department buying hardware routinely takes the software alongside it and inherits a decade of migration cost if it later wants to change. That bundled position does not depend on software quality at all.
SIEMENS HEALTHINEERS

Risk: Vendor neutrality demand growth

Departments increasingly resist tying planning capability to one accelerator supplier, particularly where they operate mixed fleets or expect to. Vendor-neutral planning holds 18% of installations and rises fastest in new departments with no legacy commitment, and every one of those installations is a bundled sale that did not happen.
ELEKTA

Moat: Adaptive and brachytherapy depth

Elekta built genuine depth in adaptive radiotherapy and in brachytherapy planning, both of which require engineering the larger competitors have addressed less thoroughly. Adaptive replanning inside an eight minute couch window is a systems problem rather than an algorithm problem, and accumulated experience in solving it is difficult for a newer entrant to replicate quickly.
ELEKTA

Risk: Contouring commoditisation exposure

Automated segmentation is the fastest-growing category and the most exposed to open models reaching clinical adequacy for common organs at risk. A vendor whose growth depends substantially on contouring licensing faces pricing pressure that adaptive capability only partly offsets, since adaptive adoption requires staffing models many departments do not have.

Players Tracked

Prominent Players

Siemens Healthineers
Elekta
RaySearch Laboratories
Brainlab
MIM Software

Other Key Players

Philips
Accuray
Mirion Technologies
Standard Imaging
ScandiDos
Radformation
Limbus AI
Mirada Medical
Therapanacea
Oncospace
Siris Medical
LAP Laser
Manteia Medical
Shanghai United Imaging Healthcare
Vision RT

Recent Developments

FEBRUARY 2025

Open segmentation models reach clinical adequacy for common structures

Publicly available auto-contouring models demonstrated performance approaching commercial products for frequently delineated organs at risk, prompting departments to question licensing costs for basic segmentation. This reflects research publication and open model release rather than commercial developments among software vendors. Licensing conversations became considerably harder for basic segmentation as.
Signal: Open models reaching adequacy for the comm
JUNE 2025

Adaptive replanning workflows enter routine use beyond academic centres

Radiotherapy departments outside academic settings introduced daily adaptive replanning for selected tumour sites, supported by software able to complete recontouring and dose recalculation within the treatment slot. This reflects clinical practice adoption rather than any transaction among the vendors involved. Staffing rather than software became the limiting factor.
Signal: Adaptive moving out of academic centres tu
OCTOBER 2025

Clinical governance bodies formalise model provenance requirements

Radiotherapy governance frameworks introduced explicit requirements for version control, training data provenance and audit trail on any automated contouring used clinically. These were governance and quality assurance decisions rather than regulatory approvals or corporate developments among suppliers. Departments now ask for documentation open models rarely carry as well.
Signal: Provenance requirements plainly favour doc

Engineering, Clearance and Clinical Validation

Software engineering and clinical physics personnel account for roughly 48% of cost of goods, since this is a development business rather than a manufacturing one and the staff involved combine software capability with radiotherapy domain knowledge. Regulatory clearance, quality management and clinical validation add about 19%. Cloud compute for model training and inference is a growing element that behaves quite differently from either.
Specialist clinical physics and machine learning engineering salaries rose sharply through 2021 and 2023 as demand for both skill sets outstripped supply across the whole medical software sector. Company annual reports across the oncology software vendors disclose the resulting development cost pressure and release timeline effects. World Health Organization reporting on radiotherapy capacity documents the global shortage of trained radiotherapy professionals that underlies the same constraint clinically.

Exposure divides by product architecture rather than by scale. Vendors bundling software with accelerator hardware absorb development cost across a much larger revenue base. Independent software vendors carry the full clearance and validation burden against software revenue alone, which is a considerably harder position. Contouring vendors additionally carry cloud inference cost that scales with usage rather than with licences sold.
radiation-therapy-software-market-cost-volatility-analysis-1787309251204

Recover cloud inference cost through usage-based licensing

Contouring inference cost scales with the number of plans processed while a perpetual or annual licence does not, which puts the vendor on the wrong side of its own success. Usage-based or tiered licensing aligns revenue with the compute actually consumed, and departments accept it more readily than vendors expect once the structure is explained honestly.

Share clinical validation evidence across product modules

Clearance and clinical validation are the largest fixed costs an independent vendor carries, and much of the underlying evidence on segmentation accuracy and dose calculation applies across several modules. Designing validation programmes to serve multiple clearances rather than one avoids repeating work that regulators would accept once. Repeating accepted work is pure waste as well as well.

Recruit clinical physics capability rather than train software staff

Radiotherapy domain knowledge takes years to acquire and software engineering can be hired, which means the binding recruitment constraint is clinical physics rather than development capacity. Building the team around physics hires and adding software capability to them is slower initially and produces products that clinicians will actually accept into a validated workflow. Clinicians notice the difference.

Portfolio Architecture for Margin Defence

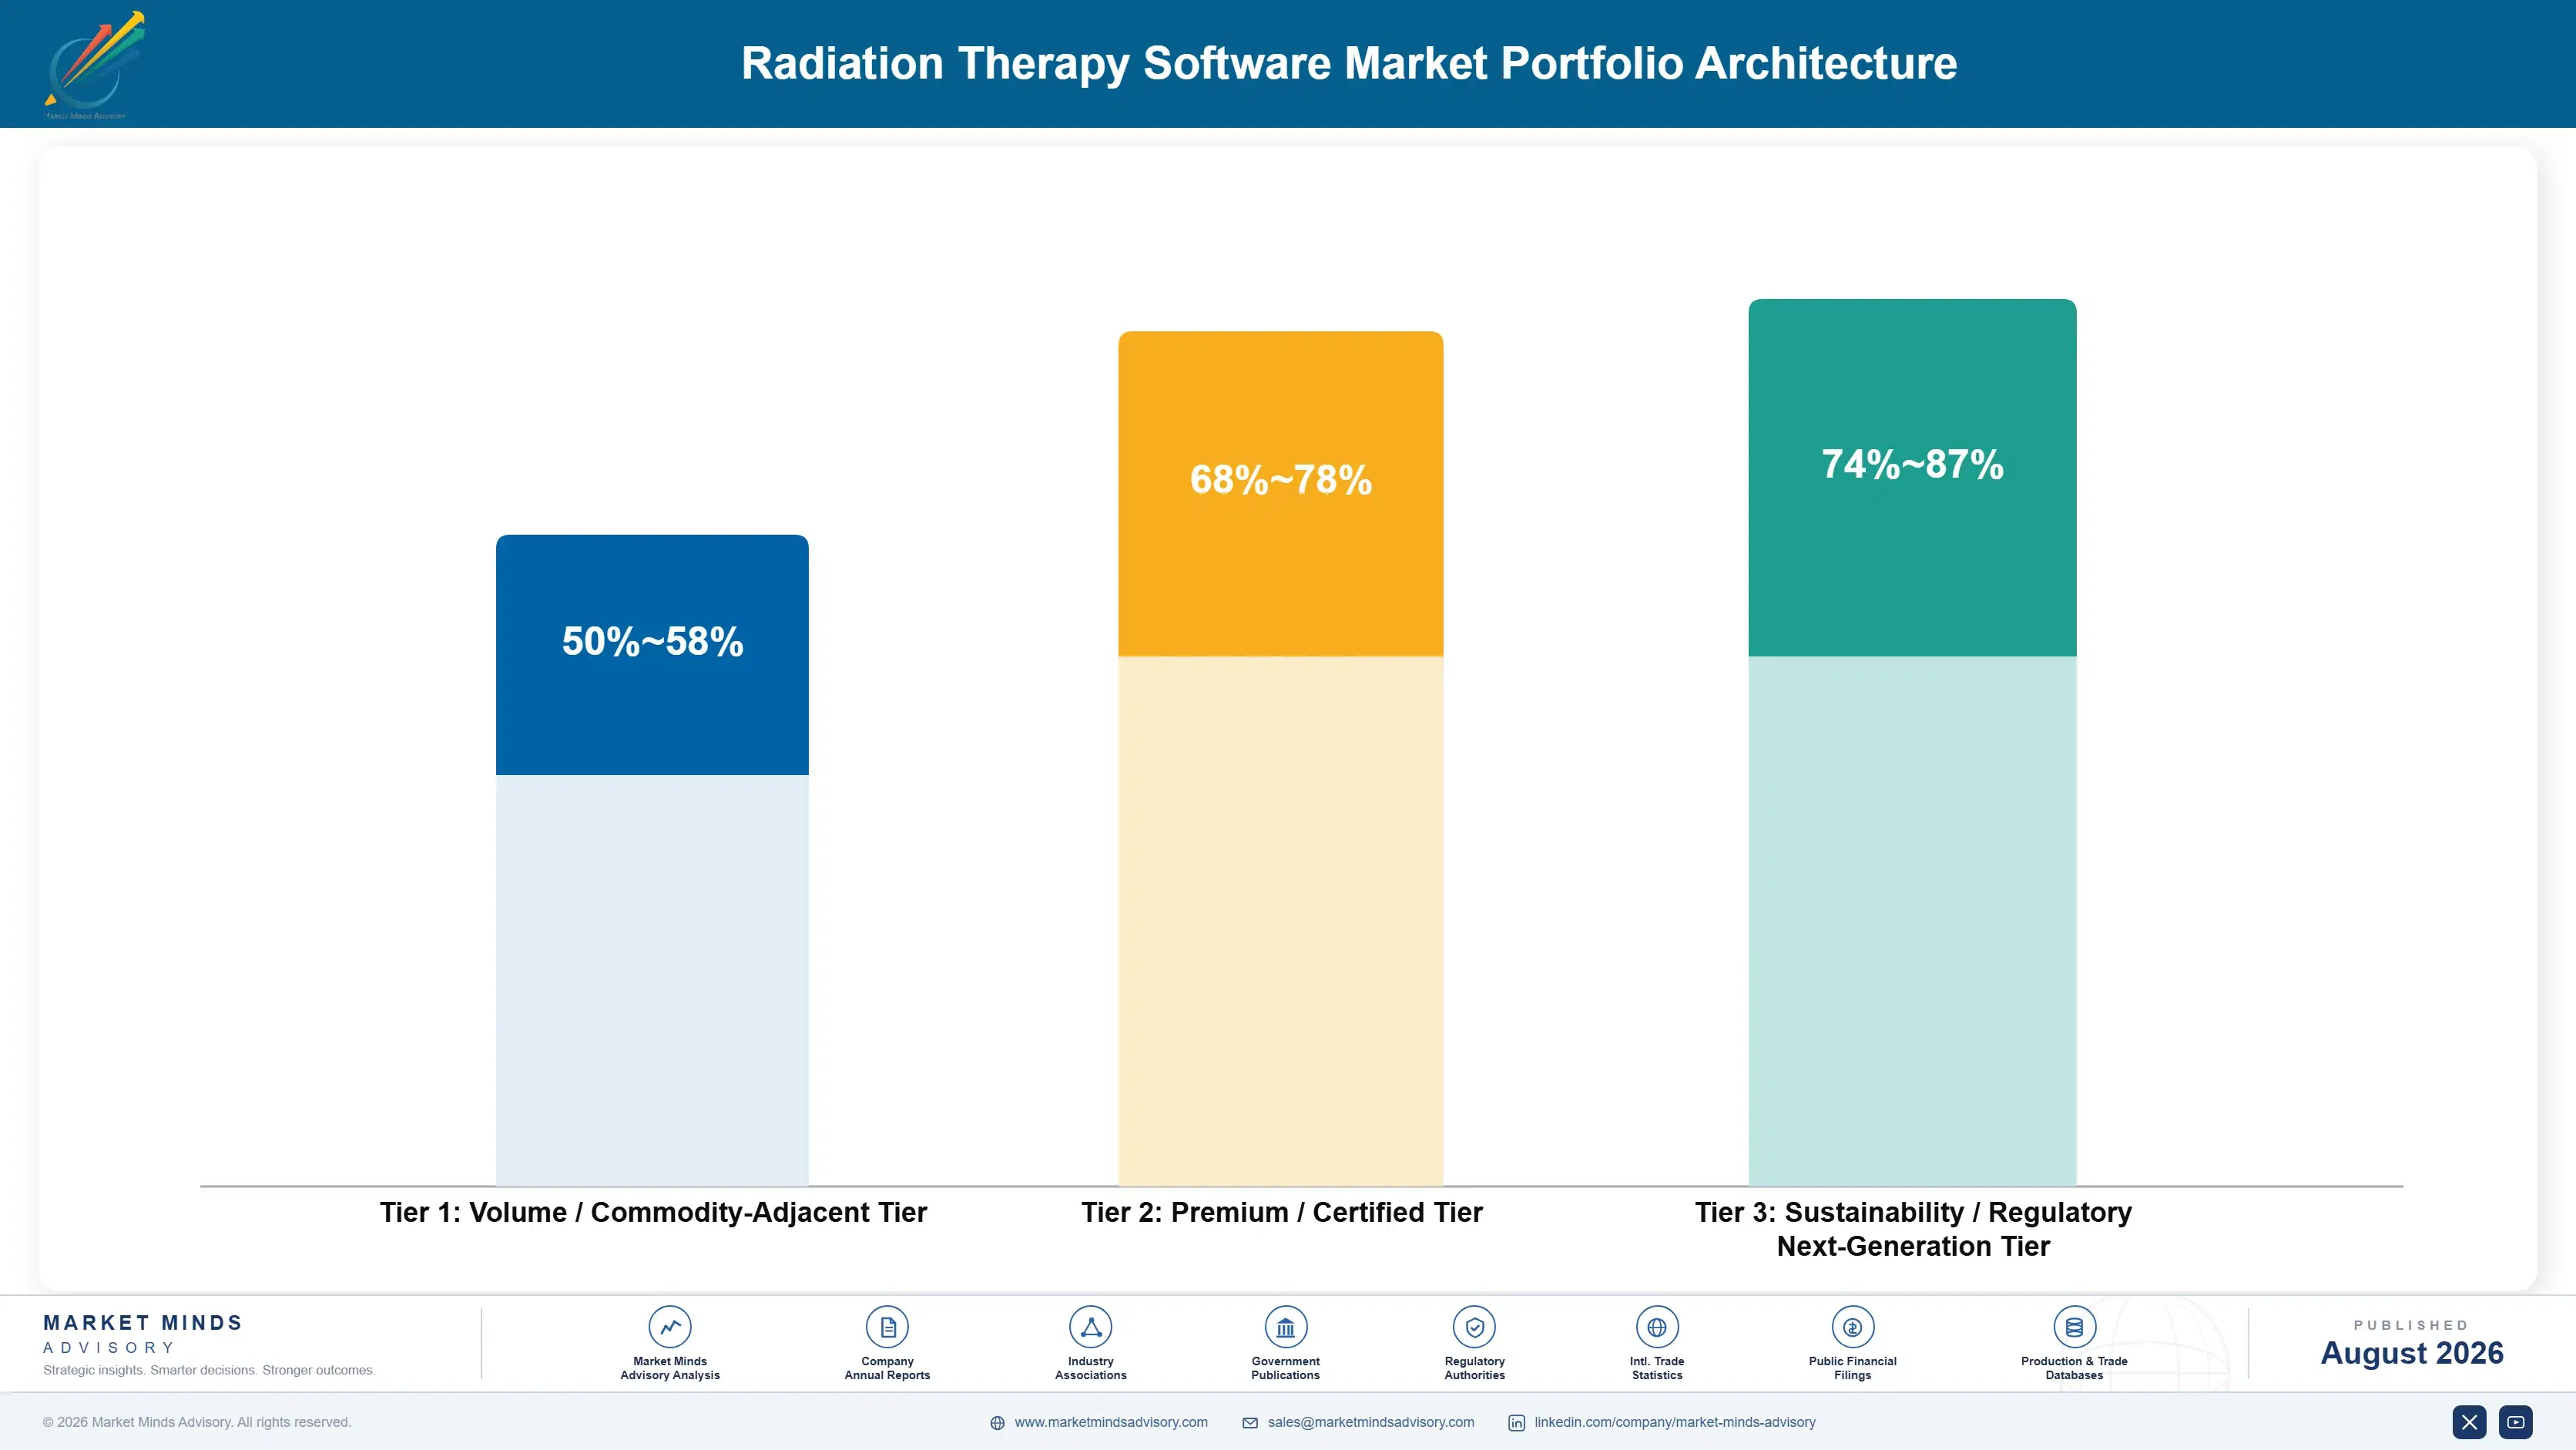
The portfolio separates on which department function the software serves and how defensible each is. Planning systems are the established core, bought once a decade and heavily bundled with hardware. Information and workflow systems are equally sticky and less differentiated. Contouring automation is the growth category and the most exposed to commoditisation. Adaptive replanning and quality assurance software sit on genuine engineering barriers. Quality assurance software sits on its own physic
The tension is between the sticky and the growing. Planning and information systems generate durable revenue on nine year cycles with almost no growth, while contouring grows at 14.7% and faces open models converging on adequacy. Adaptive replanning has both growth and defensibility, and it requires departments to have staffing models for reviewing plans under time pressure that many simply do not possess yet.

High-value pools concentrate where engineering difficulty is real. Adaptive replanning inside a treatment slot, quality assurance and dosimetry verification, and contouring integrated into a validated planning workflow all qualify, and none of them competes on segmentation accuracy alone. What they share is a barrier that model accuracy alone cannot overcome.

Volume / Commodity-Adjacent Tier

Oncology information and workflow systems, and basic planning modules bundled alongside accelerator purchases. Extremely sticky across nine year replacement cycles, minimally differentiated between vendors, and increasingly a hardware sale rather than a software one.
Gross Margin: 56-68%

Premium / Certified Tier

Full treatment planning systems including vendor-neutral platforms, plus quality assurance and dosimetry verification software. Clinical validation depth and independence from the accelerator supplier qualify the vendor rather than any interface advantage.
Gross Margin: 68-80%

Sustainability / Regulatory / Next-Generation Tier

AI auto-contouring, adaptive replanning and dose accumulation analytics. The wide margin range separates adaptive engineering with genuine barriers from contouring products facing open models converging on clinical adequacy. Adaptive engineering is the defensible half of that tier as.
Gross Margin: 52-88%
radiation-therapy-software-market-portfolio-architecture-1787309251712

High-value Sub-segments and Strategic Watch-out

AI Auto-Contouring and Segmentation

Compounding at 14.7% on removing roughly 89% of consultant outlining effort, which is the clearest productivity gain radiotherapy has had in twenty years. Open models approaching adequacy for common structures threaten pricing on the fastest-growing category. Licence price comparison is the wrong frame entirely for this category as.
Gross Margin: 58-88%

Adaptive Replanning Software

Growing at 13.2% and defended by a genuine engineering barrier, since recontouring, recalculation and reapproval must complete inside roughly eight minutes with the patient on the couch. Departments need staffing models many do not yet have. Imaging capability is the other precondition departments frequently lack as well as.
Gross Margin: 64-84%

Treatment Planning and Information Systems

The durable core at 6.9%, replaced roughly every nine years because migration means revalidating every protocol and retraining every planner. Extremely sticky, minimally growing, and increasingly sold as part of an accelerator purchase. It is increasingly sold as part of an accelerator purchase rather than separately as well.
Gross Margin: 60-76%

Dose Accumulation and Outcome Analytics

The strategic watch-out. Linking delivered dose to long-term outcome is clinically compelling and requires data infrastructure most departments lack, so adoption depends on informatics maturity rather than on any clinical argument. Informatics maturity rather than clinical argument governs adoption here as well as well as well as well.
Gross Margin: 48-78%

Bought Once a Decade, Extended Yearly

Revenue arrives in two quite different shapes. The planning and information system is a decade decision with heavy implementation revenue at the front and maintenance afterwards, and it locks the department in for years. Contouring, adaptive and analytics modules are annual or usage-based additions to that platform, which means the incumbent captures most of the growth without contesting anything. Winning the platform is what matters commercially. Platform capture decides everything.
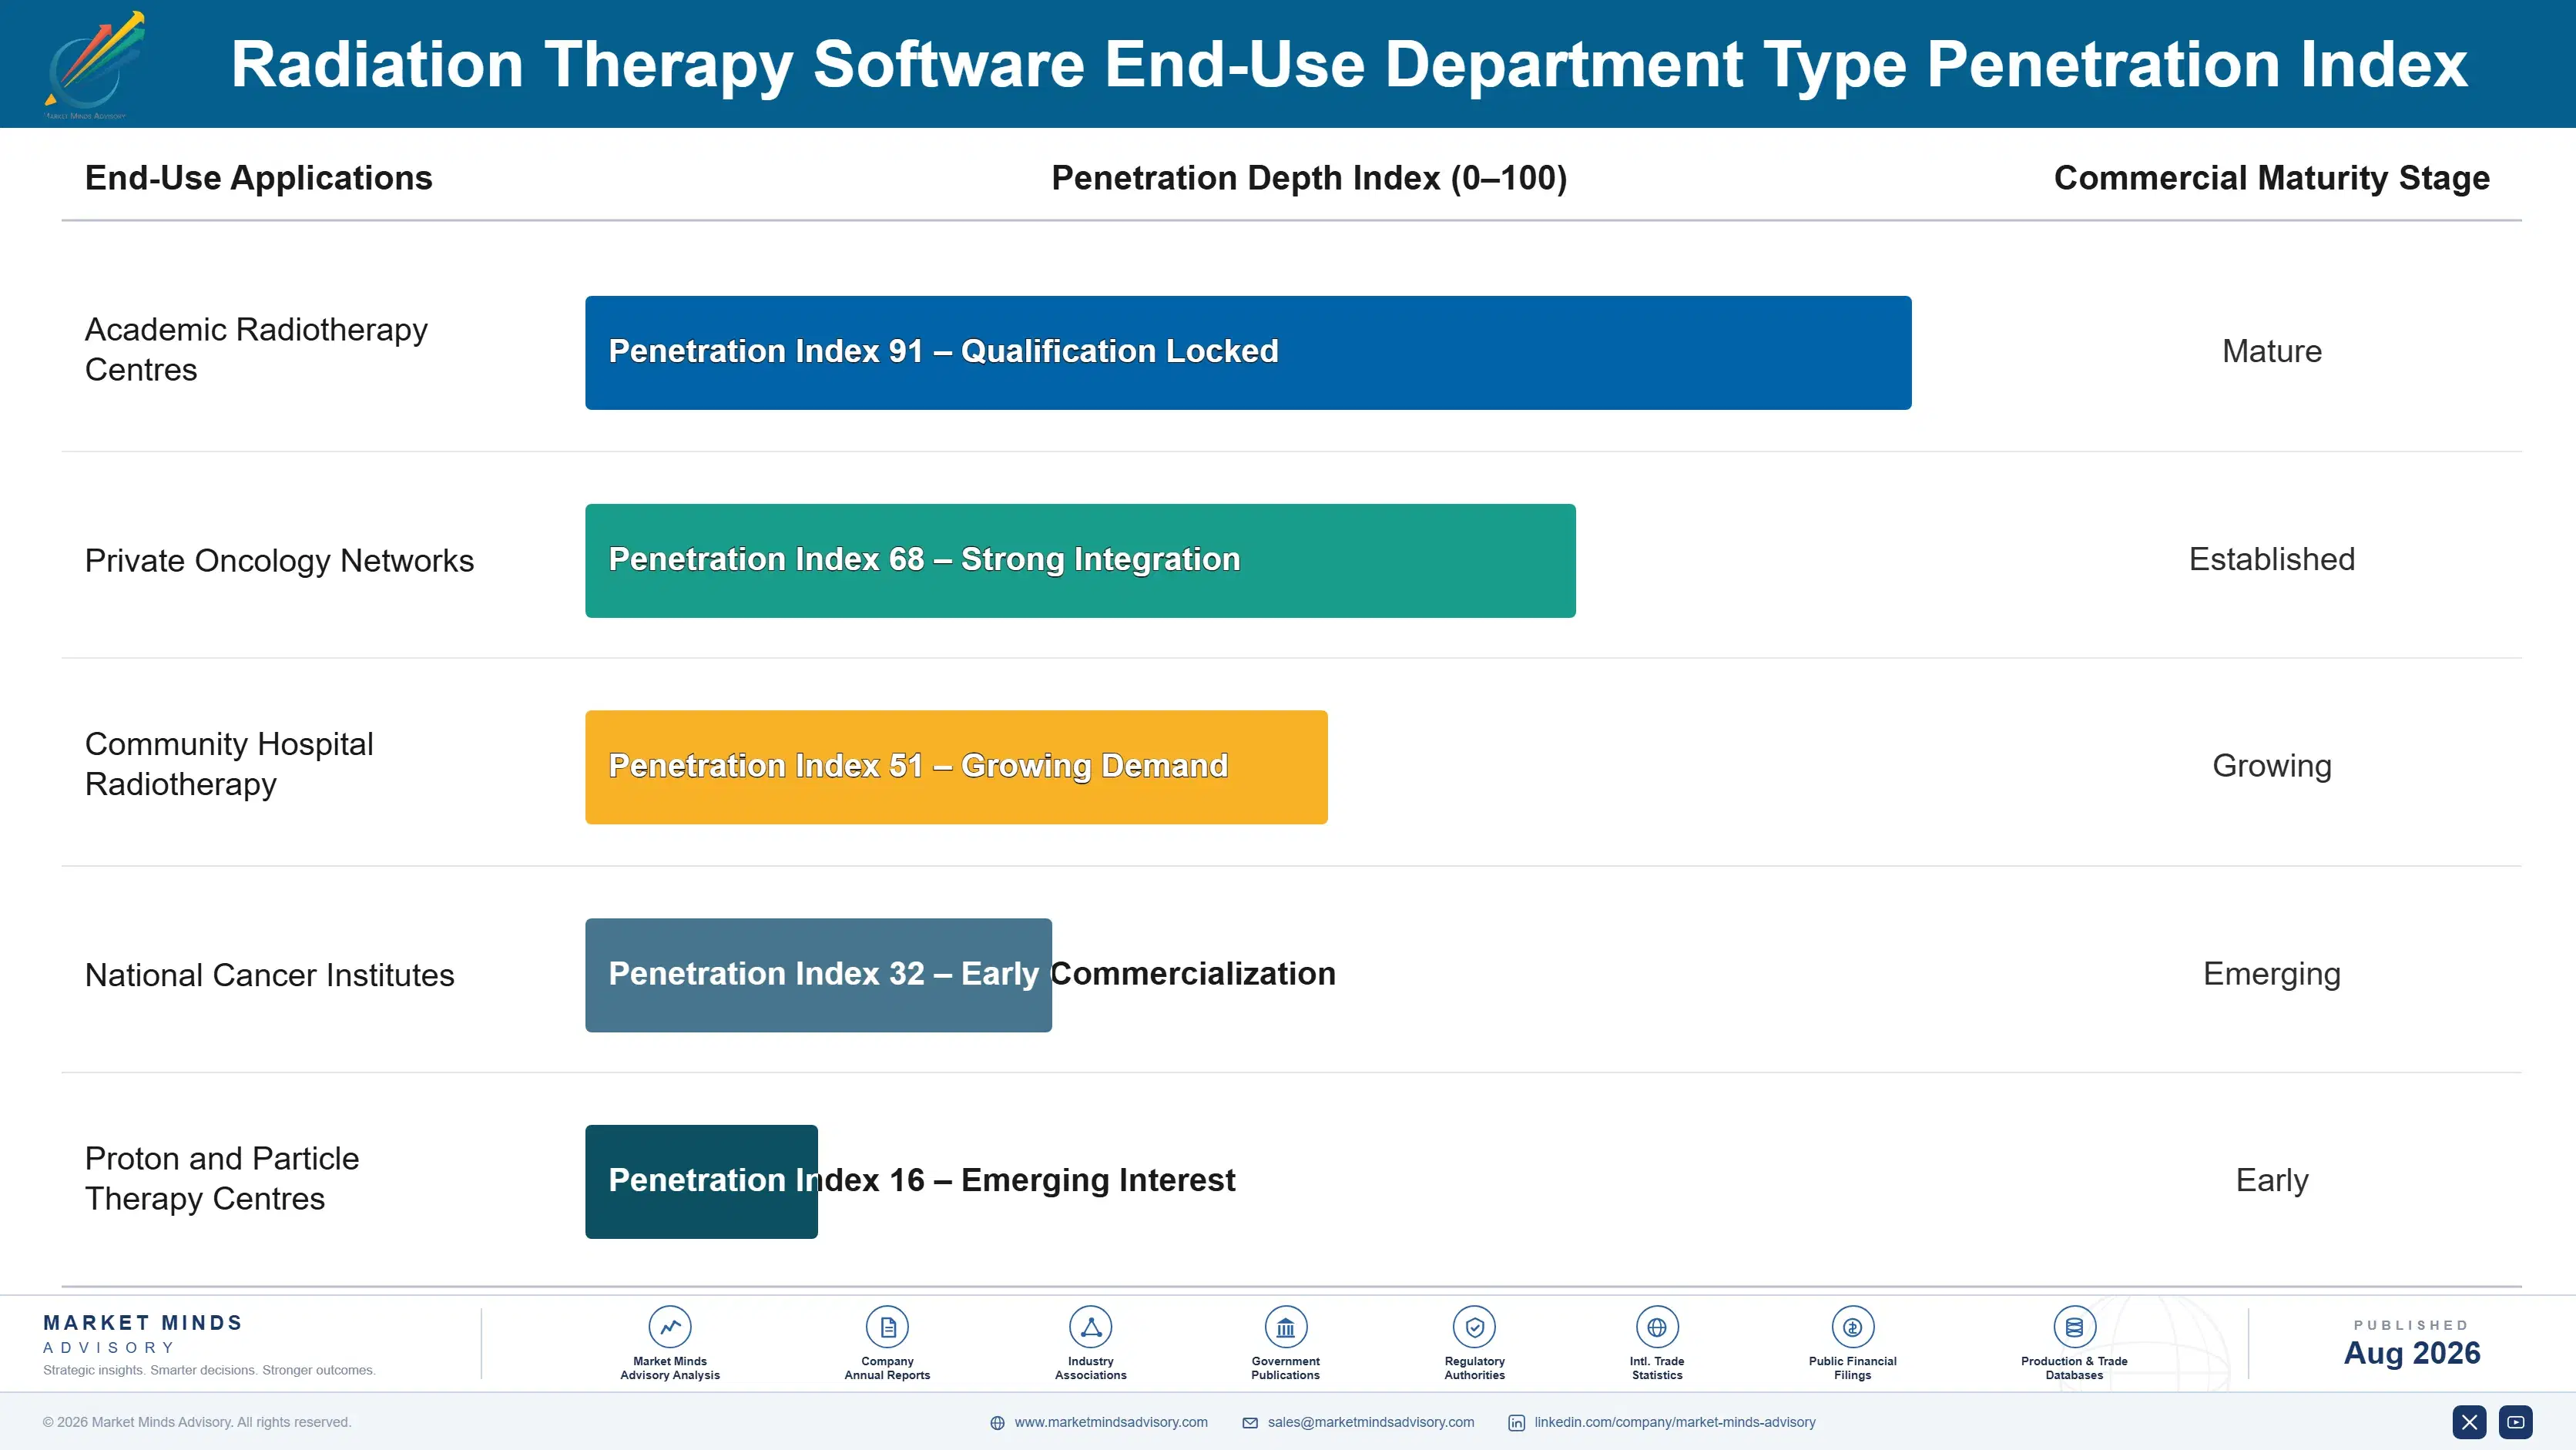
Depth varies by department sophistication and staffing. Academic centres with physics establishments buy the whole stack including adaptive and analytics. Large district departments buy planning, information and contouring and defer the rest. Small departments buy planning and quality assurance only. New departments in growth markets buy a full stack at commissioning, which makes them the most valuable single opportunity in the market.

The deciding parties differ by module, which shapes commercial approach entirely. Planning platform decisions involve clinical directors, lead physicists and procurement together over many months. Contouring automation is championed by radiation oncologists who feel the time cost directly. Quality assurance software is a physicist decision. Analytics requires informatics capability that frequently nobody in the department owns.
radiation-therapy-software-market-end-use-penetration-index-1787309252204

Where Software Vendors Win

These are among the four positions where our research anticipates prominent divergence between winners and laggards over the coming forecast period. Each is grounded in the demand model, the regulatory perimeter, and the announced capacity pipeline.
01 / CONTOURING HOUR MEASUREMENT

The expensive accelerator sits idle waiting for a consultant

Manual outlining consumes around two and a half hours of consultant time per complex plan, and departments treat that as unavoidable clinical work rather than a measurable throughput constraint. Vendors auditing contouring hours and plan approval queues convert a licence comparison into a capacity argument. Automated segmentation removing roughly 89% of that effort then justifies itself against consultant cost rather than against a rival quotation, which is a materially easier sale to make, and finance already understands consultant cost perfectly well as well as well.
02 / GREENFIELD DEPARTMENT TARGETING

Nine years of migration cost freezes every established buyer

Planning system replacement happens roughly every nine years because migration means revalidating every protocol and retraining every planner, which holds incumbents in place for a decade at a time. New departments across India, China and Southeast Asia carry no legacy platform, buy a complete stack at commissioning and adopt automation as standard practice. India compounds at 12.3%, and those installations are genuinely contestable in a way established departments are not, and the greenfield installation is worth several module additions as well as well as well.
03 / ADAPTIVE ENGINEERING INVESTMENT

Eight minutes on the couch is a systems problem

Segmentation is a well-defined machine learning problem with abundant published training data, and open models are approaching adequacy for the commoner organs at risk. Adaptive replanning requires recontouring, dose recalculation and clinical reapproval to complete inside roughly eight minutes while the patient stays positioned. That is systems engineering rather than model accuracy, and it defends pricing that pure contouring licensing will not sustain much longer, and no open model addresses the workflow problem at all as well as well as well as well as well.
04 / GOVERNANCE DOCUMENTATION DEPTH

Provenance is verifiable and accuracy claims are not

Contour accuracy claims converge and become impossible for a department to adjudicate independently, while regulatory clearance, version control, training data provenance and audit trail are all verifiable and increasingly required by clinical governance. Vendors competing on documented validation reach the people who actually authorise deployment. That ground matters most precisely as open models approach adequacy, since it is where a commercial product still holds an advantage, and that ground holds even as accuracy claims converge completely as well as well as well as well as.

Engagement Snapshot From the Field

A live engagement with an industry participant carrying material or product regulatory and market exposure ahead of a defining policy shift, showing how our research translates into a defensible multi-year portfolio strategy.
MARKET MINDS ADVISORY · CLIENT ENGAGEMENT SUMMARY
Radiation Therapy Software Producer Strategic Portfolio Review and Transition Roadmap 2026·Investment Scenario on Radiation Therapy Software Exposure Evaluation 2025-26
CLIENT PROFILE
A four-site radiotherapy network operating fourteen linear accelerators and treating roughly 6,800 new patients annually, with about USD 210 million in oncology service revenue (client-reported, unverified by MMA). Accelerator utilisation sat at 71% against a capacity plan assuming 88%, and a business case for two additional accelerators was in preparation. Pathway timing had never been measured across the network as well as well.
STRATEGIC CHALLENGE
Waiting times from referral to first fraction had lengthened for three consecutive years despite no growth in referral volume, and the assumed cause was insufficient treatment capacity. Nobody had measured where the delay actually accumulated between referral, planning, plan approval and first treatment across the four sites. The capacity assumption had never been tested against the pathway.
MMA APPROACH
MMA timed each step of the pathway for 420 consecutive patients across all four sites, separating imaging, contouring, planning, physics checking and clinical approval intervals. Consultant time spent on manual contouring was recorded separately by tumour site and plan complexity. Accelerator waiting time was isolated from planning delay throughout as well as well as well as well as.
KEY FINDINGS
  1. Median referral to first fraction interval was 26 days, of which contouring and clinical plan approval accounted for 14 days while accelerator waiting accounted for only three.
  2. Consultant contouring consumed roughly 2.6 hours per complex head and neck plan and 1.1 hours per prostate plan, totalling more than four consultant sessions weekly across the network.
  3. Accelerator utilisation of 71% was a consequence of the planning bottleneck rather than a capacity shortfall, which invalidated the entire premise of the business case being prepared.
  4. No site used automated contouring, and two had trialled it two years earlier and abandoned the trial over integration difficulties nobody had subsequently revisited.
CLIENT PROFILE
A four-site radiotherapy network operating fourteen linear accelerators and treating roughly 6,800 new patients annually, with about USD 210 million in oncology service revenue (client-reported, unverified by MMA). Accelerator utilisation sat at 71% against a capacity plan assuming 88%, and a business case for two additional accelerators was in preparation. Pathway timing had never been measured across the network as well as well.
STRATEGIC CHALLENGE
Waiting times from referral to first fraction had lengthened for three consecutive years despite no growth in referral volume, and the assumed cause was insufficient treatment capacity. Nobody had measured where the delay actually accumulated between referral, planning, plan approval and first treatment across the four sites. The capacity assumption had never been tested against the pathway.
MMA APPROACH
MMA timed each step of the pathway for 420 consecutive patients across all four sites, separating imaging, contouring, planning, physics checking and clinical approval intervals. Consultant time spent on manual contouring was recorded separately by tumour site and plan complexity. Accelerator waiting time was isolated from planning delay throughout as well as well as well as well as.
KEY FINDINGS
  1. Median referral to first fraction interval was 26 days, of which contouring and clinical plan approval accounted for 14 days while accelerator waiting accounted for only three.
  2. Consultant contouring consumed roughly 2.6 hours per complex head and neck plan and 1.1 hours per prostate plan, totalling more than four consultant sessions weekly across the network.
  3. Accelerator utilisation of 71% was a consequence of the planning bottleneck rather than a capacity shortfall, which invalidated the entire premise of the business case being prepared.
  4. No site used automated contouring, and two had trialled it two years earlier and abandoned the trial over integration difficulties nobody had subsequently revisited.
RECOMMENDED STRATEGY
Phase 1: Phase 1 (months 1 to 5): Deploy automated contouring integrated into the existing planning workflow at the highest-volume site and measure consultant hours released. Phase 2: Phase 2 (months 5 to 13): Extend automated contouring across all four sites and redeploy released consultant time into plan approval. Phase 3: Phase 3 (months 13 to 22): Reassess accelerator capacity requirements after the planning bottleneck has cleared and revisit the business case.
OUTCOME
Median referral to first fraction interval fell to 15 days within nine months of deploying automated contouring across the network (client-reported, unverified by MMA). Accelerator utilisation rose to 86% with no additional machines, and the two-accelerator business case was withdrawn (client-reported, unverified by MMA). Consultant contouring hours are now reported monthly as a capacity measure alongside accelerator utilisation.

Frequently Asked Questions

Foundational context covering the market sizes, CAGR, scope, country, region and competition that inform every finding below. This section is provided to cover basics and most often pre-purchase conversations, answered from the MMA Primary Research Dataset.

What is the current size of the Radiation Therapy Software Market?

The global market was worth USD 1.35 billion in 2025, reaching USD 1.48 billion in 2026. North America holds the largest regional share at 31% of spend.

How large will the Radiation Therapy Software Market be by 2036?

MMA forecasts USD 3.78 billion by 2036, an expansion multiple of 2.55 times the 2026 base. That represents roughly USD 2.3 billion of incremental value.

What is the CAGR for the Radiation Therapy Software Market 2026 to 2036?

The base case compounds at 9.8% annually, with a bull case of 11.1% and a bear case of 8.5%. Historical growth from 2020 to 2025 ran at 8.4%.

Which segment is growing fastest?

AI auto-contouring and segmentation compounds at 14.7%, exactly 1.50 times the market rate. It removes roughly 89% of the consultant effort spent outlining organs at risk.

Who are the major companies in the Radiation Therapy Software Market?

Siemens Healthineers, Elekta, RaySearch Laboratories, Brainlab and MIM Software hold a combined 76% of the market. Accelerator bundling and nine year replacement cycles sustain that concentration.

Which country is growing fastest?

India compounds at 12.3%, ahead of every other national market. New departments buy a complete software stack at commissioning with no legacy platform to migrate from.

Report Segmentation Architecture

The full report scope spans multiple orthogonal segmentation dimensions, with cross-tabulated demand data provided for each dimension pair. Coverage extends further to regional breakdowns, trend trajectories, and the competitive detail needed to support segment-level decision-making.

By Software Function

  • Treatment Planning Systems
  • Oncology Information and Workflow Systems
  • AI Auto-Contouring and Segmentation
  • Adaptive Replanning Software
  • Quality Assurance and Dosimetry Software
  • Dose Accumulation and Outcome Analytics

By End-Use Industry

  • Academic and Comprehensive Cancer Centres
  • Regional Hospital Radiotherapy Departments
  • Private Oncology Networks
  • Proton and Particle Therapy Centres
  • Brachytherapy and Specialist Services

By Commercial Dimension

  • Accelerator Bundled Software Supply
  • Vendor-Neutral Direct Licensing
  • Annual Subscription and Usage-Based Licensing
  • Public Tender and Framework Procurement

By Region

  • North America
  • Western Europe
  • East Asia
  • South Asia and Pacific
  • Latin America
  • Middle East and Africa
  • Eastern Europe

Scope, Methodology, and Coverage

Every figure in this report is reproducible from documented input assumptions. The scope below maps the historical period, the forecast horizon, the segmentation dimensions, and the countries covered, alongside the underlying primary and qualitative methodology.
Historical Period
2020 to 2025
Forecast Period
2026 to 2036
Base Year
2025 (USD billions; MMA Primary Research Dataset, August 2026)
Market Definition
The market covers software used to plan, deliver and verify external beam radiotherapy and brachytherapy, spanning treatment planning systems, oncology information and workflow systems, AI auto-contouring and segmentation, adaptive replanning software, quality assurance and dosimetry software, and dose accumulation and outcome analytics, together with the implementation, validation and support services supplied alongside them. Linear accelerators and treatment delivery hardware, imaging equipment and picture archiving and communication systems, general hospital electronic health records, radiology reporting software, and physical dosimetry instrumentation are excluded. Sizing is measured at vendor revenue in current prices.
Quantitative Units
USD billions (current prices); licensed installations, plans processed and clinician hours where applicable
Segmentation Dimensions
By Software Function; By End-Use Industry; By Commercial Dimension; By Region
Regions Covered
North America, Western Europe, East Asia, South Asia and Pacific, Latin America, Middle East and Africa, Eastern Europe
Countries Covered
USA, China, Japan, Germany, India, France, UK, Italy, Spain, South Korea, Canada, Netherlands, Sweden, Denmark, Switzerland, Australia, Taiwan, Thailand, Indonesia, Brazil, Mexico, Argentina, Colombia, Turkey, Saudi Arabia, UAE, South Africa, Egypt, Poland, Czech Republic, and additional markets relevant to this sector
Key Companies Profiled
Siemens Healthineers, Elekta, RaySearch Laboratories, Brainlab, MIM Software, Philips, Accuray, Mirion Technologies, Standard Imaging, ScandiDos, Radformation, Limbus AI, Mirada Medical, Therapanacea, Oncospace, Siris Medical, LAP Laser, Manteia Medical, Shanghai United Imaging Healthcare, Vision RT
Quantitative Methodology
Primary survey, n=3,800 respondents, Q4 2025, six countries; demand-side model with trade association cross-validation
Qualitative Methodology
47 expert interviews, Q4 2025; applied to validate demand model assumptions, identify emerging dynamics, and assess competitive positioning
Report Format
PDF and XLSX data workbook (Word format preview document)
Publisher
Market Minds Advisory
Report Code
MMA-2026-TEC-955
Published
August 2026
Contact
sales@marketmindsadvisory.com | www.marketmindsadvisory.com

Purchase the full Radiation Therapy Software Market Report (2026 to 2036).

The full report sizes radiation therapy software across six functional categories, three commercial dimensions and seven regions, with annual forecasts to 2036 under base, bull and bear scenarios. Consultant contouring hours and plan approval intervals are measured by tumour site, which is where department throughput is actually constrained rather than at the accelerator. Planning platform replacement cycles and migration costs are quantified by health system. Open segmentation model performance is benchmarked against commercial products by structure. Twenty vendors are profiled on a consistent radiotherapy software revenue basis.
Consultant contouring hours measured by tumour site and complexity
Planning platform replacement cycles quantified by health system
Open segmentation model performance benchmarked against commercial products
Adaptive replanning adoption tracked against department staffing models
Vendor neutrality penetration measured across new and established departments
Software attach rates compared against installed accelerator counts by region

Built For The People Who Decide

From boardroom strategy to bench-side execution, this report is read cover-to-cover by leaders shaping the next decade of their industry, turning demand scenarios, market dynamics and valuation benchmarks into decisions.
CXOs/ Presidents/ VPs/ Managers
M&A and Corporate Development
Strategy Teams and R&D Heads
Procurement and Product Directors
Regulatory and Compliance Leaders
Investor Relations and Equity Analysts