Market Minds Advisory
Research And Development (RD) Analytics Market

Research And Development (RD) Analytics Market: R&D Analytics: Integration Reality, Decision Frequency and Why Pharmaceutical Data Carries the Market

Most of what is sold as analytics turns out to be data engineering, and the applications that survive are those attached to a decision an organisation was already obliged to make.

Lead Analyst

Published

September 2026

Make Smarter Decisions with Customized Research Insights

Request a free sample report and evaluate market opportunities, growth trends, and competitive dynamics relevant to your business needs.

2025 MARKET VALUE$5.8BMarket Size 2025
2036 FORECAST VALUE$21.8BBase Case , 2026 to 2036
CAGR 2026 TO 203612.8 %Bull 14.0% / Bear 11.6%
INCREMENTAL OPPORTUNITY$15.3BNet 10- year value creation
EXPANSION MULTIPLE3.33x2036 value over 2026 base
Strategic Levers
M&A Pipeline
Regional Outlook
Country Rankings
Competitive Intelligence
Segmental Deep-dive
Call-Us : 91 93563 13602

Executive Snapshot and Market Trajectory.

Roughly 58% of effort in these programmes is spent connecting incompatible systems rather than analysing anything. Research data is fragmented by design across instruments, laboratories and external partners, and no analytical capability survives contact with that reality without an integration project first. Insight is sold and engineering is delivered.
What actually gets funded attaches to decisions organisations already have to make. Scientific and experimental data analytics grows at 19.2%, half again the market rate of 12.8%, because the experimental record is an asset rather than a report. Clinical outcome modelling follows at 16.4%. Pharmaceutical and biotechnology research accounts for 44% of spending, and North America takes 37% of value for that reason.
Concentration is low at roughly 29% across the top five on measured software and services revenue, spanning portfolio management vendors, scientific data platforms and clinical analytics firms that rarely compete. Around 34% of programmes end before reaching production, and the failures are integration failures far more often than they are analytical ones. Vendors sell insight and deliver data engineering, and the buyers who understood that before signing are the ones whose programmes actually reached production.
Market Definition
This market covers software and services that measure, model and support research and development decisions, spanning portfolio prioritisation and stage gate analytics, scientific and experimental data analytics, clinical and trial outcome modelling, research spend and resource analytics, intellectual property and landscape analytics, and external collaboration and partner analytics. Revenue is measured as software subscription and attributable services value. Laboratory instruments and hardware, contract research services, general enterprise business intelligence platforms and product lifecycle management sold without analytical capability are excluded.
Base Year Value
$5.8B in 2025 (MMA Primary Research Dataset, September 2026)
Forecast Period
2026 to 2036, eleven discrete annual values
CAGR
12.8% base case. Bull 14.0%. Bear 11.6%.
Fastest Growth Segment
Scientific and Experimental Data Analytics: 19.2% CAGR
Fastest Growth Country
China: 17.2% CAGR
Fastest Growth Region
South Asia and Pacific: 14.8% CAGR
Largest Region
North America: 37% of 2025 global value
Market Leaders
Dassault Systemes, Planview, Certara, Benchling and IQVIA lead on measured research and development analytics software and services revenue. Source: MMA Primary Research Dataset, July 2026.
Primary Survey
n=3,800 procurement and R&D decision-makers, Q4 2025, six countries
Methodology
Demand-side build-up, cross-validated against public data, 47 expert interviews

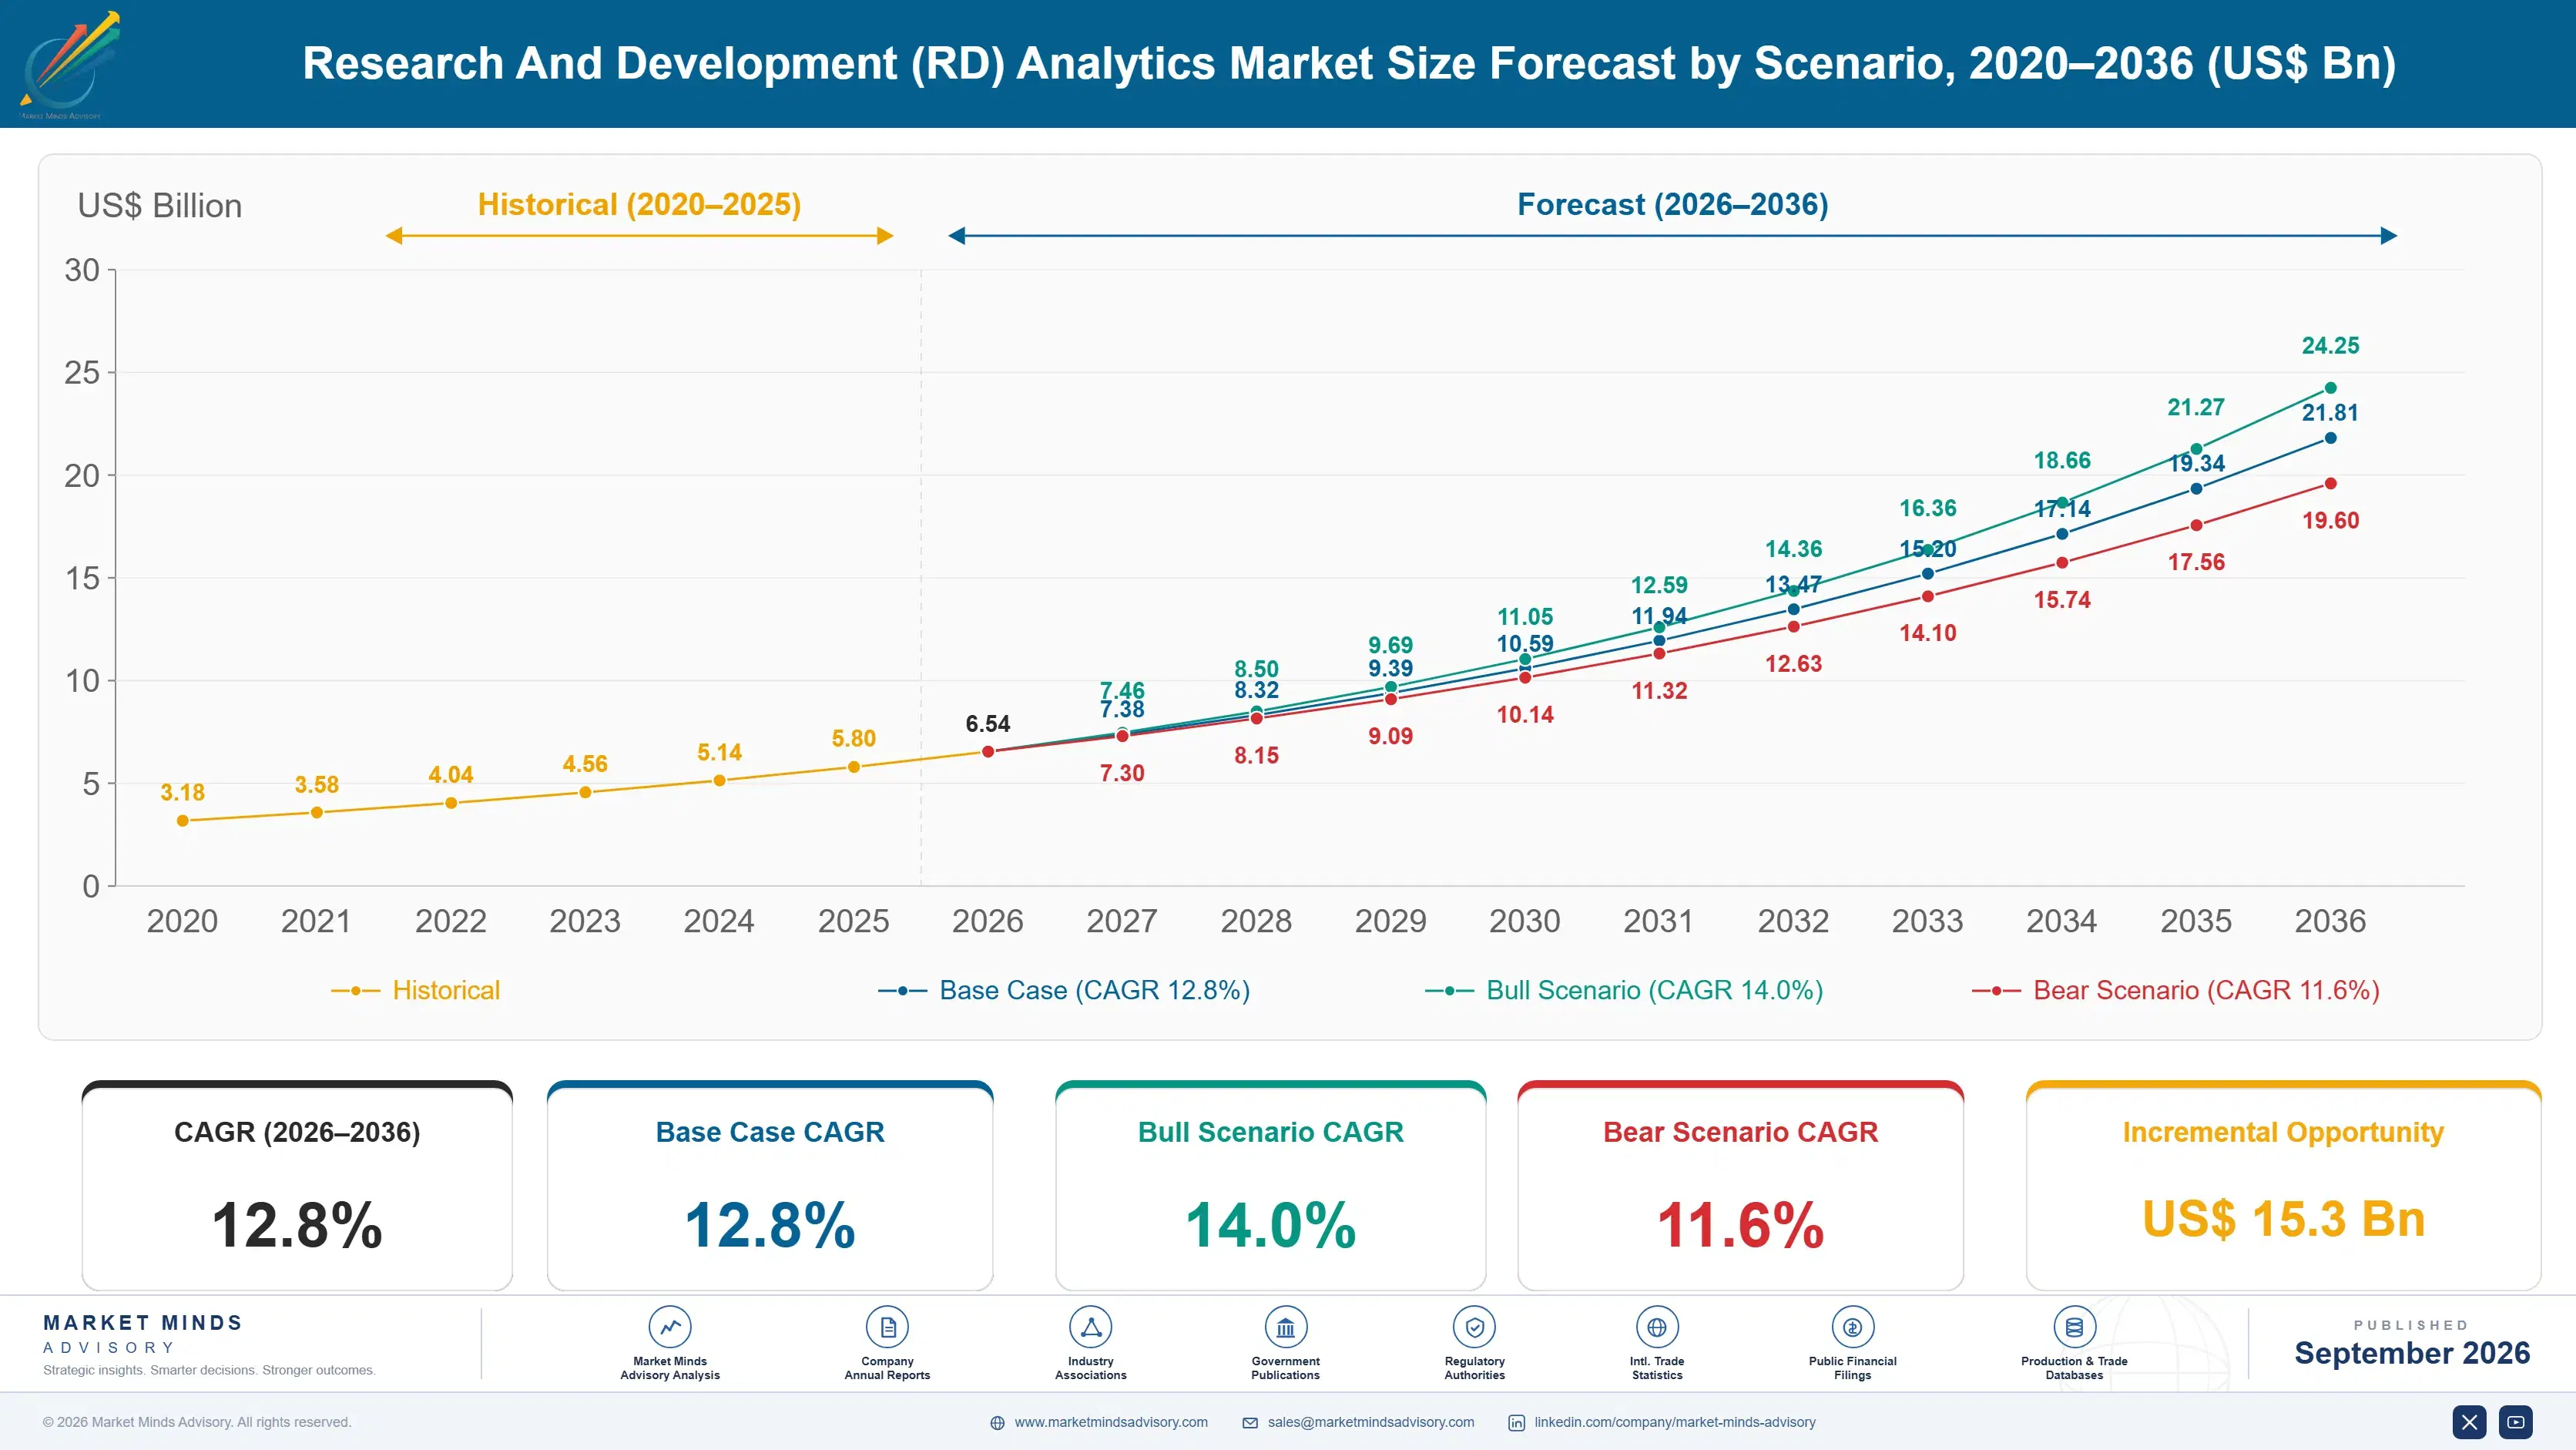
Research And Development (RD) Analytics Market Forecast Scenarios

r-and-d-analytics-market-size-forecast-scenario-1788423787873
Growth ran at 11.8% from 2020 to 2025 and came from a narrower base than the category suggests. Pharmaceutical research analytics expanded steadily on genuinely predictive trial data, while corporate portfolio software grew slowly against project tools costing a fraction as much. Industrial research organisations bought analytics during the period and abandoned a substantial share of it once integration cost became visible.
The base case at 12.8% rests on three mechanisms. Scientific data platforms are becoming the system of record for experimental work, which makes the analytics an extension of an existing deployment rather than a separate purchase requiring separate justification. Clinical outcome modelling has demonstrable predictive value because trial results provide the training data. Third, research spend is under sustained scrutiny at large corporates, which funds spend and resource analytics regardless of whether anyone believes the productivity claims.
The bull case at 14.0% assumes scientific data platforms consolidate the experimental record across instruments and partners, which would remove the integration barrier that consumes most programme effort today. The bear case at 11.6% is that research leaders continue resisting productivity measurement they correctly identify as a route to programme cancellation, which has limited this category for two decades.

Mostly Data Engineering With Analytics Attached

Research data is fragmented by design rather than by accident. Every instrument writes its own format, every laboratory keeps its own conventions, and every partner delivers differently. Around 58% of programme effort goes to connecting that before anything is analysed. Vendors sell insight and deliver integration, and the customers who understood that upfront are the ones whose programmes survived.
TOP FIVE CONCENTRATION29%Fragmented across portfolio, scientific and clinical analytics vendors
DATA INTEGRATION SHARE58%Programme effort spent connecting systems rather than analysing
PORTFOLIO DECISION FREQUENCY2 per yearOccasions when prioritisation analytics genuinely influence a decision
PHARMA SHARE OF SPEND44%Analytics investment attributable to pharmaceutical and biotech research
PROGRAMME ABANDONMENT RATE34%Initiatives ending before analytics reach any production use
AVERAGE ENTERPRISE SPENDUSD 2.4mAnnual outlay across analytics software and integration work
There is also a demand problem the industry discusses carefully. Research leaders resist productivity measurement because they understand exactly what happens when finance obtains lagging indicators on programmes with long and uncertain payoffs, and they are not wrong to resist it. Portfolio prioritisation analytics therefore influence a genuine decision around twice a year, at budget setting and major stage gates. Everything in between is reporting that nobody acts on and eventually stops maintaining.
Pharmaceutical research is the exception and it carries the market. Trial outcomes provide a labelled dataset that makes predictive modelling genuinely useful, regulatory submissions require analytical rigour anyway, and a programme decision is worth hundreds of millions. That is why 44% of spending sits there, and why analytics sold to industrial research look far less convincing against the same standard.
"The uncomfortable observation is that research leaders are right to be suspicious. Measure a scientist on lagging productivity indicators and you will get safer projects and fewer surprises, which is the opposite of what research is for. The analytics that work support a decision rather than a judgement."
Director, Research and Innovation Technology Practice · MMA Technology Practice · September 2026

Market Trends

Scientific Data Platforms Become the System of Record

Electronic laboratory notebooks and scientific data management systems have moved from documentation tools to the authoritative record of experimental work, which changes where analytics sit. Analysing data already held in a structured platform is an extension of an existing deployment rather than a separate purchase requiring its own justification and its own integration project. That is why scientific and experimental data analytics grows at 19.2%, faster than anything else here. It also concentrates value with platform vendors rather than with analytics specialists, who increasingly find themselves selling into somebody else's data estate.
Market Impact: Pharma holds 44% of spending
Buyers Learn to Price Integration Before Signing

Around 58% of programme effort goes to connecting instruments, laboratories and partner systems, and a substantial number of buyers discovered that only after committing to an analytics licence. Procurement has adapted, and integration scope is now assessed and priced separately in most large purchases rather than assumed into implementation. Vendors who quote analytics against an unscoped data estate win the licence and lose the reference when the programme stalls. Those pricing discovery first look more expensive and convert at considerably higher rates once the buyer has been burned once. Being burned once changes buying behaviour.
Market Impact: Enterprise spend near USD 2.4 million

Market Opportunities and Growth Drivers

Trial Outcomes Give Pharmaceutical Modelling Real Predictive Power

Clinical development produces something rare in research analytics, which is a large labelled dataset of outcomes against protocols, populations and molecules. That makes predictive modelling of trial success, enrolment and site performance genuinely useful rather than merely plausible, and the decisions it informs are worth hundreds of millions each. Pharmaceutical and biotechnology research accounts for 44% of analytics spending as a result. Regulatory expectations around analytical rigour reinforce it, since sponsors need defensible methodology regardless of any internal productivity argument. Nothing else in research analytics has an equivalent dataset behind it.
Market Impact: Influences only 2 decisions yearly

Research Spending Faces Scrutiny at Large Corporates

Corporate research budgets have come under sustained examination as growth expectations tightened, and finance functions now require visibility into spend by programme, by capability and by external partner that research organisations frequently cannot produce. That funds spend and resource analytics whether or not anybody accepts the productivity claims attached to it, because the requirement is accounting rather than scientific. The buyer sits in finance rather than research, which changes both the budget and the resistance considerably. Average enterprise spending near USD 2.4 million is modest against the research budgets being examined.
Market Impact: Abandons 34% before production

Market Restraints and Challenges

Research Leaders Resist Measurement That Enables Cancellation

Productivity analytics on programmes with long and uncertain payoffs give finance functions lagging indicators that support cancellation decisions, and research leaders resist that for entirely rational reasons rather than out of conservatism. The root cause is that research value is genuinely hard to measure before it appears, and any metric available early rewards predictability over discovery. Commercially this caps continuous measurement adoption. Vendors mitigate by attaching analytics to decisions already scheduled, such as budget setting and stage gates, rather than proposing ongoing performance visibility. Attaching to scheduled decisions works considerably better.
Market Impact: Fastest segment at 19.2% growth

Data Fragmentation Turns Analytics Into Engineering

Instruments, laboratories, contract organisations and academic partners all produce data in incompatible formats, and roughly 58% of programme effort goes to reconciling it before analysis begins. The root cause is that scientific instrumentation was never designed for downstream aggregation and the vendors have limited commercial reason to change that. Commercially this makes programmes long, expensive and prone to abandonment, with 34% ending before production use. Mitigation runs through scientific data platforms that impose structure at capture rather than attempting reconciliation afterwards. Structure at capture beats reconciliation afterwards every time. Programmes stall on integration.
Market Impact: Integration takes 58% of effort
3 additional market trends, 4 additional growth drivers, and 2 additional restraints and challenges are covered in the full report. Contact sales@marketmindsadvisory.com to access the complete intelligence.

Segment CAGR and Growth Architecture

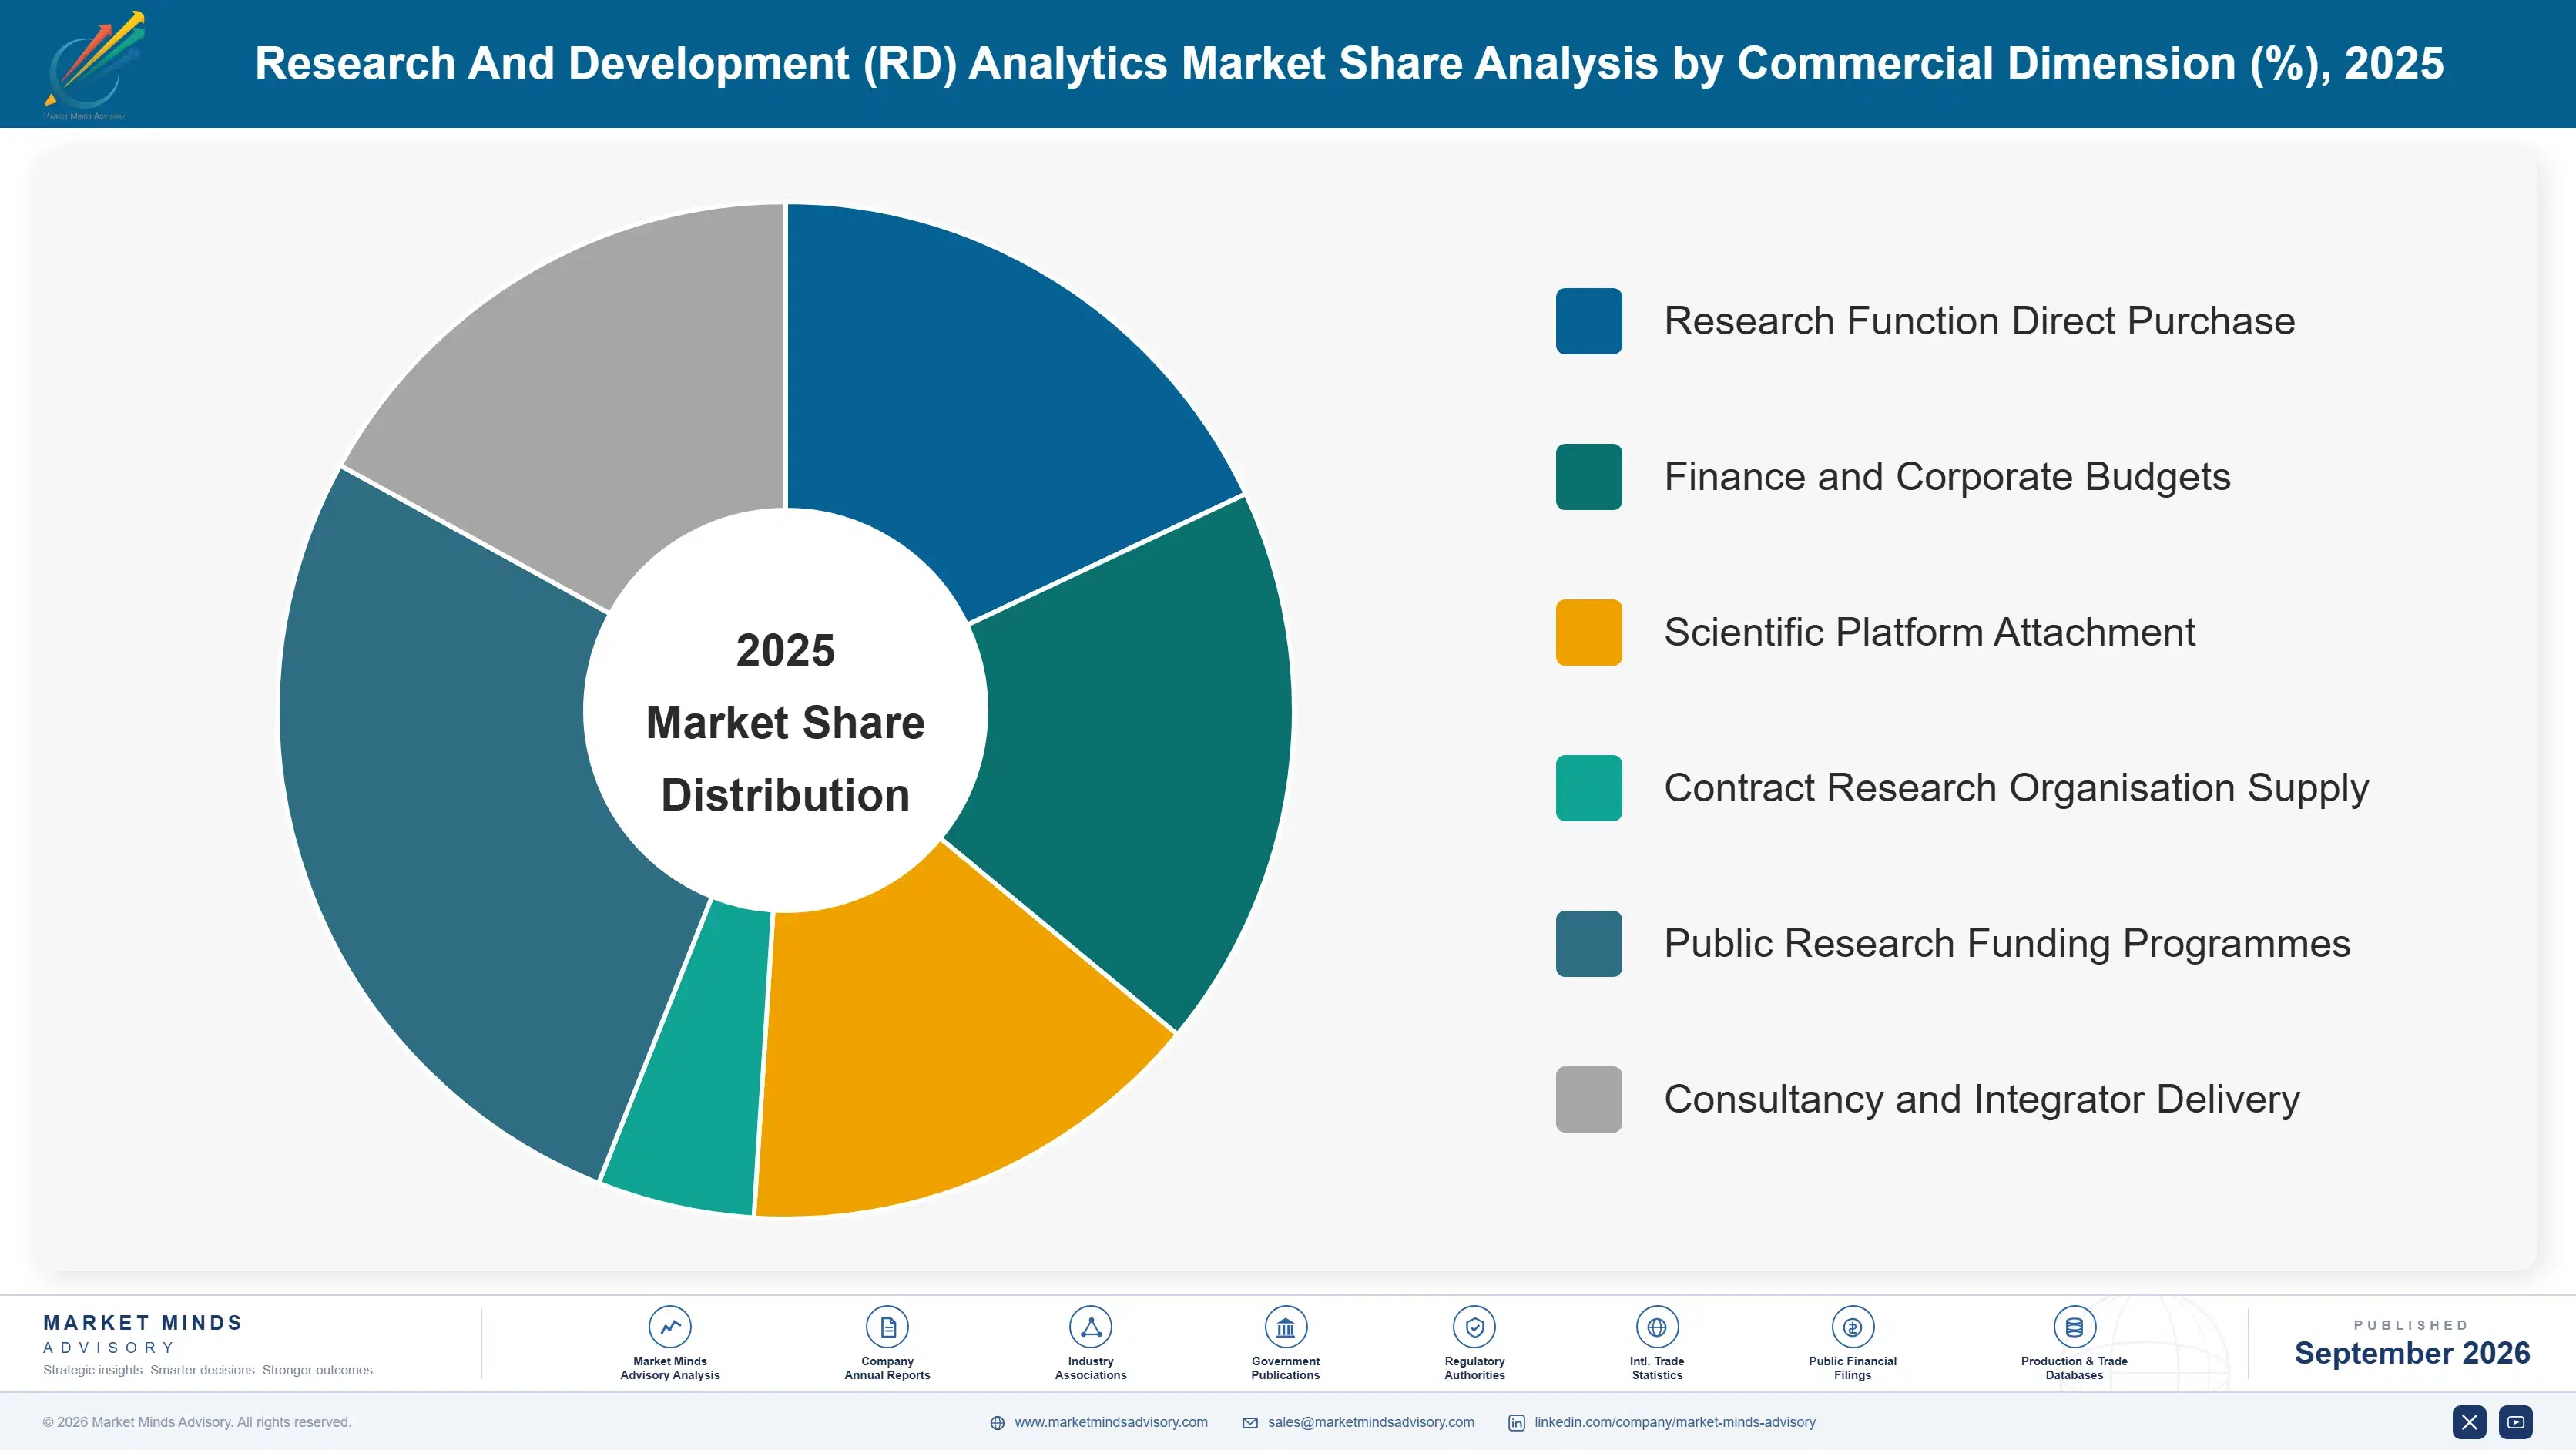
Segmentation follows the analytical question, because each one attaches to a different decision, a different budget and a different quality of underlying data. Analytics resting on well-structured experimental or clinical records behave completely differently from those attempting to measure research productivity across systems that were never built to be compared. Data quality decides the outcome.
r-and-d-analytics-market-market-share-analysis-1788423788425

Scientific and Experimental Data Analytics

Experimental data analytics grows fastest at 19.2%, half again the market rate of 12.8%, because the underlying record has become structured enough to analyse without a reconciliation project preceding it. Electronic laboratory notebooks and scientific data management platforms now hold the authoritative experimental record at many organisations, which turns analytics into an extension of a deployment already made rather than a separate purchase needing separate justification. The buyer is a research informatics function with a data estate to exploit. Value concentrates with the platform holding the data rather than with analytics specialists, who increasingly find themselves selling into somebody else's system of record. Deployment reaches production in months rather than a year.
CAGR 19.2%

Clinical and Trial Outcome Modelling

Clinical modelling grows at 16.4% on the only genuinely large labelled dataset this market has: outcomes recorded against protocols, populations, sites and molecules across thousands of trials. That makes predictive modelling of enrolment, site performance and probability of success useful rather than merely plausible, and each decision it informs can be worth hundreds of millions. Regulatory expectations reinforce demand, since sponsors need methodologically defensible analysis regardless of any internal productivity argument. Buyers are development and biometrics functions with substantial budgets, and the analytics compete against internal statistical groups rather than against other software. Development and biometrics functions hold budgets that dwarf anything research management approves, and the evaluation turns on demonstrated accuracy rather than on features.
CAGR 16.4%
Full segment breakdown across 6 segments available in the complete report.

Regional Architecture and Country Demand Map

Spending follows research intensity and sector mix rather than research volume alone. Pharmaceutical and biotechnology research generates far more analytics demand per dollar of research than industrial or consumer research does, which concentrates value where those industries sit. Sector mix decides the value distribution more than research spending does.

North America

North America holds 37%, above the regional band, on sector mix rather than research volume alone: pharmaceutical and biotechnology research concentrates here more heavily than anywhere, and that sector generates far more analytics demand per research dollar than industrial or consumer research does. Clinical development analytics, regulatory submission support and scientific data platforms all have their deepest deployments here. Technology company research organisations buy scientific data tooling for materials and hardware work. Federal research funding agencies add demand for portfolio and grant analytics that behaves quite differently from corporate purchasing. Regional growth at 12.0% reflects mature pharmaceutical adoption rather than any broadening across other research sectors. Federal funding agencies buy quite differently again.
Share: 37% | CAGR: 12.0% (2026 to 2036)

Western Europe

European demand rests on pharmaceutical research in Switzerland, the United Kingdom, Germany and Denmark alongside a large industrial and chemicals research base that buys quite differently. Pharmaceutical buyers behave like their American counterparts, while industrial research organisations remain sceptical of productivity measurement and buy narrowly. Public research funding bodies purchase portfolio analytics under accountability requirements that are more prescriptive than elsewhere. Regional growth at 11.2% is the slowest of the major markets, reflecting mature adoption in pharmaceutical research and persistent resistance across the industrial base. Industrial resistance to measurement is as firm here as anywhere, and it has not softened with better tooling. Public funders buy portfolio analytics under prescriptive accountability rules.
Share: 24% | CAGR: 11.2% (2026 to 2036)
Regional intelligence for 5 additional markets available in the complete report: East Asia, South Asia and Pacific, Latin America, Middle East and Africa, Eastern Europe. Contact sales@marketmindsadvisory.com.
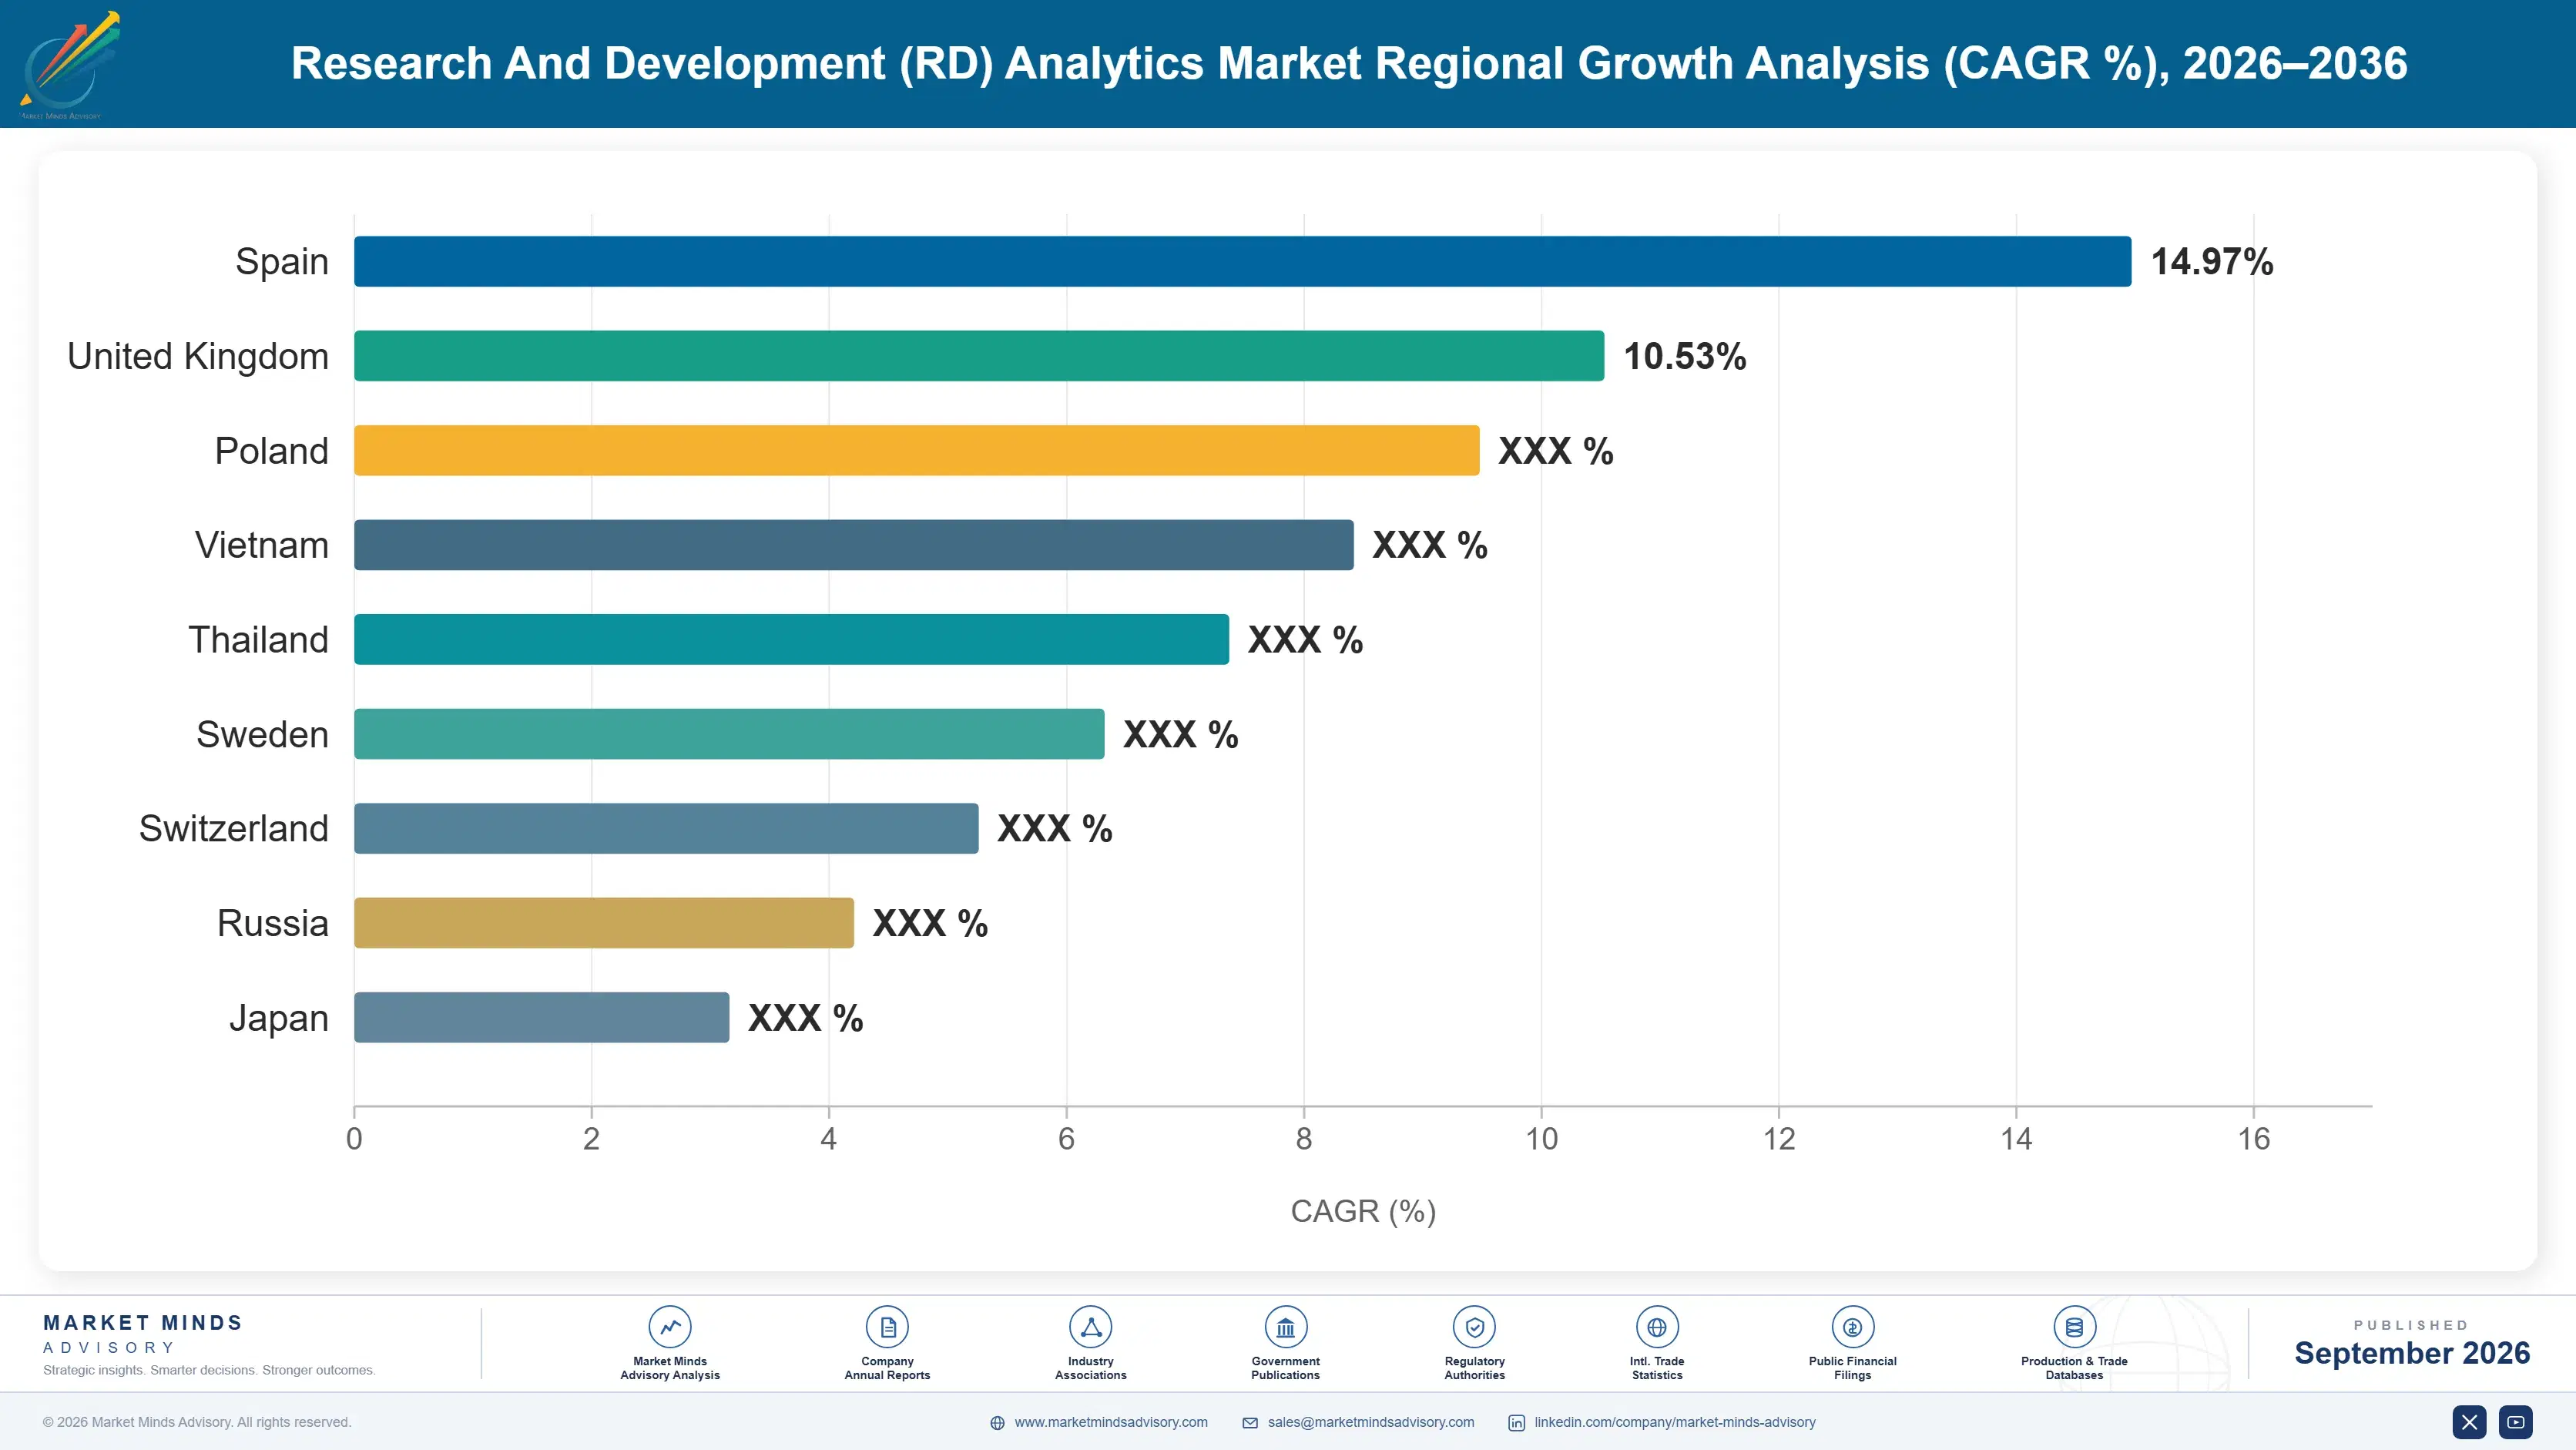
r-and-d-analytics-market-country-cagr-analysis-1788423788948

Where R&D Analytics Revenue Holds

Selling productivity measurement to research leaders who correctly resist it has failed for twenty years. What sells attaches to a decision already scheduled, exploits a structured data estate that exists, or serves a finance function whose requirement is accounting rather than scientific. Research leaders have been declining the larger proposition for twenty years, and they have been right to.

Attach Analytics to Decisions Already Scheduled

Portfolio analytics influence a genuine decision roughly twice a year, at budget setting and major stage gates, and everything sold as continuous productivity visibility becomes reporting nobody maintains. Vendors positioning against those two scheduled decisions convert at around 3 times the rate of those proposing ongoing measurement, because the customer has to make the decision anyway. It means selling a smaller capability more successfully. Continuous measurement is the larger proposition and the one research leaders have been declining for two decades with good reason. Smaller and successful beats larger and refused.
Market Impact: Converts at 3 times the ongoing measurement rate

Sell Into a Structured Data Estate Not Around One

Roughly 58% of programme effort goes to reconciling incompatible research data, and analytics deployed on top of a scientific data platform that already imposes structure at capture avoid most of it. Vendors integrated with those platforms deploy in around 4 months against a year or more for standalone tools, and abandon far less often than the 34% market rate. The trade-off is dependence on a platform vendor who may build the analytics themselves. That risk is smaller than the one created by selling into an unstructured estate. Platform dependence beats integration exposure.
Market Impact: Deploys in 4 months rather than twelve months

Reach Finance Where Research Resists Measurement

Research leaders resist productivity analytics for rational reasons and finance functions require spend visibility by programme, capability and partner for accounting purposes that have nothing to do with scientific productivity. Selling spend and resource analytics to finance sidesteps the argument entirely and reaches a budget that research headcount does not constrain, at contract values around 2 times what research organisations approve. It requires framing that avoids productivity language altogether, which vendors built around research narratives find genuinely difficult to do. Accounting language opens doors that productivity language closes. Vendors resist abandoning their own narrative.
Market Impact: Reaches 2 times the research contract value overall

Concentrate on Data With Labelled Outcomes

Predictive analytics require outcomes to learn from, and clinical development is the only part of research that generates them at scale across thousands of comparable trials. That is why pharmaceutical work represents 44% of spending and why clinical modelling grows at 16.4%. Analytics sold to industrial and consumer research organisations lack any equivalent training data and are correspondingly less convincing under examination. Suppliers concentrating where labelled outcomes exist compete on demonstrable accuracy rather than on plausibility, which is a completely different sale. Demonstrable accuracy is a different sale entirely. Plausibility loses to evidence.
Market Impact: Pharma represents a full 44% of total spending

Who Controls the Margin Pool

Concentration is low at roughly 29% across the top five on measured software and services revenue, and the participants come from three distinct traditions that rarely meet in an evaluation. Portfolio management vendors descend from project management software. Scientific data platforms grew from laboratory informatics. Clinical analytics firms emerged from statistical consulting and contract research. They share a label and almost no customers, and the aggregate describes a boundary rather than a contest.
Competition runs on three dimensions. Data estate position is first and increasingly decisive, because analytics deployed on structured data avoid the integration effort that consumes most programmes. Second is credibility of predictive claims, which requires labelled outcomes that only clinical development reliably provides. Third is buyer access outside research, since finance and operations budgets resist far less than scientific leadership does.

Two pressures are reshaping the field. Scientific data platforms are extending into analytics themselves, which absorbs specialists selling into their data estates. Meanwhile general enterprise analytics and data platforms are reaching research organisations through corporate agreements, offering adequate capability at no incremental cost. Rankings will move toward participants holding the experimental or clinical data record rather than those with the most sophisticated analytical methods.
r-and-d-analytics-market-company-positioning-matrix-1788423789475

Competitive Moat and Risk Dimensions

DASSAULT SYSTEMES

Moat: Scientific and design data breadth

Dassault Systemes holds research data across life sciences informatics and engineering design platforms, which places it in the data estate that analytics depends on rather than selling into somebody else's. That breadth spans industries whose research cycles do not move together. Installed platform positions make analytics an extension of an existing deployment rather than a competitive purchase.
DASSAULT SYSTEMES

Risk: Portfolio analytics commoditisation

Portfolio and programme analytics face competition from project management tools costing a fraction as much and from general enterprise platforms bundled into corporate agreements. Growth depends increasingly on scientific and clinical data positions rather than on the portfolio capability that carries a long history. Research leader resistance also caps how far portfolio analytics extend within any customer.
CERTARA

Moat: Regulatory grade modelling credibility

Certara built biosimulation and clinical modelling capability accepted in regulatory submissions, which is a credibility position earned across many filings rather than a product feature. Sponsors use it because regulators recognise the methodology, which makes displacement genuinely difficult. Its scientific staff depth in pharmacometrics is scarce and cannot be assembled quickly by any competitor entering the field.
CERTARA

Risk: Pharmaceutical sector concentration

Revenue depends almost entirely on pharmaceutical and biotechnology research spending, which follows drug development pipelines and biotech funding conditions that have been volatile. Diversifying into industrial or consumer research means entering markets without labelled outcome data where the analytics are far less demonstrable. Scientific staffing is a fixed cost through downturns, since pharmacometricians cannot be recruited quickly.

Players Tracked

Prominent Players

Dassault Systemes
Planview
Certara
Benchling
IQVIA

Other Key Players

Sopheon
Sciforma
PTC
Siemens Digital Industries Software
Clarivate
Veeva Systems
Dotmatics
Simulations Plus
Cytel
PatSnap
Revvity Signals
LabVantage Solutions
Schrodinger
Aera Technology
Phesi

Recent Developments

MARCH 2025

Scientific data platforms extend into analytics previously supplied by specialists

Laboratory informatics and scientific data platform vendors added analytical capability on the experimental records they already hold, developed internally rather than acquired. The extensions target customers who had been buying separate analytics tools requiring integration work against the same underlying data. Standalone specialists were not consulted about the extension.
Signal: Holding the data record is proving more valuable than holding the analytical method built on top of it.
AUGUST 2025

Corporate finance functions extend spend visibility requirements into research

Finance organisations at several large corporates required programme, capability and partner level research spend reporting that research functions could not produce from existing systems. The requirement was framed as accounting visibility rather than productivity measurement, which reduced internal resistance considerably. Reporting was framed entirely in accounting terms.
Signal: Avoiding productivity language entirely is what allows these purchases to proceed inside research organisations at all.
NOVEMBER 2025

Buyers price data integration separately from analytics licences

Large research organisations began scoping and pricing data integration work separately in analytics procurements rather than assuming it into implementation. The change followed programmes that stalled when integration effort proved far larger than either party had estimated at signature. Discovery phases became routine as a result.
Signal: Procurement has learned what the industry knew, and vendors quoting against unscoped data estates now lose.

What These Programmes Cost to Deliver

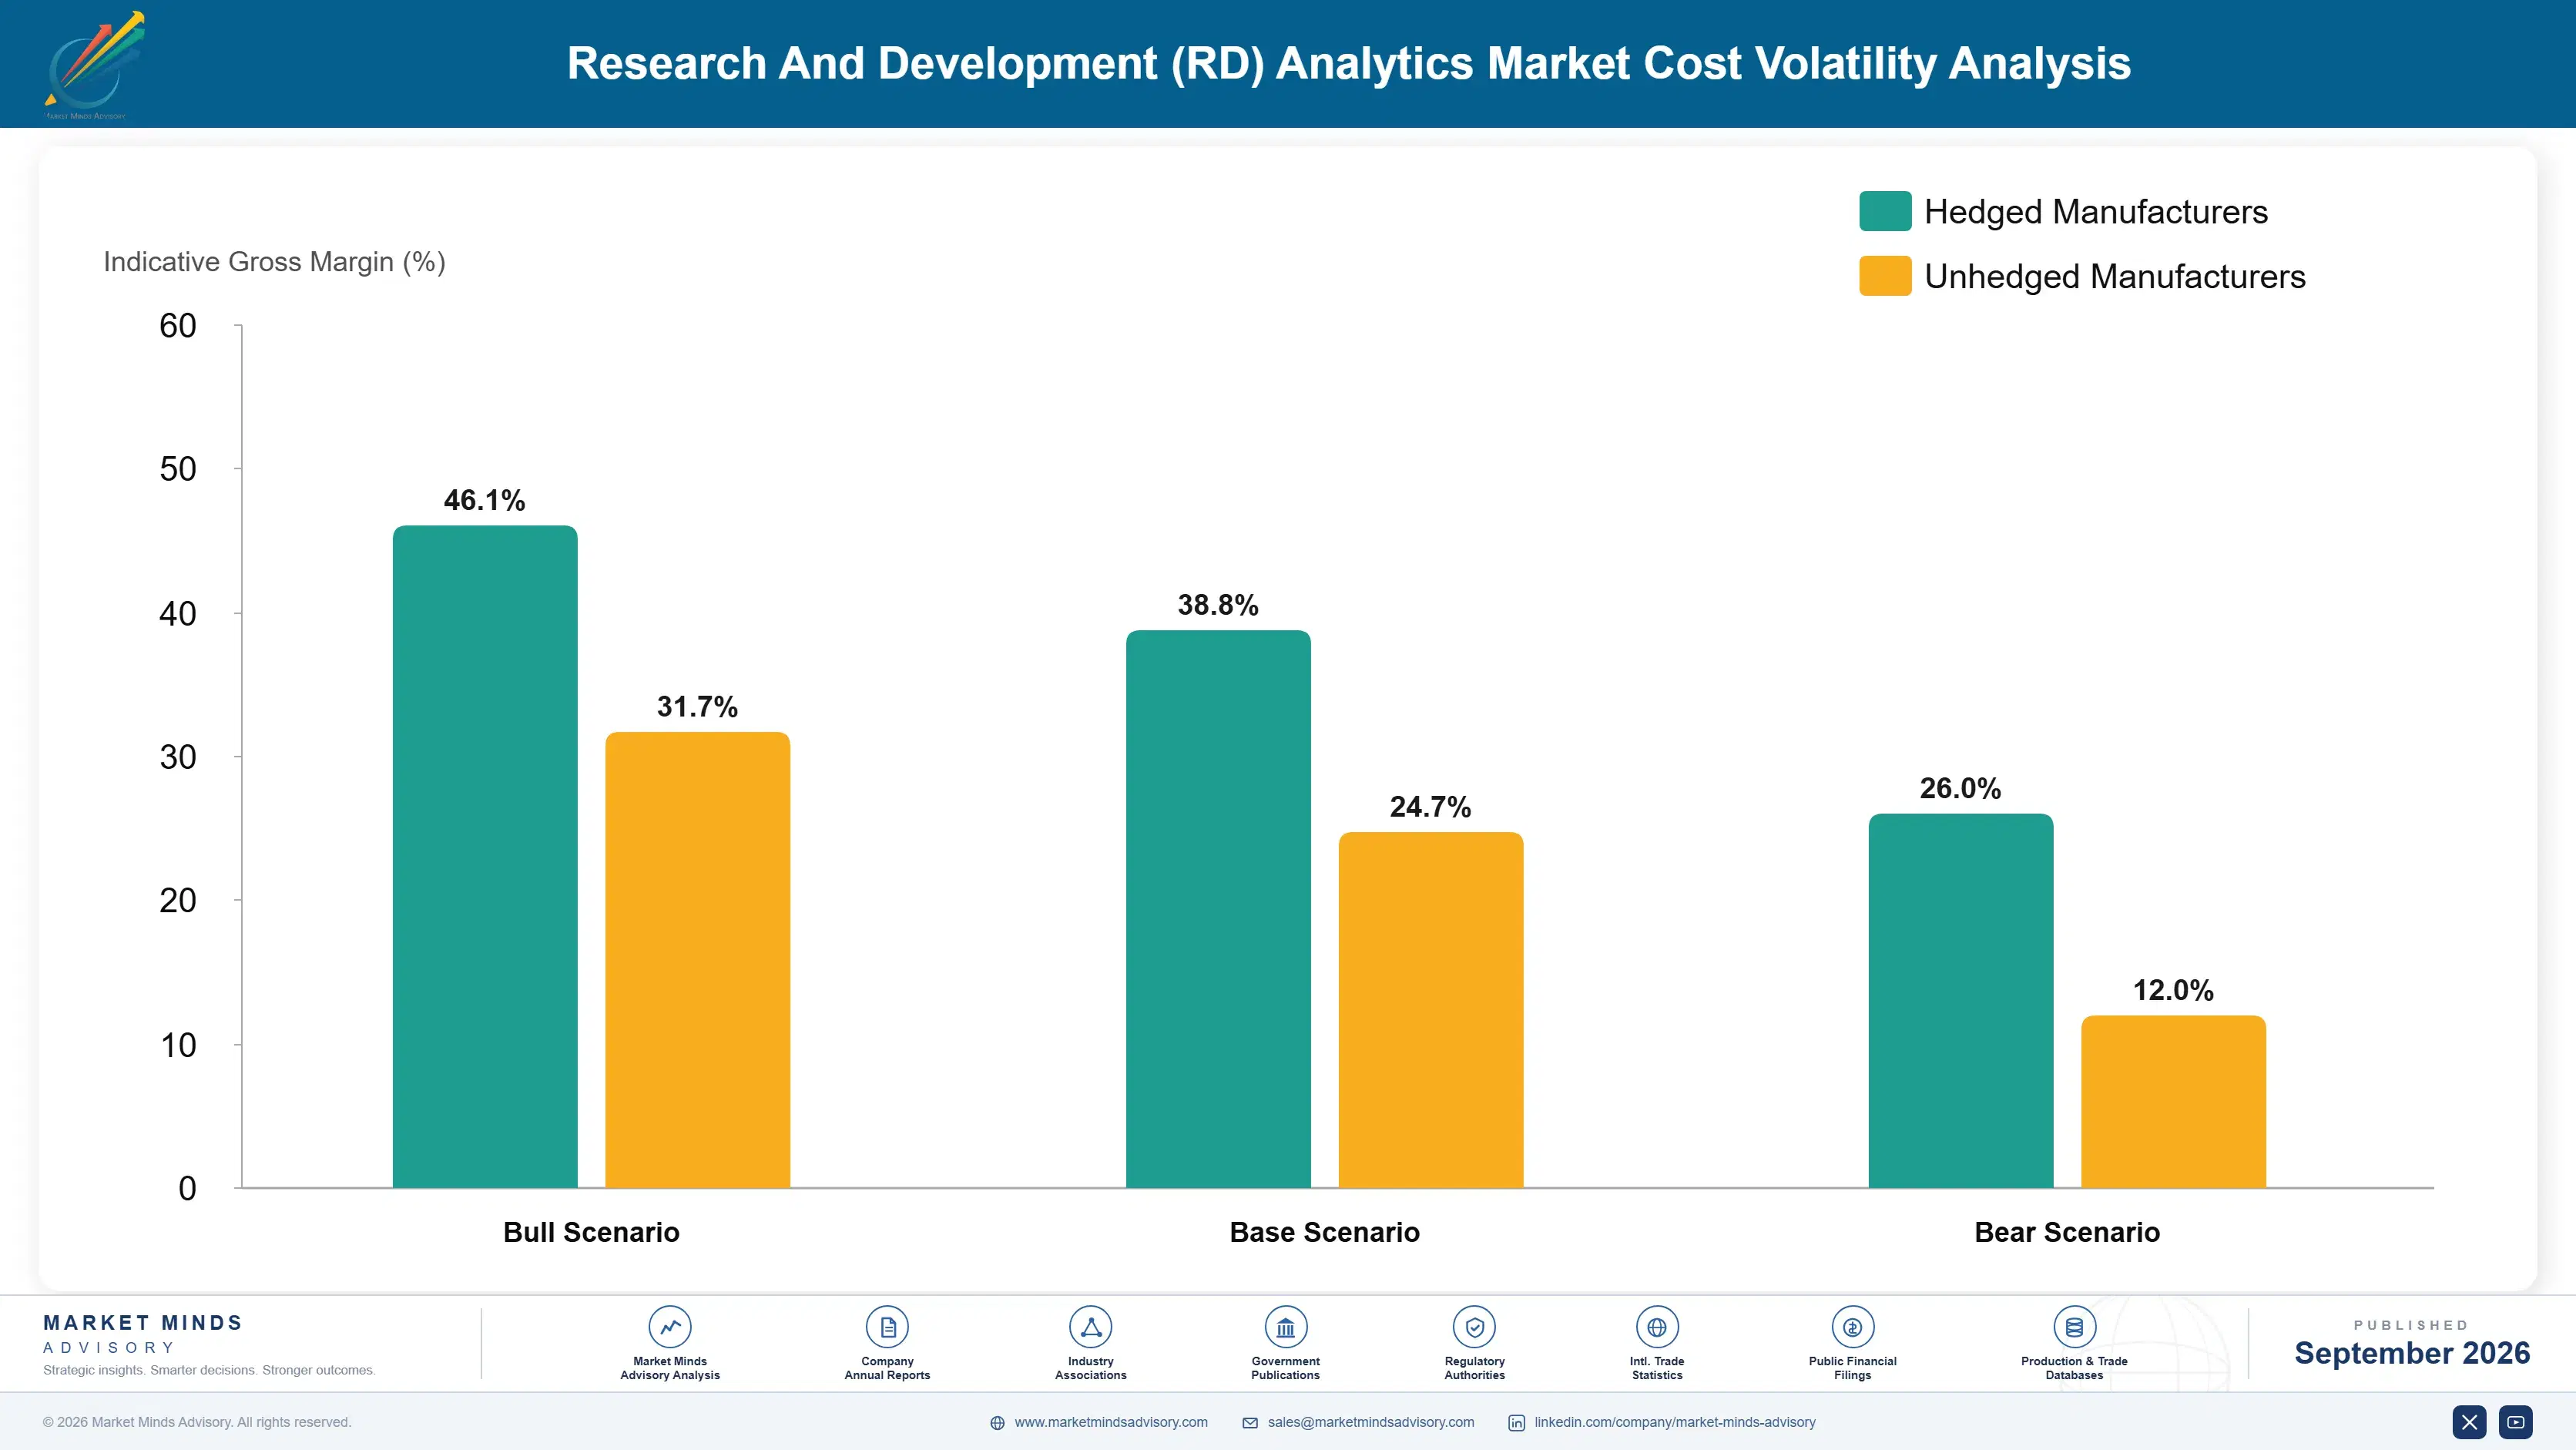
Delivery cost looks like data engineering with software attached. Integration and data preparation labour runs between 41% and 56% of cost, the range reflecting how structured a customer's research data already is. Software engineering takes roughly 22%, scientific and domain expertise 17%, and hosting and compute the balance. Domain specialists understanding both the science and the data are the scarcest input.
Specialist labour has been the sharpest pressure. People combining scientific training with data engineering are genuinely scarce, and demand across pharmaceutical and platform vendors pushed compensation well above technology rates through 2024 and 2025. Certara and IQVIA both referenced scientific staffing and cost conditions in recent annual reporting. Vendors with fixed-price implementation commitments absorbed the increase rather than reopening agreements. Several industries compete for the same people.

Exposure varies by delivery model rather than by scale. Vendors selling fixed-price programmes into unstructured data estates carry scope risk that has repeatedly destroyed reference account margin. Those integrated with scientific data platforms avoid most of it and depend on the platform relationship instead. Software-only vendors relying on partners carry least risk and capture least value. Small specialists carry scope risk without any bench to absorb an overrun.
r-and-d-analytics-market-cost-volatility-analysis-1788423789671

Price data discovery separately from analytics delivery

Research data estates vary enormously in structure and no vendor can assess integration scope from a proposal document, which makes fixed-price analytics against unscoped data a transfer of unquantifiable risk. A separately priced discovery phase establishes the actual condition before commitment. Buyers accept it readily after one overrun, which is now common enough to be expected.

Build on structured platforms rather than reconciling afterwards

Imposing structure at the point of capture removes most of the effort that reconciliation attempts to fix later, which is why analytics deployed on scientific data platforms reach production far faster. Integrating with those platforms rather than competing shortens deployment substantially. It creates dependence on a partner who may build competing analytics, a smaller risk than the exposure removed.

Develop domain specialists internally rather than recruiting

People combining scientific training with data engineering capability are scarce across every market, and competing for the same individuals raises cost for everyone without increasing supply. Training scientists in data engineering, or engineers in the relevant science, builds capacity competitors cannot bid away. It takes eighteen months to produce someone productive, which is why few commit while demand is strong.

Portfolio Architecture for Margin Defence

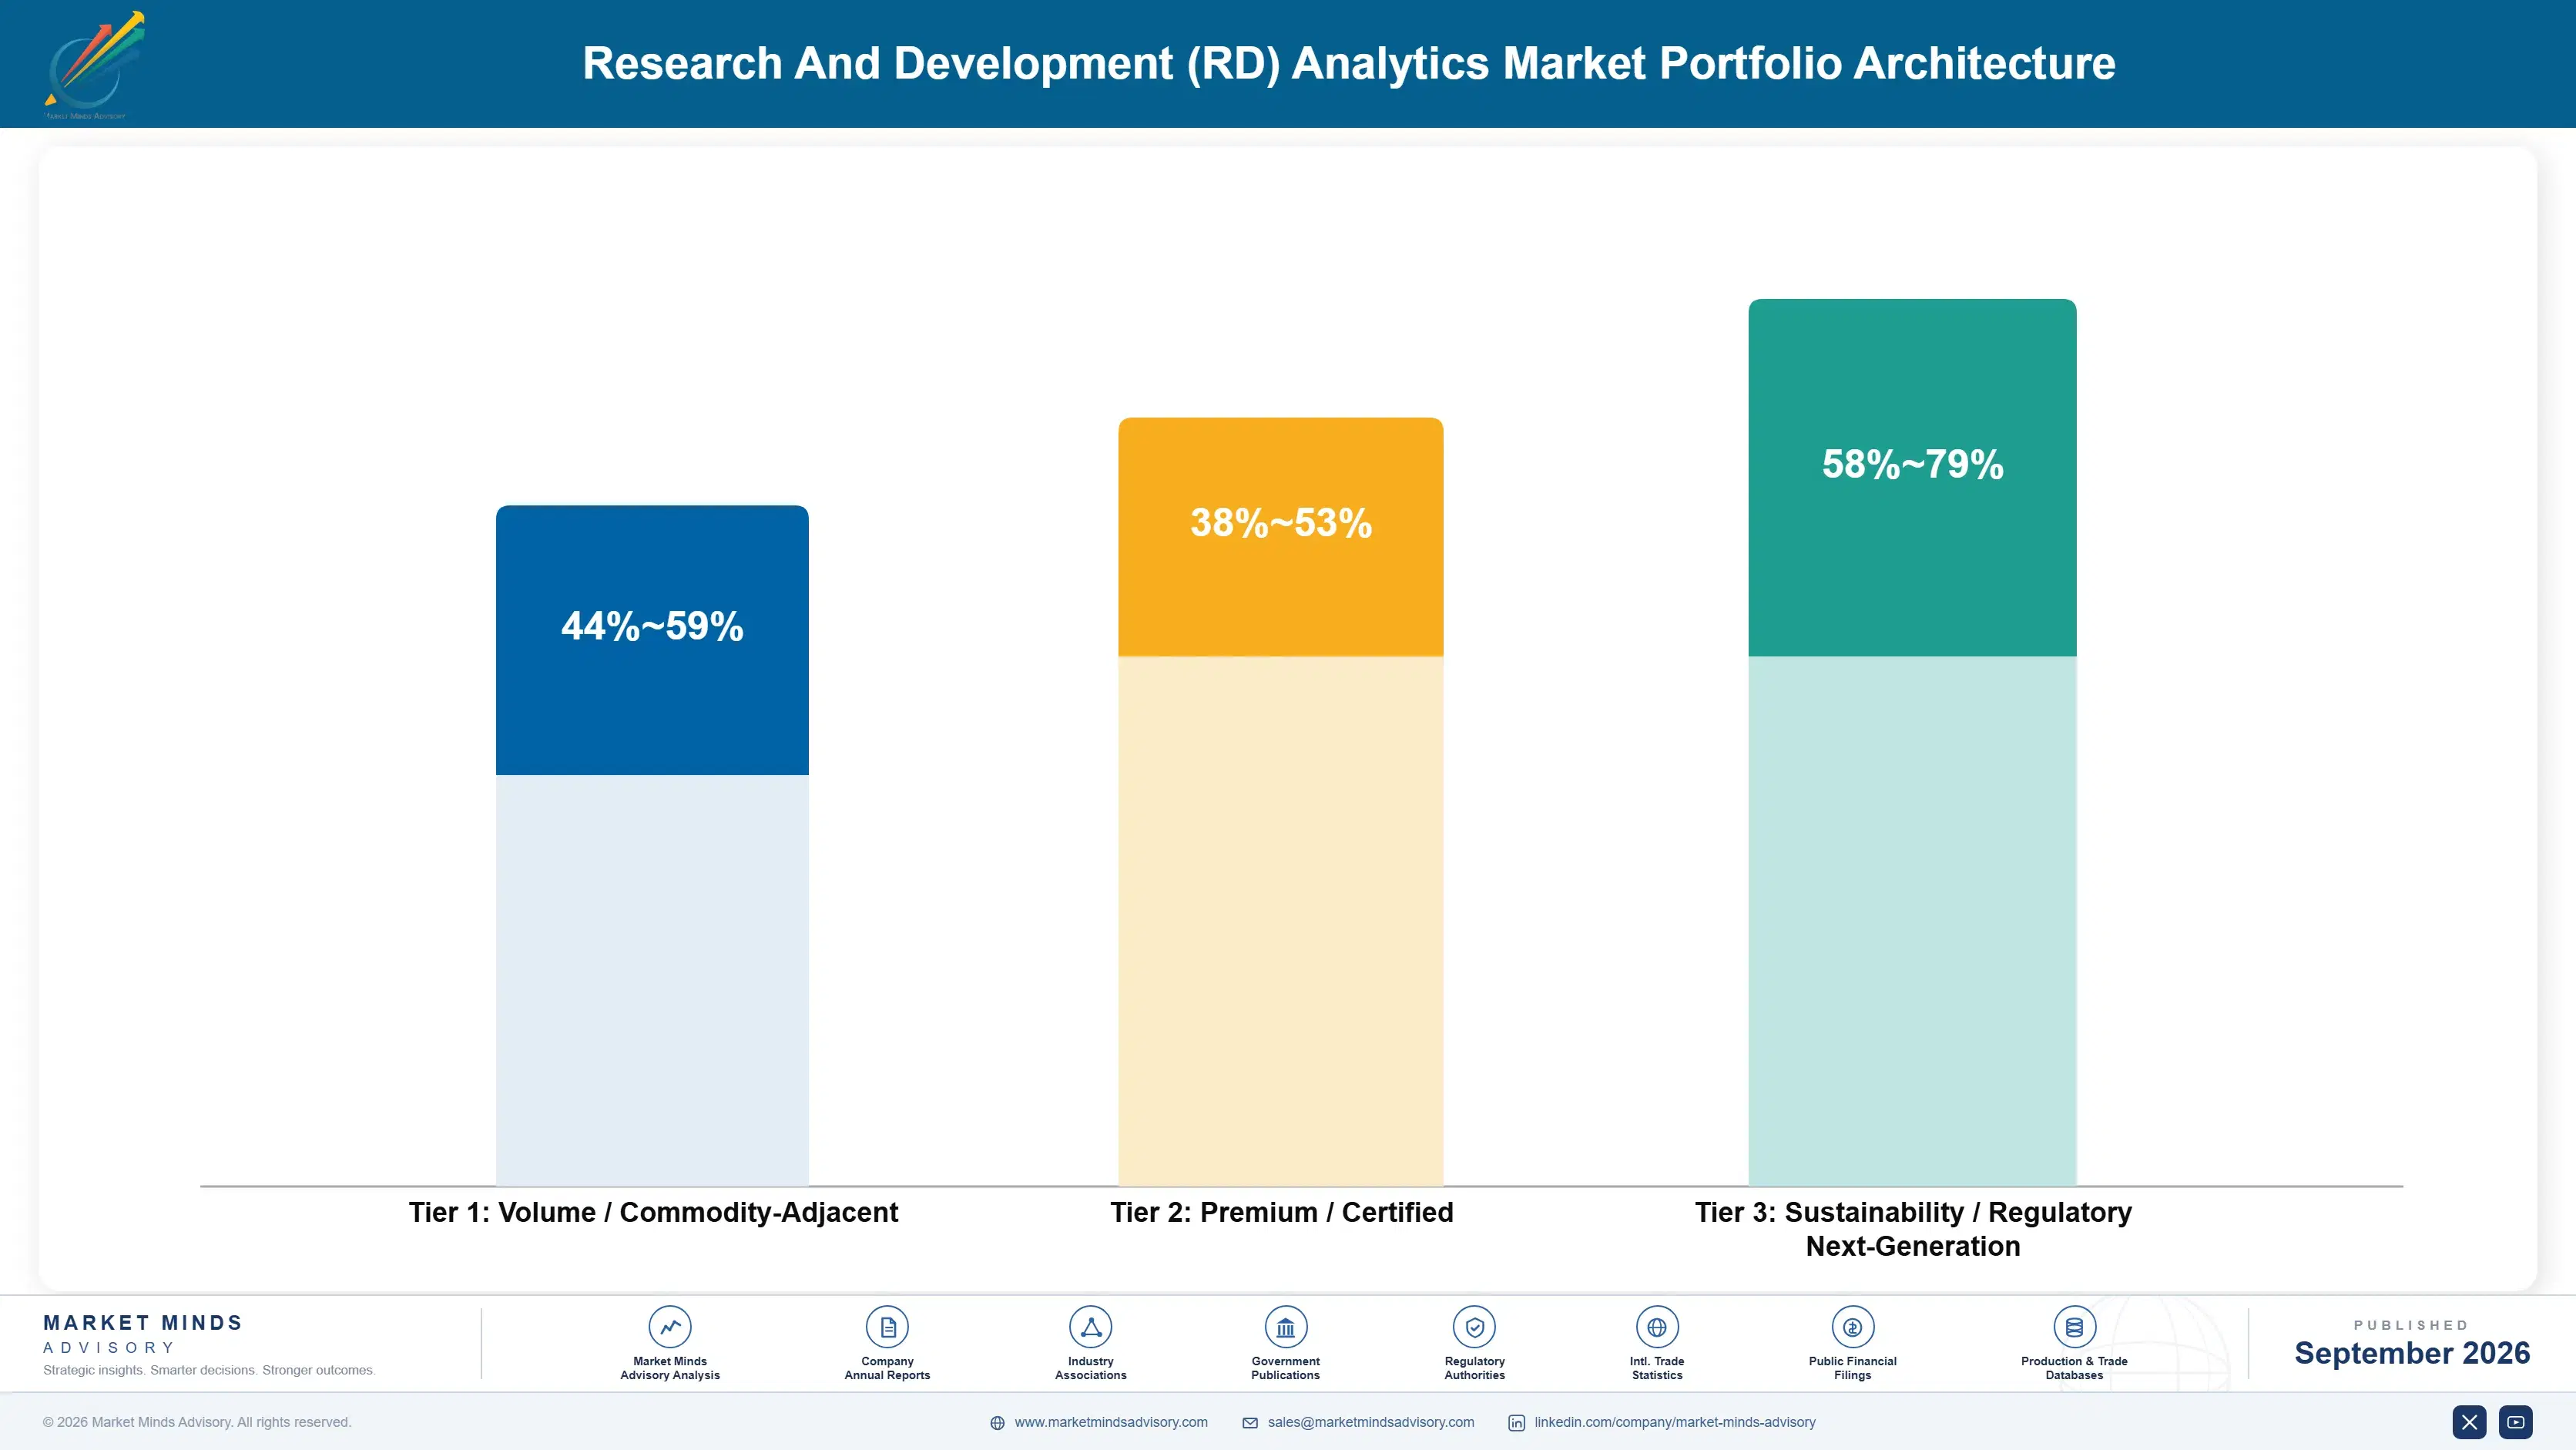
Margin architecture separates on whether the data is already structured. Analytics deployed against a scientific data platform carry modest implementation cost and earn software margins, because the hard work was done when the platform was installed. Analytics sold into unstructured estates carry integration effort at 58% of programme cost and earn services margins whatever the licence says. Clinical modelling earns best because scientific credibility rather than software capability determines the price.
The volume tension is between portfolio breadth and scientific depth. Portfolio management reaches every research organisation, competes against project management tools costing far less and influences a decision roughly twice a year. Scientific and clinical analytics reach fewer organisations, require domain expertise that is scarce and expensive, and attach to decisions worth hundreds of millions. Vendors built for breadth found a large customer count did not compensate for capability barely used.

High-value revenue concentrates in clinical outcome modelling and in analytics on structured experimental records. Both share the property that the underlying data supports a claim that can be tested rather than merely asserted. Portfolio and programme analytics occupy the volume position, generate most of the customer relationships, and rest on data research organisations never wanted compared.

Volume / Commodity-Adjacent

Portfolio prioritisation, stage gate and programme analytics sold to research management functions. The wide range separates established platforms from vendors competing against far cheaper project management tools. Usage is episodic, which makes renewal vulnerable whenever budgets are examined.
Gross Margin: 44-59%

Premium / Certified

Analytics deployed into unstructured research data estates with substantial integration content. Margin is constrained by data engineering effort rather than by competitive pricing. Scope risk on fixed-price programmes has repeatedly destroyed the economics on reference accounts.
Gross Margin: 38-53%

Sustainability / Regulatory / Next-Generation

Clinical outcome modelling with regulatory credibility, and analytics on structured scientific data platforms. The widest range in the portfolio, spanning software with light implementation and modelling requiring scarce scientific staff. Highest margin and the most defensible positions here.
Gross Margin: 58-79%
r-and-d-analytics-market-portfolio-architecture-1788423790167

High-value Sub-segments and Strategic Watch-out

Clinical Outcome Modelling

High value and high growth together, resting on the only large labelled outcome dataset in research and on methodology regulators already recognise. The margin range reflects scientific staffing intensity. Decisions informed are worth hundreds of millions, which removes price sensitivity almost entirely from the evaluation.
Gross Margin: 62-79%

Structured Data Estate Analytics

High value with the strongest growth here, deployed on experimental records already held in scientific data platforms rather than reconciled afterwards. The range reflects platform integration depth. Deployment reaches production in months rather than a year, which changes the economics of the whole engagement. Integration effort largely disappears.
Gross Margin: 56-72%

Portfolio and Programme Analytics

The volume core of customer relationships and the weakest part commercially, influencing a genuine decision about twice a year and competing against far cheaper project tools. It provides the account access other analytics are sold through. Research leader resistance caps how far it can extend.
Gross Margin: 42-57%

Platform Vendor Analytics Extension

The strategic watch-out, carried at zero because it displaces specialist revenue rather than generating any. Scientific data platforms are building analytics on records they already hold and control. Specialists selling into those estates are competing against the party that owns the data and the customer relationship.
Gross Margin: 0-0%

How This Spending Repeats

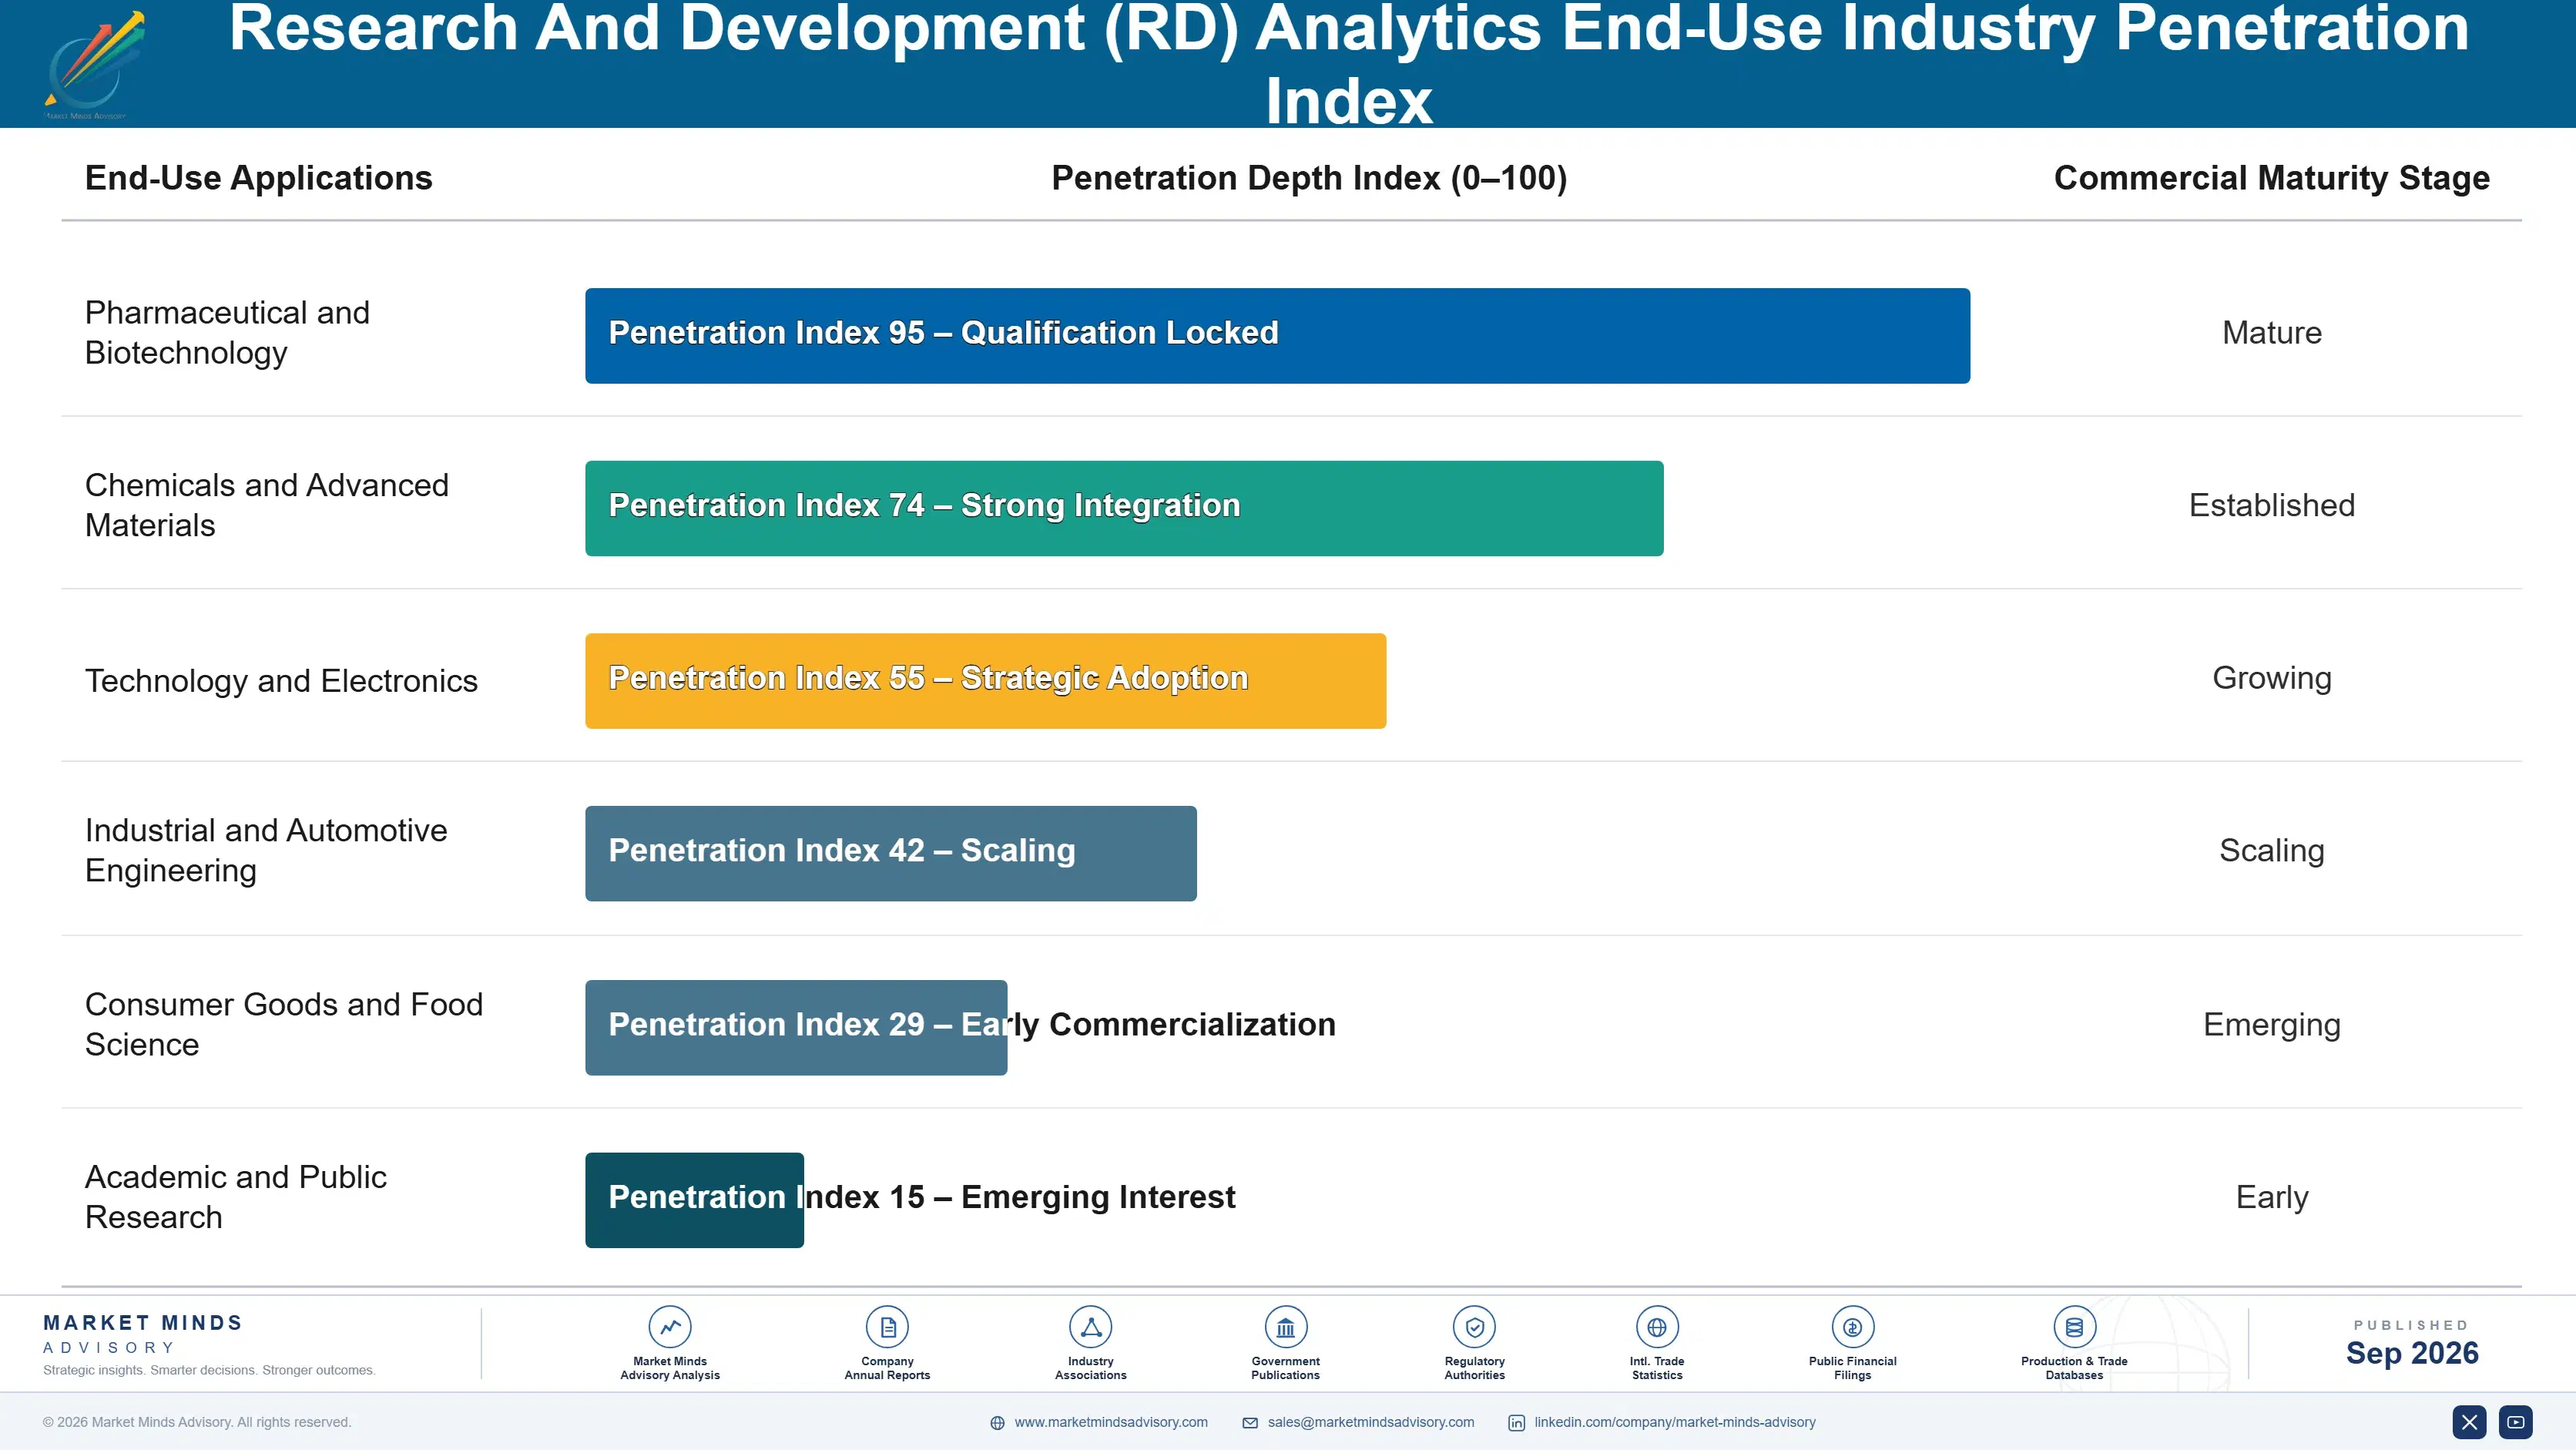
Recurrence depends on whether the analytics sit inside a process or beside one. Clinical modelling recurs with every development programme and submission, continuous for as long as a sponsor holds a pipeline. Experimental data analytics recur with laboratory activity. Portfolio analytics recur about twice a year and are maintained in between by people wondering why. That produces renewal rates varying by more than thirty points across comparable subscriptions.
Adoption depth varies sharply by research type. Pharmaceutical development uses clinical and scientific analytics continuously and integrates them into regulatory workflow. Biotechnology research uses experimental analytics deeply and portfolio tools barely. Industrial research uses scientific data platforms where instrument output is structured and resists measurement elsewhere. Consumer goods research uses portfolio tools at budget setting only. Academic institutions deploy on grant funding and rarely renew.

The buyer has fragmented rather than shifted. Research leadership still controls scientific tooling and remains resistant to measurement. Research informatics buys data platforms and the analytics attached to them. Finance buys spend visibility framed as accounting rather than productivity. Development and biometrics buy clinical modelling against pipeline decisions. Vendors organised around one research relationship address one of four buyers, usually the most resistant.
r-and-d-analytics-market-end-use-penetration-index-1788423790657

What This Market Rewards

These are among the four positions where our research anticipates prominent divergence between winners and laggards over the coming forecast period. Each is grounded in the demand model, the regulatory perimeter, and the announced capacity pipeline.
01 / SCHEDULED DECISION ATTACHMENT

Sell to decisions already made, not continuous visibility

Portfolio analytics genuinely influence a decision about twice a year, at budget setting and major stage gates, while everything sold as ongoing productivity visibility becomes reporting that nobody maintains past the first year. Vendors positioning against those scheduled decisions convert at roughly 3 times the rate of those proposing continuous measurement, because the customer has to make the decision regardless. It means selling a smaller capability far more successfully, which most vendors find commercially unappealing until they have failed the larger sale repeatedly.
02 / STRUCTURED DATA POSITIONING

Deploy where structure exists, never where it must be created

Around 58% of programme effort goes to reconciling incompatible research data, and roughly 34% of programmes end before reaching production, because that effort proved far larger than anybody had estimated. Analytics deployed on scientific data platforms that impose structure at the point of capture reach production in about 4 months, against a year or more otherwise. The dependence created on a platform vendor who might build competing analytics is a considerably smaller risk than selling into an unstructured estate and hoping.
03 / FINANCE BUDGET ROUTING

Ask finance for spend visibility, never research for productivity

Research leaders resist productivity measurement for entirely rational reasons, since any metric available early rewards predictability over discovery and hands finance the means to cancel long programmes. Finance separately requires spend visibility by programme, capability and partner for accounting purposes with no scientific claim attached. Selling that framing sidesteps the argument completely and reaches contract values around 2 times what research organisations approve, though it does require abandoning the productivity language that most vendors have built their entire narrative around.
04 / LABELLED OUTCOME CONCENTRATION

Build where outcomes exist to learn from

Predictive analytics need outcomes, and clinical development is the only part of research generating them at scale across thousands of comparable trials with recorded protocols, populations and results. That is why pharmaceutical work carries 44% of spending and why clinical modelling grows at 16.4% while industrial research analytics remain difficult to substantiate. Suppliers concentrating where labelled outcomes exist compete on demonstrable accuracy rather than on plausibility, and that turns out to be an entirely different and considerably easier conversation to hold.

Engagement Snapshot From the Field

A live engagement with an industry participant carrying material or product regulatory and market exposure ahead of a defining policy shift, showing how our research translates into a defensible multi-year portfolio strategy.
MARKET MINDS ADVISORY · CLIENT ENGAGEMENT SUMMARY
Research And Development (RD) Analytics Producer Strategic Portfolio Review and Transition Roadmap 2026·Investment Scenario on Research And Development (RD) Analytics Exposure Evaluation 2025-26
CLIENT PROFILE
A global chemicals group spending roughly USD 640 million annually on research and development across four business units (client-reported, unverified by MMA), operating eleven research sites and working with over ninety external partners. A research analytics programme launched three years earlier had deployed portfolio management software and a data platform, and neither was being used as intended.
STRATEGIC CHALLENGE
The programme had cost roughly USD 31 million against a business case promising research productivity improvement that nobody could measure (client-reported, unverified by MMA). Research leadership across all four business units had quietly disengaged, describing the portfolio tool as a reporting obligation, while finance was separately unable to obtain spend visibility by programme or by external partner.
MMA APPROACH
MMA examined what decisions the analytics were actually informing rather than what capability had been deployed, tracking every use of the portfolio tool across eighteen months. We interviewed 19 research leaders, the finance function, seven external partners and four vendors. Evaluation weighted decision attachment and data structure rather than analytical capability or the completeness of the deployed feature set.
KEY FINDINGS
  1. The portfolio tool had informed exactly four decisions in eighteen months, all at annual budget setting, and had been maintained continuously between them at substantial cost.
  2. Research leaders across three business units stated directly that they resisted the productivity metrics because they expected them to be used against long-horizon programmes.
  3. Finance had never been consulted on the programme despite spend visibility being the one requirement nobody disputed and which nobody in the organisation had yet managed to satisfy.
  4. Instrument and partner data reconciliation consumed 62% of the data platform effort, and only two of eleven sites had reached the structured state the design assumed.
CLIENT PROFILE
A global chemicals group spending roughly USD 640 million annually on research and development across four business units (client-reported, unverified by MMA), operating eleven research sites and working with over ninety external partners. A research analytics programme launched three years earlier had deployed portfolio management software and a data platform, and neither was being used as intended.
STRATEGIC CHALLENGE
The programme had cost roughly USD 31 million against a business case promising research productivity improvement that nobody could measure (client-reported, unverified by MMA). Research leadership across all four business units had quietly disengaged, describing the portfolio tool as a reporting obligation, while finance was separately unable to obtain spend visibility by programme or by external partner.
MMA APPROACH
MMA examined what decisions the analytics were actually informing rather than what capability had been deployed, tracking every use of the portfolio tool across eighteen months. We interviewed 19 research leaders, the finance function, seven external partners and four vendors. Evaluation weighted decision attachment and data structure rather than analytical capability or the completeness of the deployed feature set.
KEY FINDINGS
  1. The portfolio tool had informed exactly four decisions in eighteen months, all at annual budget setting, and had been maintained continuously between them at substantial cost.
  2. Research leaders across three business units stated directly that they resisted the productivity metrics because they expected them to be used against long-horizon programmes.
  3. Finance had never been consulted on the programme despite spend visibility being the one requirement nobody disputed and which nobody in the organisation had yet managed to satisfy.
  4. Instrument and partner data reconciliation consumed 62% of the data platform effort, and only two of eleven sites had reached the structured state the design assumed.
RECOMMENDED STRATEGY
Phase 1: Reduce portfolio analytics to a lightweight annual and stage gate capability, and stop maintaining the continuous reporting that currently informs nothing at all. Phase 2: Reframe and fund spend analytics through finance as an accounting requirement, removing the productivity language that research leadership objects to. Phase 3: Concentrate the data platform on the two sites with structured instrument output and abandon reconciliation attempts at the remaining nine for now.
OUTCOME
Programme cost fell to roughly USD 12 million annually while finance obtained the spend visibility it had been requesting throughout (client-reported, unverified by MMA). Research leadership engagement improved once continuous productivity reporting was withdrawn, and the two structured sites reached production analytics within seven months.

Frequently Asked Questions

Foundational context covering the market sizes, CAGR, scope, country, region and competition that inform every finding below. This section is provided to cover basics and most often pre-purchase conversations, answered from the MMA Primary Research Dataset.

What is the current size of the Research And Development (RD) Analytics Market?

The market was worth USD 5.8 billion in 2025 and reaches USD 6.54 billion in 2026. Pharmaceutical and biotechnology research accounts for roughly 44% of that spending.

How large will the Research And Development (RD) Analytics Market be by 2036?

MMA forecasts USD 21.81 billion by 2036, an expansion of 3.33 times over the forecast period. That represents USD 15.27 billion of incremental annual revenue against 2026.

What is the CAGR for the Research And Development (RD) Analytics Market 2026 to 2036?

The base case is 12.8% compound annual growth, with a bull case at 14.0% and a bear case at 11.6%. Whether scientific data platforms consolidate the experimental record separates the scenarios.

Which segment is growing fastest?

Scientific and experimental data analytics grows at 19.2%, half again the market rate of 12.8%. Structured experimental records remove the integration work that consumes most other programmes.

Who are the major companies in the Research And Development (RD) Analytics Market?

Dassault Systemes, Planview, Certara, Benchling and IQVIA lead on measured software and services revenue. Together they hold roughly 29% across three traditions that rarely compete directly.

Which country is growing fastest?

China grows fastest at 17.2%, on pharmaceutical research expansion and domestic platform vendors serving research organisations that international suppliers have consistently found difficult to reach.

Report Segmentation Architecture

The full report scope spans multiple orthogonal segmentation dimensions, with cross-tabulated demand data provided for each dimension pair. Coverage extends further to regional breakdowns, trend trajectories, and the competitive detail needed to support segment-level decision-making.

By Primary Market Dimension

  • Portfolio Prioritisation and Stage Gate Analytics
  • Scientific and Experimental Data Analytics
  • Clinical and Trial Outcome Modelling
  • Research Spend and Resource Analytics
  • Intellectual Property and Landscape Analytics
  • External Collaboration and Partner Analytics

By End-Use Industry

  • Pharmaceutical and Biotechnology
  • Chemicals and Advanced Materials
  • Technology and Electronics
  • Industrial and Automotive Engineering
  • Consumer Goods and Food Science
  • Academic and Public Research

By Commercial Dimension

  • Research Function Direct Purchase
  • Finance and Corporate Budgets
  • Scientific Platform Attachment
  • Contract Research Organisation Supply
  • Public Research Funding Programmes
  • Consultancy and Integrator Delivery

By Region

  • North America
  • Western Europe
  • East Asia
  • South Asia and Pacific
  • Latin America
  • Middle East and Africa
  • Eastern Europe

Scope, Methodology, and Coverage

Every figure in this report is reproducible from documented input assumptions. The scope below maps the historical period, the forecast horizon, the segmentation dimensions, and the countries covered, alongside the underlying primary and qualitative methodology.
Historical Period
2020 to 2025
Forecast Period
2026 to 2036
Base Year
2025 (USD billions; MMA Primary Research Dataset, September 2026)
Market Definition
This market covers software and services that measure, model and support research and development decisions, spanning portfolio prioritisation and stage gate analytics, scientific and experimental data analytics, clinical and trial outcome modelling, research spend and resource analytics, intellectual property and landscape analytics, and external collaboration and partner analytics. Revenue is measured as software subscription and licence value plus directly attributable integration, modelling and advisory services at supplier level. Laboratory instruments and hardware, contract research and clinical trial execution services, general enterprise business intelligence platforms, and product lifecycle management sold without analytical capability are excluded.
Quantitative Units
USD billions, software subscription and attributable services revenue
Segmentation Dimensions
Analytical function, research industry, buyer type, region
Regions Covered
North America, Western Europe, East Asia, South Asia and Pacific, Latin America, Middle East and Africa, Eastern Europe
Countries Covered
United States, Canada, Mexico, Brazil, Chile, Switzerland, United Kingdom, Germany, Denmark, France, Netherlands, Sweden, Belgium, Ireland, Spain, Poland, Czechia, Hungary, China, Japan, South Korea, Taiwan, Singapore, India, Australia, Israel, United Arab Emirates, Saudi Arabia, South Africa
Key Companies Profiled
Dassault Systemes, Planview, Certara, Benchling, IQVIA, Sopheon, Sciforma, PTC, Siemens Digital Industries Software, Clarivate, Veeva Systems, Dotmatics, Simulations Plus, Cytel, PatSnap, Revvity Signals, LabVantage Solutions, Schrodinger, Aera Technology, Phesi
Quantitative Methodology
Primary survey, n=3,800 respondents, Q4 2025, six countries; demand-side model with trade association cross-validation
Qualitative Methodology
47 expert interviews, Q4 2025; applied to validate demand model assumptions, identify emerging dynamics, and assess competitive positioning
Report Format
PDF and XLSX data workbook (Word format preview document)
Publisher
Market Minds Advisory
Report Code
MMA-2026-TEC-921
Published
September 2026
Contact
sales@marketmindsadvisory.com | www.marketmindsadvisory.com

Purchase the full Research And Development (RD) Analytics Market Report (2026 to 2036).

The full MMA report explains why most research analytics programmes are data engineering projects and why research leaders resist the measurement being sold to them. It sizes the market to 2036 across six analytical functions, seven regions and 29 countries, with segment growth rates and regional demand mechanisms set out in full. Competitive analysis covers 20 participants assessed on measured software and services revenue, including moat and risk assessment for the two leaders. The report quantifies delivery cost structure, integration economics and margin architecture across three portfolio tiers. It closes with four strategic verdicts and an anonymised chemicals group engagement.
Six analytical functions sized to 2036
Seven regions with demand mechanism analysis
Twenty participants on consistent revenue basis
Integration effort and abandonment rate benchmarks
Margin architecture across three portfolio tiers
Anonymised chemicals research analytics programme engagement

Built For The People Who Decide

From boardroom strategy to bench-side execution, this report is read cover-to-cover by leaders shaping the next decade of their industry, turning demand scenarios, market dynamics and valuation benchmarks into decisions.
CXOs/ Presidents/ VPs/ Managers
M&A and Corporate Development
Strategy Teams and R&D Heads
Procurement and Product Directors
Regulatory and Compliance Leaders
Investor Relations and Equity Analysts