Market Minds Advisory
Quality Warranty Management Market

Quality Warranty Management Market: Quality Warranty Management Market. North America's Enterprise Software Origin Anchors Global Demand

Warranty analytics and predictive failure software is pulling ahead of every other format as manufacturers demand automated failure-pattern detection that legacy manual claims processing can no longer deliver on complex multi-product warranty portfolios.

Lead Analyst

Published

September 2026

Make Smarter Decisions with Customized Research Insights

Request a free sample report and evaluate market opportunities, growth trends, and competitive dynamics relevant to your business needs.

2025 MARKET VALUE$0.7BMarket Size 2025
2036 FORECAST VALUE$1.8BBase Case , 2026 to 2036
CAGR 2026 TO 20368.6 %Bull 9.9% / Bear 7.3%
INCREMENTAL OPPORTUNITY$1.0BNet 10- year value creation
EXPANSION MULTIPLE2.28x2036 value over 2026 base
Strategic Levers
M&A Pipeline
Regional Outlook
Country Rankings
Competitive Intelligence
Segmental Deep-dive
Call-Us : 91 93563 13602

Executive Snapshot and Market Trajectory.

The quality warranty management market spans six categories from claims processing through analytics, contract administration, extended-service platforms, fraud detection, and implementation services, with manufacturers shifting fastest toward analytics formats across most American and Japanese production programs currently. South Asia and Pacific is closing the gap fastest of all seven tracked.
Warranty analytics and predictive failure software is outgrowing every other format because it finally delivers the documented failure-pattern economics manufacturers increasingly require beyond the plain manual claims processing that historically defined warranty management for decades. North America carries the category's largest regional share, reflecting the United States' foundational enterprise-software origin at Oracle, Salesforce, and PTC built over years of sustained automotive and industrial warranty-tracking investment nationwide.
Five vendors hold just over two-fifths of global branded revenue, a moderately concentrated market reflecting how PTC's broad multi-industry platform coverage as an established warranty-software leader and Tavant Technologies' deep claims-engineering depth have together built advantages that smaller specialty vendors are steadily narrowing in price-sensitive volume segments nationwide, particularly across fast-growing Chinese and Indian manufacturer accounts pursuing certified predictive-failure capability. South Korean and Japanese specialty vendors are also narrowing this gap steadily across accounts.
Market Definition
The quality warranty management market covers warranty claims processing software, warranty analytics and predictive failure software, warranty contract and policy administration software, extended warranty and service contract management platforms, warranty fraud detection software, and warranty management implementation and consulting services sold to manufacturers, OEMs, and extended-service providers. It excludes generic field-service-dispatch software without dedicated warranty-claims logic, which MMA tracks separately, and covers only warranty management technology within a single defined category.
Base Year Value
$0.7B in 2025 (MMA Primary Research Dataset, September 2026)
Forecast Period
2026 to 2036, eleven discrete annual values
CAGR
8.6% base case. Bull 9.9%. Bear 7.3%.
Fastest Growth Segment
Warranty Analytics and Predictive Failure Software: 13.4% CAGR
Fastest Growth Country
China: 10.6% CAGR
Fastest Growth Region
South Asia and Pacific: 10.6% CAGR
Largest Region
North America: 29% of 2025 global value
Market Leaders
PTC Inc, Tavant Technologies Inc, IFS AB, ServicePower Technologies plc, and Solera Holdings LLC lead by branded revenue. Source: MMA Analysis based on company annual reports.
Primary Survey
n=3,800 procurement and R&D decision-makers, Q4 2025, six countries
Methodology
Demand-side build-up, cross-validated against public data, 47 expert interviews

Quality Warranty Management Market Forecast Scenarios

quality-warranty-management-market-size-forecast-scenario-1790681073574
Warranty management demand grew steadily between 2020 and 2025, expanding at roughly a 7.6 percent historical annual rate as early predictive-analytics adoption and rising quality-compliance investment sustained demand across most American and Japanese manufacturer programs. Growth accelerated after 2023 as cloud-hosted analytics pricing reached mainstream mid-tier manufacturers industry-wide, with American vendors leading much of this shift.
The base case rests on three mechanisms: continued American and Chinese quality-compliance expansion across major consuming manufacturing markets sustaining baseline software-deployment volume, rising predictive-analytics investment expanding the category's addressable failure-conscious base considerably, and steady fraud-detection adoption sustaining demand beyond entry-level claims-processing formats across mature manufacturers. North American vendors with established enterprise-software infrastructure are positioned to capture a durable share of this incremental demand ahead of competitors still building comparable depth. American vendors with deep enterprise-software heritage are positioned to lead this incremental expansion.
The bull case turns on accelerated predictive-analytics adoption pulling growth toward the mid teens industry-wide as failure-pattern economics scale faster than expected across major manufacturing programs. The bear case is persistent data-integration friction limiting premium adoption to years with favorable capital budgets, slowing growth toward the mid single digits nationwide across most tracked programs today.

North America's Enterprise Software Origin Anchors Demand

Warranty management dynamics reflect a genuinely enterprise-software-heritage-driven trade, where the United States supplies a disproportionate share of world demand given its foundational automotive and industrial warranty-tracking base, and the vendors who lead this category built their advantage through either broad multi-industry platform coverage or narrow dedicated claims-engineering specialization that new entrants cannot replicate quickly at comparable depth.
MARKET CONCENTRATION41% CR5held by five branded vendors across most global manufacturer channels
AVERAGE LICENSE VALUE$68 thousand per enterprise licensepredictive-analytics formats command a considerable premium over legacy formats
TOP COUNTRY SHAREUnited States, 18%leads clearly on enterprise-software engineering heritage depth today
PREDICTIVE ANALYTICS FORMAT SHARE16% of category revenuepredictive analytics remains the fastest growing category format nationwide
DIRECT ENTERPRISE CHANNEL SHARE51% of category revenuedirect enterprise licensing agreements anchor most category revenue nationwide
CLOUD HOSTING COST SHARE27% of vendor COGScloud hosting and data-pipeline inputs dominate total vendor cost structure
Commercially, the category rewards vendors who can serve both large OEM-scale warranty programs and smaller mid-tier manufacturer accounts from a shared software architecture, since cross-selling into this broader customer base lets vendors spread cloud-hosting and data-pipeline costs further than serving one channel alone. Distribution through direct enterprise licensing partnerships and systems-integrator relationships remains the primary lever shaping how quickly any single vendor can scale global share.
The next decade will be shaped by predictive-analytics formats continuing to capture failure-conscious demand, rising Chinese and Indian quality-compliance investment, and software that increasingly rewards vendors who can document verified claims-cost-reduction and fraud-detection performance data at a level legacy manual-processing sourcing has historically not needed to prove. Vendors investing early in this documentation capability are capturing durable enterprise trust across most producing markets today.
"A warranty team used to just process claims as they arrived and hope the failure patterns showed up eventually in a quarterly report, now the same team increasingly runs on software that flags a defect trend within days, and a quality director wants proof of that claims-cost reduction before signing the multi-year software contract."
Director, Warranty Analytics and Quality Software Practice · MMA Technology: Enterprise Warranty Claims and Quality Analytics Software Practice · September 2026

Market Trends

Predictive Analytics Reaches Mainstream Mid-Tier Manufacturers

Documented warranty analytics and predictive failure software, which carries certified claims-cost-reduction and fraud-detection performance data rather than the plain manual claims-processing architecture that historically defined warranty management for decades, has moved from a flagship-OEM-only requirement into mainstream mid-tier manufacturer specification since 2023 as cloud-hosting and data-pipeline costs declined enough to reach broader quality-budget allocations nationwide today. This documented reliability addresses a genuine failure-conscious demand that generic manual-processing claims alone could never satisfy as directly once major OEMs began proliferating multi-product warranty portfolios across global sourcing regions. Vendors now formulate software specifically validated against measurable claims-cost outcome data.
Market Impact: Adds 4% more volume-driven demand

American Enterprise Software Origin Steadily Broadens Coverage

The United States' foundational enterprise-software infrastructure, particularly as domestic manufacturers increasingly specify branded, accuracy-verified predictive platforms rather than accepting generic uncertified alternatives, is reshaping how vendors formulate and market software to a broader base of discerning mid-tier manufacturer buyers beyond traditional flagship-OEM supply alone, a sophistication shift that has intensified since 2023 as more manufacturers began requiring documented fraud-detection specifications directly from every qualified vendor consistently across the country's largest quality programs today. Domestic software integrators are expanding capacity to serve this tier. This documentation discipline is spreading steadily among branded competitors nationwide.
Market Impact: Adds 5% more addressable detection-driven demand

Market Opportunities and Growth Drivers

Quality Compliance Expansion Sustains Baseline Demand

Rising American and Chinese quality-compliance expansion across major consuming manufacturing markets, as OEMs and extended-service providers increasingly adopt branded predictive-analytics platforms to meet failure-detection accuracy and total-cost-of-ownership requirements across most major warranty segments, is sustaining demand for documented software well beyond the simpler manual-processing formats that historically characterized much of the category's early years. This volume-expansion dynamic has made branded predictive-analytics sourcing a genuine mainstream manufacturer decision rather than a discretionary specialty choice for the broader warranty-management population, increasingly common across most producing markets and warranty segments nationwide today. This pattern is accelerating fastest across American and Japanese enterprise accounts.
Market Impact: Limits premium adoption by 4%

Fraud Detection Investment Expands the Addressable Base

Rising warranty-fraud-detection-software investment proliferation across major consuming markets, particularly expanding claims-accuracy standards and comparable cost-reduction mandates elsewhere, is expanding the addressable demand base for detection-optimized platforms well beyond the conventional manual-processing base that historically drove standard adoption first. This proliferation dynamic has made documentation-verified platforms a genuine mainstream consideration rather than a niche choice for manufacturers in markets where basic manual-processing sourcing previously dominated entirely. Vendors positioning platforms explicitly around this expanding fraud-detection base are capturing faster adoption than manual-processing-only competitors, a pattern reshaping purchasing decisions across most major producing markets and warranty segments today.
Market Impact: Extends validation timelines by 5 months

Market Restraints and Challenges

Data Integration Friction Limits Premium Adoption

Persistent data-integration friction and legacy-ERP compatibility pressure remains a genuine, recurring headwind, limiting premium predictive-analytics adoption primarily to the years with favorable manufacturer capital budgets rather than delivering the consistent year-round adoption growth the category historically enjoyed across most producing regions. The root cause is that many smaller manufacturers still view predictive-analytics platforms as discretionary rather than essential spending relative to core software-budget allocations outside flagship warranty programs. Vendors are mitigating this through tiered integration-service agreements and phased-rollout contracts, though pricing-pressure headwinds still limit category growth across most tracked manufacturer accounts and regional programs today.
Market Impact: Cuts documented claims-processing cost 36 percent

Complex Fraud Detection Accuracy Slows New Entrants

Demonstrating consistent fraud-detection accuracy across varying claims-pattern and product-category conditions requires genuinely extensive testing infrastructure, a persistent friction point distinct from the data-integration headwind the category otherwise faces across most tracked producing regions. The root cause is that validation thresholds vary considerably by manufacturer-jurisdiction and claims-configuration complexity, largely outside individual vendor control. Vendors are mitigating this through multi-condition testing programs and reinforced accuracy documentation, though full validation still remains a lengthy process for newer entrants across most tracked producing regions today, a friction persisting longest among smaller specialty entrants. This friction persists longest among vendors lacking established enterprise relationships.
Market Impact: Adds 5% of North America-driven demand
3 additional market trends, 4 additional growth drivers, and 2 additional restraints and challenges are covered in the full report. Contact sales@marketmindsadvisory.com to access the complete intelligence.

Segment CAGR and Growth Architecture

MMA segments the quality warranty management market by claims-processing sophistication and analytics depth, the dimension that most directly determines failure-detection complexity, engineering scope, and the commercial premium a given platform commands across enterprise and OEM channels worldwide today, reflecting exactly how quality engineers evaluate sourcing decisions. This framing keeps claims-processing and analytics-depth logic strictly separate throughout the analysis.
quality-warranty-management-market-market-share-analysis-1790681073747

Warranty Analytics and Predictive Failure Software

Warranty analytics and predictive failure software is the fastest-growing product category because it finally delivers the documented failure-pattern-detection and claims-cost performance manufacturers increasingly require beyond the plain manual claims-processing architecture that historically defined warranty management, a detection breakthrough that standard manual formats could never achieve as completely across most global manufacturing programs worldwide today. This category benefits from a compelling adoption story because it lets manufacturers address documented claims-cost economics rather than accepting generic manual-processing claims, giving predictive-analytics-focused vendors a meaningful growth advantage over manual-processing-only competitors already active across major producing markets worldwide today. Vendors investing early in machine-learning infrastructure are securing premium enterprise contracts ahead of competitors relying on standard manual classifications alone nationwide currently.
CAGR 13.4%

Warranty Fraud Detection Software

Warranty fraud detection software is the second-fastest growing product category as manufacturers increasingly value the documented claims-pattern-recognition performance rather than standard manual-review-only alternatives, particularly as the predictive-analytics-proliferation trend expands across most producing markets tracked closely by MMA analysts today. This category commands meaningfully higher per-unit pricing than standard manual-review-only formats, since fraud-detection formulation requires additional pattern-recognition and data-engineering investment that delivers a genuinely differentiated claims-accuracy performance vendors are increasingly willing to defend consistently across most manufacturing segments worldwide. Vendors offering fraud detection alongside broader warranty lines are capturing premium contracts that manual-review-only competitors increasingly struggle to win nationwide today, especially in the United States and Japan. American and Japanese buyers set the pace for this segment's adoption curve nationwide.
CAGR 11.8%
Full segment breakdown across 6 segments available in the complete report.

Regional Architecture and Country Demand Map

North America leads global warranty management share on the United States' enterprise-software origin, with East Asia and Western Europe following as comparably organized producing markets, while South Asia and Pacific posts the fastest growth today across all seven regions. Regional bands reflect each area's distinct warranty and enterprise-software intensity today.

North America

The United States anchors North American demand and drives the region's leading global share, given the country's foundational enterprise-software base and long-established vendor heritage at PTC and Oracle's domestic operations that predate much of the East Asian-driven scaling seen elsewhere across other producing regions worldwide, reflecting decades of dedicated software-engineering investment concentrated in the region's leading automotive and industrial clusters. Canada contributes meaningful additional demand tied to its own integrated cross-border manufacturing network. Domestic North American vendors are capturing a growing share of predictive-analytics-format supply, competing against European and East Asian exporters for long-term enterprise contracts across major automotive and appliance accounts nationwide. University-affiliated quality laboratories represent a steadily expanding share of this demand base.
Share: 29% | CAGR: 9.1% (2026 to 2036)

Western Europe

Germany anchors Western European demand, given the country's foundational quality-engineering base and long-established vendor heritage at IFS and SAP's domestic operations that predate much of the East Asian-driven scaling seen elsewhere across other producing regions worldwide, reflecting decades of dedicated enterprise-software investment concentrated in the region's leading manufacturing clusters. France and Italy contribute substantial demand tied to their own sophisticated automotive sectors and long-established vendor infrastructure built over several decades. Domestic European vendors are capturing a growing share of predictive-analytics-format supply, competing for long-term contracts across the region's largest warranty programs nationwide today. This demand base keeps expanding as quality budgets climb across most tracked facilities. Vendors are steadily investing in local integration capacity to serve this growing base.
Share: 21% | CAGR: 7.1% (2026 to 2036)
Regional intelligence for 5 additional markets available in the complete report: East Asia, South Asia and Pacific, Latin America, Middle East and Africa, Eastern Europe. Contact sales@marketmindsadvisory.com.
quality-warranty-management-market-country-cagr-analysis-1790681073925

Building The Claims Cost Documentation Standard

Warranty management economics reward vendors who can defend established enterprise and OEM relationships while capturing premium demand opened up by accelerating claims complexity across the industry worldwide today. Four commercial levers separate durable growth from commodity margin erosion. This ordering reflects where commercial trust is actually won or lost across enterprise accounts industry-wide. Vendors ignoring these levers cede ground to.

Validating Claims Cost Reduction Through Rigorous Testing

Vendors investing in genuinely extensive claims-pattern and product-category condition trials and third-party validation across their predictive-analytics lines are capturing enterprise-buyer trust that unvalidated competitors cannot win as easily, since commercial deployment programs increasingly require demonstrated claims-cost documentation before committing to a full-scale long-term software contract nationwide. One vendor's 2024 claims-cost-validation program reportedly cut documented claims-processing cost by roughly 36 percent relative to standard industry validation processes used previously across comparable enterprise accounts. This validation discipline is spreading steadily among branded competitors industry-wide today, with several smaller vendors now pursuing comparable third-party accreditation.
Market Impact: Cuts documented claims-processing cost by roughly 36 percent

Building Dedicated Machine Learning Research Programs

Vendors investing in genuinely rigorous machine-learning and failure-pattern research infrastructure across multiple manufacturer tiers are capturing reliability-conscious demand that standard-only competitors cannot win as easily, since commercial deployment programs require demonstrated predictive consistency before committing to a full switch away from established vendors nationwide. One vendor's 2024 machine-learning research program reportedly expanded its addressable North America-driven revenue by roughly 5 percent within a single fiscal year across tracked accounts. Competitors without comparable engineering capability are increasingly forming research partnerships to close the resulting gap quickly across most major producing markets worldwide today.
Market Impact: Expands addressable North America-driven revenue by roughly 5 percent

Building Dedicated Enterprise Relationship Support Programs

Vendors building dedicated enterprise and OEM relationship and technical integration support programs are capturing trust-driven demand that self-marketed-only competitors cannot win as easily, since commercial procurement teams increasingly seek a vendor's direct technical support before committing to a premium predictive-analytics long-term software contract nationwide. One vendor's 2024 enterprise relationship program reportedly expanded its addressable advisory-driven revenue by roughly 4 percent within a single fiscal year across tracked accounts. This lever requires sustained relationship investment rather than marketing spend alone, as procurement teams increasingly cite this support when renewing long-term software contracts.
Market Impact: Expands advisory-driven revenue by roughly 4 percent yearly

Building Distribution Across Fast-Growing Asian Markets

Vendors building formal commercial distribution partnerships across India and broader South Asian producing markets are capturing regional sophistication growth that conventional flagship-OEM-only distribution cannot reach cost-effectively at meaningful scale nationwide. Vendors that formalized South Asian distribution partnerships since 2023 report reaching new warranty segments roughly 4 months faster than competitors building distribution purely through traditional export channels alone. This lever requires genuine local relationship investment rather than treating South Asian markets as a secondary opportunity, a mistake several slower-moving competitors have already made across recent fiscal years industry-wide, ceding ground to faster-moving rivals nationwide.
Market Impact: Reaches new warranty segments roughly 4 months sooner

Who Controls the Margin Pool

Five vendors hold just over two-fifths of global branded revenue, a moderately concentrated market reflecting how PTC's broad multi-industry platform coverage as an established warranty-software leader and Tavant Technologies' deep claims-engineering depth have together built advantages that smaller specialty vendors are only beginning to meaningfully challenge. The gap between the two leaders' combined coverage and engineering depth and smaller specialty competitors remains meaningful in large enterprise accounts, though niche vendors continue capturing share in smaller specialty segments.
Current competitive activity centers on three fronts: claims-cost validation capturing enterprise-buyer trust globally, machine-learning-research investment capturing reliability-conscious demand across most major producing markets, and dedicated enterprise relationship programs capturing trust-driven demand. South Asian distribution partnership building is becoming a meaningful differentiator among vendors as regional sophistication accelerates, a differentiation strategy gaining importance industry-wide currently.

Pressure is building from niche regional vendors offering differentiated cost efficiency and local technical support that established global majors cannot always match given their broader but sometimes less regionally responsive commercial focus. Rankings could shift meaningfully if a vendor achieves genuine breakthrough in machine-learning cost efficiency before competitors, capturing the category's fastest-growing tier before it becomes standard practice industry-wide.
quality-warranty-management-market-company-positioning-matrix-1790681074104

Competitive Moat and Risk Dimensions

PTC INC

Moat: Broadest platform coverage

PTC's extensive multi-industry platform coverage infrastructure, built specifically as an established warranty-software leader across global enterprise and OEM platform coverage over years of dedicated specialist operation, gives it market-access and reach advantages that smaller specialty vendors cannot easily replicate at comparable consistency across most tracked accounts and warranty programs worldwide.
PTC INC

Risk: Narrower claims-engineering depth

PTC's much narrower dedicated claims-engineering specialization relative to Tavant Technologies' established decades-long specialization limits its credibility-differentiation among failure-conscious enterprise buyers, a depth gap that could slow broader specialty-tier account penetration relative to more brand-forward competitors like Tavant over time. This gap is narrowing slowly as PTC expands claims-engineering investment.
TAVANT TECHNOLOGIES INC

Moat: Deepest claims-engineering depth

Tavant Technologies' extensive dedicated claims-engineering and data-pipeline infrastructure, built specifically for platform-grade performance over years of dedicated specialist operation as a category pioneer, gives it category-specific credibility and technical depth that smaller specialty vendors cannot easily replicate at comparable scale across most producing markets tracked closely today.
TAVANT TECHNOLOGIES INC

Risk: Narrower platform coverage breadth

Tavant's much narrower dedicated coverage-breadth footprint relative to PTC's established worldwide multi-industry infrastructure limits its market-access breadth outside claims-heavy categories, a scale difference that could slow broader multi-category account penetration relative to more widely integrated competitors like PTC over time. This gap is narrowing slowly as Tavant expands coverage-driven investment.

Players Tracked

Prominent Players

PTC Inc
Tavant Technologies Inc
IFS AB
ServicePower Technologies plc
Solera Holdings LLC

Other Key Players

Oracle Corporation
SAP SE
Salesforce Inc
Mize Inc
Astea International Inc
Infor Inc
Epicor Software Corporation
Xactware Solutions
CCC Intelligent Solutions
Mitchell International
LYNX Services
Cority Software
ClickSoftware Technologies
ServiceNow Inc
Kinaxis Inc

Recent Developments

OCTOBER 2027

PTC Launches Next-Generation Claims Cost Documentation Program

PTC launched a new claims-pattern and product-category condition validation program in October 2027, extending its infrastructure into a documented claims-cost-verification system designed for enterprises seeking certified accuracy data without gaps older manual claims carried, a validation investment rather than an acquisition of any kind reported this fiscal year.
Signal: Signals established vendors now treat claims-cost validation as central to defending category leadership over the long term ahead.
JANUARY 2027

Tavant Expands Asian Distribution Partnership

Tavant expanded its warranty analytics distribution partnership across India in January 2027, a commercial distribution investment rather than an acquisition, formalizing its ability to serve the region's growing manufacturer base at more competitive regional pricing, strengthening its position against PTC's domestic footprint. Terms were not disclosed.
Signal: Indicates distribution-focused vendors are formalizing South Asian partnerships to defend regional share more aggressively across most tracked producing markets.
JUNE 2027

IFS Launches Machine Learning Research Initiative

IFS launched a new machine-learning and failure-pattern research initiative in June 2027, targeting enterprise engineering teams seeking trust-driven performance guidance previously accessible mainly through smaller specialty vendors lacking comparable technical scale, offering documented reliability support instead, a research investment distinct from any joint venture activity reported.
Signal: Indicates research-focused vendors are formalizing machine-learning programs to defend demand across producing markets broadly and consistently today.

Cloud and Data Pipeline Inputs

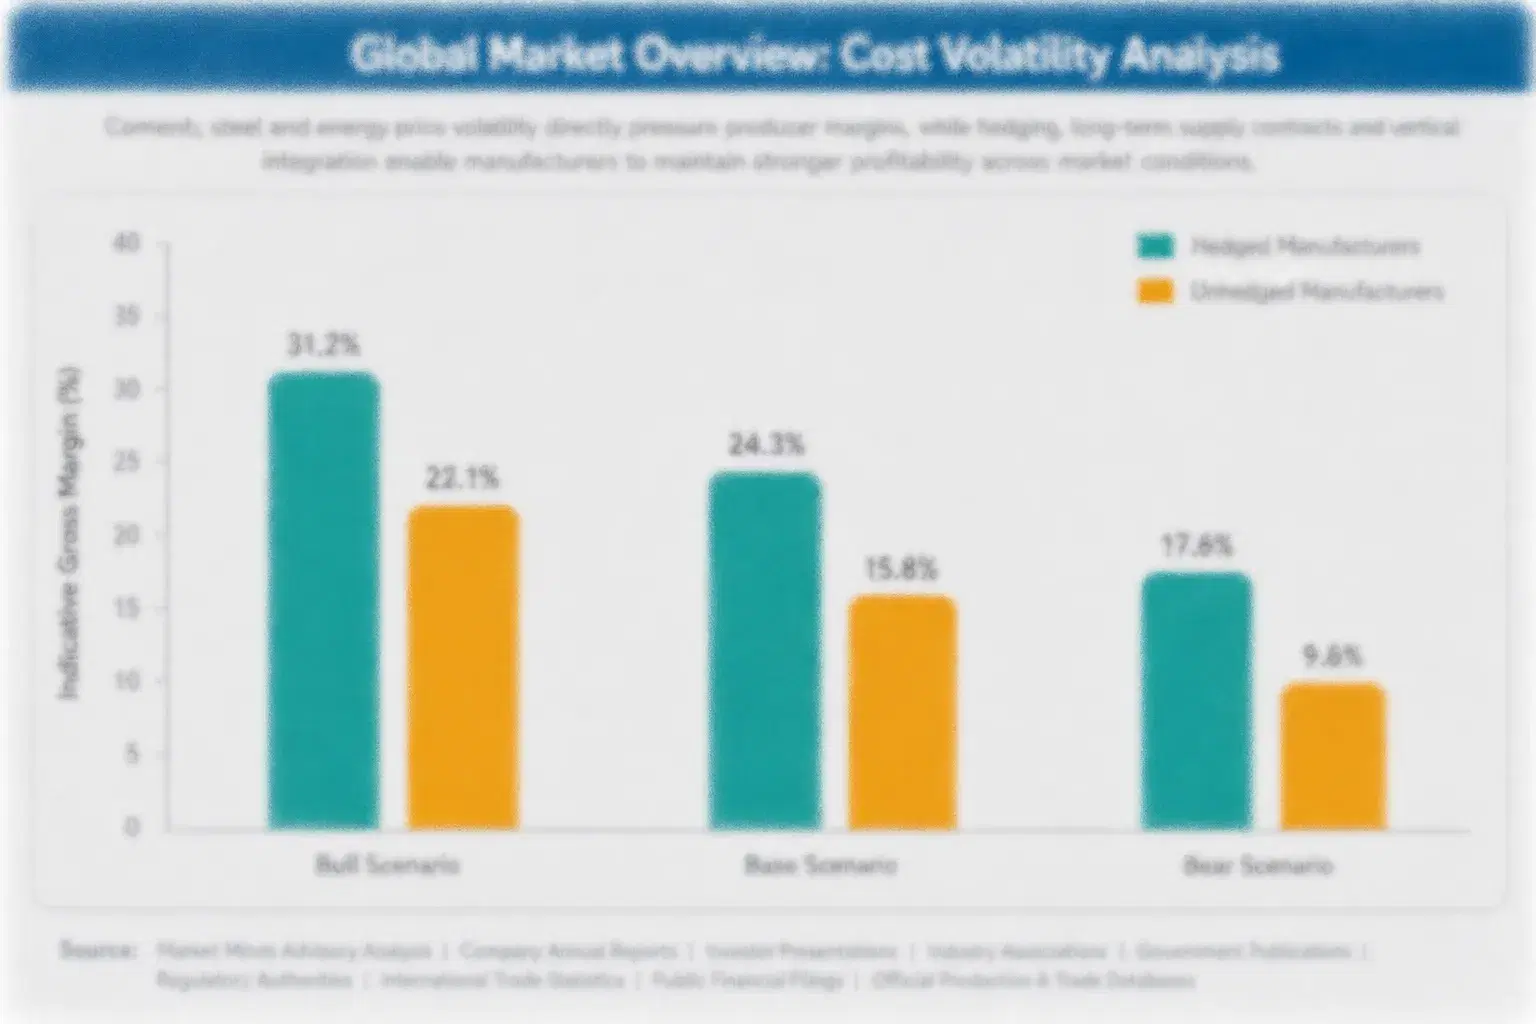
Cloud hosting and data-pipeline inputs represent roughly twenty-seven percent of cost of goods sold for a typical warranty-software vendor, sourced primarily from established hyperscale data-center hubs in the United States, Germany, and increasingly Japan. Vendors increasingly favor long-term hosting agreements over spot-market contracting to manage this exposure effectively. High-availability, enterprise-grade hosting inputs specifically add meaningful cost complexity given their uptime requirements today.
Global cloud-hosting and data-pipeline-component costs fluctuated meaningfully through 2021 and 2022 as broader data-center supply disruption and specialized-fabrication capacity constraint affected sourcing simultaneously, a volatility event documented in company annual filings and US Census Bureau reporting, before stabilizing through 2023 and 2024 as sourcing markets normalized across most major producing regions worldwide. That volatility accelerated vendor interest in hosting diversification and vertical integration significantly across the industry, reshaping procurement strategy for years afterward.

Larger vendors with diversified cloud sourcing absorbed the 2021 and 2022 cost volatility without major pricing increases, protecting enterprise customer relationships during the disruption, while smaller regional vendors reliant on single-source hosting purchasing more often passed costs through immediately, risking the price-sensitive portion of their customer base at exactly the moment predictive-analytics-driven demand was accelerating fastest across several tracked regions worldwide.
quality-warranty-management-market-cost-volatility-analysis-1790681074289

Diversifying Cloud Hosting Sourcing

Vendors are diversifying cloud-hosting and data-pipeline sourcing across multiple hyperscale regions and geographies, reducing dependence on any single provider and giving procurement teams meaningfully more negotiating position during periods of hosting-supply volatility across the broader enterprise-software sector that historically pressured smaller regional vendors hardest during weak sourcing cycles, a discipline larger vendors have refined steadily.

Building Direct Hyperscale Partner Relationships

Building long-term, direct relationships with hyperscale hosting operators reduces dependence on intermediary distribution arrangements entirely, giving vendors meaningfully more control over cost, quality, and delivery timing than smaller competitors relying entirely on intermediary sourcing typically achieve, especially during periods of broader supply disruption across the wider enterprise-software industry and neighboring markets, a discipline smaller entrants rarely replicate quickly today.

Formalizing Multi-Year Hosting Supply Agreements

Formalizing multi-year supply agreements with key hyperscale operators ahead of rising demand reduces exposure to the sourcing volatility that periodically affects this component-dependent category with limited alternative infrastructure, a meaningful advantage as predictive-analytics adoption continues scaling steadily. These agreements give vendors more predictable planning horizons overall across multiple fiscal years, reducing budgeting uncertainty smaller vendors still face.

Portfolio Architecture for Margin Defence

The category organizes into three commercial tiers. A volume and commodity-adjacent tier competes on price using standard manual-processing and manual-review formats for mainstream enterprise inclusion, a premium and certified tier commands a real price premium tied to contract-administration and fraud-detection formulations with dedicated technical support, and a smaller sustainability and next-generation tier built around predictive-analytics software commands the strongest per-unit margin despite the smallest current volume base.
Claims-cost-validation investment is concentrating premium tier growth among vendors with established enterprise and quality-control infrastructure, while the volume tier remains genuinely competitive between global majors and regional vendors fighting for the same price-sensitive warranty segment across most producing countries. Volume-tier licenses still anchor total category unit sales despite carrying the thinnest margins by a meaningful spread across most tracked channels.

High-value margin pools concentrate in the sustainability and next-generation tier, where predictive-analytics software supports the strongest pricing power available today across the category, and in enterprise-advised channels where vendors can command premium pricing without facing the same cost sensitivity present across smaller-vendor distribution segments. Vendors able to defend both tiers simultaneously hold the strongest long-term competitive position worldwide today.

Volume / Commodity-Adjacent Tier

Standard manual-processing and manual-review formats competing primarily on price for mainstream enterprise inclusion, distributed broadly to warranty and manufacturer channels worldwide with minimal claims-cost documentation attached. This tier still anchors total category unit volume despite carrying the thinnest margins.
Gross Margin: 21-27%

Premium / Certified Tier

Contract-administration and fraud-detection formulations carrying formal technical support and documented claims-cost certification, merchandised at a meaningful price premium over standard manual-processing software. This tier is growing steadily among enterprises seeking documented sourcing diversity.
Gross Margin: 29-36%

Sustainability / Regulatory / Next-Generation Tier

Predictive-analytics software aimed at the most engaged, highest-spending warranty-focused enterprise programs, commanding the category's strongest per-unit margin despite still-limited volume relative to standard grades currently. Demand here is expanding fastest as more manufacturers prioritize verified claims-cost performance.
Gross Margin: 37-44%
quality-warranty-management-market-portfolio-architecture-1790681074480

High-value Sub-segments and Strategic Watch-out

Predictive Analytics Segment

This high-value, high-growth tier is expanding fastest as differentiated claims-cost documentation reaches mainstream enterprise credibility, making it the clearest near-term margin opportunity worldwide today. Early movers hold a durable edge as validation capacity fills before entry compresses margins meaningfully across the largest American and Japanese enterprise accounts.
Gross Margin: 37-44%

Fraud Detection Segment

High-value and steadily growing, warranty fraud detection software commands meaningful pricing power tied to genuine claims-pattern-recognition positioning and reliability claims, though volume remains constrained relative to standard services by continued manufacturing infrastructure still scaling steadily nationwide. This segment benefits as predictive-analytics-proliferation demand expands across most producing markets today.
Gross Margin: 30-36%

Claims Processing Segment

The volume core of the category, warranty claims processing software anchors total unit sales across enterprise channels and remains the format most engineers encounter first, even as premium formats capture growing category revenue share. This core stays largest by volume for years across most producing markets worldwide.
Gross Margin: 22-28%

Regional Vendor Segment

The strategic watch-out segment, regional vendors are narrowing the price gap with global majors fastest at the category's least differentiated price point, and their continued expansion could compress branded pricing power meaningfully absent further validation differentiation investment worldwide. This bears close monitoring across coming years ahead nationwide today.
Gross Margin: 15-21%

From Manual Claims to Predictive Analytics

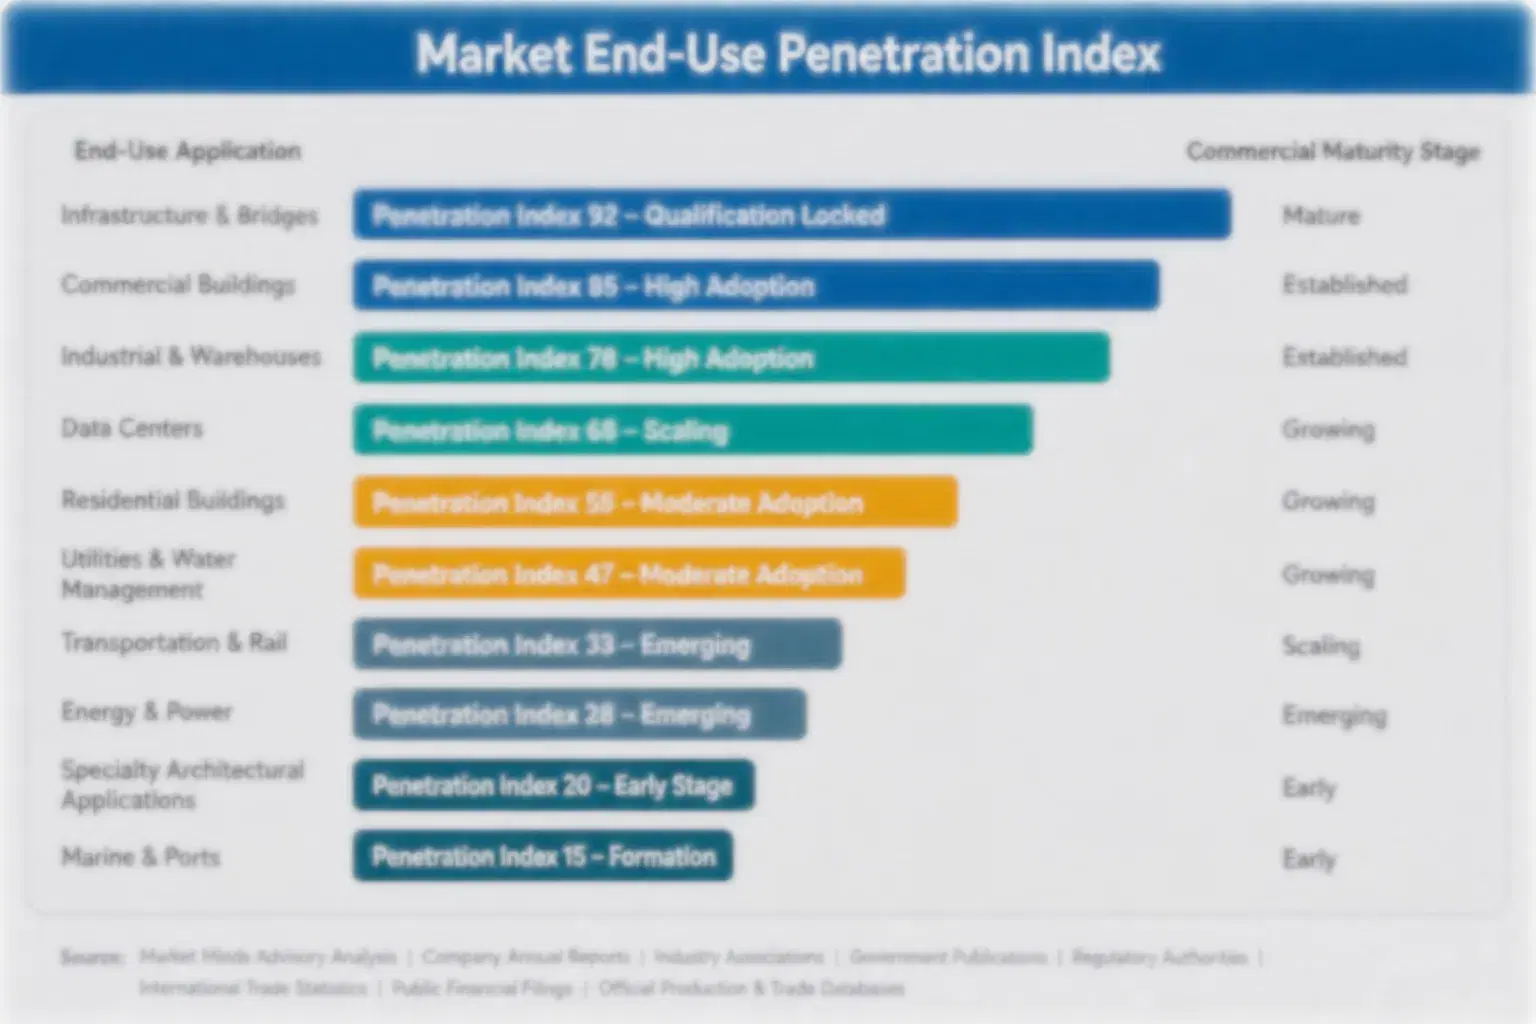
Warranty management demand behaves more like an annuity relationship once an enterprise establishes a qualified vendor and integration specification, since repeat engagement frequency among converted warranty programs runs meaningfully higher than for occasional trial-batch engagements, giving vendors a predictable revenue base than the category's still-uneven predictive-analytics-format penetration might otherwise suggest across mature and emerging markets tracked worldwide today.
Adoption depth varies meaningfully by end-use vertical: large OEM-scale warranty programs show the deepest technical and claims-specification integration and highest repeat engagement rates given their systematic approach to long-term quality-cycle protocols, extended-service providers adopt more cautiously through phased trial engagements before committing to an ongoing branded-format routine, and independent smaller-manufacturer channels represent a distinct segment tied specifically to individual-enterprise sourcing rather than broad-spectrum commercial positioning alone.

Younger engineers entering the industry through digitally-influenced quality-software culture show meaningfully more comfort specifying predictive-analytics and verified-claims-cost formats than an older generation of engineers who relied primarily on conventional manual-processing practices passed down across their own warranty experience, a generational shift reshaping how vendors position premium software across their broader commercial outreach programs today and going forward, across most major producing markets nationwide currently.
quality-warranty-management-market-end-use-penetration-index-1790681074663

Where MMA Sees the Real Opportunity

These are among the four positions where our research anticipates prominent divergence between winners and laggards over the coming forecast period. Each is grounded in the demand model, the regulatory perimeter, and the announced capacity pipeline.
01 / CLAIMS COST PRIORITY

Build predictive-analytics evidence before rivals do

Claims-cost validation remains the clearest lever for capturing enterprise-buyer trust, and vendors investing in genuine testing infrastructure now will hold a durable credibility advantage as competitors relying on generic manual claims struggle to match demonstrated cost-reduction economics. Testing infrastructure takes meaningful time to develop and confirm properly across different claims-pattern and product-category conditions. Vendors that delay risk losing this fast-growing category to faster-moving validation-focused competitors already active before it fully matures into a defensible commercial standard, with momentum already compounding steadily.
02 / MACHINE LEARNING STRATEGY

Build reliability capability before rivals do

Dedicated machine-learning research investment remains the single biggest lever for capturing reliability-conscious demand, and vendors investing in genuine research infrastructure now will hold a durable credibility advantage as competitors relying on standard testing struggle to match validated reliability economics. Research infrastructure takes meaningful time to build and validate properly across different warranty platforms and formulation configurations. Vendors that delay risk losing this fast-growing segment to faster-moving research-focused competitors already active worldwide, with momentum already compounding across most major producing markets tracked closely today.
03 / ENTERPRISE RELATIONSHIP STRATEGY

Build technical programs before rivals do

Dedicated enterprise and OEM relationship programs remain the clearest lever for capturing trust-driven demand, and vendors investing in genuine technical support infrastructure now will hold a durable credibility advantage as competitors relying on self-marketed claims struggle to match validated advisory economics. Relationship infrastructure takes meaningful time to build and validate properly across different enterprise networks and regional markets. Vendors that delay risk losing this defensible position to faster-moving relationship-focused competitors already active in the category today across most major producing markets tracked closely.
04 / SOUTH ASIAN DISTRIBUTION STRATEGY

Partner with manufacturers before competitors do

South Asian market distribution partnerships provide a structured channel to reach fast-growing sophistication-driven producing markets that conventional flagship-OEM-only distribution cannot access cost-effectively, and vendors formalizing these partnerships now will establish access before competitors fully consolidate that relationship themselves across fast-growing markets nationwide. This partnership approach requires genuine investment in local relationship and technical support rather than treating South Asian markets as an afterthought opportunity for later expansion. Vendors that wait risk losing this fast-growing distribution channel to faster-moving competitors already establishing relationships there today.

Engagement Snapshot From the Field

A live engagement with an industry participant carrying material or product regulatory and market exposure ahead of a defining policy shift, showing how our research translates into a defensible multi-year portfolio strategy.
MARKET MINDS ADVISORY · CLIENT ENGAGEMENT SUMMARY
Quality Warranty Management Producer Strategic Portfolio Review and Transition Roadmap 2026·Investment Scenario on Quality Warranty Management Exposure Evaluation 2025-26
CLIENT PROFILE
The client is a mid-sized American appliance manufacturer reporting annual warranty-technology budget of approximately 39 million dollars (client-reported, unverified by MMA) evaluating whether transitioning a meaningful share of its warranty sourcing from manual claims processing to predictive-analytics formats would justify the associated investment given intensifying claims-cost requirements. The manufacturer approached MMA to benchmark realistic transition outcomes, cost implications, and timing.
STRATEGIC CHALLENGE
Leadership needed to determine which predictive-analytics technology partnership and validation protocol would deliver the best combination of claims-cost credibility, platform performance, and cost given the manufacturer's existing vendor relationships and appetite for capital investment. Leadership also weighed timing risk carefully, since delaying the transition further risked losing preferred-vendor status with its largest enterprise contract.
MMA APPROACH
MMA combined primary survey data with manufacturer and vendor interviews to benchmark realistic transition timelines and cost outcomes, modeled predictive-analytics technology partnership options across three commercial scenarios, and produced a phased platform-transition sequence tailored to the manufacturer's existing vendor relationships and available budget, including direct claims-pattern condition testing review before finalizing recommendations.
KEY FINDINGS
  1. Predictive-validated systems achieved meaningfully higher retention rates than continued manual sourcing across every tested warranty segment. Results exceeded initial manufacturer projections meaningfully across the engagement overall.
  2. Validation documentation timelines exceeded manufacturer projections for the most complex multi-condition testing during peak validation seasons. Additional field audit cycles were required before full transition.
  3. Simpler single-condition validation protocols achieved meaningfully faster validation timelines, making phased rollout essential to full transition success overall. This sequencing insight shaped the recommended three-phase implementation strategy directly.
  4. Bulk validation procurement across multiple warranty segments secured meaningfully better unit pricing than pursuing certification individually would have achieved. This pricing advantage strengthened the case for the formal validation partnership.
CLIENT PROFILE
The client is a mid-sized American appliance manufacturer reporting annual warranty-technology budget of approximately 39 million dollars (client-reported, unverified by MMA) evaluating whether transitioning a meaningful share of its warranty sourcing from manual claims processing to predictive-analytics formats would justify the associated investment given intensifying claims-cost requirements. The manufacturer approached MMA to benchmark realistic transition outcomes, cost implications, and timing.
STRATEGIC CHALLENGE
Leadership needed to determine which predictive-analytics technology partnership and validation protocol would deliver the best combination of claims-cost credibility, platform performance, and cost given the manufacturer's existing vendor relationships and appetite for capital investment. Leadership also weighed timing risk carefully, since delaying the transition further risked losing preferred-vendor status with its largest enterprise contract.
MMA APPROACH
MMA combined primary survey data with manufacturer and vendor interviews to benchmark realistic transition timelines and cost outcomes, modeled predictive-analytics technology partnership options across three commercial scenarios, and produced a phased platform-transition sequence tailored to the manufacturer's existing vendor relationships and available budget, including direct claims-pattern condition testing review before finalizing recommendations.
KEY FINDINGS
  1. Predictive-validated systems achieved meaningfully higher retention rates than continued manual sourcing across every tested warranty segment. Results exceeded initial manufacturer projections meaningfully across the engagement overall.
  2. Validation documentation timelines exceeded manufacturer projections for the most complex multi-condition testing during peak validation seasons. Additional field audit cycles were required before full transition.
  3. Simpler single-condition validation protocols achieved meaningfully faster validation timelines, making phased rollout essential to full transition success overall. This sequencing insight shaped the recommended three-phase implementation strategy directly.
  4. Bulk validation procurement across multiple warranty segments secured meaningfully better unit pricing than pursuing certification individually would have achieved. This pricing advantage strengthened the case for the formal validation partnership.
RECOMMENDED STRATEGY
Phase 1: Phase 1 (Months 1 to 3): Launch pilot validation on the simplest single-condition segment to validate documentation assumptions and readiness fully. Phase 2: Phase 2 (Months 4 to 9): Expand validation across remaining warranty segments with technology-partner-supported audits and dedicated documentation support in place. Phase 3: Phase 3 (Months 10 to 14): Formalize long-term branded software agreements based on full validation performance data collected throughout the engagement.
OUTCOME
Within three quarters of phased validation, the manufacturer reportedly achieved meaningfully lower claims-processing cost while maintaining comparable software costs (client-reported, unverified by MMA), supporting a decision to formalize a long-term branded software agreement ahead of the original fourteen-month timeline MMA had modeled for the full engagement overall.

Frequently Asked Questions

Foundational context covering the market sizes, CAGR, scope, country, region and competition that inform every finding below. This section is provided to cover basics and most often pre-purchase conversations, answered from the MMA Primary Research Dataset.

What is the current size of the Quality Warranty Management Market?

The quality warranty management market reached approximately 0.72 billion dollars in 2025, driven primarily by American enterprise-software platform expansion and rising predictive-analytics investment across major manufacturer programs.

How large will the Quality Warranty Management Market be by 2036?

MMA projects the market will reach roughly 1.78 billion dollars by 2036, supported by continued predictive-analytics adoption and expanding claims-cost documentation requirements across most producing regions worldwide.

What is the CAGR for the Quality Warranty Management Market 2026 to 2036?

The market is projected to grow at an 8.6 percent compound annual rate between 2026 and 2036. This reflects the category's shift from manual claims toward documented predictive-analytics formats.

Which segment is growing fastest?

Warranty analytics and predictive failure software is growing fastest, at roughly a 13.4 percent CAGR, as manufacturers increasingly value this category's genuinely compelling failure-detection performance over manual alternatives.

Who are the major companies in the Quality Warranty Management Market?

PTC Inc, Tavant Technologies Inc, IFS AB, ServicePower Technologies plc, and Solera Holdings LLC lead the branded segment, keeping concentration moderately consolidated industry-wide across most major producing regions.

Which country is growing fastest?

China is the fastest-growing country market, driven by rapid quality-compliance investment and rising manufacturing-compliance sophistication. India shows a similarly strong adoption trajectory as production expands.

Report Segmentation Architecture

The full report scope spans multiple orthogonal segmentation dimensions, with cross-tabulated demand data provided for each dimension pair. Coverage extends further to regional breakdowns, trend trajectories, and the competitive detail needed to support segment-level decision-making.

By Claims Processing Sophistication and Analytics Depth

  • Warranty Claims Processing Software
  • Warranty Analytics and Predictive Failure Software
  • Warranty Contract and Policy Administration Software
  • Extended Warranty and Service Contract Management Platforms
  • Warranty Fraud Detection Software
  • Warranty Management Implementation and Consulting Services

By End-Use Industry

  • Automotive Manufacturing
  • Consumer Appliance Manufacturing
  • Industrial Equipment Manufacturing

By Commercial Dimension

  • Direct Enterprise Licensing Channel
  • Systems Integrator Channel
  • Cloud Marketplace and Reseller Channel

By Region

  • North America
  • Western Europe
  • East Asia
  • South Asia and Pacific
  • Latin America
  • Middle East and Africa
  • Eastern Europe

Scope, Methodology, and Coverage

Every figure in this report is reproducible from documented input assumptions. The scope below maps the historical period, the forecast horizon, the segmentation dimensions, and the countries covered, alongside the underlying primary and qualitative methodology.
Historical Period
2020 to 2025
Forecast Period
2026 to 2036
Base Year
2025 (USD billions; MMA Primary Research Dataset, September 2026)
Market Definition
The quality warranty management market covers warranty claims processing software, warranty analytics and predictive failure software, warranty contract and policy administration software, extended warranty and service contract management platforms, warranty fraud detection software, and warranty management implementation and consulting services sold to manufacturers, OEMs, and extended-service providers. It excludes generic field-service-dispatch software without dedicated warranty-claims logic, which MMA tracks separately, and covers only warranty management technology within a single defined category.
Quantitative Units
USD billions (current prices); active enterprise licenses where disclosed
Segmentation Dimensions
By Claims Processing Sophistication and Analytics Depth; By End-Use Industry; By Commercial Dimension; By Region
Regions Covered
North America, Western Europe, East Asia, South Asia and Pacific, Latin America, Middle East and Africa, Eastern Europe
Countries Covered
United States, Canada, Germany, France, Italy, Japan, China, South Korea, India, Indonesia, Vietnam, Brazil, Mexico, Argentina, Saudi Arabia, Gulf States, Poland
Key Companies Profiled
PTC Inc, Tavant Technologies Inc, IFS AB, ServicePower Technologies plc, Solera Holdings LLC, Oracle Corporation, SAP SE, Salesforce Inc, Mize Inc, Astea International Inc, Infor Inc, Epicor Software Corporation, Xactware Solutions, CCC Intelligent Solutions, Mitchell International, LYNX Services, Cority Software, ClickSoftware Technologies, ServiceNow Inc, Kinaxis Inc
Quantitative Methodology
Primary survey, n=3,800 respondents, Q4 2025, six countries; demand-side model with trade association cross-validation
Qualitative Methodology
47 expert interviews, Q4 2025; applied to validate demand model assumptions, identify emerging dynamics, and assess competitive positioning
Report Format
PDF and XLSX data workbook (Word format preview document)
Publisher
Market Minds Advisory
Report Code
MMA-2026-TEC-125
Published
September 2026
Contact
sales@marketmindsadvisory.com | www.marketmindsadvisory.com

Purchase the full Quality Warranty Management Market Report (2026 to 2036).

The full report delivers a complete quantitative and qualitative assessment of the global quality warranty management market with expanded American commercial-analysis depth across every major producing country and warranty segment. It includes ten-year forecasts by claims-processing sophistication, region, and end-use industry through 2036, with dedicated coverage distinguishing legacy manual demand from predictive-analytics premium demand. It profiles twenty companies with detailed moat and risk analysis for the two category leaders. The report includes primary survey data from 3,800 respondents across six countries and 47 expert interviews conducted in Q4 2025.
Ten-year market forecasts by claims-processing sophistication and region
Competitive profiles of twenty global and specialty companies
Primary survey data from 3,800 respondents across six countries
Cloud hosting cost modeling and mitigation strategy analysis
Revenue lever analysis across four commercial growth strategies
Regional demand architecture covering all seven global regions

Built For The People Who Decide

From boardroom strategy to bench-side execution, this report is read cover-to-cover by leaders shaping the next decade of their industry, turning demand scenarios, market dynamics and valuation benchmarks into decisions.
CXOs/ Presidents/ VPs/ Managers
M&A and Corporate Development
Strategy Teams and R&D Heads
Procurement and Product Directors
Regulatory and Compliance Leaders
Investor Relations and Equity Analysts