Market Minds Advisory
QR Code Payment Market

QR Code Payment Market: QR Code Payments: A Merchant Cost Structure Rather Than a Technology, and Why the Transaction Earns Nothing

A printed acceptance code costs about USD 0.40 against a terminal costing hundreds, which is the entire reason this spread across Asia and barely registered where card infrastructure already existed.

Lead Analyst

Published

September 2026

Make Smarter Decisions with Customized Research Insights

Request a free sample report and evaluate market opportunities, growth trends, and competitive dynamics relevant to your business needs.

2025 MARKET VALUE$22.4BMarket Size 2025
2036 FORECAST VALUE$82.6BBase Case , 2026 to 2036
CAGR 2026 TO 203612.6 %Bull 13.8% / Bear 11.4%
INCREMENTAL OPPORTUNITY$57.4BNet 10- year value creation
EXPANSION MULTIPLE3.28x2036 value over 2026 base
Strategic Levers
M&A Pipeline
Regional Outlook
Country Rankings
Competitive Intelligence
Segmental Deep-dive
Call-Us : 91 93563 13602

Executive Snapshot and Market Trajectory.

QR payment was never a technology advance. It was a cost structure. A printed acceptance code costs around USD 0.40 while a card terminal costs hundreds plus rental, and that single difference explains where this spread and where it did not. Everything else here follows from that.
Cross-border interlinking grows at 18.9%, half again the market rate of 12.6%, as national schemes connect across 17 corridors and travellers pay with a domestic wallet abroad. Merchant data and credit distribution follows at 16.4%. East Asia takes 44% of value and South Asia and Pacific 28%, which together describe almost the whole market honestly. Western Europe and North America together take just 17%, which is the entire story stated plainly one more way.
Concentration sits near 38% across the top five on measured acceptance and processing revenue, and the awkward fact underneath is that the transaction frequently earns nothing at all. Regulated domestic transfers carry a 0% merchant discount rate in several large markets. Revenue comes from credit, data and the merchant relationship instead. Merchant count rather than processed transaction value is what these operators are really accumulating.
Market Definition
This market covers acceptance, processing and platform revenue attributable to payments initiated by scanning a two-dimensional code, spanning interoperable national scheme acceptance, closed wallet merchant acceptance, cross-border QR interlinking, merchant data and credit distribution, soft point of sale and device acceptance, and transit and ticketing QR acceptance. Revenue is measured at acquirer, wallet operator and platform level. Card present terminal acquiring, near field communication contactless payments, account to account transfers not initiated by a scanned code, and consumer lending unrelated to merchant acceptance are excluded.
Base Year Value
$22.4B in 2025 (MMA Primary Research Dataset, September 2026)
Forecast Period
2026 to 2036, eleven discrete annual values
CAGR
12.6% base case. Bull 13.8%. Bear 11.4%.
Fastest Growth Segment
Cross-Border QR Interlinking: 18.9% CAGR
Fastest Growth Country
Indonesia: 17.2% CAGR
Fastest Growth Region
South Asia and Pacific: 14.8% CAGR
Largest Region
East Asia: 44% of 2025 global value
Market Leaders
Ant Group, Tencent, PhonePe, Google and Paytm lead on measured acceptance and processing revenue. Source: MMA Primary Research Dataset, July 2026.
Primary Survey
n=3,800 procurement and R&D decision-makers, Q4 2025, six countries
Methodology
Demand-side build-up, cross-validated against public data, 47 expert interviews

QR Code Payment Market Forecast Scenarios

qr-code-payment-market-size-forecast-scenario-1788427331524
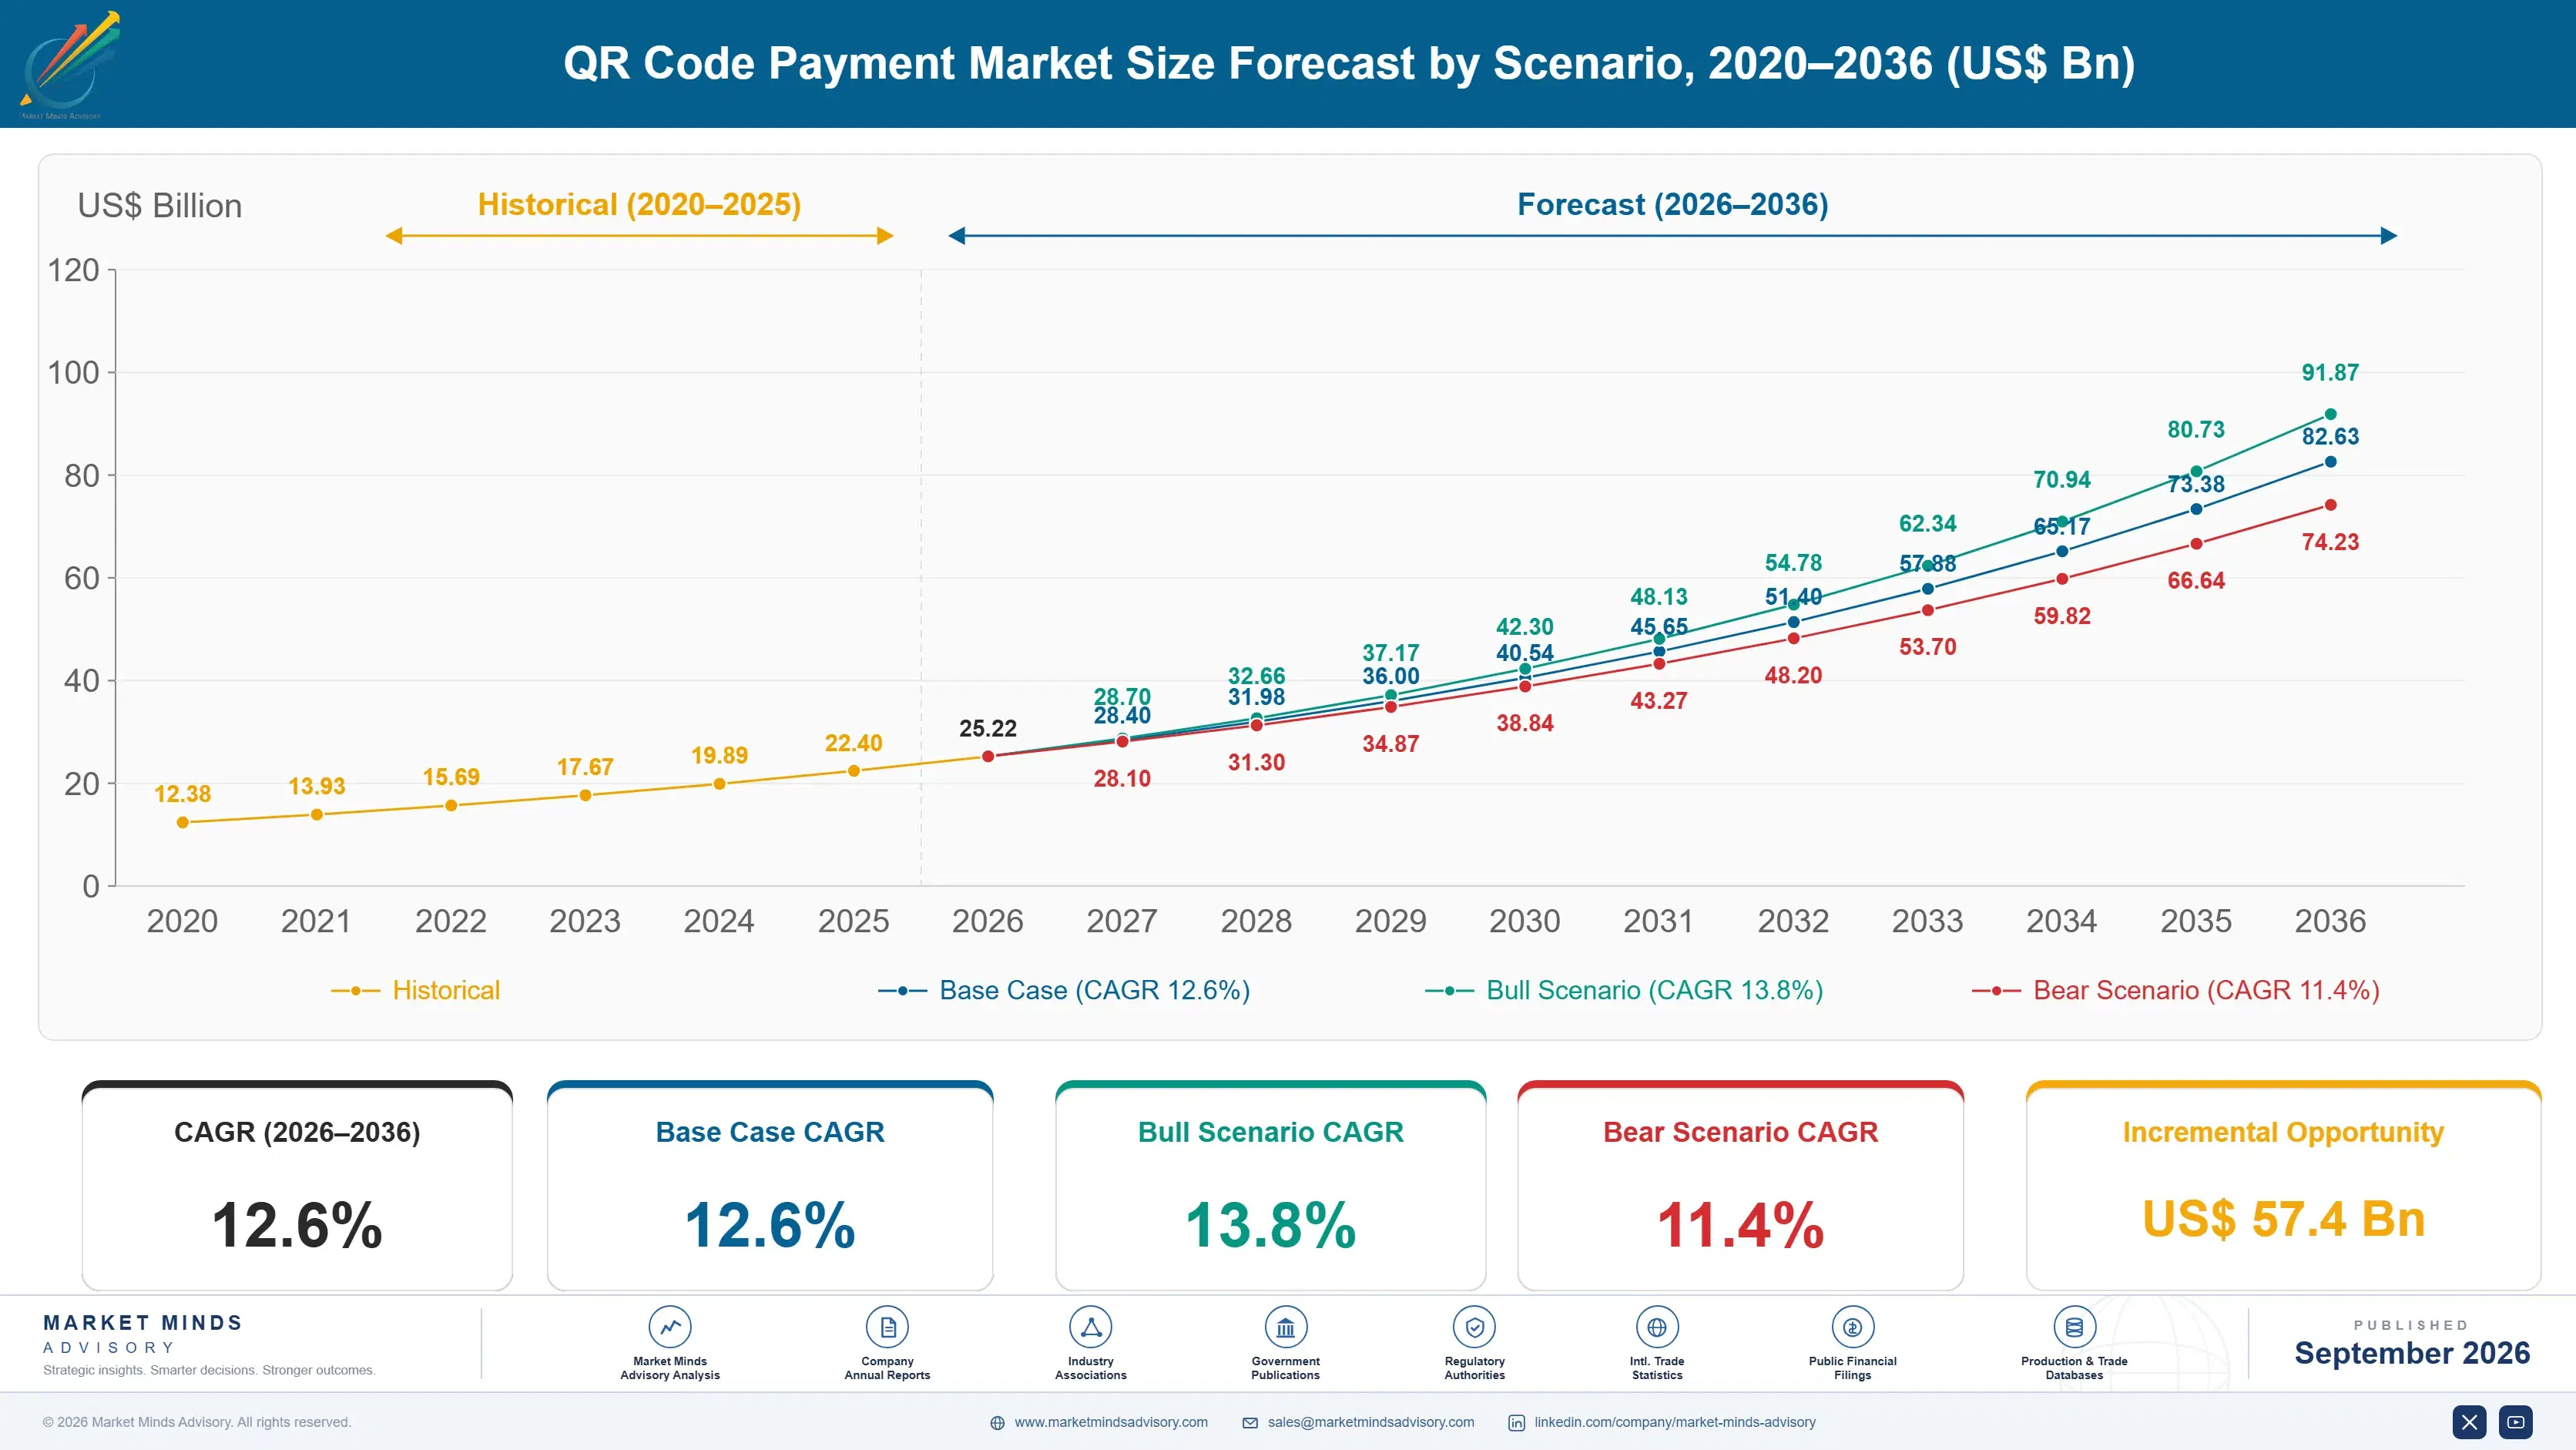
Growth ran at 11.2% from 2020 to 2025, though the shape varied enormously by market rather than following one pattern. China was already mature and grew with retail spending. India, Indonesia, Thailand and Brazil went from negligible acceptance to near-universal within the period, because regulators built interoperable national schemes rather than waiting for wallets to agree among themselves. Western adoption remained marginal throughout, for the reason it always had.
The base case at 12.6% rests on three mechanisms. Merchant acceptance keeps widening in markets where a terminal was never affordable, since a printed code at around USD 0.40 reaches vendors no acquirer would previously visit. Cross-border interlinking across 17 corridors lets travellers pay with a domestic wallet, which is genuinely new commercial ground. Third, acceptance history is becoming the basis for merchant lending, with credit attaching to roughly 14% of active merchants and rising.
The bull case at 13.8% assumes more national schemes interlink and that merchant credit attach rates continue climbing on acceptance data. The bear case at 11.4% is that regulated zero merchant discount rates spread further, removing what little transaction revenue remains and leaving operators dependent on credit distribution carrying risk the payment business never did.

Where the Terminal Was Never Affordable

The geography here is usually explained as a cultural difference and is nothing of the sort. A printed acceptance code costs around USD 0.40. A card terminal costs hundreds, plus rental, plus a discount rate the merchant never chose. Where terminals were already installed and interchange was settled, this solved a problem nobody had. Where a street vendor could not afford acceptance at all, it solved the only problem that mattered.
TOP FIVE CONCENTRATION38%Moderately concentrated across wallet operators and merchant acquirers
MERCHANT ACCEPTANCE COSTUSD 0.40Price of a printed acceptance code against a terminal
AVERAGE TRANSACTION VALUEUSD 6.10Typical basket paid through a scanned acceptance code
SCHEME MERCHANT DISCOUNT RATE0%Charged on domestic person to merchant transfers in several markets
CREDIT ATTACH RATE14%Merchants taking lending against their own acceptance history
CROSS-BORDER LINKED CORRIDORS17National schemes connected for interoperable acceptance while abroad
The transaction itself is a poor business and nobody says so plainly. Average baskets sit near USD 6.10, and regulators in several large markets set the merchant discount rate on domestic transfers at zero. An operator processing billions of them earns nothing directly. What they produce is a record of a merchant's daily takings, valuable to anybody willing to lend against it.
Interoperability arrived by regulation rather than competition. Merchants displayed a dozen separate codes before central banks mandated common schemes, which competing wallets would never have agreed voluntarily. The current frontier is cross-border, with 17 corridors linked so a traveller pays from a domestic wallet abroad. That segment grows at 18.9% and is being built by central banks rather than by the operators who will use it.
"Anyone entering this market expecting payment economics has misread it entirely. The transaction is a loss leader that produces a daily cash flow record for a merchant nobody else can see. That record is the product. The payment is just how you obtain it."
Director, Payments and Merchant Services Practice · MMA Technology Practice · September 2026

Market Trends

Central Banks Are Building the Cross-Border Layer

National scheme operators are linking their systems directly so a traveller can pay a foreign merchant from a domestic wallet, with 17 corridors connected across Asia and expanding into the Gulf and parts of Europe. The work is being done by central banks and scheme operators rather than by commercial wallets, which means the infrastructure arrives as public policy and the revenue opportunity arrives afterwards. Cross-border interlinking grows at 18.9%, faster than anything else here. Card networks have watched a genuine substitute assemble itself outside their control. Nobody in the commercial sector asked for this.
Market Impact: Costs around USD 0.40 to deploy
Acceptance History Becomes a Lending Instrument

A merchant accepting payment through a scanned code generates a daily record of takings that no lender previously had access to, which turns a payment relationship into a credit underwriting position without any additional data collection. Credit now attaches to roughly 14% of active merchants and the share rises steadily as operators build lending capability. This is where the money actually is, given that the transaction frequently earns nothing. It also imports credit risk into organisations built to process payments, which several have handled poorly. That is where the money in this industry sits.
Market Impact: Consolidated 8 codes into one

Market Opportunities and Growth Drivers

Acceptance Costs Almost Nothing to Deploy

A printed acceptance code costs around USD 0.40 against a card terminal costing hundreds plus monthly rental, which brings digital acceptance to street vendors, market traders and small shops no acquirer would previously have visited. That is the entire mechanism behind this market's growth and it operates only where terminal penetration was low to begin with. Acceptance expansion continues across Indonesia, Vietnam, the Philippines and much of Africa on the same arithmetic. Merchant count rather than transaction value is what these operators are actually accumulating. Terminal penetration explains adoption better than anything cultural does.
Market Impact: Earns 0% on regulated transfers

Regulators Mandated the Interoperability Wallets Refused

Merchants displaying eight or ten separate acceptance codes was the natural result of competing wallets, and no commercial negotiation was ever going to resolve it. Central banks across India, Indonesia, Thailand, Singapore and Brazil imposed common schemes, which collapsed the clutter and expanded acceptance faster than competition had. Interoperable scheme acceptance grows at 14.2% on that foundation. The commercial consequence is that scheme rules rather than wallet features now determine most of what operators can charge and how they can compete. Market competition would never have produced this outcome on its own anywhere.
Market Impact: Risks 14% of merchant base

Market Restraints and Challenges

The Transaction Earns Nothing in Major Markets

Regulated domestic person to merchant transfers carry a 0% merchant discount rate across several of the largest markets, which means an operator processing enormous volume earns nothing from the payment itself. The root cause is a policy decision that digital payment should be a public utility rather than a private toll. Commercially this forces every operator toward credit, data and adjacent services, none of which the payment business was designed to carry. Mitigation runs through merchant lending and subscription services, which import risk the payment business never had. No regulator has signalled any intention to reverse it.
Market Impact: Connects 17 national corridors

Credit Risk Arrives in Payment Organisations

Lending against acceptance history attaches to roughly 14% of merchants and is where the economics now sit, but it puts underwriting, collections and provisioning inside companies built to move money rather than to price risk. The root cause is that regulated transaction economics left no alternative revenue source. Commercially several operators have taken losses that surprised their own boards, since merchant lending behaves nothing like payment processing. Mitigation runs through bank partnerships and originate to distribute structures, which reduce return alongside risk. Boards approved lending books before anybody had built a collections function.
Market Impact: Attaches credit to 14% of merchants
4 additional market trends, 3 additional growth drivers, and 2 additional restraints and challenges are covered in the full report. Contact sales@marketmindsadvisory.com to access the complete intelligence.

Segment CAGR and Growth Architecture

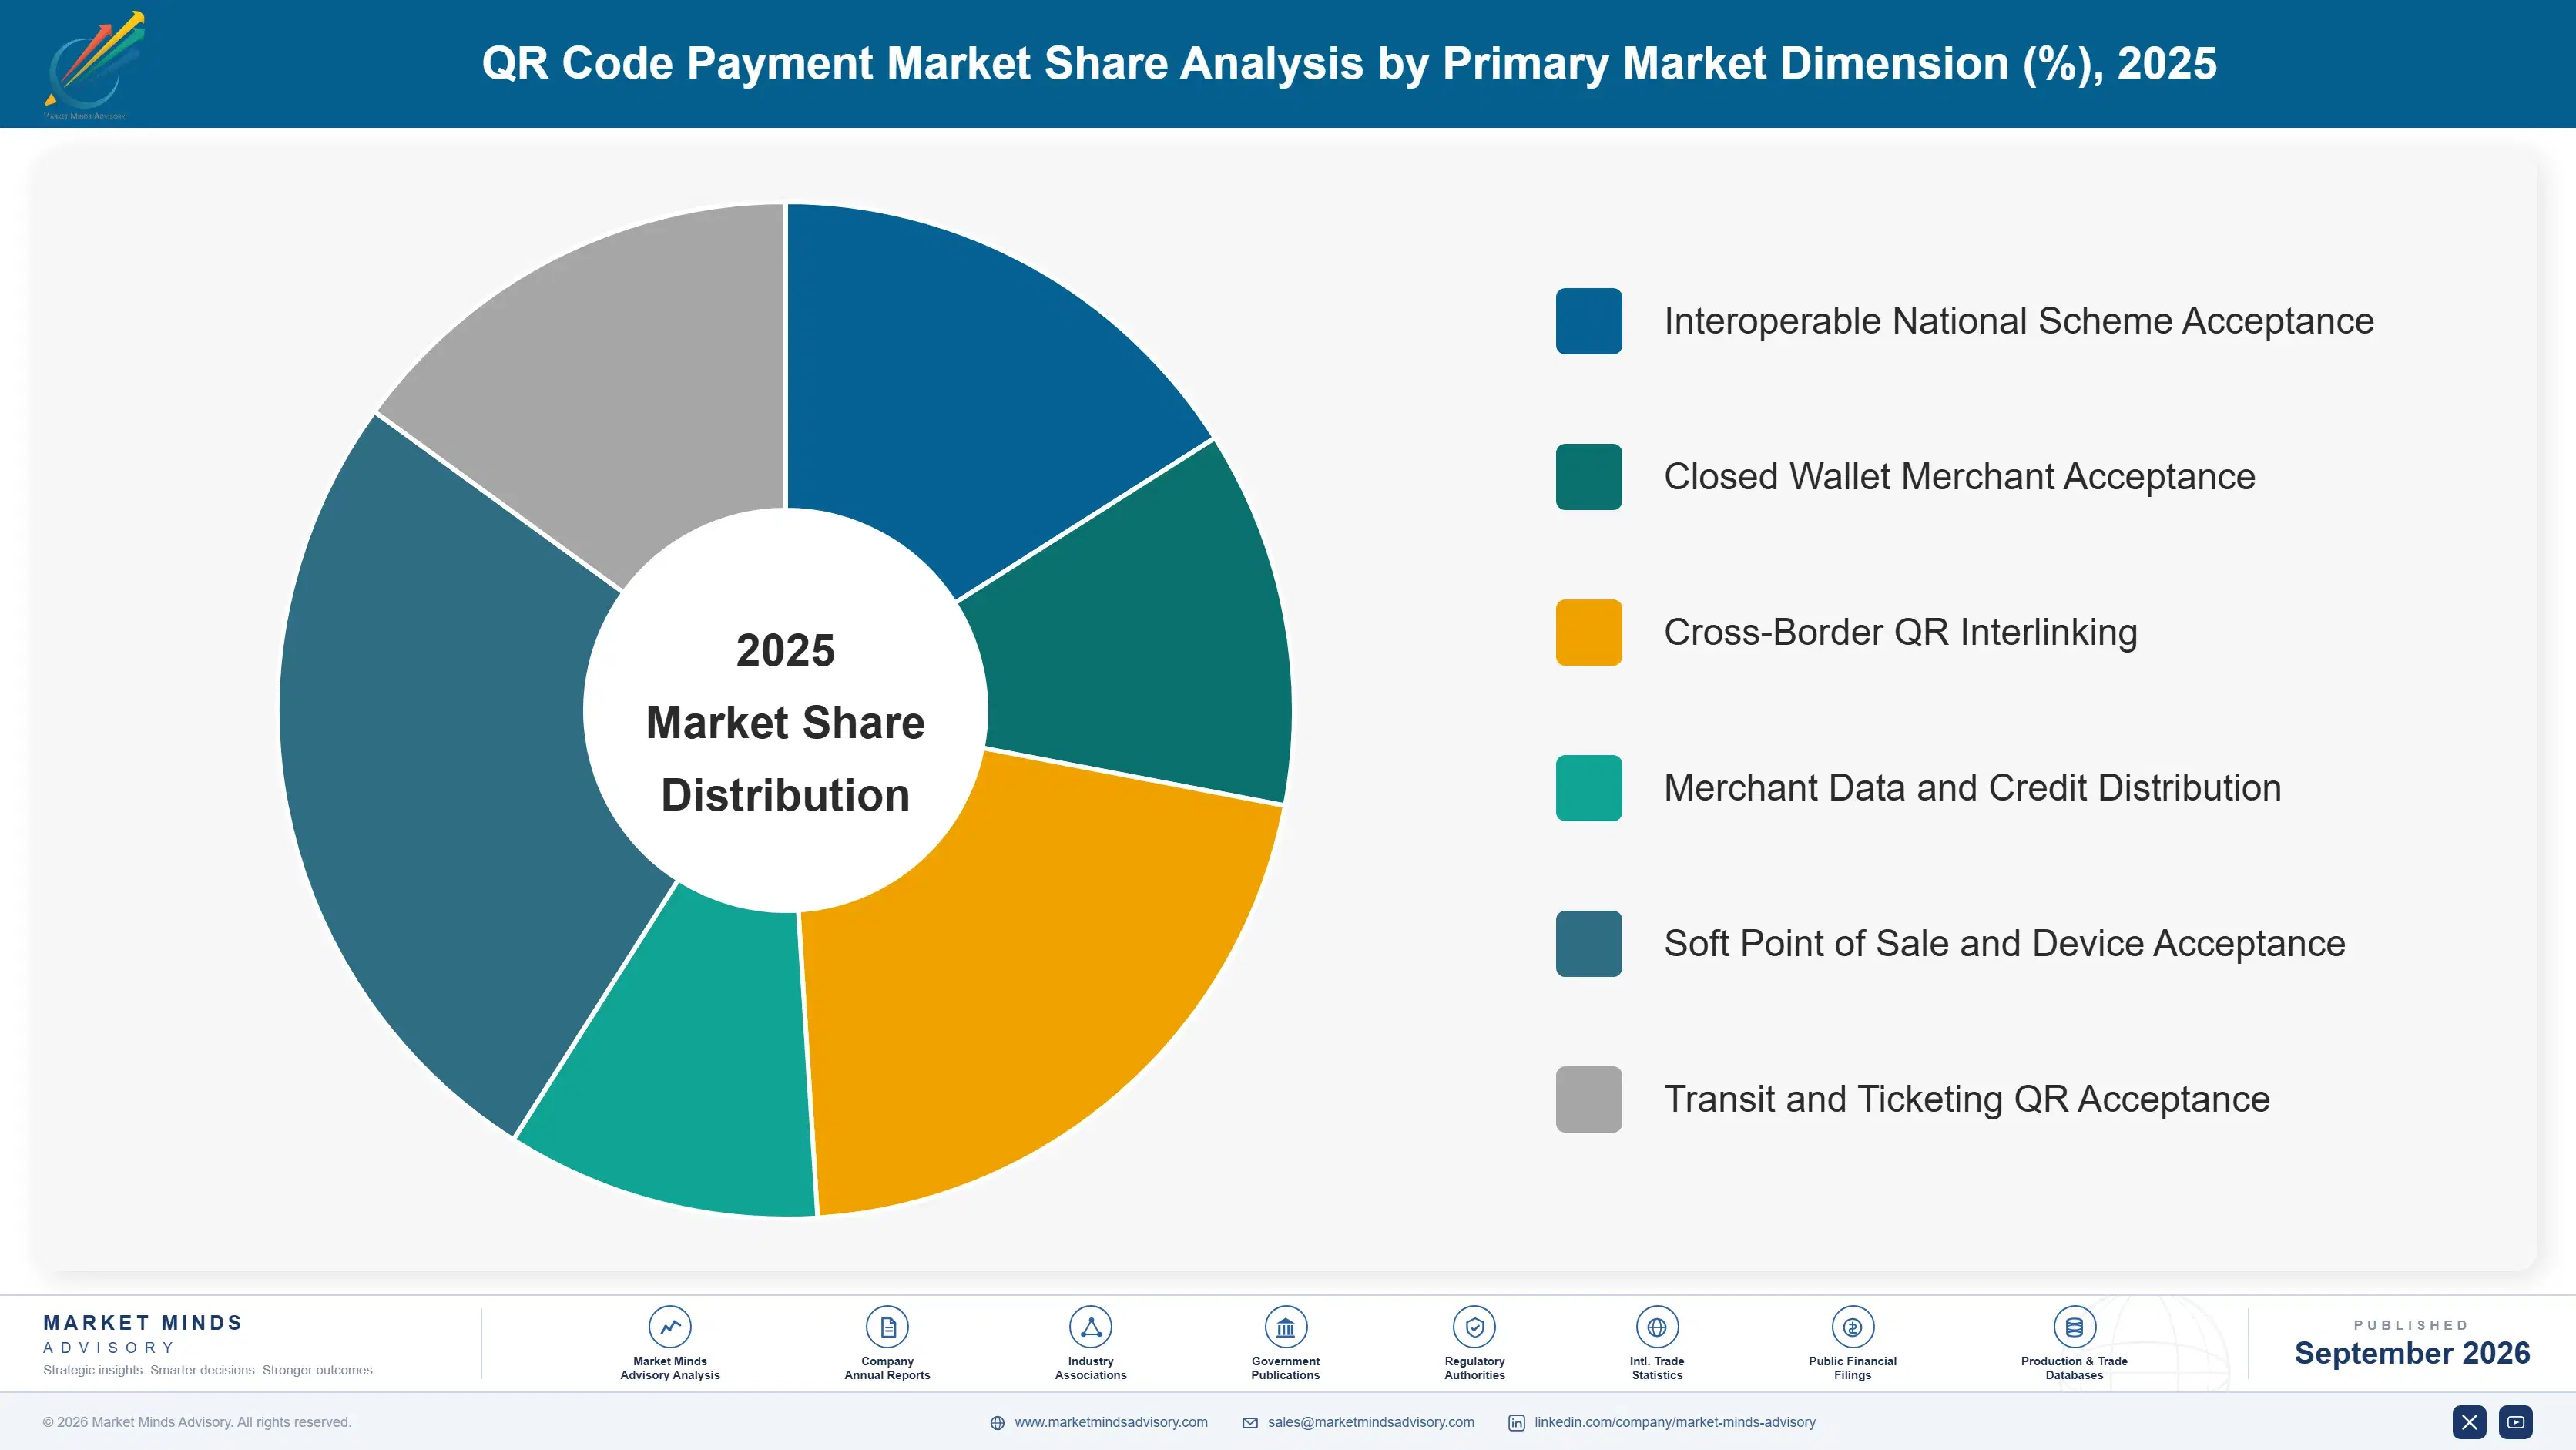
Segmentation follows the acceptance and monetisation model, because that determines whether anybody earns anything. A regulated domestic transfer and a cross-border scheme payment use the same scanned code and produce completely different revenue, and merchant credit produces more than either of them while sitting on the same underlying acceptance record, which is the odd part. Nothing about the code differs.
qr-code-payment-market-market-share-analysis-1788427332057

Cross-Border QR Interlinking

Cross-border interlinking grows at 18.9%, half again the market rate of 12.6%, because 17 national schemes are now connected so a traveller pays a foreign merchant directly from a domestic wallet. Unlike domestic transfers, these carry a genuine fee since foreign exchange and cross-border settlement are involved and no regulator has capped them at zero. The infrastructure is being built by central banks and scheme operators as public policy, with commercial wallets arriving afterwards to use it. Card networks are watching a substitute assemble itself outside their control, in the corridors where their own economics were strongest. Fee levels are set by scheme agreements rather than negotiated, so participation matters more than pricing capability.
CAGR 18.9%

Merchant Data and Credit Distribution

Merchant credit grows at 16.4% and is where this industry's economics actually reside, given that domestic transactions in several major markets earn nothing at all. Daily acceptance records give a lender visibility into a small merchant's takings that no conventional credit assessment could obtain, which makes underwriting possible for businesses banks had written off as unassessable. Attach rates near 14% are rising steadily. The uncomfortable part is that this puts credit risk inside payment organisations, and several have discovered that processing money and pricing risk require entirely different institutional instincts. Attach rates vary enormously between operators, and the difference reflects distribution effort rather than data quality, since every participant on a scheme sees comparable acceptance records anyway.
CAGR 16.4%
Full segment breakdown across 6 segments available in the complete report.

Regional Architecture and Country Demand Map

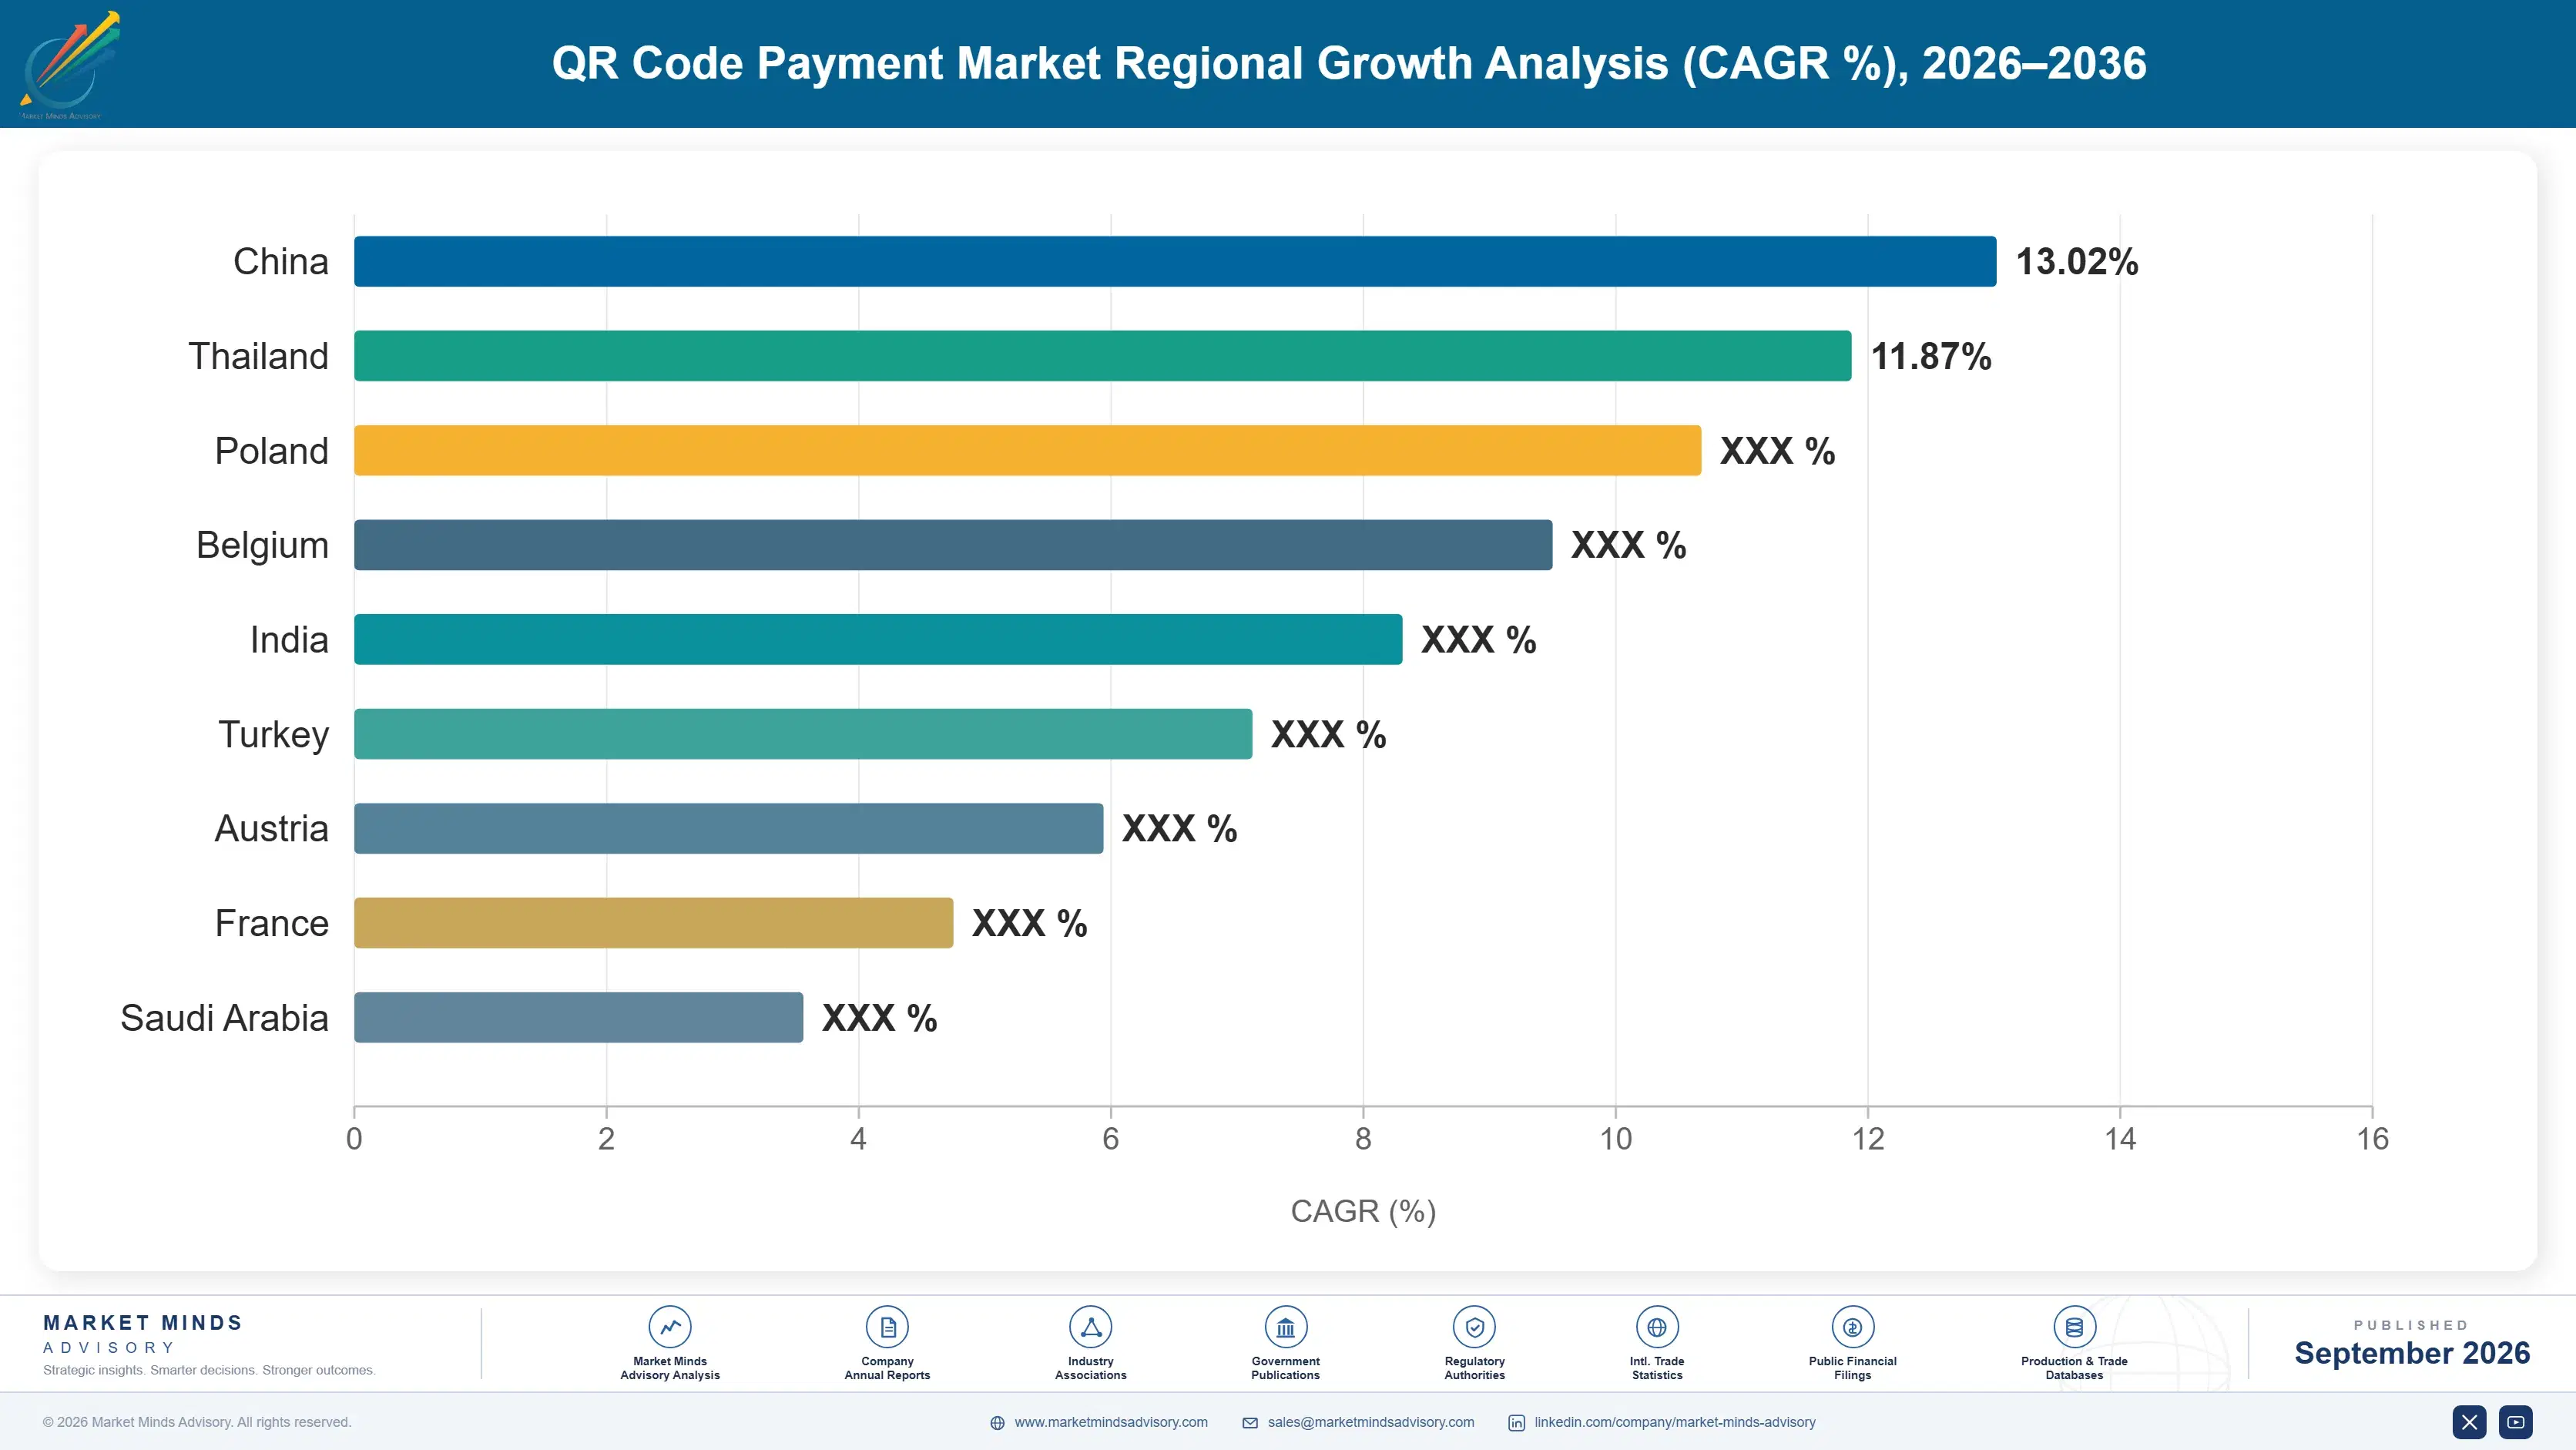
Value follows where card acceptance was absent when the alternative arrived, which is why the distribution looks nothing like any other payment market. Regulation rather than competition set the shape of adoption in almost every large market here. Cultural explanations get offered constantly and explain nothing at all.

East Asia

East Asia holds 44%, far above the regional band, because China adopted scanned acceptance a decade before most markets and did so at a scale nothing else approaches, across retail, transport and person to person transfer alike. Two operators dominate domestic volume and monetise through commerce, credit and financial services rather than through transaction fees. Regulatory intervention forced interoperability and capped fees, which reshaped the economics permanently. Japanese and Korean adoption is real and considerably smaller, since card and contactless infrastructure was already installed when scanned acceptance arrived. Cross-border corridors connecting Chinese wallets to Southeast Asian and Gulf merchants are expanding, driven by outbound travel volume that no other region generates at comparable scale.
Share: 44% | CAGR: 13.6% (2026 to 2036)

South Asia and Pacific

The region holds 28%, far above the regional band, because India, Indonesia, Vietnam and Thailand all moved from negligible acceptance to near-universal within a decade through regulator-built interoperable schemes. Indonesia is the fastest-growing country at 17.2% as its national scheme extends into markets and small retail that no acquirer had ever served. Indian domestic transfers carry a 0% merchant discount rate, which forces every operator there toward credit and commerce revenue instead. Cross-border corridors linking these schemes to Singapore and the Gulf are expanding quickly. Merchant credit distribution is further advanced here than anywhere, since zero fee rules forced operators toward lending earlier and harder than elsewhere. Field agent acquisition costs have risen sharply across several markets simultaneously.
Share: 28% | CAGR: 14.8% (2026 to 2036)
Regional intelligence for 5 additional markets available in the complete report: Western Europe, North America, Latin America, Middle East and Africa, Eastern Europe. Contact sales@marketmindsadvisory.com.
qr-code-payment-market-country-cagr-analysis-1788427332604

Earning Where the Transaction Cannot

An industry whose core transaction carries a regulated zero fee in its largest markets has to earn somewhere else entirely. Every lever that works uses the acceptance record rather than the payment: lending against it, charging for services around it, or carrying it across a border where fees still exist at all. The payment itself is free.

Lend Against the Merchant Acceptance Record

Daily takings visibility gives a lender an underwriting basis no conventional credit assessment can obtain for a small merchant, which is why credit already attaches to roughly 14% of active merchants and keeps rising. Lending revenue per active merchant runs around 9 times what payment processing earns on the same relationship. The risk is real and belongs in an organisation that can price it, which most payment operators initially could not. Those that partnered with banks rather than underwriting alone reached scale considerably faster. The payment relationship is how you obtain the underwriting data, nothing more.
Market Impact: Earns roughly 9 times what payment processing does

Charge for Services Rather Than Transactions

With domestic person to merchant fees set at 0% by regulation across several major markets, subscription services covering settlement speed, reconciliation, inventory tools and staff management are the only direct merchant revenue available. Merchants accept these readily because they solve visible daily problems, unlike a transaction fee which solves none. Subscription attach delivers roughly 4 times the revenue per merchant of any transaction-based arrangement. Operators still hoping for fee liberalisation are waiting for a policy reversal that no regulator has signalled. Merchants pay for problems they can see, and a transaction fee was never one.
Market Impact: Delivers roughly 4 times more revenue per merchant

Position Early on Cross-Border Payment Corridors

Cross-border scheme linking carries genuine fees because foreign exchange and settlement are involved and no regulator has capped them, which makes it the only growing segment with conventional payment economics attached. With 17 corridors connected and more under negotiation, operators positioned at the scheme level capture flows that domestic competition cannot reach. Corridor transactions earn roughly 12 times a domestic equivalent. The infrastructure is built by central banks, so the commercial work is positioning rather than construction. Card networks are responding to this precisely because it assembled in the corridors where their own economics were strongest.
Market Impact: Earns roughly 12 times a domestic transaction does

Accumulate Merchants Rather Than Transaction Volume

Average baskets near USD 6.10 mean transaction value is a poor measure of anything commercially useful, while merchant count determines how many credit and subscription relationships exist to be monetised later. Operators optimising for merchant acquisition at around USD 0.40 per acceptance point build an asset that transaction volume metrics do not capture at all. Merchant count correlates roughly 3 times more strongly with revenue than processed value does. The industry still reports volume because that is what payment businesses have always reported. A merchant relationship is an asset and a processed transaction is not.
Market Impact: Correlates roughly 3 times more strongly with revenue

Who Controls the Margin Pool

Concentration sits near 38% across the top five on measured acceptance and processing revenue, and the picture differs so sharply by market that the global figure conceals more than it shows. Two Chinese operators dominate the largest single market. Indian volume splits between three platforms under a scheme capping fees at zero. Latin American and Southeast Asian markets are led by regional operators that international entrants have not displaced.
Competition runs on three dimensions. Merchant acquisition cost is first, since acceptance itself is nearly free and the contest is over how cheaply merchants can be signed and retained. Second is credit capability, because that is where revenue now sits and it demands institutional skills payment companies had to acquire. Third is scheme positioning, particularly on cross-border corridors where fees still exist and central banks decide who participates.

Two pressures will move positions. Credit performance is separating operators, since several took merchant lending losses that their boards had not anticipated and retrenched sharply afterwards. Meanwhile card networks are responding to cross-border interlinking, which assembled outside their control in exactly the corridors where their economics were strongest, and their response will shape how much of that segment stays with scheme operators.
qr-code-payment-market-company-positioning-matrix-1788427333128

Competitive Moat and Risk Dimensions

ANT GROUP

Moat: Merchant relationship depth

Ant Group holds acceptance relationships with merchants across a market where scanned payment reached near-universal adoption a decade ago, and monetises them through commerce, credit and financial services rather than through transaction fees. Its credit underwriting capability was built alongside the payment business rather than bolted on afterwards. Data on merchant takings supports lending decisions no conventional assessment could reach.
ANT GROUP

Risk: Regulatory policy dependence

The business operates under regulatory conditions that have already been altered substantially once, including fee caps and restrictions on how payment and credit businesses may be combined. Further intervention would affect precisely the revenue sources that replaced transaction fees. Geographic concentration in a single large market also means the company carries policy risk that internationally spread competitors do not.
PHONEPE

Moat: Scheme volume position

PhonePe holds a leading share of transactions on an interoperable national scheme with hundreds of millions of users and merchants, which builds a merchant record base that competitors cannot replicate without equivalent volume. Its distribution reaches small merchants that acquirers never served. Adjacent financial services distribution monetises relationships the payment itself cannot.
PHONEPE

Risk: Zero fee revenue structure

Domestic person to merchant transactions carry a 0% merchant discount rate by regulation, so enormous processing volume produces no direct payment revenue whatsoever. Every commercial outcome therefore depends on credit, insurance and commerce distribution succeeding. Competitors on the same scheme face identical economics, which pushes the entire market toward competing on adjacent products rather than on payment capability.

Players Tracked

Prominent Players

Ant Group
Tencent
PhonePe
Google
Paytm

Other Key Players

Grab
GoTo Group
Sea Group
Kakao Pay
Naver Pay
Rakuten
LINE Pay
Mercado Pago
Nubank
PayPal
Block
Adyen
Stripe
Razorpay
Pine Labs

Recent Developments

MARCH 2025

Additional national scheme corridors connect for cross-border acceptance

Central banks and scheme operators linked further national payment systems so travellers can pay foreign merchants from domestic wallets, extending connected corridors across Asia and into Gulf markets. Foreign exchange and settlement fees apply, which domestic transactions in those same markets do not carry at all.
Signal: Cross-border corridors are the only growing segment where conventional payment economics still apply at all today.
JULY 2025

Payment operators retrench from merchant lending after credit losses

Several wallet operators reduced merchant lending exposure following credit losses that exceeded internal expectations, having underwritten against acceptance data without the provisioning discipline banks apply. Bank partnership structures replaced direct underwriting at several of them. Provisioning discipline had not accompanied the underwriting data into these organisations.
Signal: Acceptance data supports underwriting and does not substitute for the institutional discipline that lending actually requires.
OCTOBER 2025

Merchant subscription services replace transaction revenue in capped markets

Operators in markets with regulated zero merchant discount rates expanded paid services covering settlement speed, reconciliation and inventory management, charging merchants directly for tools rather than for payment. Adoption was stronger than transaction fee acceptance had ever been. Transaction fees had never been accepted at comparable rates.
Signal: Merchants will pay for problems they can see, and a transaction fee has never been one of them.

What Acceptance Actually Costs

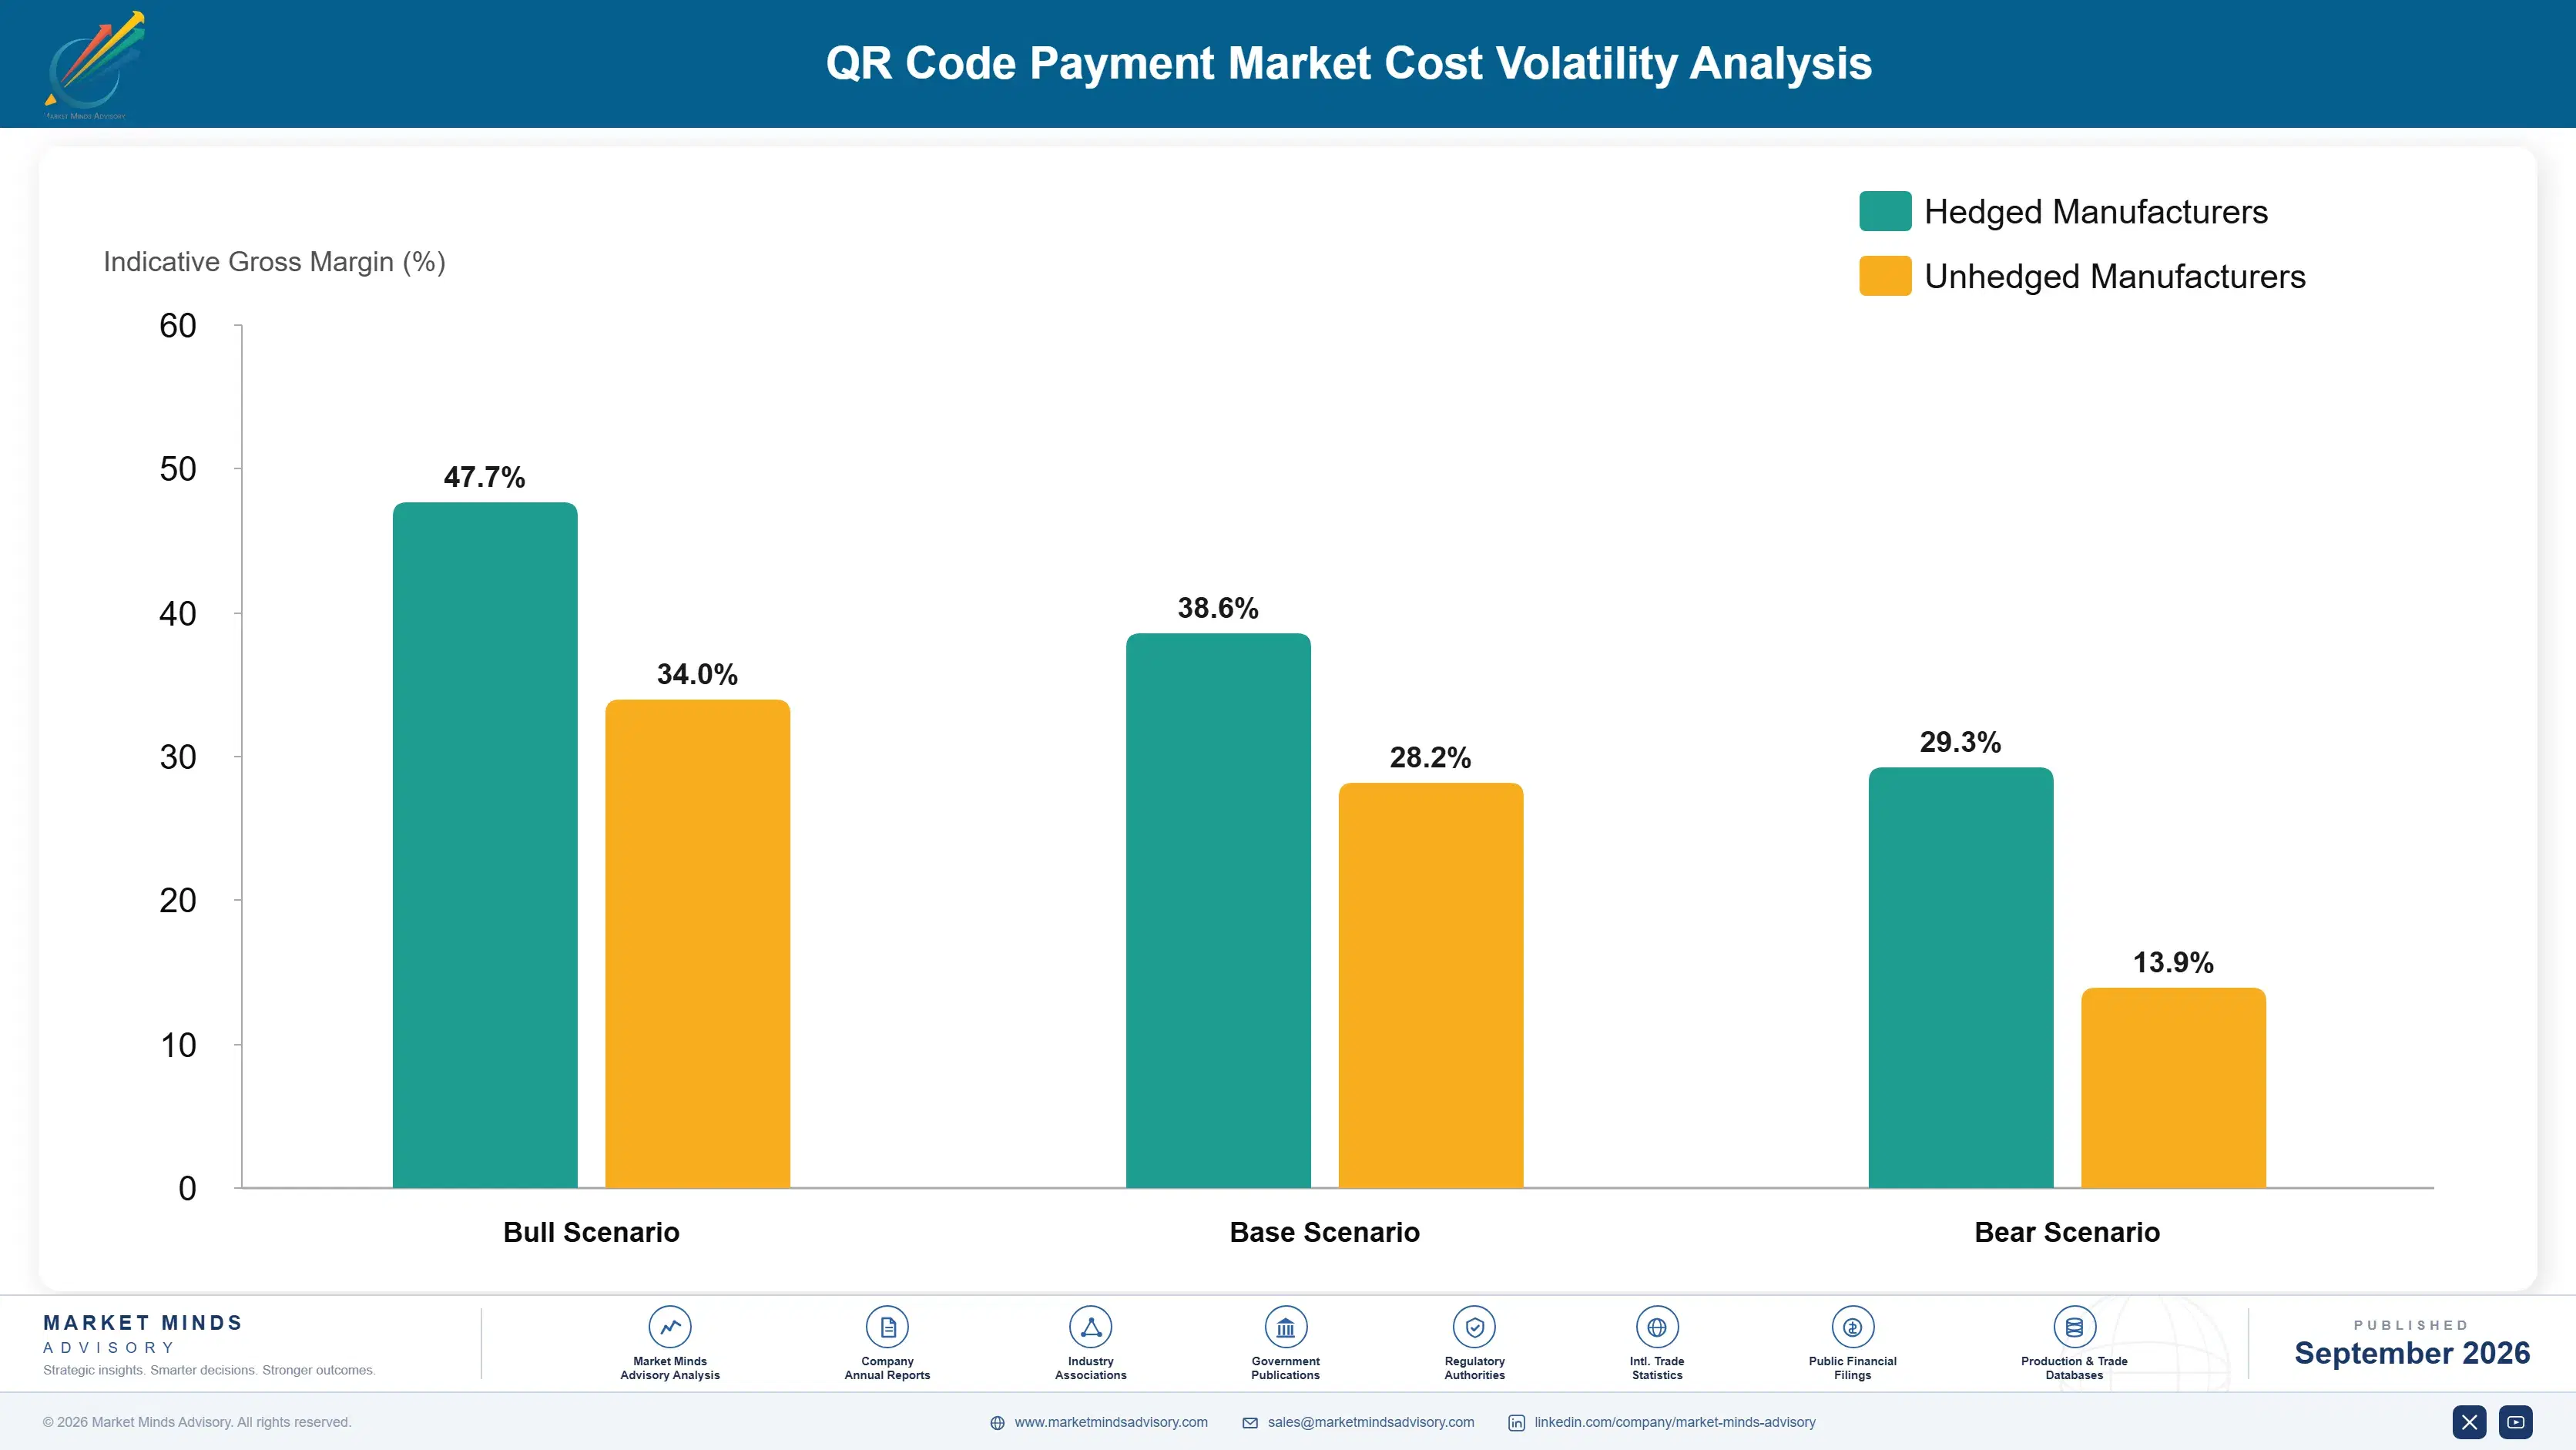
Cost structure bears no resemblance to card acquiring. Printed acceptance materials cost around USD 0.40 per merchant, so physical acceptance cost is effectively nothing and the real expenditure sits in merchant acquisition labour, dispute handling and settlement infrastructure. Customer support is substantial because baskets near USD 6.10 generate enormous transaction counts, and support scales with count rather than value.
Merchant acquisition labour has been the sharpest cost pressure. Signing small merchants requires physical visits by field agents in most emerging markets, and competition for those agents raised effective costs through 2024 and 2025 across India, Indonesia and Brazil simultaneously. Ant Group and Block both referenced merchant acquisition and support cost conditions in recent annual reporting. Operators absorbed it, since acquisition cost cannot be passed to merchants who are being persuaded to accept in the first place.

Exposure varies by revenue model rather than by scale. Operators dependent on transaction fees have no exposure in capped markets because they have no revenue there either. Those monetising through credit carry provisioning and collection costs that behave nothing like payment operating costs. Subscription operators carry support cost against predictable revenue, the most comfortable position and the hardest to build.
qr-code-payment-market-cost-volatility-analysis-1788427333324

Acquire merchants through existing physical networks

Field agent acquisition is the largest controllable cost here and competition keeps raising it across every large emerging market. Partnering with distributors and wholesalers who already visit these merchants weekly cuts acquisition cost substantially against building an agent force. It requires accepting shared economics with the partner, which operators resist until they measure what their own agent networks cost.

Underwrite merchant credit alongside a bank partner

Lending against acceptance data works and the institutional discipline it requires does not arrive with the data itself, as several operators discovered through unanticipated losses. Originate to distribute structures with a bank partner share the return and remove the provisioning exposure that payment organisations are poorly equipped to carry. The reduced return beats the losses direct underwriting produced at scale.

Scale support against transaction count, not value

Average baskets near USD 6.10 mean support demand tracks transaction count rather than processed value, so a model sized against value is sized wrongly by a wide margin. Automated dispute handling and self-service resolution absorb the volume that low value transactions generate. Operators sizing support teams from value forecasts are consistently understaffed within months of any acceptance expansion.

Portfolio Architecture for Margin Defence

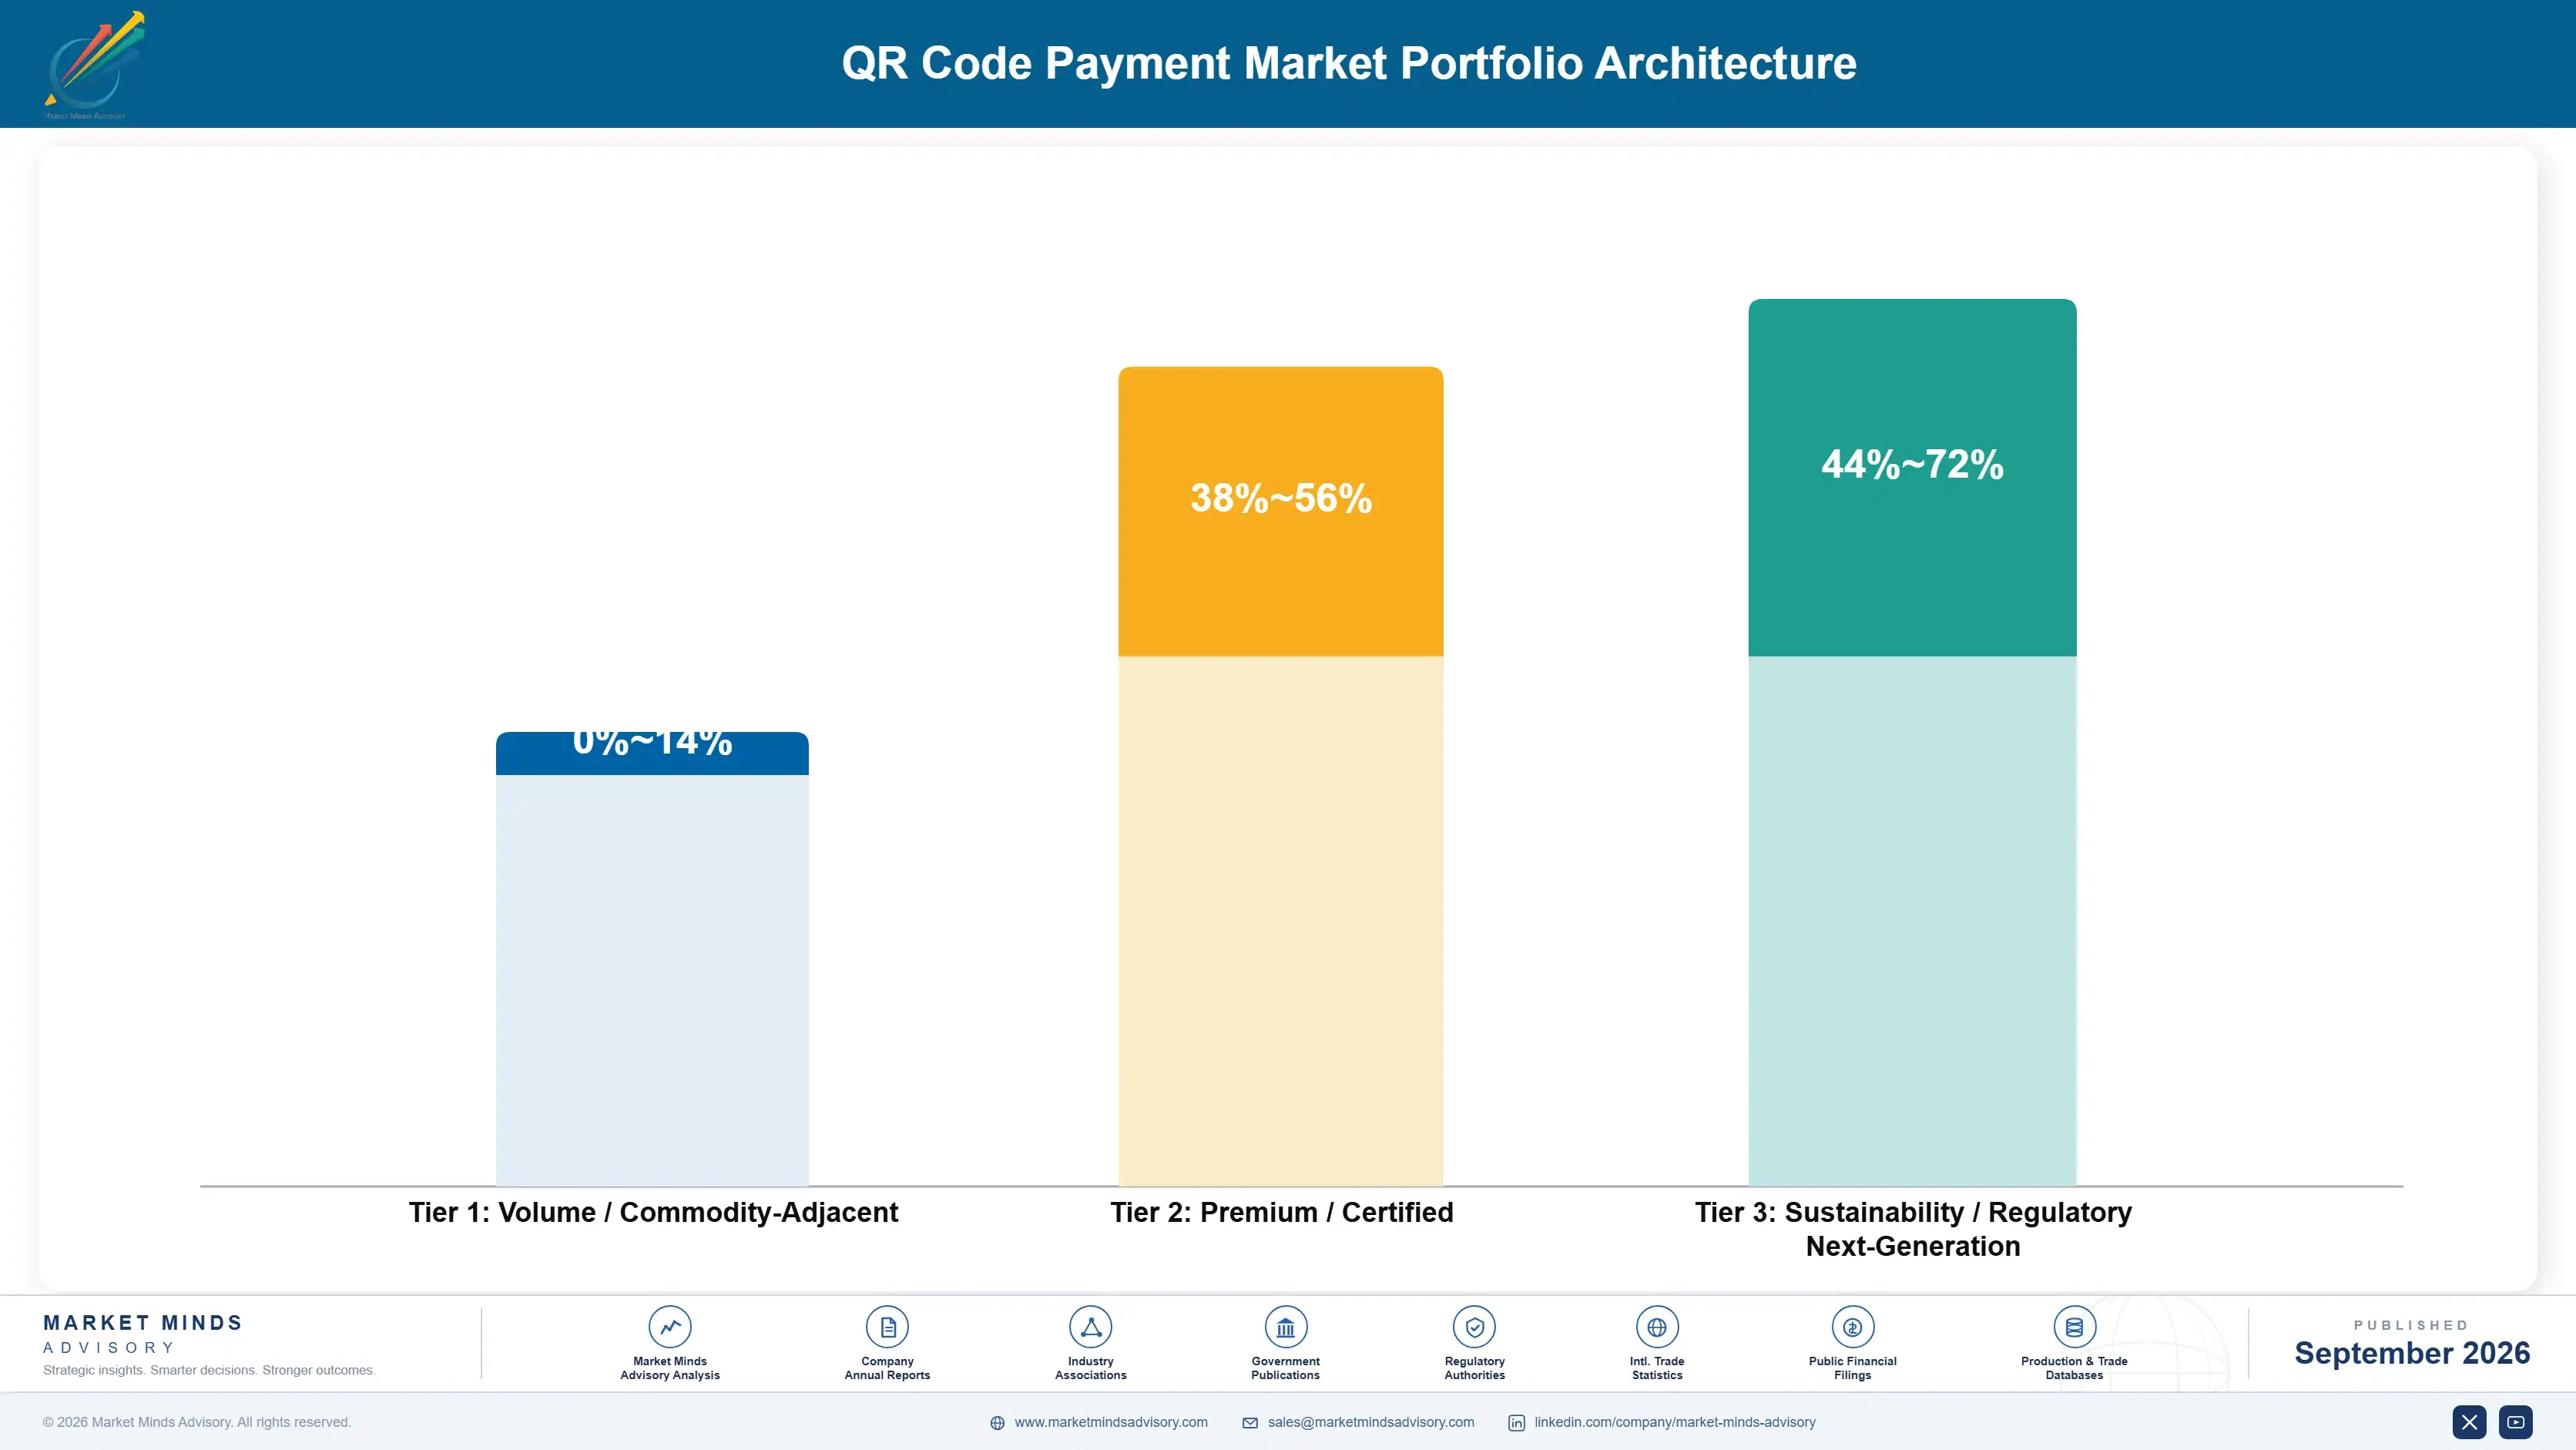
Margin architecture separates on whether a regulator has capped the revenue. Domestic person to merchant transactions in several large markets carry a 0% merchant discount rate, which makes that portion of the business a customer acquisition activity rather than a revenue one. Cross-border corridors carry genuine fees. Merchant credit and subscription services carry margins that resemble financial services rather than payment processing at all.
The tension runs between volume and monetisation. Domestic transaction volume builds the merchant base and the acceptance record that everything else depends upon, while contributing nothing directly in capped markets. Credit and subscription revenue depends entirely on that base existing first. Operators cannot skip the unprofitable stage, which is why this industry has absorbed so much capital before earning anything and why several participants withdrew before reaching the part that pays.

High-value revenue concentrates in merchant credit and in cross-border corridor participation. Credit is defended by acceptance data competitors cannot obtain without equivalent merchant relationships. Corridors are defended by scheme-level positions that central banks control admission to. Domestic transaction processing is the volume core and, in the largest markets, earns precisely nothing on its own terms.

Volume / Commodity-Adjacent

Domestic person to merchant transaction processing, carrying a regulated zero merchant discount rate in several of the largest markets. The range separates capped markets from those where modest fees remain. It builds the merchant base that everything else monetises.
Gross Margin: 0-14%

Premium / Certified

Merchant subscription services covering settlement speed, reconciliation and business tools, charged directly rather than through transaction fees. Margin depends on support automation against transaction counts driven by small baskets. Merchants pay readily for problems they can actually see.
Gross Margin: 38-56%

Sustainability / Regulatory / Next-Generation

Merchant credit distribution and cross-border corridor participation, where genuine fees and lending spreads both exist. The widest range in the portfolio, reflecting credit loss experience and corridor fee structures by scheme. Highest return and the only place real risk sits.
Gross Margin: 44-72%
qr-code-payment-market-portfolio-architecture-1788427333830

High-value Sub-segments and Strategic Watch-out

Merchant Credit Distribution

High value with strong growth at 16.4%, underwritten against acceptance records no conventional assessment could obtain for small merchants. The range reflects credit loss experience, which has varied enormously between operators. It earns roughly 9 times what payment processing does on the same merchant relationship.
Gross Margin: 42-70%

Cross-Border Corridor Participation

High value with the fastest growth at 18.9%, carrying genuine fees that domestic transactions in the same markets do not. The range reflects corridor fee structures set by schemes. Central banks control admission, which makes positioning rather than capability the determining commercial factor here entirely.
Gross Margin: 48-72%

Domestic Transaction Processing

The volume core, earning nothing at all in several of the largest markets under regulated zero fee rules. The range separates capped markets from those retaining modest fees. It builds the merchant base and acceptance record that credit and subscription revenue entirely depend upon later on.
Gross Margin: 0-13%

Direct Merchant Underwriting

The strategic watch-out, where payment operators underwrote merchant credit without the provisioning discipline banks apply and took losses their boards had not anticipated. Several retrenched sharply and moved to bank partnership structures instead. The data supports underwriting; it does not supply the institutional skill that lending requires.
Gross Margin: 0-19%

Why Merchants Stay

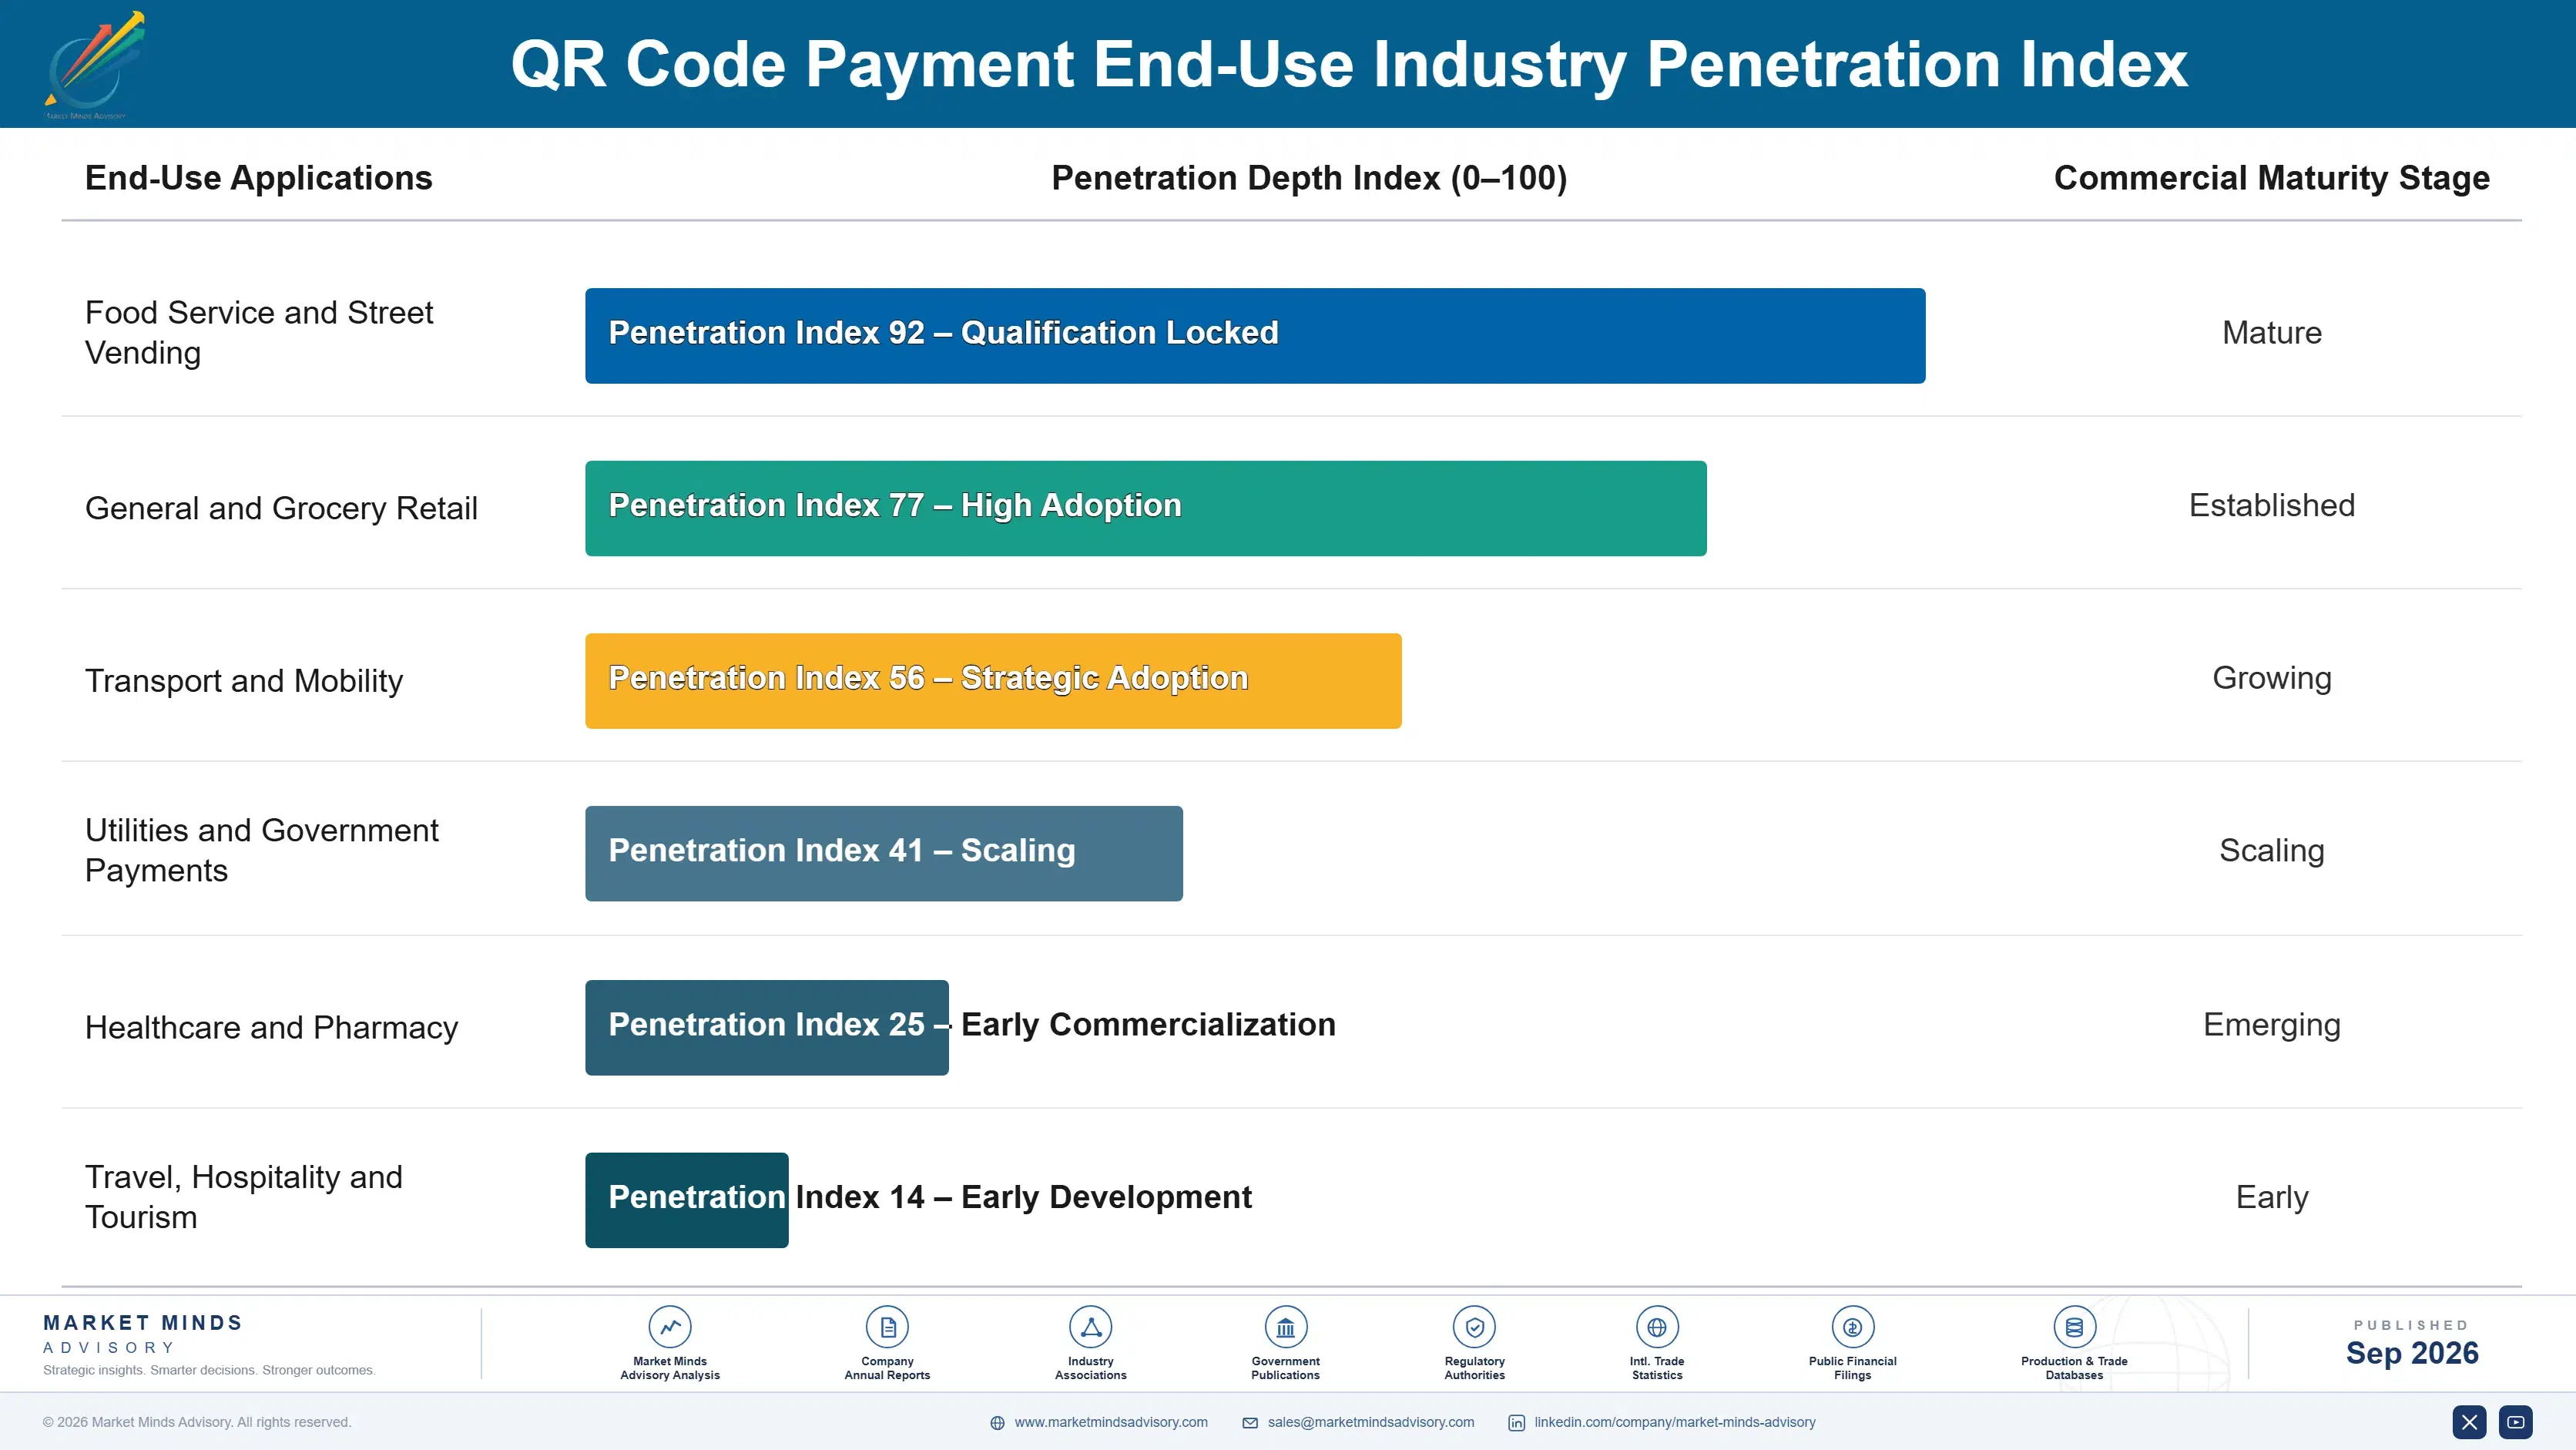
Recurrence comes from the merchant relationship rather than from the transaction. Acceptance itself is nearly free to switch, since a merchant can display another code at no cost, so nothing about payment creates retention. What holds a merchant is settlement history, a working credit line and business tools they have come to rely on daily. Operators with none of those experience churn that transaction volume figures conceal completely.
Adoption depth varies with how much of the merchant's operation runs through the platform. A merchant using only acceptance can switch overnight and periodically does. A merchant whose settlement, credit line, inventory records and staff payments all sit in one place is effectively locked in, and that depth is what operators are actually building toward. Interoperable schemes made payment itself non-differentiating, which forced the industry into everything around it.

The commercial relationship has shifted from consumers to merchants. Early competition was for consumer wallet installs, with cashback offers funding adoption at enormous cost and no retention. It is now for merchant relationships, where credit and services create genuine attachment. Operators still measuring success in consumer wallet numbers are tracking a metric the industry moved past several years ago.
qr-code-payment-market-end-use-penetration-index-1788427334329

Where the Money Actually Is

These are among the four positions where our research anticipates prominent divergence between winners and laggards over the coming forecast period. Each is grounded in the demand model, the regulatory perimeter, and the announced capacity pipeline.
01 / CREDIT DISTRIBUTION DISCIPLINE

Lend against acceptance data, with a bank alongside

Daily takings visibility gives a lender an underwriting basis no conventional credit assessment can obtain for a small merchant, which is why credit attaches to roughly 14% of active merchants and earns around 9 times what processing does on the same merchant relationship every year. The data supports underwriting and does not supply the provisioning discipline that lending genuinely requires of anybody. Operators who underwrote alone took losses their boards had not anticipated, and those who partnered reached scale considerably faster and safer.
02 / SERVICE REVENUE SUBSTITUTION

Charge for tools, since the transaction cannot pay

Domestic person to merchant fees are capped at 0% by regulation across several of the largest markets, which leaves subscription services covering settlement speed, reconciliation and business tools as the only direct merchant revenue available anywhere at all. Merchants accept them readily because they solve visible daily problems, and attach delivers roughly 4 times the revenue per merchant that any transaction arrangement ever produced. Operators still waiting for fee liberalisation are waiting for a reversal no regulator has ever signalled anywhere.
03 / CORRIDOR POSITION TIMING

Take scheme positions on cross-border corridors early

Cross-border scheme linking carries genuine foreign exchange and settlement fees that no regulator has capped, which makes it the only growing segment with conventional payment economics still attached to it anywhere. With 17 corridors already connected and more still under negotiation, corridor transactions earn roughly 12 times a domestic equivalent for operators positioned at the scheme level itself. Central banks build the infrastructure and control admission, so the commercial work is positioning early rather than constructing anything at all here.
04 / MERCHANT COUNT FOCUS

Count merchants, not processed transaction value

Average baskets near USD 6.10 make processed value a poor measure of anything commercially useful at all, while merchant count determines how many credit and subscription relationships exist to be monetised afterwards through credit and services. Merchant count correlates roughly 3 times more strongly with revenue than processed value does, at an acquisition cost near USD 0.40 per acceptance point printed. The industry still reports volume because that is what payment businesses have always reported to their investors and analysts.

Engagement Snapshot From the Field

A live engagement with an industry participant carrying material or product regulatory and market exposure ahead of a defining policy shift, showing how our research translates into a defensible multi-year portfolio strategy.
MARKET MINDS ADVISORY · CLIENT ENGAGEMENT SUMMARY
QR Code Payment Producer Strategic Portfolio Review and Transition Roadmap 2026·Investment Scenario on QR Code Payment Exposure Evaluation 2025-26
CLIENT PROFILE
A Southeast Asian wallet operator with approximately 3.4 million active merchants and 41 million consumer users (client-reported, unverified by MMA), operating under a national interoperable scheme where domestic merchant fees had been capped at zero for two years. Revenue was concentrated in consumer financial products and had stopped growing entirely two years earlier. Nobody knew why.
STRATEGIC CHALLENGE
The board had approved a further USD 88 million in consumer acquisition spending to defend wallet installs against two competitors (client-reported, unverified by MMA). Merchant revenue was negligible and merchant churn had never been measured. Nobody had established what the 3.4 million merchant relationships were actually worth or what they cost to keep.
MMA APPROACH
MMA measured merchant retention, revenue per merchant and switching behaviour rather than consumer wallet metrics, which the client tracked exhaustively. We surveyed 340 merchants across four cities, analysed settlement and acceptance records, and interviewed 19 commercial and risk staff plus two partner banks about their lending appetite in this segment.
KEY FINDINGS
  1. Merchants using acceptance alone churned at roughly 34% annually, while those with a credit line or paid tools churned at under 8%.
  2. Consumer acquisition spending was producing installs that transacted twice and stopped, at a cost per retained user well above their measured lifetime value.
  3. Only about 6% of merchants had any product beyond acceptance, against a comparable regional operator that was already running above 20% product attach.
  4. Two partner banks were willing to fund merchant lending against acceptance data, removing the provisioning exposure the client had been avoiding for two years.
CLIENT PROFILE
A Southeast Asian wallet operator with approximately 3.4 million active merchants and 41 million consumer users (client-reported, unverified by MMA), operating under a national interoperable scheme where domestic merchant fees had been capped at zero for two years. Revenue was concentrated in consumer financial products and had stopped growing entirely two years earlier. Nobody knew why.
STRATEGIC CHALLENGE
The board had approved a further USD 88 million in consumer acquisition spending to defend wallet installs against two competitors (client-reported, unverified by MMA). Merchant revenue was negligible and merchant churn had never been measured. Nobody had established what the 3.4 million merchant relationships were actually worth or what they cost to keep.
MMA APPROACH
MMA measured merchant retention, revenue per merchant and switching behaviour rather than consumer wallet metrics, which the client tracked exhaustively. We surveyed 340 merchants across four cities, analysed settlement and acceptance records, and interviewed 19 commercial and risk staff plus two partner banks about their lending appetite in this segment.
KEY FINDINGS
  1. Merchants using acceptance alone churned at roughly 34% annually, while those with a credit line or paid tools churned at under 8%.
  2. Consumer acquisition spending was producing installs that transacted twice and stopped, at a cost per retained user well above their measured lifetime value.
  3. Only about 6% of merchants had any product beyond acceptance, against a comparable regional operator that was already running above 20% product attach.
  4. Two partner banks were willing to fund merchant lending against acceptance data, removing the provisioning exposure the client had been avoiding for two years.
RECOMMENDED STRATEGY
Phase 1: Redirect consumer acquisition spending into merchant credit and paid business tools, where retention is roughly four times better than acceptance alone. Phase 2: Launch merchant lending through the partner bank structure rather than balance sheet underwriting, since the risk capability does not exist internally. Phase 3: Report merchant count and product attach alongside wallet installs, since the board was funding a metric that no longer predicted revenue.
OUTCOME
Merchant product attach reached roughly 17% within a year and merchant churn fell to about 11% (client-reported, unverified by MMA). Consumer acquisition spending was cut by USD 61 million with no measurable loss of transacting users, and revenue per merchant more than doubled across the base.

Frequently Asked Questions

Foundational context covering the market sizes, CAGR, scope, country, region and competition that inform every finding below. This section is provided to cover basics and most often pre-purchase conversations, answered from the MMA Primary Research Dataset.

What is the current size of the QR Code Payment Market?

The market was worth USD 22.4 billion in 2025 and reaches USD 25.22 billion in 2026. That measures acceptance and processing revenue rather than transaction value.

How large will the QR Code Payment Market be by 2036?

MMA forecasts USD 82.62 billion by 2036, an expansion of 3.28 times over the forecast period. That represents USD 57.40 billion of incremental annual revenue against 2026.

What is the CAGR for the QR Code Payment Market 2026 to 2036?

The base case is 12.6% compound annual growth, with a bull case at 13.8% and a bear case at 11.4%. Whether zero fee regulation spreads further separates the scenarios.

Which segment is growing fastest?

Cross-border interlinking grows at 18.9%, half again the market rate of 12.6%. It is the only growing segment where conventional payment fees still apply at all.

Who are the major companies in the QR Code Payment Market?

Ant Group, Tencent, PhonePe, Google and Paytm lead on measured acceptance and processing revenue. Together they hold roughly 38%, though positions differ sharply by national market.

Which country is growing fastest?

Indonesia grows fastest at 17.2%, as its interoperable national scheme extends acceptance into markets and small retail that no acquirer had previously served at any price.

Report Segmentation Architecture

The full report scope spans multiple orthogonal segmentation dimensions, with cross-tabulated demand data provided for each dimension pair. Coverage extends further to regional breakdowns, trend trajectories, and the competitive detail needed to support segment-level decision-making.

By Primary Market Dimension

  • Interoperable National Scheme Acceptance
  • Closed Wallet Merchant Acceptance
  • Cross-Border QR Interlinking
  • Merchant Data and Credit Distribution
  • Soft Point of Sale and Device Acceptance
  • Transit and Ticketing QR Acceptance

By End-Use Industry

  • Food Service and Street Vending
  • General and Grocery Retail
  • Transport and Mobility
  • Utilities and Government Payments
  • Healthcare and Pharmacy
  • Travel, Hospitality and Tourism

By Commercial Dimension

  • Micro-Merchant Acceptance
  • Small and Medium Enterprise Accounts
  • Enterprise Merchant Agreements
  • Scheme Operator Participation
  • Bank Partnership Distribution
  • Agent and Distributor Networks

By Region

  • East Asia
  • South Asia and Pacific
  • Western Europe
  • North America
  • Latin America
  • Middle East and Africa
  • Eastern Europe

Scope, Methodology, and Coverage

Every figure in this report is reproducible from documented input assumptions. The scope below maps the historical period, the forecast horizon, the segmentation dimensions, and the countries covered, alongside the underlying primary and qualitative methodology.
Historical Period
2020 to 2025
Forecast Period
2026 to 2036
Base Year
2025 (USD billions; MMA Primary Research Dataset, September 2026)
Market Definition
This market covers acceptance, processing and platform revenue attributable to payments initiated by scanning a two-dimensional code, spanning interoperable national scheme acceptance, closed wallet merchant acceptance, cross-border QR interlinking, merchant data and credit distribution, soft point of sale and device acceptance, and transit and ticketing QR acceptance. Revenue is measured at acquirer, wallet operator and platform level, including attributable merchant subscription and lending distribution income. Card present terminal acquiring, near field communication contactless payment, account to account transfers not initiated by a scanned code, consumer lending unrelated to merchant acceptance, and gross transaction value itself are excluded from scope.
Quantitative Units
USD billions, acceptance, processing and attributable platform revenue at supplier level
Segmentation Dimensions
Acceptance and monetisation model, end-use industry, merchant type, region
Regions Covered
East Asia, South Asia and Pacific, Western Europe, North America, Latin America, Middle East and Africa, Eastern Europe
Countries Covered
China, Japan, South Korea, Taiwan, Hong Kong, India, Indonesia, Vietnam, Thailand, Philippines, Malaysia, Singapore, Bangladesh, Australia, United States, Canada, Mexico, Brazil, Colombia, Argentina, Chile, United Kingdom, Germany, France, Netherlands, Spain, Poland, Czechia, United Arab Emirates, Saudi Arabia, Kenya, Nigeria, Ghana, South Africa
Key Companies Profiled
Ant Group, Tencent, PhonePe, Google, Paytm, Grab, GoTo Group, Sea Group, Kakao Pay, Naver Pay, Rakuten, LINE Pay, Mercado Pago, Nubank, PayPal, Block, Adyen, Stripe, Razorpay, Pine Labs
Quantitative Methodology
Primary survey, n=3,800 respondents, Q4 2025, six countries; demand-side model with trade association cross-validation
Qualitative Methodology
47 expert interviews, Q4 2025; applied to validate demand model assumptions, identify emerging dynamics, and assess competitive positioning
Report Format
PDF and XLSX data workbook (Word format preview document)
Publisher
Market Minds Advisory
Report Code
MMA-2026-TEC-131
Published
September 2026
Contact
sales@marketmindsadvisory.com | www.marketmindsadvisory.com

Purchase the full QR Code Payment Market Report (2026 to 2036).

The full MMA report treats scanned payment as a merchant cost structure rather than a payment technology, and works through how operators earn in markets where regulators capped the transaction at nothing. It sizes the market to 2036 across six acceptance and monetisation models, seven regions and 34 countries, with segment growth rates and regional demand mechanisms set out throughout. Competitive analysis covers 20 operators assessed on measured acceptance and processing revenue, with moat and risk assessment for the two leaders. The report quantifies acquisition cost structure, credit economics and margin architecture across three portfolio tiers. It closes with four verdicts and an anonymised wallet operator engagement.
Six acceptance models sized through 2036
Seven regions with demand mechanism analysis
Twenty operators on consistent revenue basis
Acceptance cost and credit attach benchmarks
Margin architecture across three portfolio tiers
Anonymised wallet operator monetisation strategy engagement

Built For The People Who Decide

From boardroom strategy to bench-side execution, this report is read cover-to-cover by leaders shaping the next decade of their industry, turning demand scenarios, market dynamics and valuation benchmarks into decisions.
CXOs/ Presidents/ VPs/ Managers
M&A and Corporate Development
Strategy Teams and R&D Heads
Procurement and Product Directors
Regulatory and Compliance Leaders
Investor Relations and Equity Analysts