Market Minds Advisory
Pumpkin Spice Products Market

Pumpkin Spice Products Market: Pumpkin Spice Products: Eleven Weeks to Earn a Year

A category that earns its entire year inside eleven weeks, built on a spice blend containing almost no pumpkin and sourced from smallholder farms half a world from the shoppers buying it.

Lead Analyst

Lisa Gevelber

Published

August 2026

Make Smarter Decisions with Customized Research Insights

Request a free sample report and evaluate market opportunities, growth trends, and competitive dynamics relevant to your business needs.

2025 MARKET VALUE$1.3BMarket Size 2025
2036 FORECAST VALUE$2.7BBase Case , 2026 to 2036
CAGR 2026 TO 20366.4 %Bull 7.6% / Bear 5.2%
INCREMENTAL OPPORTUNITY$1.2BNet 10- year value creation
EXPANSION MULTIPLE1.86x2036 value over 2026 base
Strategic Levers
M&A Pipeline
Regional Outlook
Country Rankings
Competitive Intelligence
Segmental Deep-dive
Call-Us : 91 93563 13602

Executive Snapshot and Market Trajectory.

The whole category earns its year in about 11 weeks, which inverts normal manufacturing economics completely. Production runs for months against a demand window that closes hard in early December, and anything left is calendar-locked stock nobody wants until next August. Most food categories get twelve months instead.
Forecast accuracy is therefore the commercial discipline here, not product development. A 10% overforecast becomes markdown across roughly 9% of seasonal stock, and a 10% underforecast is a stockout during the only weeks that matter at all. Packaged ready-to-drink formats grow fastest at 9.6%, half again the market rate of 6.4%, because shelf-stable stock keeps selling well past the window. That taper is what retailers value most.
Input exposure runs to spice rather than to pumpkin, since only about 8% of products contain any actual pumpkin at all. Cinnamon, nutmeg, ginger, clove and allspice make up roughly 23% of cost, grown by smallholders across Indonesia, Vietnam and Madagascar in thin markets that move hard on weather. North America holds 68% of value, and the flavour travels poorly beyond it. Almost nobody in the category can name their clove supplier.
Market Definition
Consumer products formulated around the pumpkin spice flavour profile and sold within a defined seasonal window, spanning coffee and hot beverages, bakery and sweet goods, confectionery and snacks, dairy and frozen desserts, packaged ready-to-drink beverages, and home fragrance and scented products. Measured at retail and foodservice selling value. Excludes plain pumpkin as a produce item, canned pumpkin puree sold as an ingredient, and spice blends sold to manufacturers rather than consumers.
Base Year Value
$1.3B in 2025 (MMA Primary Research Dataset, August 2026)
Forecast Period
2026 to 2036, eleven discrete annual values
CAGR
6.4% base case. Bull 7.6%. Bear 5.2%.
Fastest Growth Segment
Packaged Ready-to-Drink Beverages: 9.6% CAGR
Fastest Growth Country
South Korea: 9.2% CAGR
Fastest Growth Region
South Asia and Pacific: 8.4% CAGR
Largest Region
North America: 68% of 2025 global value
Market Leaders
Starbucks, Nestle, The J.M. Smucker Company, Bath and Body Works, Keurig Dr Pepper. Source: MMA Primary Research Dataset, July 2026.
Primary Survey
n=3,800 procurement and R&D decision-makers, Q4 2025, six countries
Methodology
Demand-side build-up, cross-validated against public data, 47 expert interviews

Pumpkin Spice Products Market Forecast Scenarios

pumpkin-spice-products-market-trends-size-forecast-scenario-1787581068837
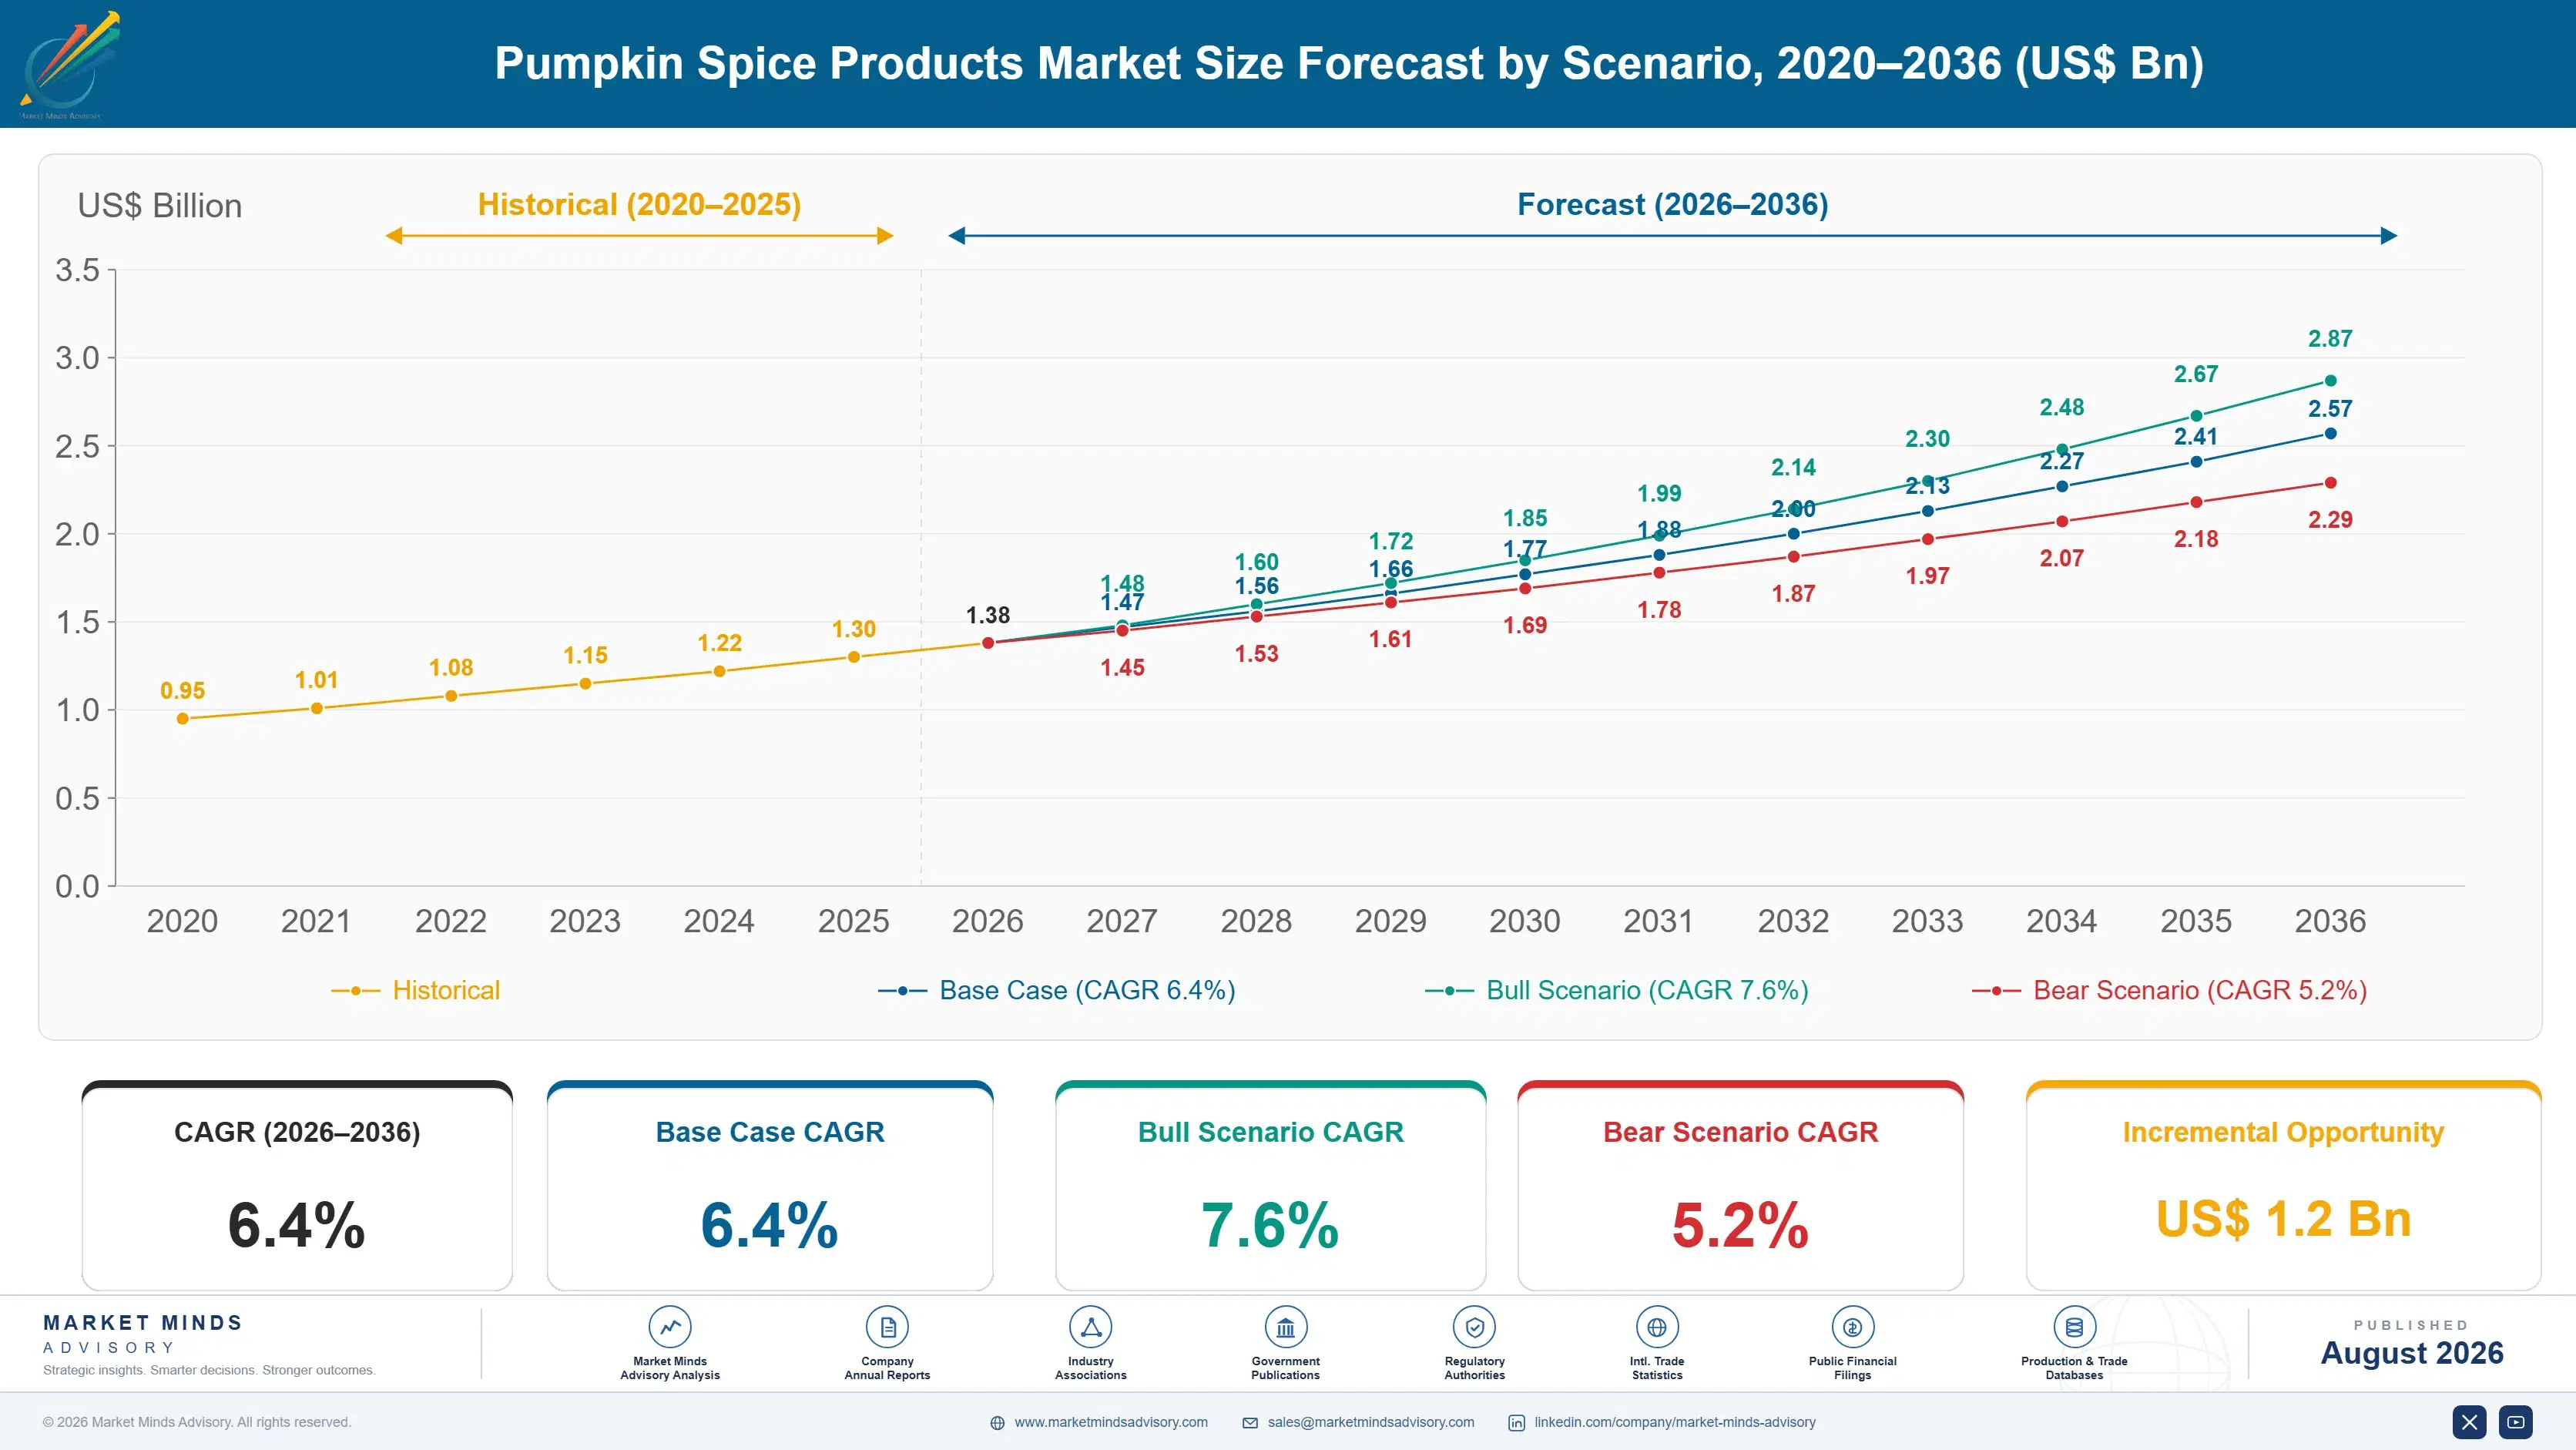
Growth ran near 5.4% between 2020 and 2025, with the pandemic years distorting the pattern considerably: foodservice beverages collapsed in 2020 while packaged and home formats surged, and the two only rebalanced by 2023. Launch dates crept steadily earlier across the whole period, adding selling weeks without adding much to the total. Home fragrance grew faster than any food format throughout, which surprised most participants.
Base case 6.4% rests on three mechanisms. Packaged ready-to-drink formats extend the category past the eleven week window by giving retailers shelf-stable stock that moves after the foodservice promotion ends. Home fragrance keeps expanding because a candle carries no formulation constraint and no shelf life problem at all. And South Korean and Japanese cafe chains have adopted the flavour on their own terms, at 9.2% in Korea, which is the only meaningful adoption outside North America.
The bull case at 7.6% assumes the flavour completes a genuine transition into a broader autumn seasonal platform, widening the window rather than merely starting it earlier. The bear case at 5.2% is consumer fatigue after two decades of expansion, with the parody volume that surrounds every August launch turning into actual avoidance rather than affectionate mockery.

Eleven Weeks and Almost No Pumpkin

Eleven weeks is the whole business. Production begins in spring, inventory builds through summer, and the demand window opens in late August and shuts hard in early December, after which the flavour is culturally unsellable until the following autumn. That asymmetry between a long build and a short sell is what makes this category difficult, and it is why forecast accuracy matters more here than product development ever will.
TOP FIVE CONCENTRATION18%A flavour rather than a category anyone owns
SELLING SEASON LENGTH11 weeksWeeks in which the category earns its year
LAUNCH DATE CREEP17 daysEarlier launch timing than a decade ago now
SEASONAL MARKDOWN RATE9%Unsold seasonal stock cleared below full list price
ACTUAL PUMPKIN CONTENT8%Products containing any real pumpkin whatsoever at all
SPICE INPUT COST SHARE23%Cost of goods represented by the spice blend
The numbers punish error in both directions. Overforecast and around 9% of seasonal stock clears at markdown or writes off entirely, because there is no January for pumpkin spice. Underforecast and the stockout lands precisely in the weeks that generate the year's revenue, with no recovery available afterwards. Launch dates have crept 17 days earlier over a decade, which lengthens the risk period rather than the certainty.
Almost no pumpkin is involved, and that matters commercially. Only about 8% of products contain any, while cinnamon, nutmeg, ginger, clove and allspice account for roughly 23% of cost. Those spices come from smallholder farms across Indonesia, Vietnam, Sri Lanka and Madagascar, traded in markets thin enough that a cyclone in the wrong place moves input cost meaningfully within a single season.
"The joke about pumpkin spice containing no pumpkin is entirely true and entirely beside the point. What actually deserves attention is that a category earning its year in eleven weeks buys its principal input from Madagascar smallholders, and almost nobody in it can name their clove supplier."
Director, Seasonal Food and Beverage Categories Practice · MMA Food and Beverage Practice · August 2026

Market Trends

Launch dates creeping earlier without lengthening the actual season

Season launches now arrive around 17 days earlier than a decade ago, with late August standard where mid-September once was, driven by retailers and chains wanting more selling weeks than competitors get. Consumer purchasing has not moved forward at the same rate, which means the additional weeks add cost and inventory risk more than they add revenue. The window still shuts in early December regardless of when it opened, so creep lengthens the exposure period rather than the earning period, and everyone involved understands this while continuing to do it anyway.
Market Impact: Expands at 8.6% each year
Packaged formats extending the category past the seasonal window

Packaged ready-to-drink beverages grow at 9.6%, half again the market rate of 6.4%, because shelf-stable stock keeps selling well after the foodservice promotion that created the demand has already ended. A cafe pulls the drink on a fixed date while a bottled version sits in a chiller for weeks longer, which converts a hard stop into a gradual taper. Retailers value that taper enormously, since it reduces the markdown exposure that makes seasonal listings uncomfortable for a buyer to carry in the first place. Ambient formats tolerate a longer tail than chilled ones do.
Market Impact: Korea expanding at 9.2% annually

Market Opportunities and Growth Drivers

Home fragrance outgrowing every food format in the category

Scented candles, diffusers and air fresheners grow at 8.6% because a candle carries no formulation constraint, no shelf life problem and no food safety qualification behind it, while commanding pricing that food formats simply cannot approach. Consumers who would never buy a pumpkin spice beverage will still buy the candle, which widens the addressable base considerably beyond food buyers. The format also tolerates the season ending far better than perishable stock does, since a candle waits quietly in a warehouse rather than expiring on a printed date. Food participants keep underestimating exactly this format.
Market Impact: Markdown reaches 9% of stock

Korean and Japanese cafe chains adopting the seasonal platform

South Korea grows fastest anywhere at 9.2%, as domestic cafe chains have adopted autumn seasonal flavour marketing on their own terms rather than importing an American calendar wholesale. Korean cafe density is among the highest in the world and seasonal menu rotation was already an established competitive habit there before this flavour arrived. Japanese chains have followed a similar path with rather more restrained formulations and shorter windows. This is the only adoption outside North America substantial enough to move the category total meaningfully. Local reformulation rather than imported recipe transfer is what made it work.
Market Impact: Spices carry 23% of cost

Market Restraints and Challenges

Eleven week window punishing forecast error in both directions

The category earns its year in roughly 11 weeks, so a 10% overforecast becomes markdown across about 9% of seasonal stock while a 10% underforecast is a stockout in the only weeks that generate any revenue. The root cause is that the flavour is calendar-locked and culturally unsellable in January, unlike almost any other flavour profile a manufacturer works with. Commercially it forces conservative ordering and leaves demand unmet every single season. Participants are moving toward packaged formats and later production commitments to shorten the forecasting horizon. Retailers have begun pricing listings by that exposure.
Market Impact: Launches arrive 17 days earlier

Spice sourcing exposed to thin smallholder-supplied commodity markets

Cinnamon, nutmeg, ginger, clove and allspice make up roughly 23% of cost and come from smallholder farms across Indonesia, Vietnam, Sri Lanka and Madagascar. The root cause is agronomic: these are tree and rhizome crops with long establishment periods, grown in narrow geographies and traded in markets thin enough that weather in one place moves global pricing within a season. Commercially it means input cost can shift after production commitments have already been made. Forward contracting and multi-origin qualification are the mitigations, and very few participants do either seriously. Qualification takes a full season per spice.
Market Impact: Grows at 9.6% against 6.4%
3 additional market trends, 4 additional growth drivers, and 2 additional restraints and challenges are covered in the full report. Contact sales@marketmindsadvisory.com to access the complete intelligence.

Segment CAGR and Growth Architecture

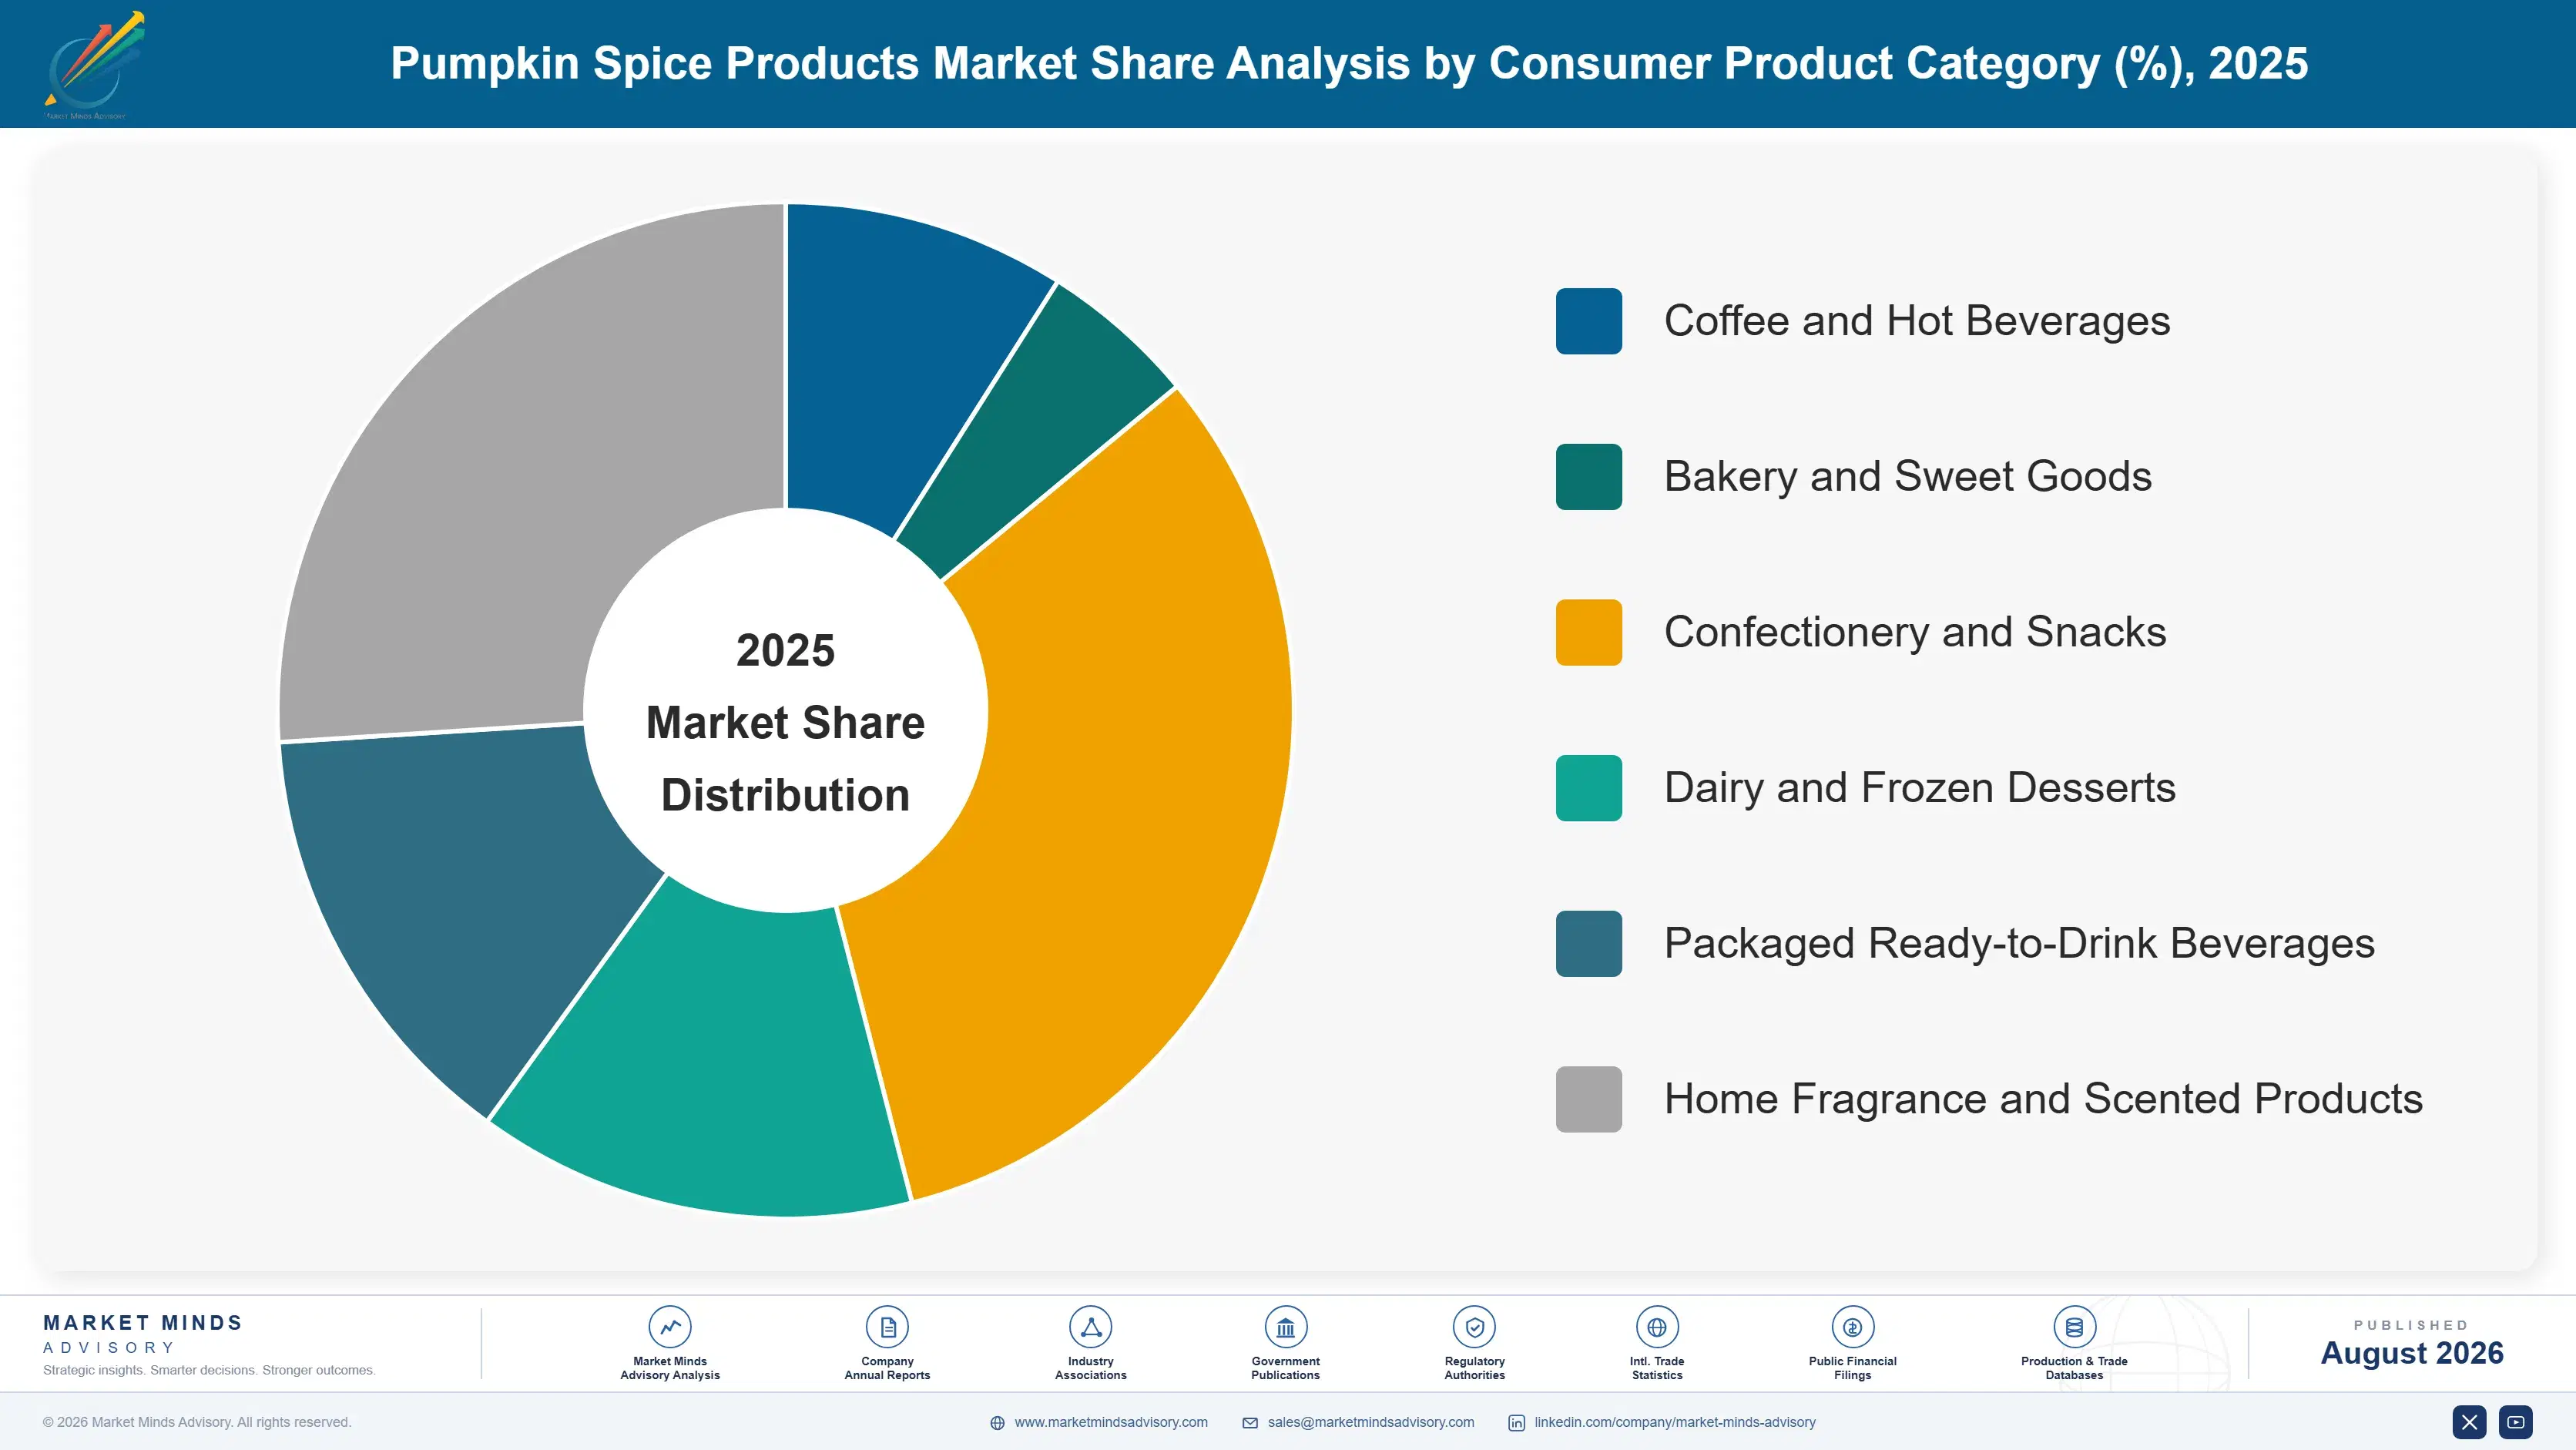
Six segments split by consumer product category, because each one faces a different shelf life constraint, a different retail channel and an entirely different relationship with the eleven week window. A candle and a latte share a flavour profile and essentially nothing else commercially. End-use occasion and channel are handled in the framework instead.
pumpkin-spice-products-market-trends-market-share-analysis-1787581069419

Packaged Ready-to-Drink Beverages

Growing at 9.6%, half again the market rate of 6.4%, packaged ready-to-drink formats convert a hard seasonal stop into a taper, since shelf-stable stock keeps moving for weeks after the foodservice promotion that created demand has ended. Retailers value that taper heavily, because it reduces the markdown exposure that makes seasonal listings uncomfortable to carry at all. Chilled and ambient formats behave differently, with ambient tolerating a longer tail and chilled commanding better pricing. Co-manufacturing dominates production, which means brand owners commit volume early and carry the forecasting risk themselves rather than sharing it. Growth here is the main reason the category total is still expanding at all, since the foodservice core that created it has clearly matured.
CAGR 9.6%

Home Fragrance and Scented Products

At 8.6% home fragrance outgrows every food format in the category, because a candle carries no formulation constraint, no shelf life problem and no food safety qualification, while commanding pricing food formats cannot approach. Consumers who would never buy a pumpkin spice beverage buy the candle regardless, which widens the addressable base considerably beyond food buyers. Unsold stock waits in a warehouse rather than expiring, which makes the forecasting problem far gentler than it is anywhere else in this category. Fragrance houses supply the scent profile, and reformulation cycles are short enough to follow consumer preference closely. Food participants who licensed the format away years ago are now watching it outgrow everything they make themselves.
CAGR 8.6%
Full segment breakdown across 6 segments available in the complete report.

Regional Architecture and Country Demand Map

North America holds 68% of value, since the flavour is tied to a North American autumn calendar that does not exist elsewhere. Western Europe follows at 14% on partial adoption, with East Asia at 8% where Korean and Japanese cafe chains have taken the platform seriously.

North America

Holding 68% against a band of 22 to 32%, North America sits far outside the band because the flavour is anchored to an autumn holiday calendar that exists here and nowhere else in the same form. American foodservice chains created the seasonal platform and still set its timing, with launch dates now around 17 days earlier than a decade ago. Canadian adoption follows American timing almost exactly, with Thanksgiving falling earlier and compressing the window slightly. Mexican uptake is concentrated in urban cafe chains. Regional growth of 5.6% reflects genuine maturity rather than any loss of interest. Home fragrance is growing considerably faster than any food format across the region.
Share: 68% | CAGR: 5.6% (2026 to 2036)

Western Europe

Adoption here is partial and channel-led rather than cultural, with British and Irish cafe chains carrying the flavour furthest because the autumn seasonal cue translates more readily into an established coffee shop habit. German and Dutch retailers stock packaged formats without the foodservice theatre that surrounds American launches. French and Italian uptake remains marginal, since domestic coffee culture treats flavoured drinks with some suspicion. Home fragrance travels considerably better than food formats do across the whole region. Growth at 5.0% sits below the base case as early adoption enthusiasm settles. British retailers now stock ambient packaged formats alongside the cafe offer, which was not true five years ago. Nordic uptake is minimal.
Share: 14% | CAGR: 5.0% (2026 to 2036)
Regional intelligence for 5 additional markets available in the complete report: East Asia, South Asia and Pacific, Latin America, Middle East and Africa, Eastern Europe. Contact sales@marketmindsadvisory.com.
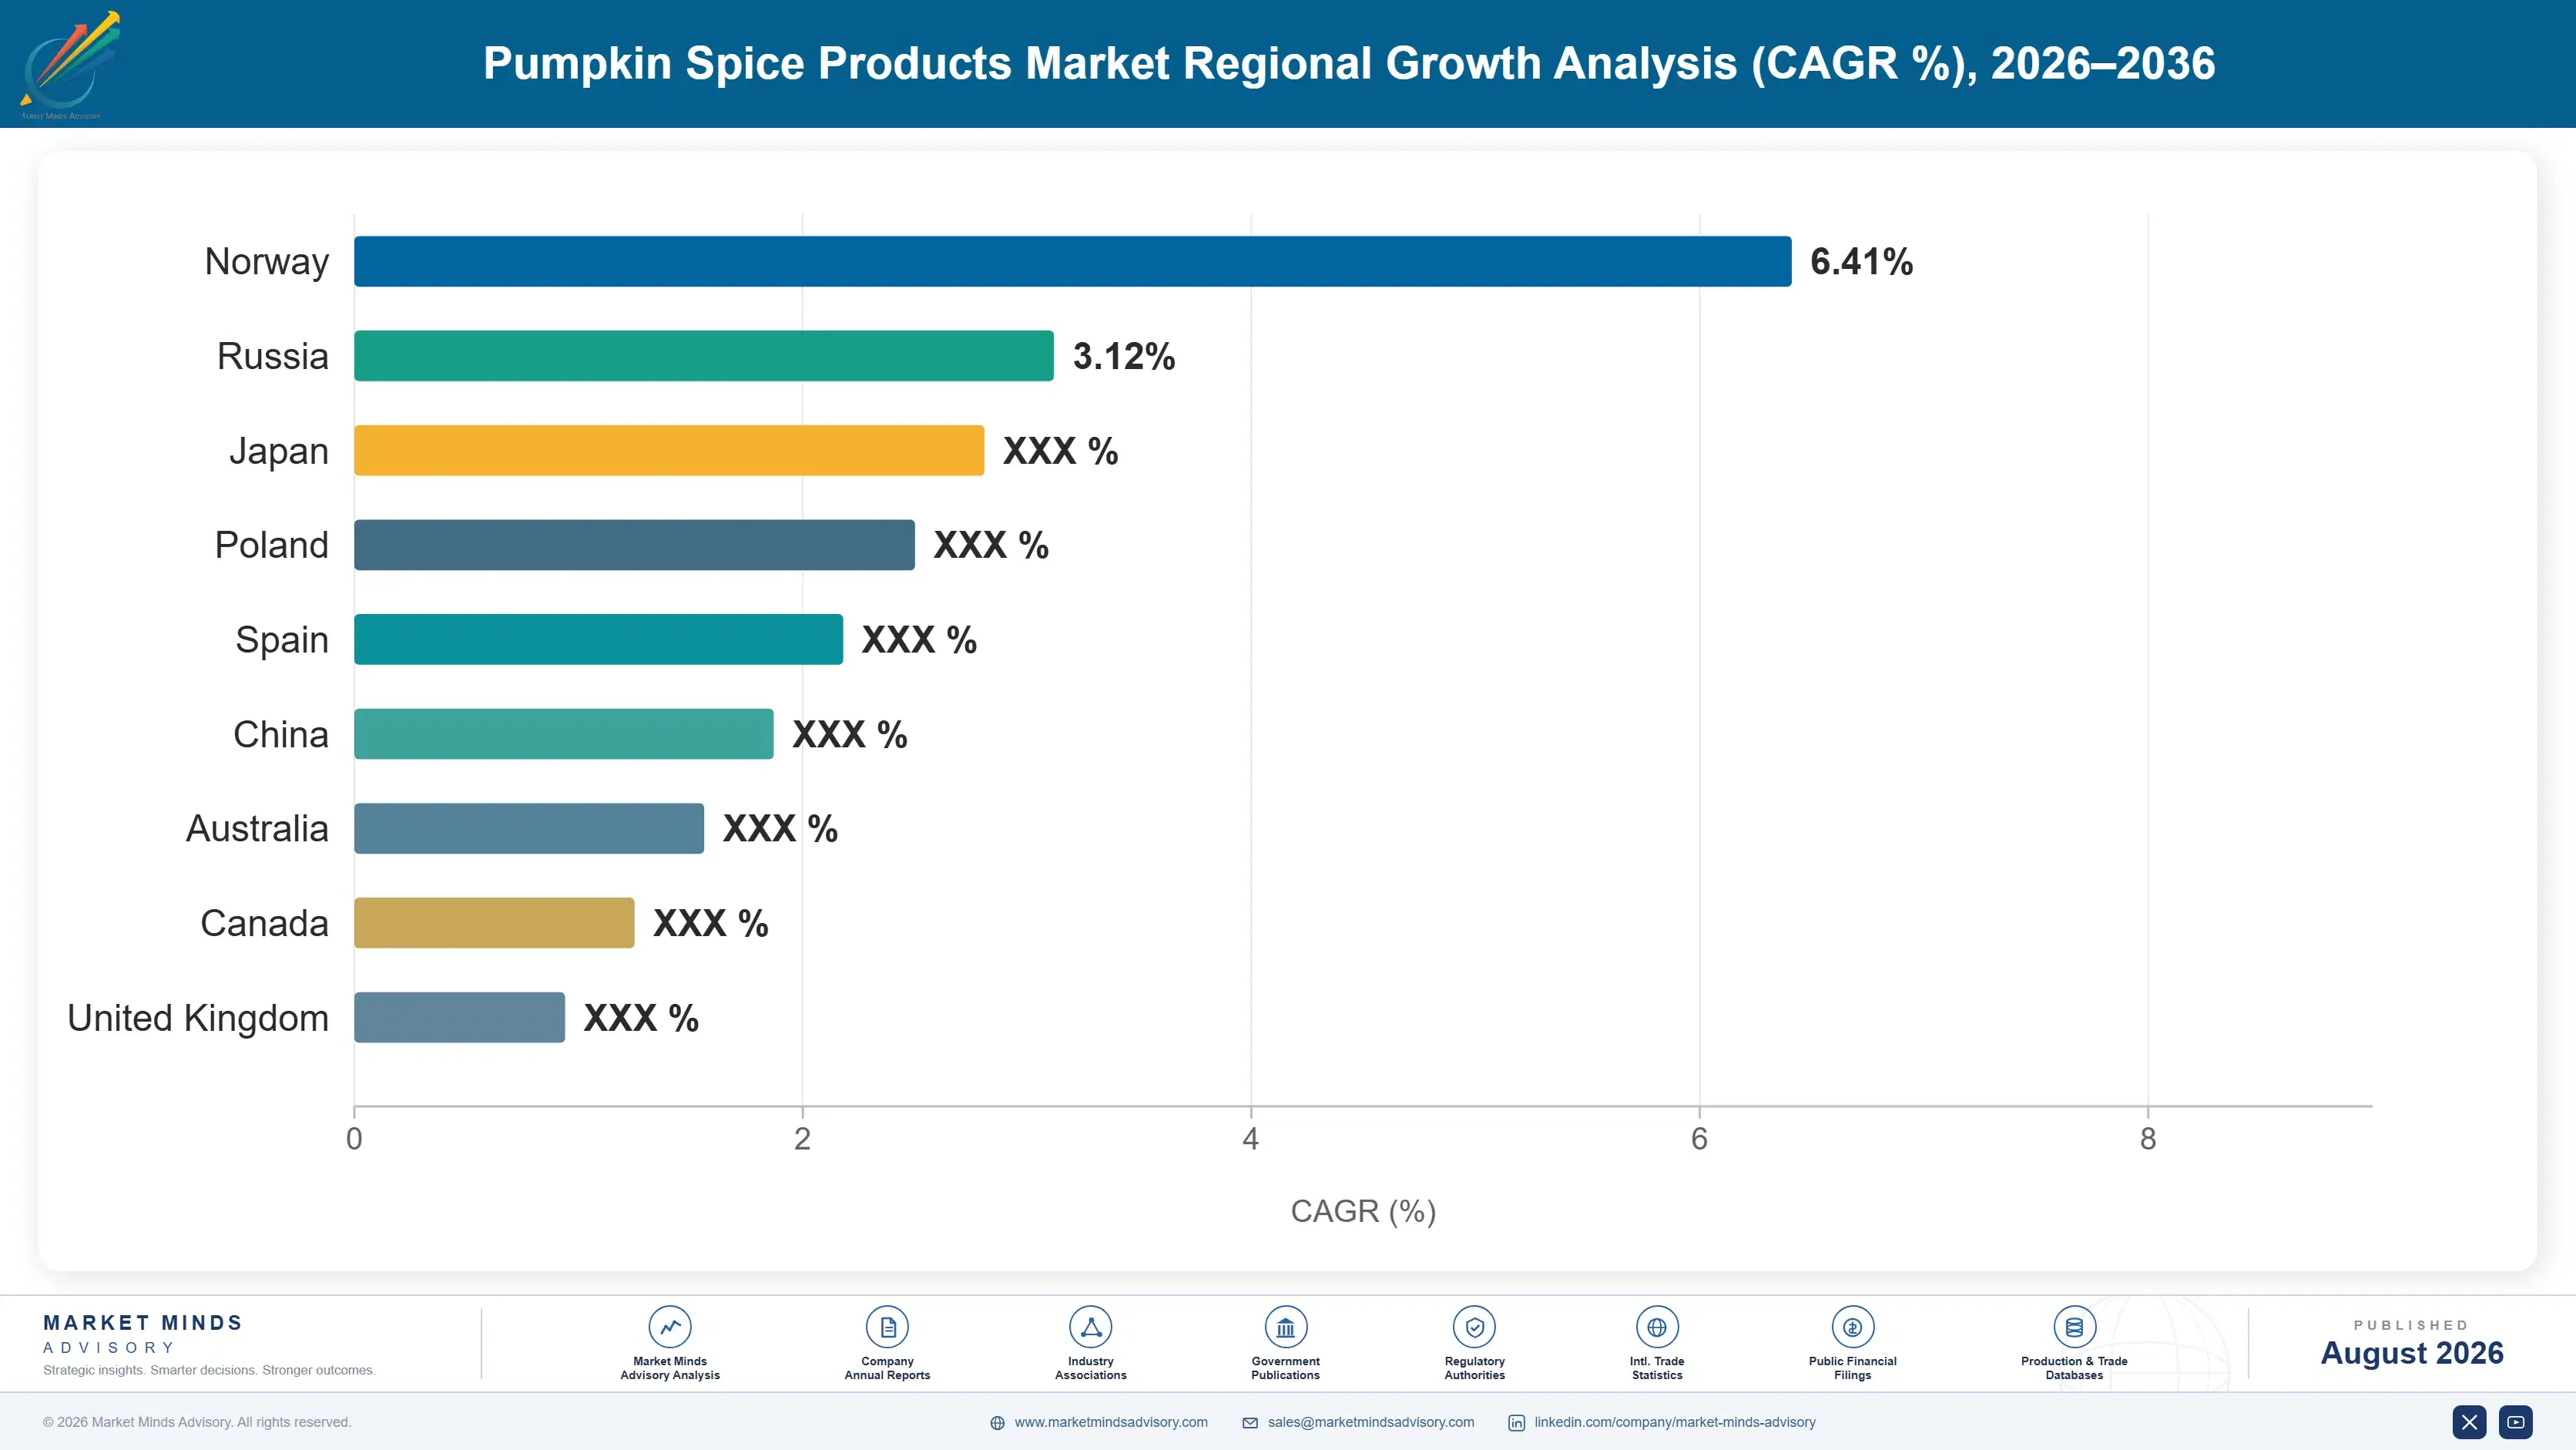
pumpkin-spice-products-market-trends-country-cagr-analysis-1787581069939

Four Moves on a Short Window

Everything commercially interesting in this category keeps coming back to eleven weeks and to what happens on either side of them. Product development gets all of the attention and all of the press coverage, while forecast accuracy, input contracting and format shelf life quietly decide which participants actually make money in a given season.

Shorten the forecast horizon through late production commitments

Markdown runs near 9% of seasonal stock because production commits months before demand is visible, and every week of horizon removed reduces that exposure directly. Co-manufacturing agreements with late-call volume options cost more per unit and save considerably more in avoided writeoff. Very few brand owners have restructured supply agreements this way, mostly because the negotiation happens in February when the previous season's pain has faded. The participants who did it report markedly lower seasonal writeoffs. The participants who did it report markedly lower writeoffs across the following two seasons, which is a return no demand planning tool has matched.
Market Impact: Cuts into the 9% seasonal markdown exposure

Contract spice forward across multiple qualified origins

Cinnamon, nutmeg, ginger, clove and allspice carry roughly 23% of cost from thin markets where weather in one growing region moves global pricing inside a season. Forward contracting after production volumes are set removes that exposure at a modest premium. Qualifying second and third origins for each spice takes a full season of sensory work and pays for itself the first time a cyclone lands badly. Almost nobody in this category can name their clove supplier, which tells you how much of this work remains undone. Multi-origin qualification is the second half of the same job.
Market Impact: Protects the 23% spice share of cost

Build packaged formats that outlive the foodservice promotion

Packaged ready-to-drink grows at 9.6% precisely because shelf-stable stock keeps selling after the cafe promotion ends, converting a hard stop into a taper that retailers value heavily. A brand present only in foodservice hands that tail to somebody else entirely. Ambient formats tolerate a longer tail while chilled commands better pricing, and running both captures more of the window than either does alone. The listing conversation with retailers is also considerably easier when markdown exposure is lower. Retailers now price seasonal listings by markdown exposure directly, which makes ambient formats easier to list.
Market Impact: Captures the 9.6% growing packaged beverage segment

Take home fragrance seriously rather than treating it as merchandise

Home fragrance grows at 8.6%, faster than every food format, with no shelf life problem, no food safety qualification and pricing food cannot approach. Food brands treat candles as licensing filler when the format outperforms their core business on every commercial measure that matters. Unsold stock waits in a warehouse rather than expiring, which makes the forecasting problem far gentler. Consumers who reject the beverage buy the candle, which is a wider addressable base than most food participants realise. Licensing the format away means collecting a royalty while somebody else earns the margin on it.
Market Impact: Enters a format now growing at 8.6% annually

Who Controls the Margin Pool

Participation is measured on annual seasonal retail and foodservice selling value, and the top five hold only 18%. Concentration is low because pumpkin spice is a flavour rather than a category anybody owns, applied across coffee, bakery, dairy, confectionery and fragrance by participants whose main businesses lie elsewhere. Starbucks leads on foodservice volume and on having created the seasonal platform. The gap to challengers is calendar authority rather than manufacturing capability.
Competition runs on three things. Launch timing decides who captures the opening weeks, which is why dates have crept 17 days earlier over a decade. Format breadth decides who captures the tail after foodservice promotions end. Forecast accuracy decides who keeps the margin, since roughly 9% of seasonal stock clears at markdown and that number varies enormously between operators.

Pressure ahead comes from packaged formats and home fragrance both growing faster than the foodservice core that created the category. That shifts advantage toward participants with retail distribution rather than store footprints. Expect format extension rather than acquisitions. Rankings shift as Korean and Japanese chains build genuine scale and as whoever solves the forecasting problem stops funding everyone else's markdown.
pumpkin-spice-products-market-trends-company-positioning-matrix-1787581070459

Competitive Moat and Risk Dimensions

STARBUCKS

Moat: Calendar authority over the season

Starbucks created the seasonal platform and its launch date still functions as the signal every other participant times against, which is a genuinely unusual position: the company effectively decides when the category's year begins. That authority converts into the opening weeks of demand and into media coverage competitors have to buy.
STARBUCKS

Risk: Foodservice concentration exposure

The position rests on store traffic during a fixed window, while packaged formats and home fragrance both grow faster and sell through retail channels where the advantage is much weaker. A category tail moving toward the chiller and the candle aisle is a tail somebody else captures, season after season.
NESTLE

Moat: Packaged format manufacturing breadth

Nestle can put the flavour into coffee, creamer, confectionery and frozen dessert formats through manufacturing assets that already exist, which spreads the seasonal risk across categories rather than concentrating it in one. That breadth also gives retailers a single conversation covering several seasonal listings at once.
NESTLE

Risk: Long production commitment horizons

Large-scale manufacturing requires volume commitments made months before seasonal demand is visible, which is exactly the exposure that produces roughly 9% markdown across the category. Scale that helps in most food categories works against a participant here, since flexibility matters far more than unit cost when the window is eleven weeks long.

Players Tracked

Prominent Players

Starbucks
Nestle
The J.M. Smucker Company
Bath and Body Works
Keurig Dr Pepper

Other Key Players

Inspire Brands
General Mills
Kellanova
Hershey
Mondelez International
Danone
Chobani
Trader Joe's
Newell Brands
Post Holdings
McCormick
International Flavors and Fragrances
Givaudan
Symrise
Conagra Brands

Recent Developments

AUGUST 2025

Major chain moves seasonal launch to earliest date on record

A large North American coffee chain launched its autumn seasonal menu in the third week of August, the earliest date the category has recorded, extending the promotional period by several days over the previous year. Competing chains matched the timing within a fortnight of the announcement.
Signal: Launch creep continues even though consumer purchasing has not moved forward at anything like the same rate
OCTOBER 2025

Clove pricing moves sharply on Madagascar cyclone damage

Cyclone damage across Madagascan growing regions moved clove pricing materially within a single quarter, after production commitments for the season had already been made. Manufacturers holding forward contracts across qualified origins absorbed considerably less of the increase than spot buyers did. Forward coverage across the category remains unusually thin.
Signal: Thin smallholder spice markets move far faster than seasonal production commitments can ever be adjusted afterwards
MARCH 2026

Retailer restructures seasonal listing terms around markdown exposure

A large American grocery retailer restructured seasonal listing terms to shift more markdown risk toward suppliers, citing writeoffs on autumn seasonal stock across several categories. Suppliers offering ambient shelf-stable formats received materially better terms than perishable format suppliers did. Ambient formats with longer tails were treated most favourably of all.
Signal: Retailers now price seasonal listings by markdown exposure, which clearly advantages shelf-stable formats over perishable ones

Spice, Dairy and the Calendar

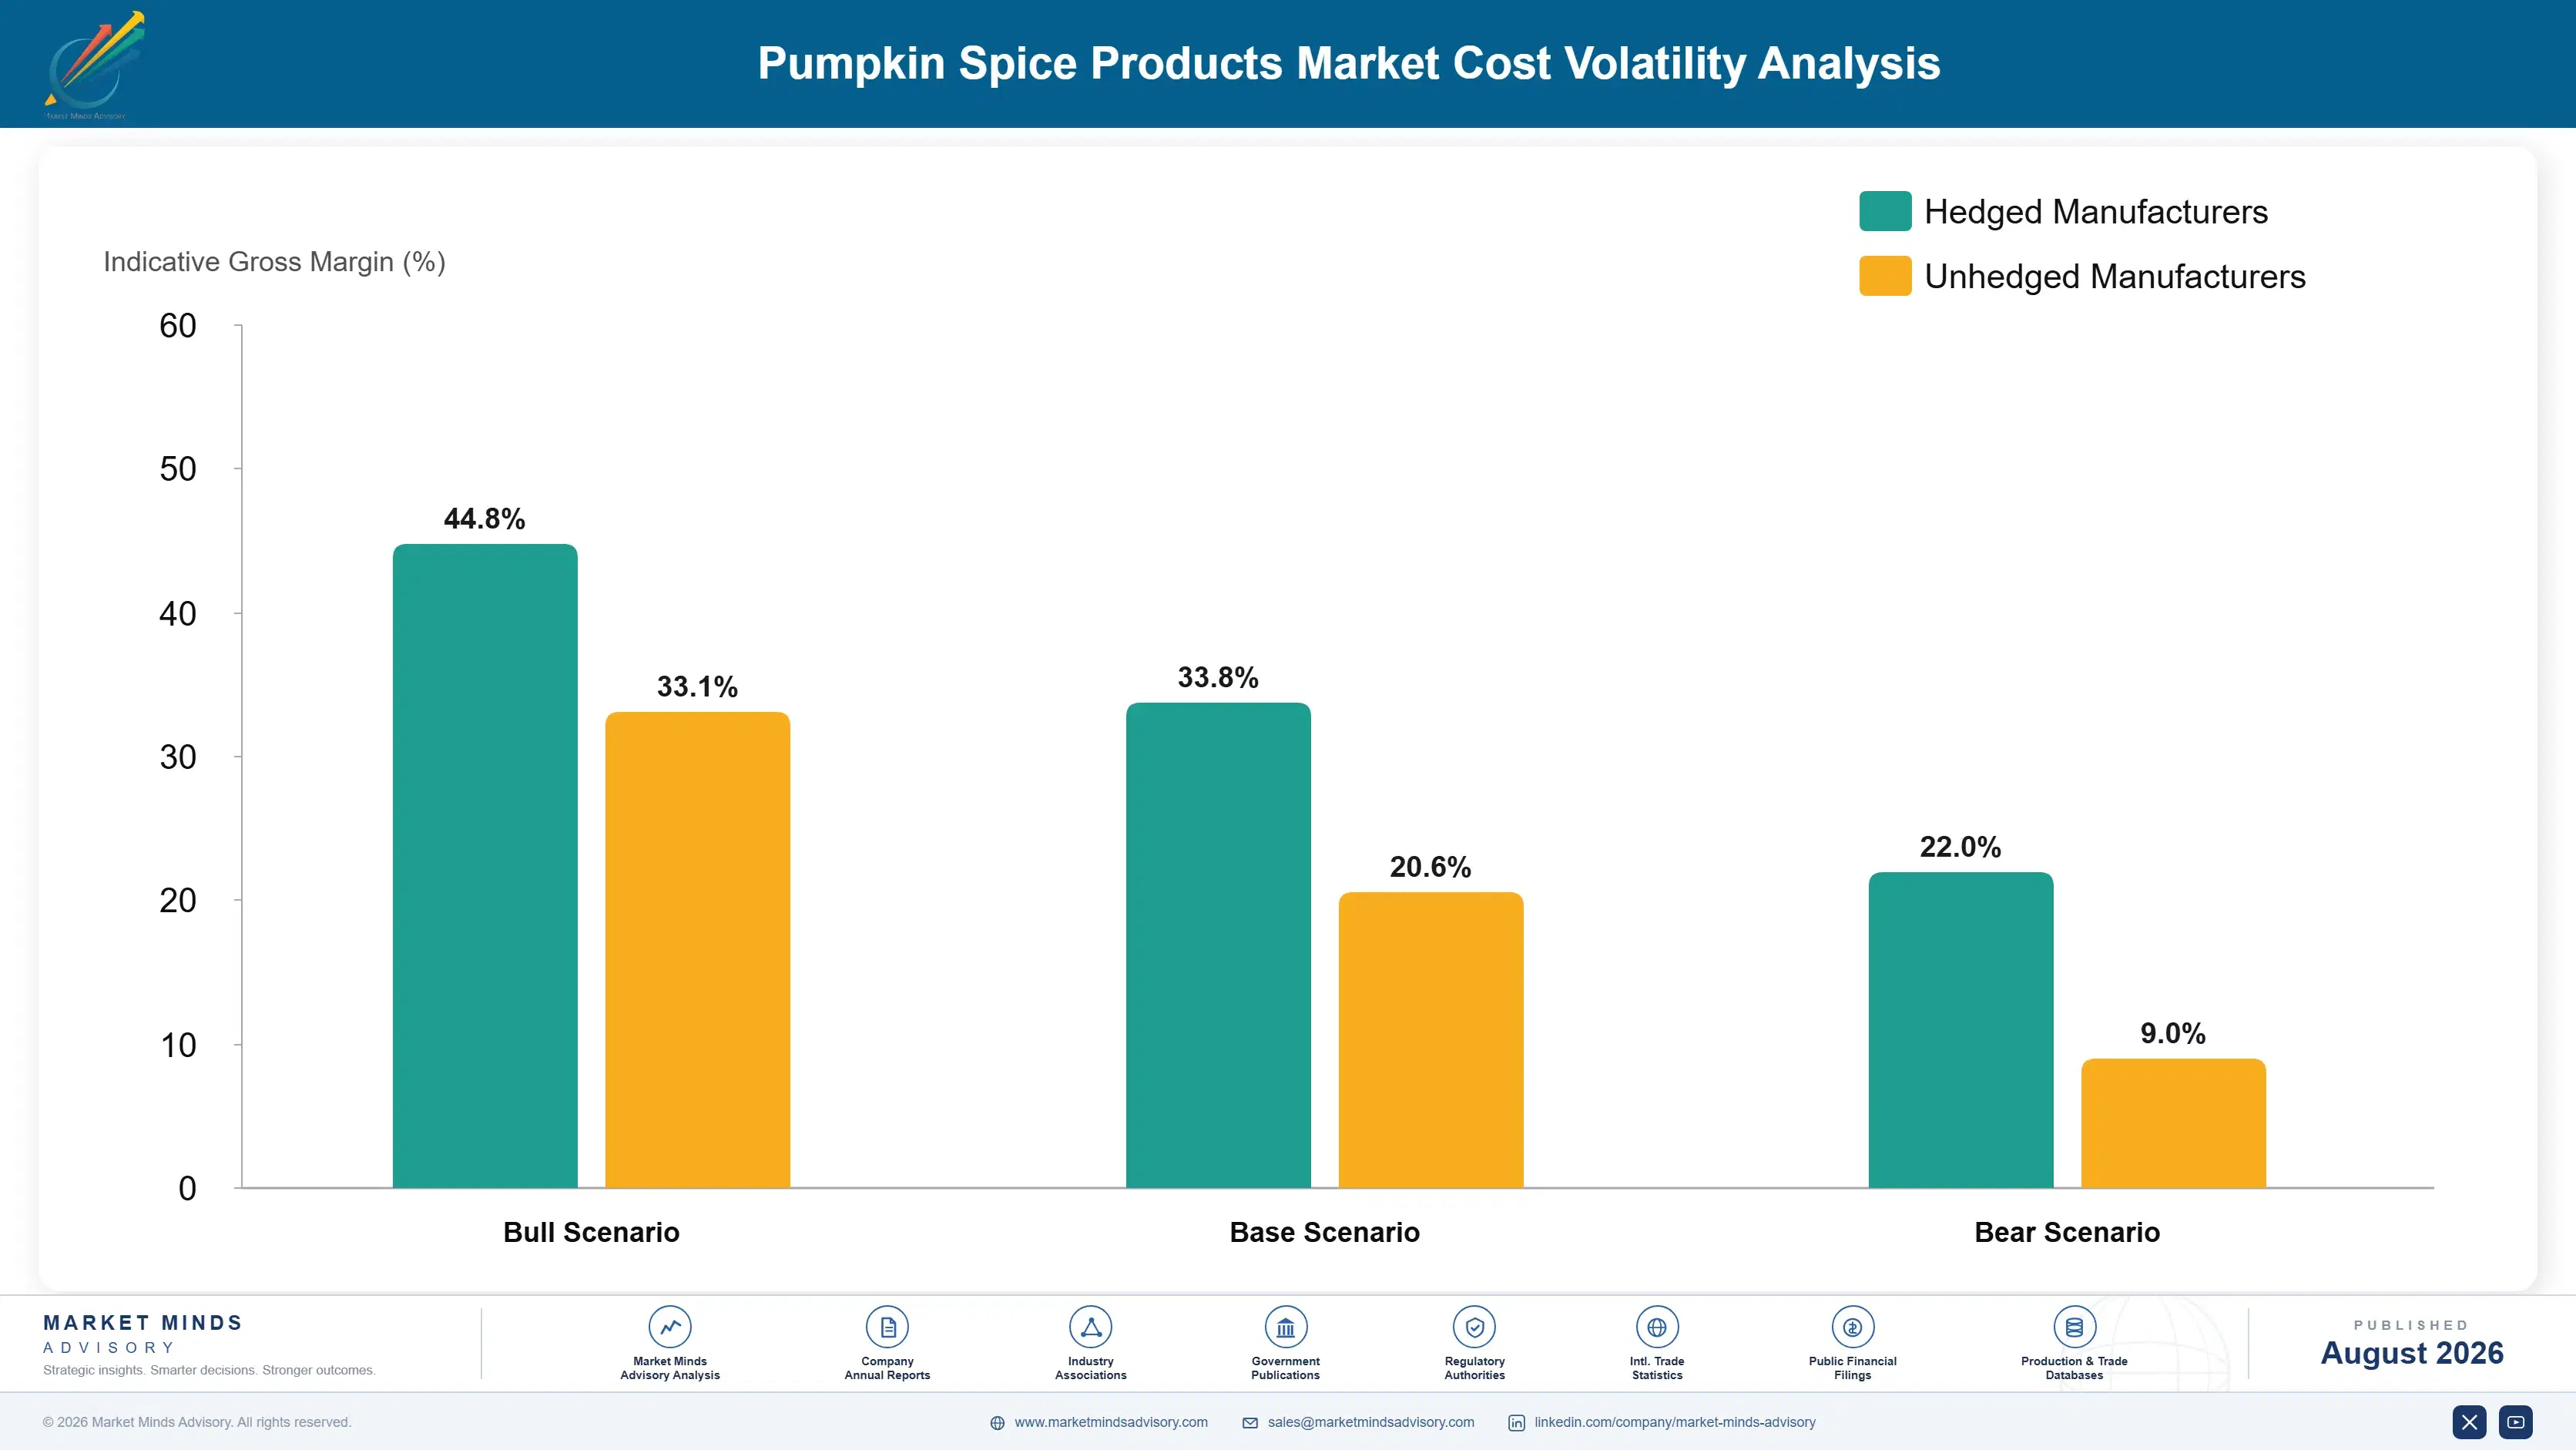
The spice blend carries roughly 23% of cost, drawn from cinnamon and cassia in Vietnam and Indonesia, nutmeg from Indonesia and Grenada, clove from Madagascar and Zanzibar, and ginger from India and China. Dairy adds around 26% in beverage and frozen formats, sourced domestically in each region. Packaging carries about 14%, inflated by seasonal graphics that cannot be reused, and actual pumpkin barely registers at all.
Clove pricing moved sharply on Madagascar cyclone damage during 2025, after seasonal production commitments had already been made, which left manufacturers buying spot absorbing the increase directly. Vietnamese cassia supply tightened across a similar period per national trade statistics. Dairy moved separately on its own cycle, so the two principal exposures diverged rather than compounding, which spared the category a worse season than it actually had.

Exposure divides on contracting discipline and on format. A participant holding forward spice contracts across multiple qualified origins carries a fraction of the risk that spot buyers do, and qualification takes a full season of sensory work that most have not done. Home fragrance participants sidestep dairy entirely and carry lower input volatility overall, which is one more reason that format outperforms food on almost every commercial measure.
pumpkin-spice-products-market-trends-cost-volatility-analysis-1787581070653

Qualify multiple origins for every spice in the blend

Spices carry roughly 23% of cost from narrow growing geographies where a single cyclone in the wrong place moves global pricing inside one season. Qualifying second and third origins takes a full season of sensory work per spice and pays for itself the first time weather lands badly. Almost nobody here can name their clove supplier.

Forward contract spice once seasonal volumes are committed

Production volumes are committed months ahead while spice is often bought closer to the run, which leaves input cost floating after selling price is effectively fixed. Contracting forward at the point volumes are set removes that exposure for a modest premium. The Madagascar clove movement during 2025 separated participants who had done this from those who had not.

Design seasonal packaging that carries across multiple years

Packaging runs around 14% of cost and seasonal graphics are typically redesigned annually, which means unused stock writes off alongside the product inside it. Designing a base pack that carries across years with only date-agnostic seasonal elements reduces that waste considerably. Retailer pressure for novelty works against this, and the saving is real enough to negotiate over.

Portfolio Architecture for Margin Defence

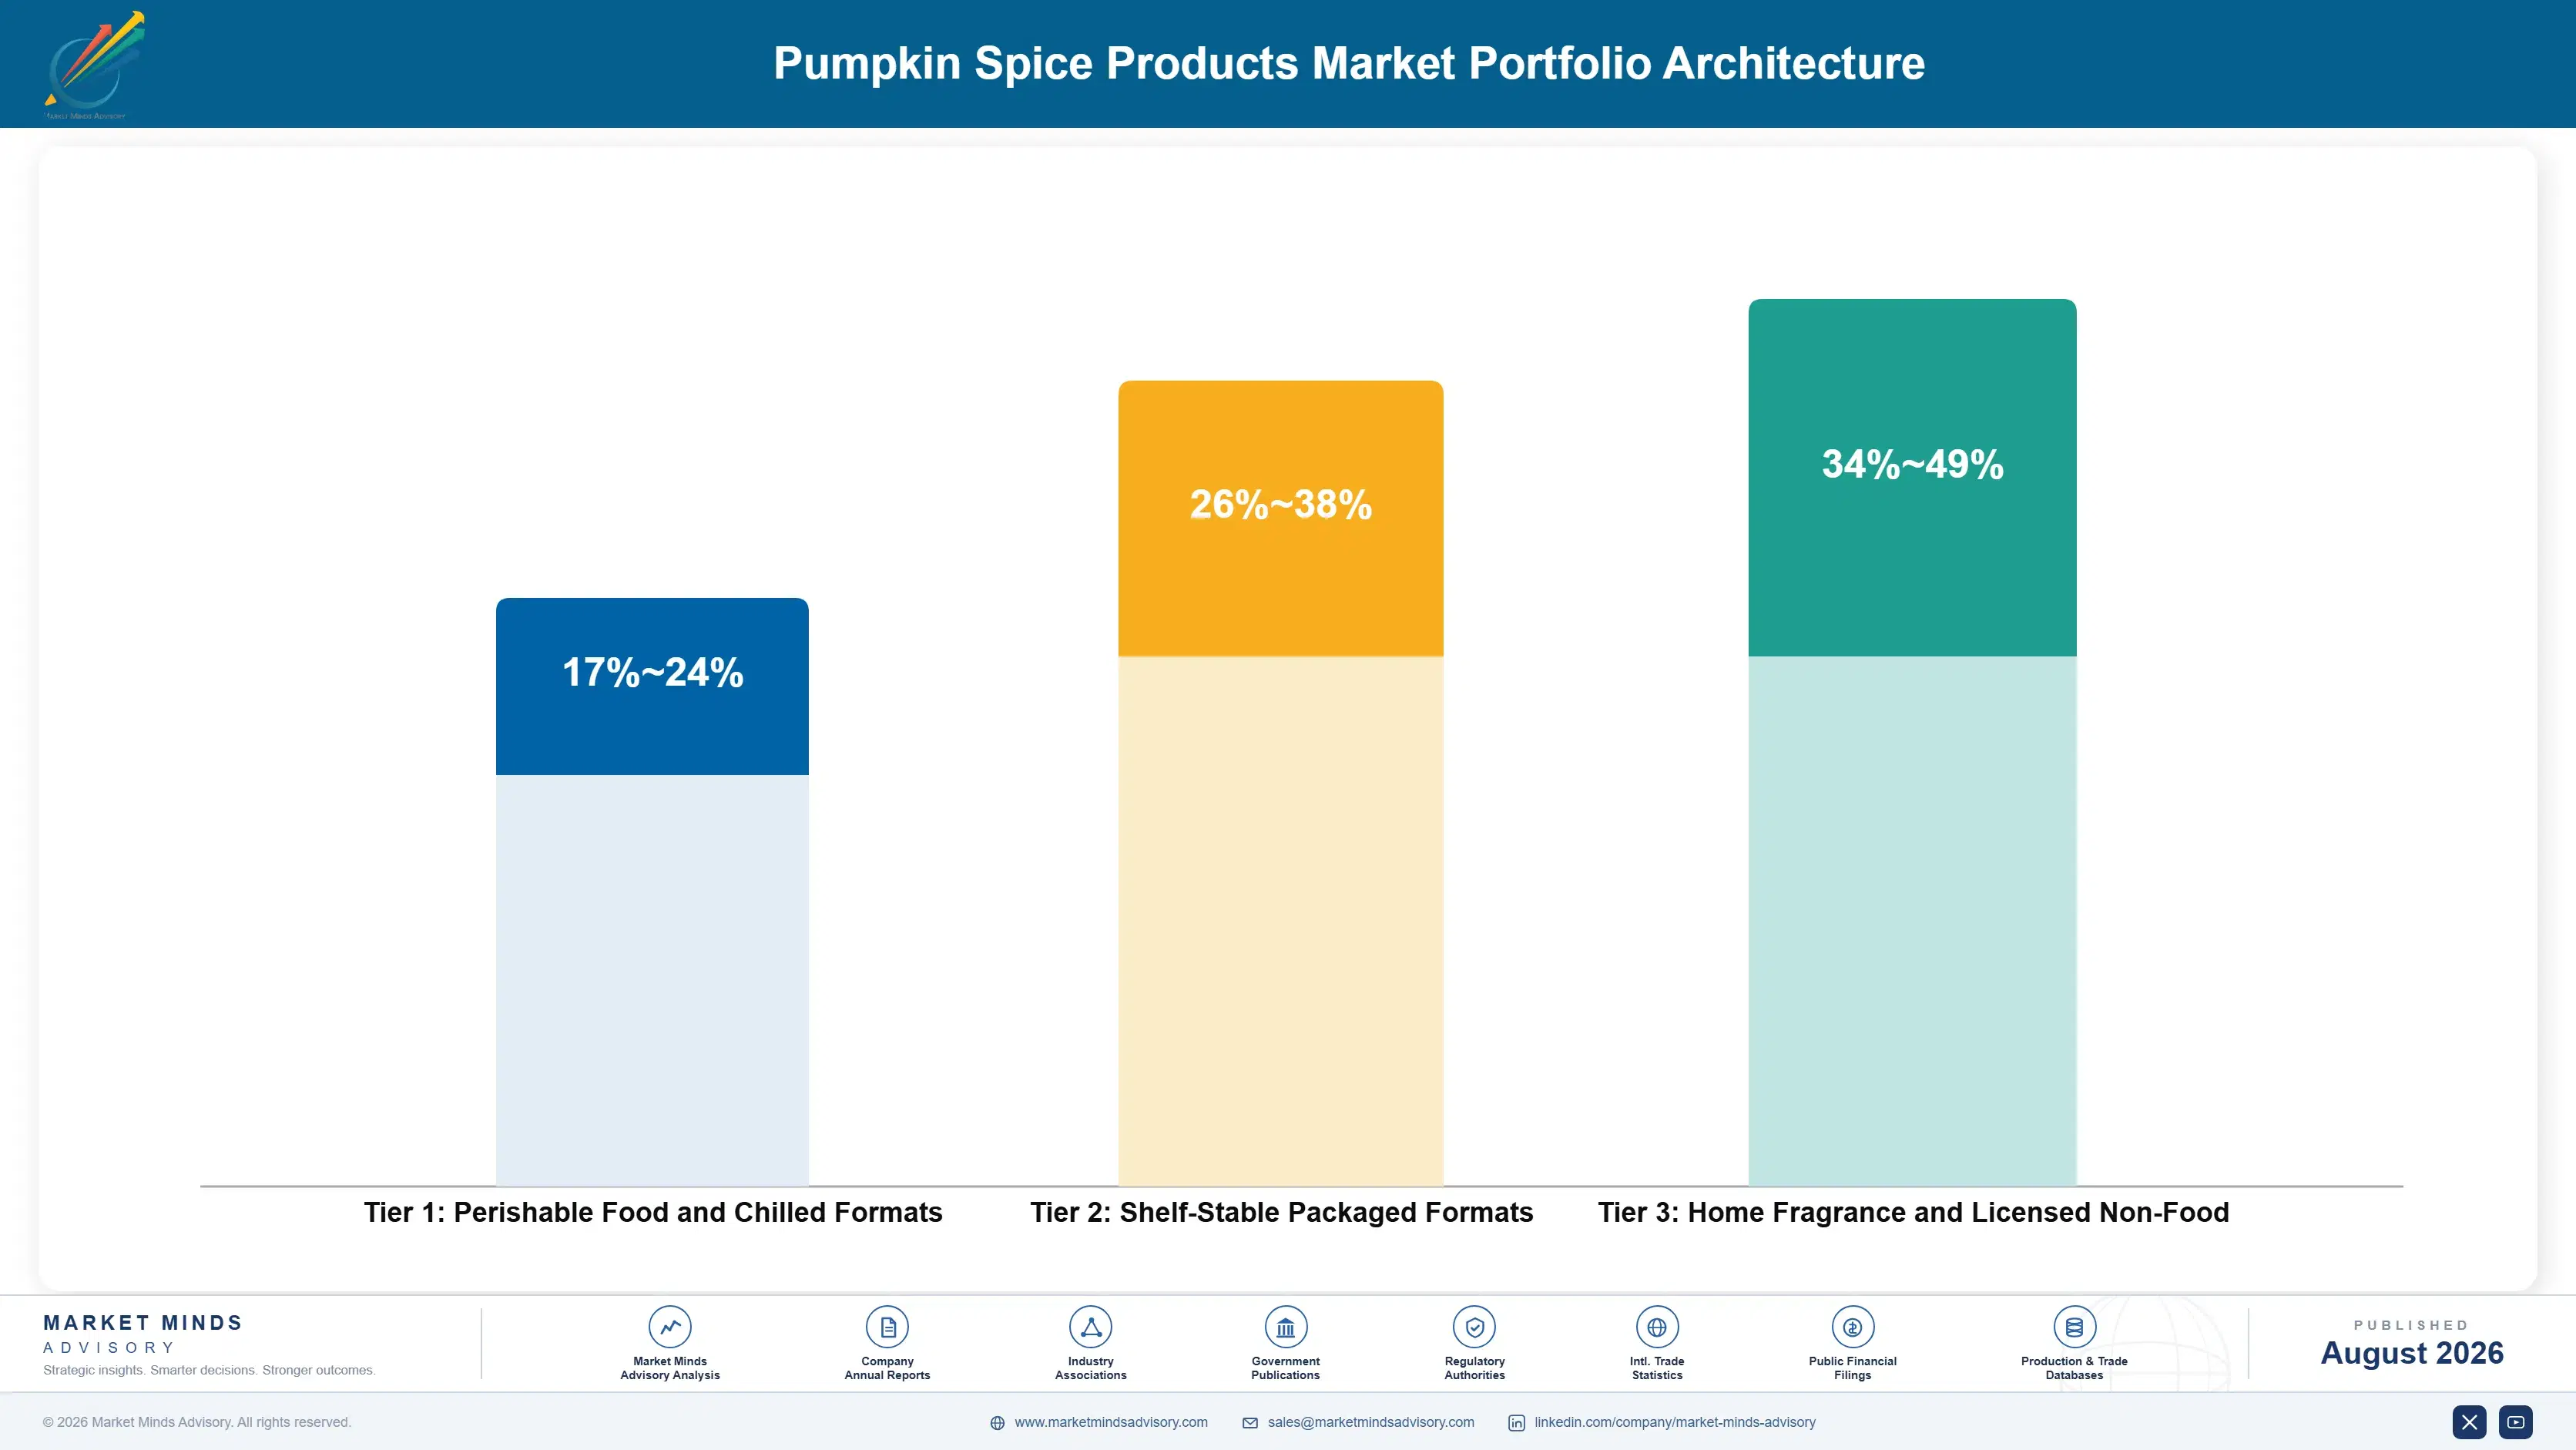
Margin here follows shelf life almost as closely as it follows brand. Perishable food formats, fresh bakery and chilled dairy desserts earn margins in the high teens to low twenties, because unsold stock has no residual value whatsoever once the window shuts and markdown lands on the maker rather than the retailer. Every participant with a bakery line makes a version, and few earn much from it.
Shelf-stable packaged formats do considerably better in the high twenties to high thirties, because ambient stock tolerates a tail, carries into the following season where the graphics permit it, and gives retailers a listing conversation that does not begin with markdown exposure. The range reflects brand strength and how much of the tail a format actually captures. Ambient stock tolerates a longer tail while chilled commands better pricing.

Home fragrance and licensed non-food formats hold the strongest position, reaching into the high forties, because a candle has no expiry, no food safety qualification and pricing food cannot approach. Those margins reflect an absence of constraints rather than any superior capability, which is exactly why food participants keep underestimating the format. Food participants keep treating the best-performing format in their own category as licensing filler.

Perishable Food and Chilled Formats

Fresh bakery, chilled dairy desserts and short-life foodservice items. The seven point range reflects channel and brand rather than product difference, with markdown exposure the dominant variable across every operator.
Gross Margin: 17-24%

Shelf-Stable Packaged Formats

Ambient ready-to-drink beverages, confectionery and packaged bakery with genuine shelf life. The twelve point range reflects brand strength and how much of the post-promotion tail the format actually manages to capture.
Gross Margin: 26-38%

Home Fragrance and Licensed Non-Food

Candles, diffusers, air fresheners and licensed seasonal merchandise sold through gift and mass retail. The fifteen point range reflects the gap between licensed filler product and genuinely developed fragrance ranges, which is very wide indeed.
Gross Margin: 34-49%
pumpkin-spice-products-market-trends-portfolio-architecture-1787581071148

High-value Sub-segments and Strategic Watch-out

Home Fragrance and Scented Products

High value and growing at 8.6%, faster than every food format, with no shelf life constraint and pricing food cannot reach. Consumers who reject the beverage still buy the candle, which widens the addressable base well beyond food buyers. Repeat rates sit closer to the foodservice ritual than to grocery.
Gross Margin: 36-49%

Ambient Ready-to-Drink Beverages

High value and the fastest food format at 9.6%, converting a hard seasonal stop into a taper that retailers value. Shelf-stable stock keeps selling after the foodservice promotion that created the demand has already ended. Retailers now price seasonal listings by markdown exposure directly. Ambient tolerates a longer tail.
Gross Margin: 28-38%

Seasonal Bakery and Sweet Goods

The volume core, carrying the heaviest markdown exposure of any format because short shelf life leaves no tail at all. Every participant with a bakery line makes a version, and none of them earns much from doing it. Retailer listing terms have shifted against perishable formats.
Gross Margin: 17-24%

Foodservice Beverage Programmes

The strategic watch-out. This is where the category started and where growth has slowed most, as packaged formats and fragrance capture the tail. The twelve point range reflects the gap between chains with calendar authority and those following. Growth here has slowed more than in any other format.
Gross Margin: 22-34%

The Annuity Nobody Calls One

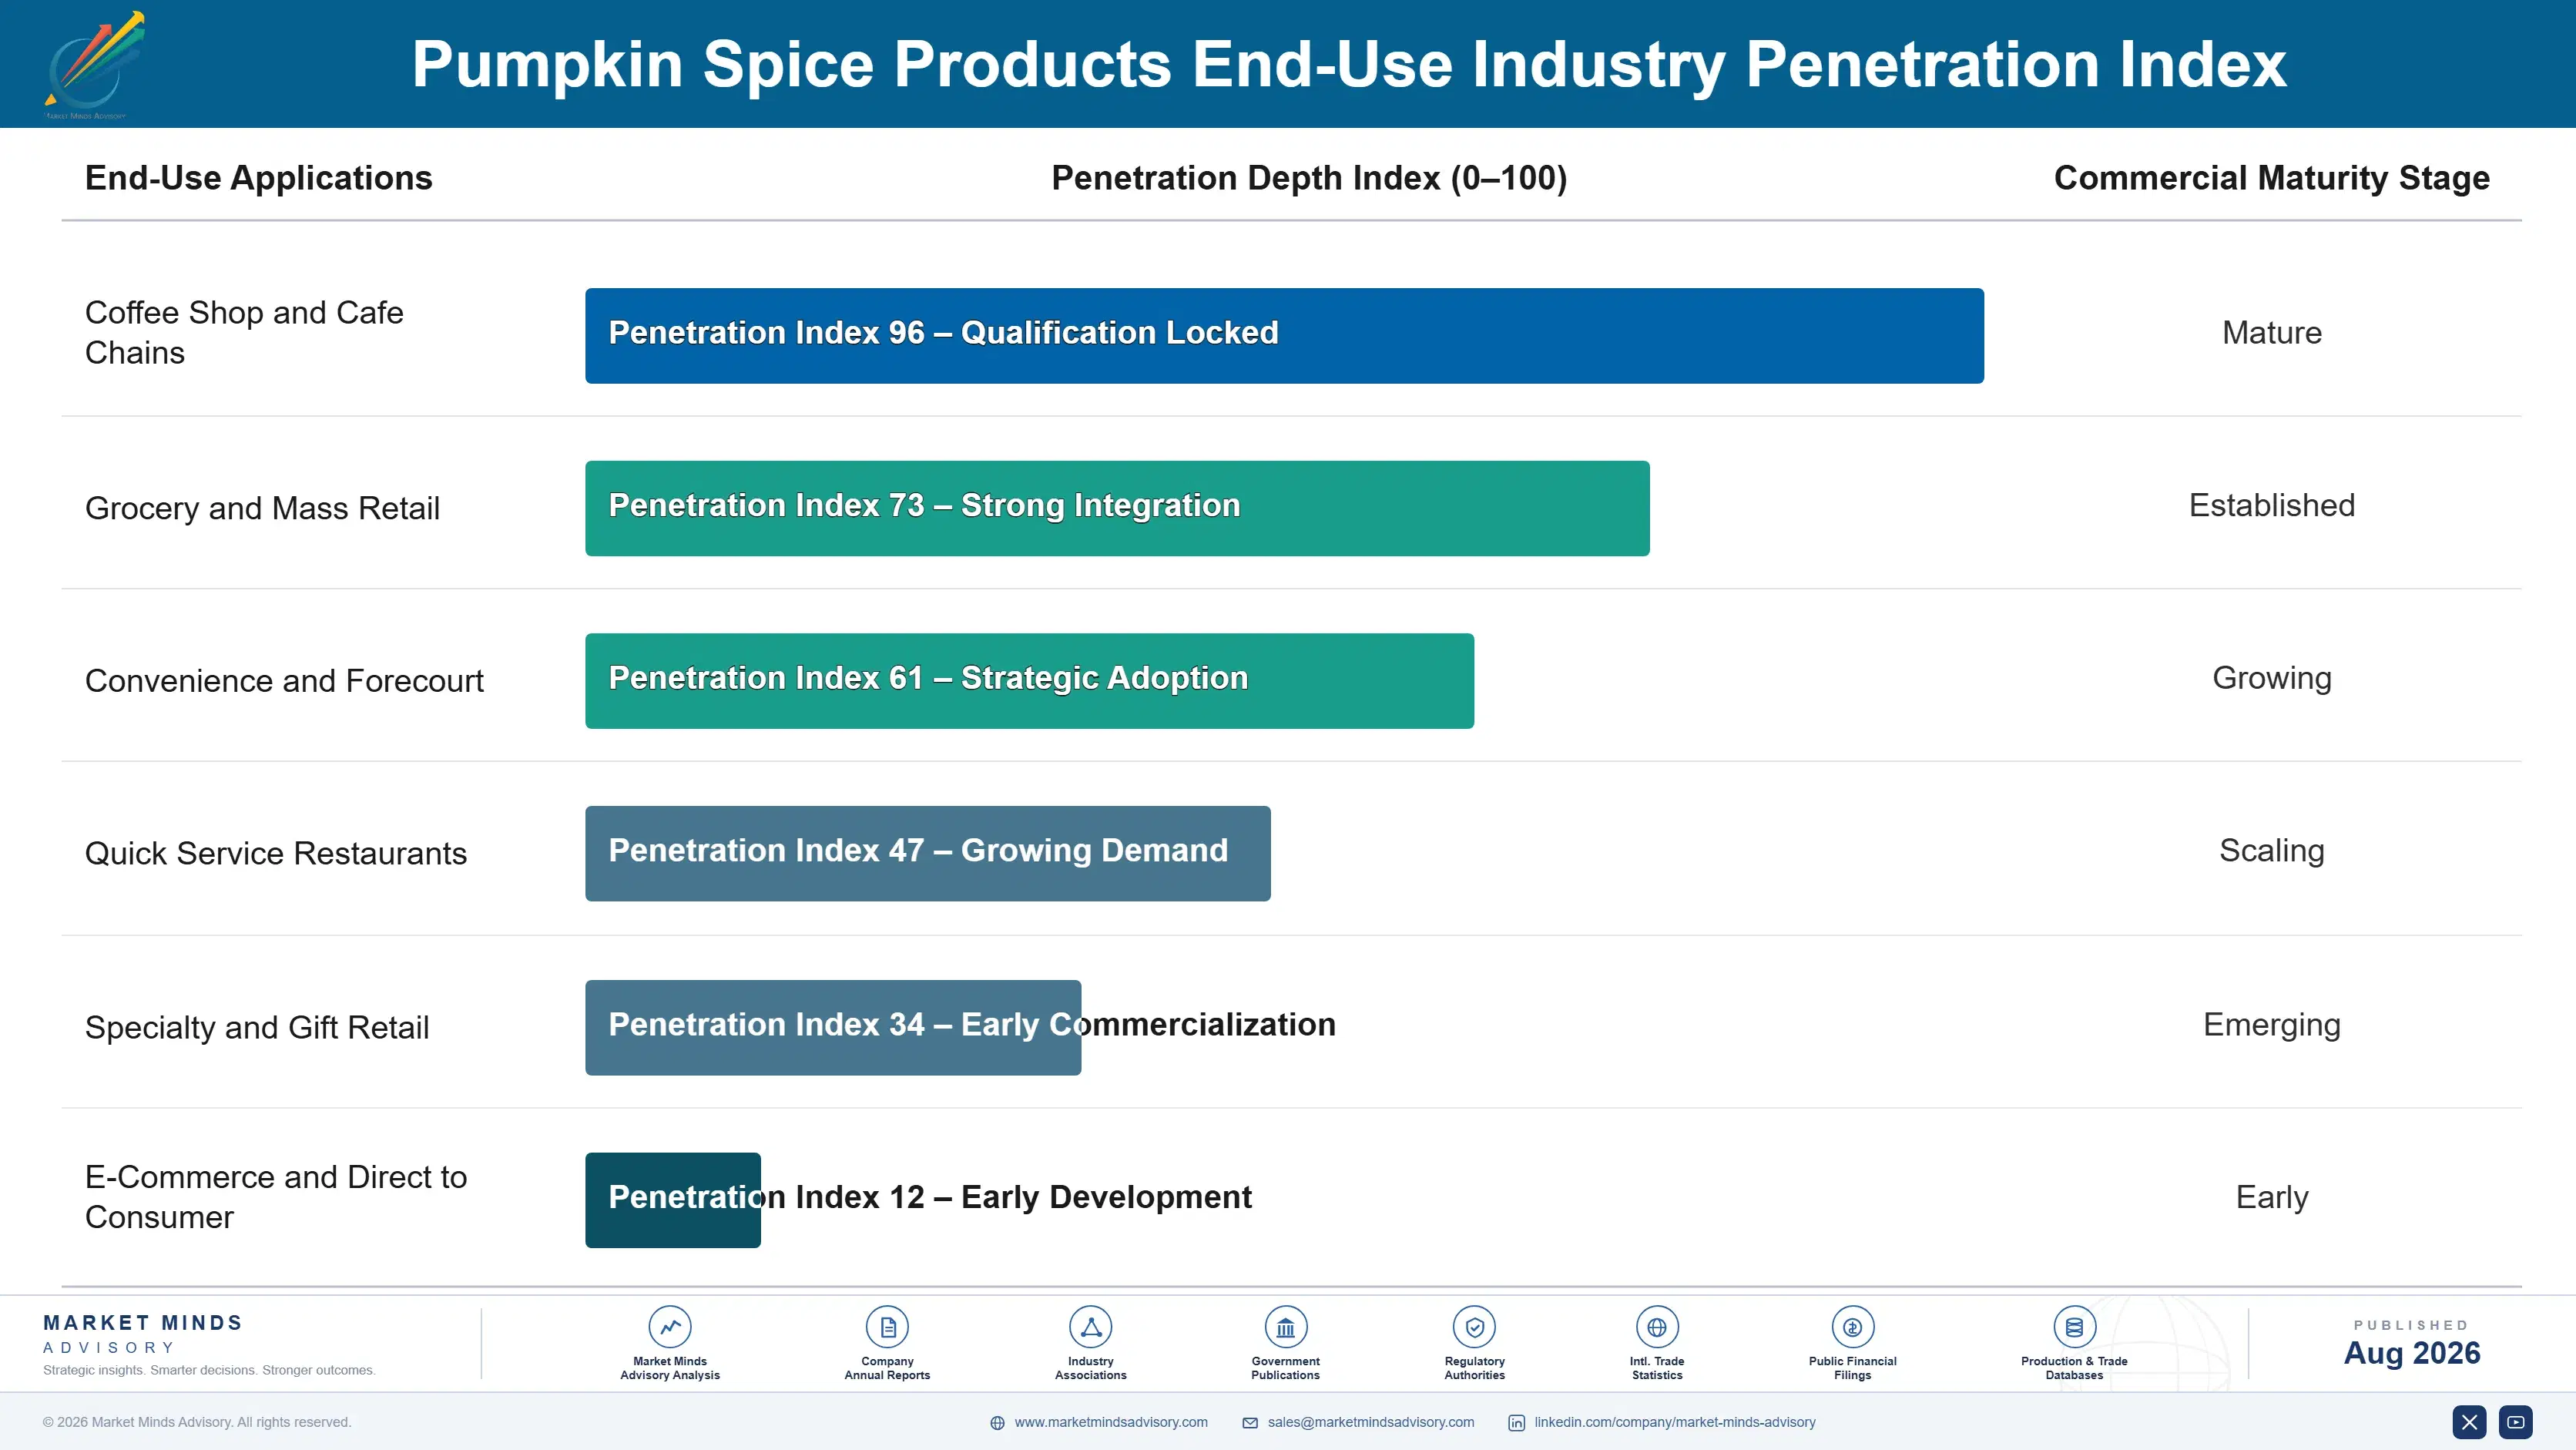
This is an annuity that pays once a year and pays reliably, which is an unusual shape for a food category. Consumers return to the same purchase in the same weeks with a consistency that most brands would pay heavily for, and the repeat behaviour is anchored to a calendar rather than to a habit that can drift. What varies is which product captures the occasion, not whether the occasion happens.
Adoption depth divides sharply by format. Foodservice beverage purchase is a ritual for a substantial cohort, repeated within days of launch every year and largely immune to price. Packaged grocery purchase is more casual and switches on availability and promotion. Home fragrance sits somewhere unexpected, with repeat rates closer to the foodservice ritual than to grocery, since the purchase marks the season rather than satisfying an appetite.

The buyer has broadened well past the original cohort. Two decades ago this was a young urban coffee purchase; the same consumers now buy candles, creamers and frozen desserts under the same flavour, while a younger cohort engages more ironically and buys anyway. Parody volume around each August launch functions as marketing, and participants who mistake mockery for rejection consistently underforecast.
pumpkin-spice-products-market-trends-end-use-penetration-index-1787581071637

Where We Would Focus Effort

These are among the four positions where our research anticipates prominent divergence between winners and laggards over the coming forecast period. Each is grounded in the demand model, the regulatory perimeter, and the announced capacity pipeline.
01 / SEASONAL FORECAST DISCIPLINE

Shorten the horizon rather than sharpening the guess

Markdown runs near 9% of seasonal stock because production commits months before demand is visible, and no forecasting method closes a gap that wide across a category with an eleven week window. Removing weeks of horizon through co-manufacturing agreements with late-call volume options costs more per unit and saves a great deal more in avoided writeoff. Very few brand owners have restructured supply this way, largely because the negotiation happens in February when last season's pain has conveniently faded from everybody's memory.
02 / SPICE ORIGIN CONTRACTING

Know your clove supplier before the cyclone arrives

Cinnamon, nutmeg, ginger, clove and allspice carry roughly 23% of cost out of thin markets where weather in one narrow growing region moves global pricing inside a single season. Madagascar cyclone damage during 2025 separated participants holding forward contracts across qualified origins from those buying spot after seasonal volumes had already been committed. Qualifying second and third origins takes a full season of sensory work per spice and pays for itself the first time weather lands badly in a growing region that matters.
03 / FORMAT TAIL CAPTURE

Own the weeks after the promotion ends

Packaged ready-to-drink grows at 9.6% against a market rate of 6.4% precisely because shelf-stable stock keeps selling once the cafe promotion that created the demand has finished. A brand present only in foodservice hands that entire tail to somebody else in every single season it runs. Retailers now price seasonal listings by markdown exposure, which makes the listing conversation considerably easier for anyone arriving with an ambient format rather than a perishable one, and that gap has widened in every one of the last three seasons.
04 / FRAGRANCE FORMAT SERIOUSNESS

Stop treating candles as licensing filler

Home fragrance grows at 8.6%, faster than every food format in the category, with no shelf life constraint, no food safety qualification and pricing that food formats cannot approach at all. Unsold stock waits in a warehouse rather than expiring, which makes the forecasting problem far gentler than anywhere else here. Consumers who would never buy the beverage buy the candle regardless, and food participants keep treating the best format in their category as merchandise rather than as the growth engine it plainly is.

Engagement Snapshot From the Field

A live engagement with an industry participant carrying material or product regulatory and market exposure ahead of a defining policy shift, showing how our research translates into a defensible multi-year portfolio strategy.
MARKET MINDS ADVISORY · CLIENT ENGAGEMENT SUMMARY
Pumpkin Spice Products Producer Strategic Portfolio Review and Transition Roadmap 2026·Investment Scenario on Pumpkin Spice Products Exposure Evaluation 2025-26
CLIENT PROFILE
A North American packaged food manufacturer running seasonal pumpkin spice lines across bakery, creamer and frozen dessert formats, with seasonal revenue near 84 million dollars (client-reported, unverified by MMA). Production committed in March against a window opening in late August, and seasonal writeoffs had exceeded budget in three consecutive years without anyone establishing quite why.
STRATEGIC CHALLENGE
Management believed the problem was forecasting accuracy and had invested twice in demand planning tools without improving the outcome. The board wanted to know whether the seasonal portfolio was worth continuing at all, or whether the writeoffs reflected something about format mix rather than about the quality of the forecast itself.
MMA APPROACH
MMA decomposed three seasons of writeoff by format and shelf life, benchmarked co-manufacturing terms against late-call alternatives, tested retailer listing terms against markdown exposure, and sized the home fragrance format the client had licensed away years earlier. Interviews with 47 experts covered seasonal category management, co-manufacturing arrangements and fragrance product development.
KEY FINDINGS
  1. More than four fifths of writeoff came from perishable bakery and chilled formats, while ambient packaged lines cleared the season with negligible markdown across all three years examined.
  2. The forecasting tools were performing acceptably; the problem was a five month commitment horizon that no forecast could reasonably span for a category with an eleven week window.
  3. Retailer listing terms had already shifted to favour ambient formats, and the client's perishable lines were absorbing markdown risk the retailer no longer carried.
  4. The licensed home fragrance line generated royalty income roughly a twentieth of what the licensee earned on it, against a format growing faster than anything the client made itself.
CLIENT PROFILE
A North American packaged food manufacturer running seasonal pumpkin spice lines across bakery, creamer and frozen dessert formats, with seasonal revenue near 84 million dollars (client-reported, unverified by MMA). Production committed in March against a window opening in late August, and seasonal writeoffs had exceeded budget in three consecutive years without anyone establishing quite why.
STRATEGIC CHALLENGE
Management believed the problem was forecasting accuracy and had invested twice in demand planning tools without improving the outcome. The board wanted to know whether the seasonal portfolio was worth continuing at all, or whether the writeoffs reflected something about format mix rather than about the quality of the forecast itself.
MMA APPROACH
MMA decomposed three seasons of writeoff by format and shelf life, benchmarked co-manufacturing terms against late-call alternatives, tested retailer listing terms against markdown exposure, and sized the home fragrance format the client had licensed away years earlier. Interviews with 47 experts covered seasonal category management, co-manufacturing arrangements and fragrance product development.
KEY FINDINGS
  1. More than four fifths of writeoff came from perishable bakery and chilled formats, while ambient packaged lines cleared the season with negligible markdown across all three years examined.
  2. The forecasting tools were performing acceptably; the problem was a five month commitment horizon that no forecast could reasonably span for a category with an eleven week window.
  3. Retailer listing terms had already shifted to favour ambient formats, and the client's perishable lines were absorbing markdown risk the retailer no longer carried.
  4. The licensed home fragrance line generated royalty income roughly a twentieth of what the licensee earned on it, against a format growing faster than anything the client made itself.
RECOMMENDED STRATEGY
Phase 1: Phase one: renegotiate co-manufacturing for late-call volume options on ambient lines, since horizon rather than forecast quality drives the writeoff. Phase 2: Phase two: reduce perishable seasonal formats to the two lines that clear reliably, and redeploy that volume into ambient packaged beverages. Phase 3: Phase three: reclaim home fragrance at licence expiry and develop the format properly rather than continuing to collect a royalty on it.
OUTCOME
The manufacturer cut seasonal writeoff by more than half during the 2026 season while holding revenue broadly flat (client-reported, unverified by MMA). Two perishable lines were discontinued, ambient beverage volume grew, and notice was served on the fragrance licence ahead of its renewal date. Forecasting tools were left unchanged.

Frequently Asked Questions

Foundational context covering the market sizes, CAGR, scope, country, region and competition that inform every finding below. This section is provided to cover basics and most often pre-purchase conversations, answered from the MMA Primary Research Dataset.

What is the current size of the Pumpkin Spice Products Market?

MMA sizes it at USD 1.34 billion in 2025, rising to USD 1.43 billion in 2026. The figure covers seasonal consumer products across food, beverage and home fragrance at retail and foodservice selling value.

How large will the Pumpkin Spice Products Market be by 2036?

USD 2.66 billion by 2036, an incremental USD 1.23 billion over the 2026 base and an expansion multiple of 1.86 times. Packaged and fragrance formats account for most of that growth.

What is the CAGR for the Pumpkin Spice Products Market 2026 to 2036?

6.4% in the base case, with a bull case at 7.6% and a bear case at 5.2%. The spread turns on whether the seasonal window widens or consumer fatigue finally sets in.

Which segment is growing fastest?

Packaged ready-to-drink beverages at 9.6%, half again the market rate of 6.4%. Shelf-stable stock keeps selling after the foodservice promotion that created the demand has ended.

Who are the major companies in the Pumpkin Spice Products Market?

Starbucks, Nestle, Smucker, Bath and Body Works and Keurig Dr Pepper lead on annual seasonal selling value. Fifteen further participants across food, beverage and fragrance are profiled in the full report on that same basis.

Which country is growing fastest?

South Korea at 9.2%, where domestic cafe chains adopted autumn seasonal flavour marketing on local terms rather than importing American recipes and launch timing wholesale from the United States.

Report Segmentation Architecture

The full report scope spans multiple orthogonal segmentation dimensions, with cross-tabulated demand data provided for each dimension pair. Coverage extends further to regional breakdowns, trend trajectories, and the competitive detail needed to support segment-level decision-making.

By Consumer Product Category

  • Coffee and Hot Beverages
  • Bakery and Sweet Goods
  • Confectionery and Snacks
  • Dairy and Frozen Desserts
  • Packaged Ready-to-Drink Beverages
  • Home Fragrance and Scented Products

By End-Use Industry

  • Coffee Shop and Cafe Chains
  • Grocery and Mass Retail
  • Convenience and Forecourt
  • Quick Service Restaurants
  • Specialty and Gift Retail
  • E-Commerce and Direct to Consumer

By Commercial Dimension

  • Branded Seasonal Ranges
  • Private Label Seasonal Lines
  • Licensed Brand Extensions
  • Foodservice Promotional Programmes
  • Limited Edition Collaborations
  • Export and Cross-Border Supply

By Region

  • North America
  • Western Europe
  • East Asia
  • South Asia and Pacific
  • Latin America
  • Middle East and Africa
  • Eastern Europe

Scope, Methodology, and Coverage

Every figure in this report is reproducible from documented input assumptions. The scope below maps the historical period, the forecast horizon, the segmentation dimensions, and the countries covered, alongside the underlying primary and qualitative methodology.
Historical Period
2020 to 2025
Forecast Period
2026 to 2036
Base Year
2025 (USD billions; MMA Primary Research Dataset, August 2026)
Market Definition
Consumer products formulated around the pumpkin spice flavour profile and sold within a defined seasonal window, spanning coffee and hot beverages, bakery and sweet goods, confectionery and snacks, dairy and frozen desserts, packaged ready-to-drink beverages, and home fragrance and scented products. Measured at retail and foodservice selling value across all channels. Plain pumpkin sold as produce, canned pumpkin puree sold as a cooking ingredient, and spice blends sold to manufacturers rather than to consumers are excluded from scope.
Quantitative Units
USD billions (current prices); million seasonal units; USD per unit by product category
Segmentation Dimensions
Consumer product category; end-use channel; commercial dimension; region
Regions Covered
North America, Western Europe, East Asia, South Asia and Pacific, Latin America, Middle East and Africa, Eastern Europe
Countries Covered
United States, Canada, Mexico, United Kingdom, Ireland, Germany, Netherlands, France, Sweden, South Korea, Japan, China, Australia, New Zealand, Singapore, Brazil, United Arab Emirates, Saudi Arabia, Poland, Czech Republic
Key Companies Profiled
Starbucks, Nestle, The J.M. Smucker Company, Bath and Body Works, Keurig Dr Pepper, Inspire Brands, General Mills, Kellanova, Hershey, Mondelez International, Danone, Chobani, Trader Joe's, Newell Brands, Post Holdings, McCormick, International Flavors and Fragrances, Givaudan, Symrise, Conagra Brands
Quantitative Methodology
Primary survey, n=3,800 respondents, Q4 2025, six countries; demand-side model with trade association cross-validation
Qualitative Methodology
47 expert interviews, Q4 2025; applied to validate demand model assumptions, identify emerging dynamics, and assess competitive positioning
Report Format
PDF and XLSX data workbook (Word format preview document)
Publisher
Market Minds Advisory
Report Code
MMA-2026-AGR-181
Published
August 2026
Contact
sales@marketmindsadvisory.com | www.marketmindsadvisory.com

Purchase the full Pumpkin Spice Products Market Report (2026 to 2036).

The full report treats the eleven week window as the governing commercial fact rather than a scheduling detail, and models markdown exposure by format across three seasons of observed data. It sizes each of the six product categories independently through 2036, maps spice input exposure by origin and growing geography, and benchmarks co-manufacturing commitment horizons against realised writeoff. Regional chapters cover all seven regions, with particular attention to where the flavour travels and where it demonstrably does not. Competitive profiling covers 20 participants on a single seasonal selling value basis.
Six product categories sized independently through 2036
Markdown exposure modelled by format and shelf life
Spice input exposure mapped by growing origin
Commitment horizons benchmarked against three seasons of writeoff
Twenty participants profiled on one consistent basis
Adoption assessed across every market outside North America

Built For The People Who Decide

From boardroom strategy to bench-side execution, this report is read cover-to-cover by leaders shaping the next decade of their industry, turning demand scenarios, market dynamics and valuation benchmarks into decisions.
CXOs/ Presidents/ VPs/ Managers
M&A and Corporate Development
Strategy Teams and R&D Heads
Procurement and Product Directors
Regulatory and Compliance Leaders
Investor Relations and Equity Analysts