Market Minds Advisory
Protein Diagnostics Market

Protein Diagnostics Market: Mass Spectrometry Displacing Immunoassay Where Antibodies Cannot Tell Two Molecules Apart

An immunoassay reports whatever its antibody binds to, which is why two laboratories can measure the same patient sample and disagree by a third without either of them being wrong.

Lead Analyst

Alice Ballenger

Published

September 2026

Make Smarter Decisions with Customized Research Insights

Request a free sample report and evaluate market opportunities, growth trends, and competitive dynamics relevant to your business needs.

2025 MARKET VALUE$18.4BMarket Size 2025
2036 FORECAST VALUE$45.6BBase Case , 2026 to 2036
CAGR 2026 TO 20368.6 %Bull 9.9% / Bear 7.3%
INCREMENTAL OPPORTUNITY$25.6BNet 10- year value creation
EXPANSION MULTIPLE2.28x2036 value over 2026 base
Strategic Levers
M&A Pipeline
Regional Outlook
Country Rankings
Competitive Intelligence
Segmental Deep-dive
Call-Us : 91 93563 13602

Executive Snapshot and Market Trajectory

Immunoassay has measured clinical proteins for fifty years by using an antibody to find them, and the antibody cannot distinguish a target from anything similarly shaped. Two laboratories running different platforms on one sample routinely disagree by around 31%, which is a measurement problem nobody has solved.
Mass spectrometry protein assays compound at 12.9%, exactly 1.50 times the market, because they identify a molecule by its mass rather than by what binds to it. North America holds 30% of spend on reference laboratory concentration and reimbursement rather than on any epidemiological factor. Platform lock-in runs across seven year contracts. Mass spectrometry holds only 14% of volume, because operator skill and instrument cost restrict it to larger laboratories.
Five companies hold 64%. Positions rest on installed analyser bases and reagent lock-in rather than on assay performance, since a laboratory standardised on a platform buys its consumables for the life of the contract. Reagents account for around 78% of a platform's lifetime value, so winning the placement is the whole contest. Assay performance is one argument among several used to win it, and rarely the decisive one. Very little else matters commercially at all.
Market Definition
The market covers assays, reagents and instrument consumables used to measure proteins and peptides in clinical samples, spanning automated immunoassay systems, mass spectrometry protein assays, point-of-care protein testing, multiplex protein panels, electrophoresis and immunofixation methods, and protein biomarker discovery and validation services. Nucleic acid and molecular diagnostics, clinical chemistry analytes other than proteins, haematology analysers, research-only proteomics instrumentation, and anatomical pathology staining are excluded.
Base Year Value
$18.4B in 2025 (MMA Primary Research Dataset, August 2026)
Forecast Period
2026 to 2036, eleven discrete annual values
CAGR
8.6% base case. Bull 9.9%. Bear 7.3%.
Fastest Growth Segment
Mass Spectrometry Protein Assays: 12.9% CAGR
Fastest Growth Country
China: 11.8% CAGR
Fastest Growth Region
South Asia and Pacific: 10.7% CAGR
Largest Region
North America: 30% of 2025 global value
Market Leaders
Roche Diagnostics, Abbott, Siemens Healthineers, Danaher, Thermo Fisher Scientific. Source: MMA Analysis based on company annual reports.
Primary Survey
n=3,800 procurement and R&D decision-makers, Q4 2025, six countries
Methodology
Demand-side build-up, cross-validated against public data, 47 expert interviews

Protein Diagnostics Market Forecast Scenarios

protein-diagnostics-market-size-forecast-scenario-1787309205773
Growth of 6.2% across 2020 to 2025 hides two opposite movements. Routine protein testing collapsed during 2020 as outpatient visits stopped, then recovered strongly, while antibody and consumable supply disruption across 2021 and 2022 constrained what suppliers could actually ship. Chinese domestic analyser manufacture expanded considerably throughout the period and reset regional reagent pricing in ways that have not reversed since.
The base case of 7.2% rests on three mechanisms. Mass spectrometry is moving from specialist reference laboratories into larger hospital laboratories, which grows the fastest segment without displacing immunoassay volume yet. Multiplex panels are replacing sequential single-analyte testing in oncology, cardiology and autoimmune workups, raising revenue per specimen materially. And Asian and Indian test volume keeps expanding as insurance coverage widens, though at reagent pricing that sits well below Western levels.
The bull case of 8.4% assumes multiplex panel reimbursement improves so that panels are paid as panels rather than as the cheapest constituent test, which would convert clinical adoption into revenue far more reliably. The bear case of 6.0% reflects two pressures: laboratory consolidation concentrating reagent purchasing into fewer and harder negotiations, and Chinese analyser manufacturers extending that pricing model into Southeast Asia and Latin America.

Measuring What the Antibody Happens to Bind

Immunoassay works by using an antibody to capture a target protein and reporting how much was captured. The method is fast, cheap, automated and fundamentally indirect: the antibody reports whatever it binds to, including fragments, variants and molecules of similar shape. That is why two laboratories running different platforms on the same patient sample can disagree by around 31% while both report a valid result.
TOP FIVE CONCENTRATION64%Combined share held by the five largest diagnostics companies globally
INTER-PLATFORM DISAGREEMENT31% varianceDifference between platforms measuring the identical patient sample
REAGENT CONTRACT DURATION7 yearsTypical laboratory commitment period on an installed analyser platform
MASS SPECTROMETRY PENETRATION14% of volumeShare of clinical protein measurement performed by mass methods
REAGENT SHARE OF REVENUE78% of platformConsumable revenue as a proportion of total platform lifetime value
ASSAY STANDARDISATION COVERAGE22% of analytesProportion with internationally harmonised reference measurement procedures available
For most analytes that variance is tolerable because clinical decisions use wide thresholds. For steroid hormones, thyroglobulin, therapeutic proteins and several tumour markers it is not, and mass spectrometry identifies the molecule by mass rather than by binding, which resolves the ambiguity directly. That segment compounds at 12.9% and holds only 14% of volume, because the economics require laboratory scale most sites do not have.
Commercially, none of this is what determines revenue. Reagents represent around 78% of a platform's lifetime value and laboratories commit for roughly seven years when they install an analyser, so the consumable stream is locked well before any assay comparison matters. Winning a platform placement is the entire commercial game, and assay performance is one argument among several used to win it.
"Clinicians assume a protein result is a number. It is an antibody's opinion about a number, and when the patient moves hospital and the platform changes, the opinion changes with it."
Principal, In Vitro Diagnostics and Clinical Laboratory Practice · MMA In Vitro

Market Trends

Mass Spectrometry Resolves Antibody Cross-Reactivity Directly

Immunoassay reports whatever its antibody binds, which produces around 31% variance between platforms measuring one sample and matters clinically in steroid hormones, thyroglobulin and therapeutic protein monitoring. Mass spectrometry identifies molecules by mass and resolves that ambiguity rather than managing it. The segment compounds at 12.9% against a market at 8.6% and holds 14% of volume, because the instrument cost and operator skill required mean only larger laboratories can run it economically at all. Automated sample preparation and locked-down clinical kits have reduced the operator burden considerably without removing it altogether.
Market Impact: Reagents at 78% of platform value
Laboratory Consolidation Builds the Scale Mass Methods Need

Mass spectrometry economics require volume that most individual laboratories cannot generate, and consolidation into larger networks and reference facilities creates it. That consolidation is proceeding for entirely unrelated reasons of cost and staffing, and it happens to be the precondition for method change. Consolidated networks also standardise onto single platforms across many sites, which raises the value of each placement decision substantially and lengthens the reagent commitment behind it. Network standardisation across many sites also raises the value of every placement decision substantially and lengthens the reagent commitment behind it.
Market Impact: Contracts locking laboratories 7 ye

Market Opportunities and Growth Drivers

Reagent Lock-In Makes Placement the Only Real Contest

Reagents account for around 78% of a platform's lifetime value and laboratories commit for roughly seven years on installation, so the consumable revenue is settled long before any assay comparison becomes relevant. That structure means a supplier competes intensely at placement and then holds the account almost passively. It also means an assay demonstrably better than the incumbent's frequently cannot be sold into a laboratory until the contract expires, whatever the clinical argument for it. Tracking contract expiry across target laboratories is therefore worth more than any assay comparison a supplier can produce.
Market Impact: Harmonisation covering 22% of analy

Chronic Disease Monitoring Expands Routine Test Volume

Protein measurement underpins monitoring across cardiac disease, renal function, inflammation, thyroid disorders and oncology follow-up, and volumes rise with ageing populations and with guidelines that specify more frequent monitoring intervals. That growth is mechanical rather than discretionary and it accrues to whichever platform a laboratory has installed. High-sensitivity cardiac troponin adoption demonstrated how quickly a single analyte change can move volume when guidelines specify a method characteristic. Guidelines specifying a method characteristic rather than an analyte can move volume unusually quickly, as troponin demonstrated across most developed markets within a few years.
Market Impact: Penetration limited to 14% volume

Market Restraints and Challenges

Only a Fifth of Analytes Have Harmonised Reference Procedures

Around 22% of clinical protein analytes have internationally harmonised reference measurement procedures, which means for the rest each platform is effectively its own standard. The root cause is that harmonisation requires reference materials and procedures that are expensive to establish and commercially unattractive to fund. Suppliers mitigate by participating in harmonisation programmes, by publishing method comparison data, and by supporting the reference material development that would eventually erode their own differentiation. Laboratory medicine leadership values that participation disproportionately, which makes it commercially worthwhile despite the erosion. Reference materials are expensive to establish.
Market Impact: Variance reaching 31% between platf

Mass Spectrometry Requires Skill Laboratories Cannot Recruit

Clinical mass spectrometry demands method development, maintenance and troubleshooting capability that automated immunoassay does not, and that skill set is scarce in clinical laboratories everywhere. The root cause is that the technique was developed in research settings and its clinical translation still carries that operator burden. Suppliers mitigate with increasingly automated sample preparation, locked-down clinical assay kits and remote support, and none of it fully removes the need for a competent operator. Adoption therefore tracks laboratory consolidation rather than clinical need. A competent operator remains necessary throughout. The technique carries a research heritage.
Market Impact: Mass methods holding 14% of volume
3 additional market trends, 4 additional growth drivers, and 2 additional restraints and challenges are covered in the full report. Contact sales@marketmindsadvisory.com to access the complete intelligence.

Segment CAGR and Growth Architecture

Segmentation follows measurement method, because each identifies a protein by a different physical property and therefore carries different specificity, throughput and skill requirements. A laboratory choosing between immunoassay and mass spectrometry is choosing between speed and certainty about what it has measured. Six methods sit in the hierarchy, separated by the physical property each uses to identify a protein.
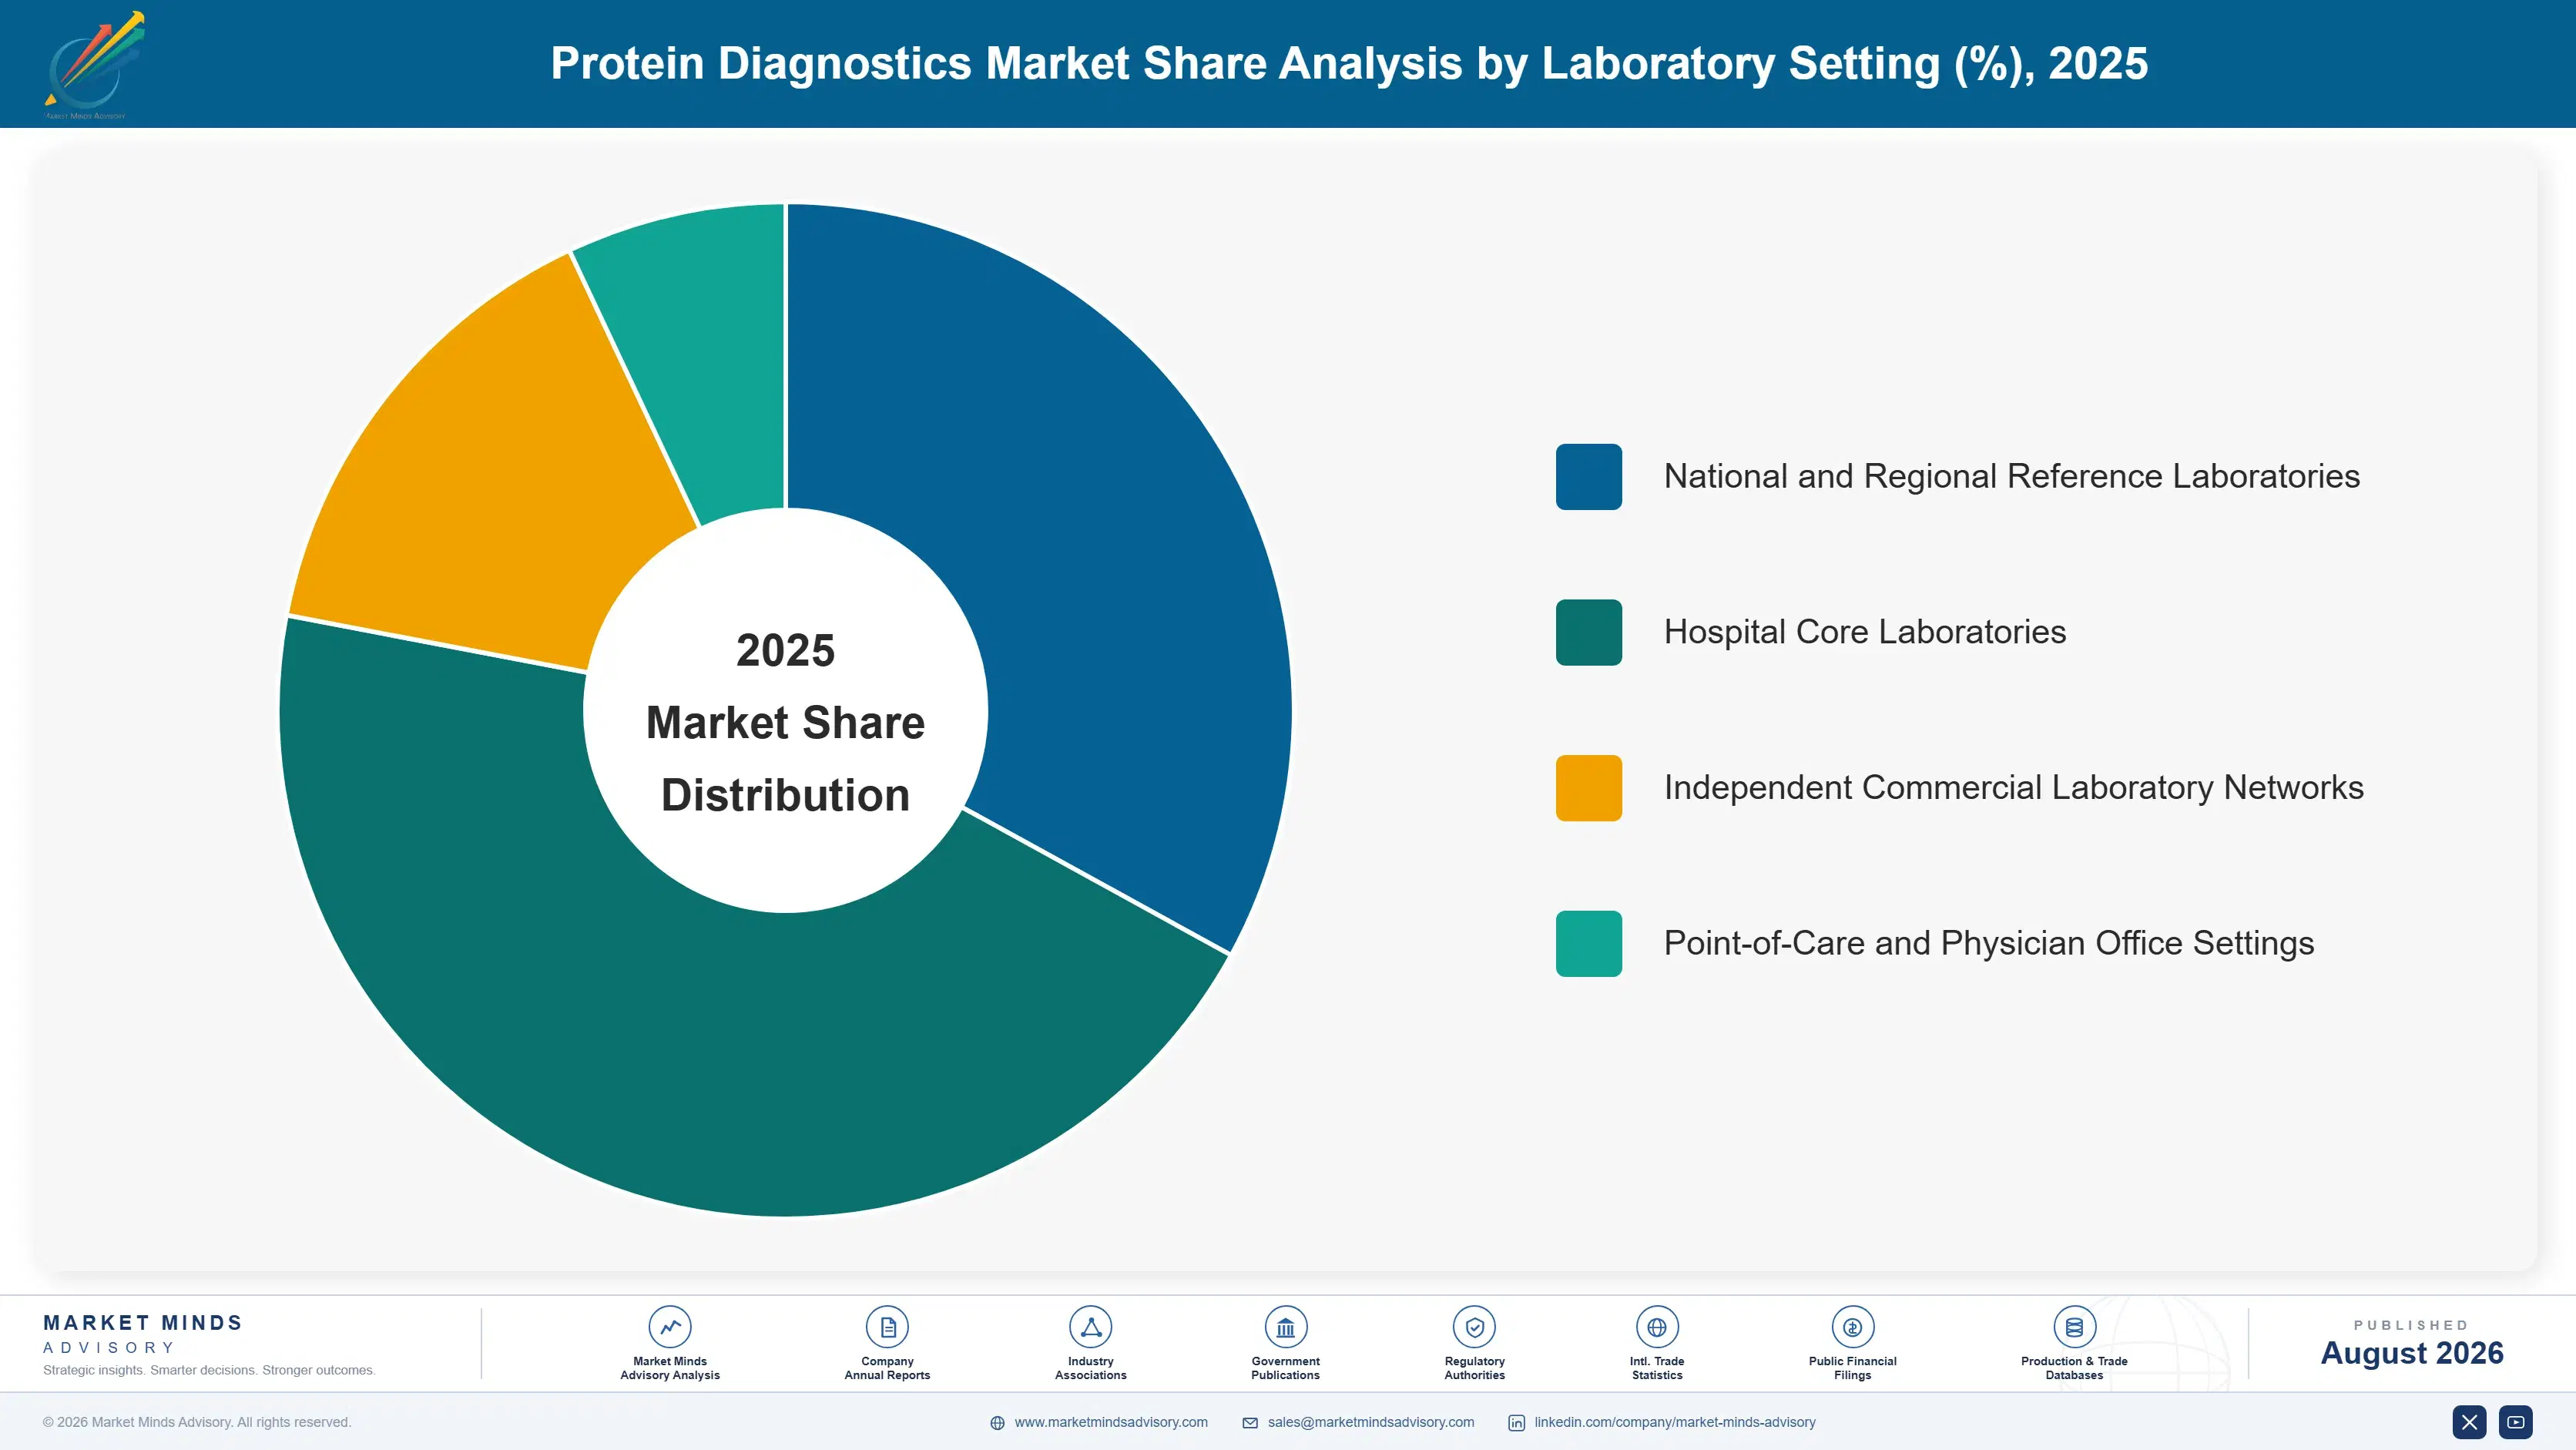
protein-diagnostics-market-market-share-analysis-1787309206311

Mass Spectrometry Protein Assays

Mass spectrometry compounds at 12.9%, exactly 1.50 times the market, because it answers a question immunoassay cannot. Identifying a molecule by its mass rather than by what an antibody binds to eliminates cross-reactivity, which matters clinically in steroid hormone measurement, thyroglobulin monitoring after thyroid cancer, therapeutic protein levels and several tumour markers where variance between platforms reaches around 31%. Penetration sits at 14% of clinical protein volume and the constraint is entirely operational: instrument cost, method development burden and a scarce operator skill set that clinical laboratories cannot readily recruit. Increasingly automated sample preparation and locked-down clinical kits have reduced that burden without eliminating it, which is why adoption tracks laboratory consolidation rather than clinical need.
CAGR 12.9%

Multiplex Protein Panels

Multiplex panels grow at 11.2% by measuring many proteins from one small sample, which suits inflammation profiling, autoimmune serology and emerging multi-analyte risk scores. The clinical difficulty is interpretation rather than measurement: a panel returning forty results produces findings nobody ordered and clinicians must then act on or explain away, which generates downstream investigation of uncertain value. Reimbursement bodies scrutinise panels harder than single analytes for exactly that reason. Where a panel replaces several separately ordered tests the economic case is clean, and where it adds analytes nobody would have requested individually it is considerably harder to defend to any payer. Payers now require justification for analytes nobody would have ordered individually.
CAGR 11.2%
Full segment breakdown across 6 segments available in the complete report.

Regional Architecture and Country Demand Map

Demand follows laboratory infrastructure and reimbursement rather than disease burden, since protein testing volume depends on whether a system funds monitoring intervals and whether laboratories have the platforms to run them. North America leads on test pricing and reference laboratory concentration rather than on any epidemiological factor.

North America

North America holds 30% of spend, the largest regional share, growing at 8.3%. The reason is reimbursement and laboratory structure rather than epidemiology: test pricing is the highest globally and large reference laboratory networks concentrate volume at a scale that supports mass spectrometry economics comfortably. Those networks also standardise platforms across many sites, which makes each placement decision worth several individual laboratories. Reimbursement pressure on test pricing is nonetheless the most active constraint anywhere, and multiplex panels face the hardest payer scrutiny of any region. Multiplex panels face the hardest payer scrutiny of any region, which slows adoption of a format the laboratories themselves would otherwise expand. Test pricing is the highest globally.
Share: 30% | CAGR: 8.3% (2026 to 2036)

Western Europe

Twenty-five percent of spend sits in Western Europe, growing at 7.1%. Laboratory consolidation has advanced substantially, particularly across the Netherlands, the Nordic countries and the United Kingdom, which creates the volume mass spectrometry requires. European laboratory medicine has also led harmonisation and reference procedure development, which is why the region takes assay standardisation more seriously than commercial suppliers generally prefer. Tendered procurement compresses reagent pricing considerably, and seven year platform commitments are contracted through formal processes rather than negotiated informally. Tendered procurement compresses reagent pricing considerably, and seven year platform commitments are contracted formally rather than negotiated informally. European laboratory medicine has led harmonisation and reference procedure development throughout. Consolidation creates the necessary volume.
Share: 25% | CAGR: 7.1% (2026 to 2036)
Regional intelligence for 5 additional markets available in the complete report: East Asia, South Asia and Pacific, Latin America, Middle East and Africa, Eastern Europe. Contact sales@marketmindsadvisory.com.
protein-diagnostics-market-country-cagr-analysis-1787309206819

Winning the Platform Not the Assay

Reagents are most of a platform's value and laboratories commit for seven years, so the assay comparison happens long after the commercial decision. Four positions matter, and only one of them concerns whether an assay actually measures the right molecule. The other three concern timing, network access and whether to help standardise a market that currently rewards not standardising.

Time Approaches to Reagent Contract Expiry

Reagents represent around 78% of platform lifetime value and laboratories commit for roughly seven years, which means a demonstrably better assay cannot be sold into a laboratory mid-contract whatever the clinical argument. Suppliers who track contract expiry across their target laboratories and approach eighteen months ahead reach the decision while it is genuinely open. Everyone else presents a comparison to a laboratory that cannot act on it for years. Everyone else presents a comparison nobody can act on for years. Contract expiry tracking is worth more than any comparison. Eighteen months ahead is the right window.
Market Impact: Contracts locking laboratories for

Target Consolidated Networks Rather Than Individual Laboratories

Laboratory consolidation standardises platforms across many sites, so a single placement decision now carries volume that several individual laboratories once represented. It also creates the throughput mass spectrometry economics require, which is why penetration sits at 14% and rises with consolidation rather than with clinical demand. Suppliers who reach network-level rather than site-level decision makers compete for the whole estate, and those calling on individual laboratories increasingly find the decision has already been made elsewhere. Site-level callers increasingly find the decision already taken elsewhere. Penetration rises with structure rather than with clinical demand.
Market Impact: Mass methods reaching only 14% of t

Attack Analytes Where Antibody Variance Is Clinically Real

Around 31% variance between platforms is tolerable for analytes with wide clinical thresholds and unacceptable for steroid hormones, thyroglobulin monitoring and therapeutic protein levels. Suppliers who identify exactly which analytes a target laboratory reports where that variance changes patient management have a clinical argument rather than a specification claim. That is the only route by which assay performance overcomes reagent lock-in, and it works precisely because a clinician rather than a purchaser makes the case internally. A clinician rather than a purchaser then makes the case internally. It is the only route past reagent lock-in that works.
Market Impact: Variance reaching a full 31% betwee

Support Harmonisation Even Though It Erodes Differentiation

Only around 22% of clinical protein analytes have internationally harmonised reference measurement procedures, and expanding that erodes the method differentiation suppliers currently rely on. Participating anyway builds credibility with laboratory medicine leadership, who value it disproportionately and who influence platform decisions considerably. The alternative is to be the supplier whose assay disagrees with everybody else's and who declined to help resolve why, which is a poor position when a network reviews its estate. Being the supplier whose results disagree with everybody, and who declined to help establish why, is a poor position at estate review.
Market Impact: Harmonisation covering only 22% of

Who Controls the Margin Pool

Five companies hold 64% measured on protein diagnostics assay and consumable revenue, the basis applied throughout this section. Concentration is high because installed analyser bases and seven year reagent contracts both entrench position, and the capital required to build a competing automated platform is substantial. Roche Diagnostics and Abbott lead on immunoassay installed base rather than on any method advantage.
Competition operates on three dimensions. Installed base and contract timing decide when a laboratory can be approached at all. Mass spectrometry capability decides participation in the analytes where antibody variance is clinically consequential. And network-level relationships decide access to the consolidated laboratory estates that now make most platform decisions. Assay performance decides remarkably little of it.

Two pressures are moving position. Laboratory consolidation concentrates decisions into fewer, larger negotiations, which favours suppliers with network relationships over those with site coverage. Meanwhile mass spectrometry keeps taking the analytes where specificity matters. Rankings will shift toward companies holding both automated immunoassay scale and genuine clinical mass spectrometry depth. Suppliers holding only immunoassay are defending precisely the analytes where their method measures least reliably, and menu breadth is no answer to a specificity argument a clinician is making.
protein-diagnostics-market-company-positioning-matrix-1787309207341

Competitive Moat and Risk Dimensions

ROCHE DIAGNOSTICS

Moat: Installed base and menu breadth

Roche Diagnostics holds the largest installed automated immunoassay base with the broadest assay menu, which means a laboratory standardising on the platform can run almost everything it needs from one supplier. Reagents represent around 78% of lifetime value across seven year commitments, so that installed position converts into locked consumable revenue that no competitor can address mid-contract.
ROCHE DIAGNOSTICS

Risk: Clinical mass spectrometry depth

Mass spectrometry compounds at 12.9% and takes precisely the analytes where antibody cross-reactivity is clinically consequential, which are also among the more valuable tests. A company whose position rests on immunoassay menu breadth is defending the analytes where the method is weakest, and menu breadth is no answer to a specificity argument a clinician makes.
THERMO FISHER SCIENTIFIC

Moat: Mass spectrometry platform depth

Thermo Fisher holds the deepest clinical mass spectrometry position with instrument, method and consumable capability developed across both research and clinical use. As laboratory consolidation creates the throughput these methods require, that accumulated capability addresses the analytes immunoassay measures least reliably, and the operator support burden is where its experience genuinely counts.
THERMO FISHER SCIENTIFIC

Risk: Automated immunoassay installed base

Routine protein testing volume runs on automated immunoassay and will continue to, and a supplier without a comparable installed base participates in the smaller and more specialised part of the market. Laboratories standardise platforms for operational reasons, and mass spectrometry frequently sits alongside an immunoassay analyser somebody else placed and controls.

Players Tracked

Prominent Players

Roche Diagnostics
Abbott
Siemens Healthineers
Danaher
Thermo Fisher Scientific

Other Key Players

bioMerieux
Becton Dickinson
Bio-Rad Laboratories
Ortho Clinical Diagnostics
DiaSorin
Sysmex
Fujirebio
Waters Corporation
Shimadzu Corporation
SCIEX
Mindray Medical
Autobio Diagnostics
Snibe Diagnostics
Randox Laboratories
Quidel Ortho

Recent Developments

FEBRUARY 2025

Harmonisation programmes extend reference procedures to further analytes

International laboratory medicine bodies extended harmonised reference measurement procedures to additional clinical protein analytes, reducing the inter-platform variance that has made results non-comparable between laboratories. These were standardisation decisions rather than commercial developments among diagnostics suppliers. Suppliers had quietly benefited from the absence of harmonisation for decades.
Signal: Harmonisation removes precisely the method
JUNE 2025

Laboratory network consolidation concentrates platform decisions further

Continued consolidation of clinical laboratories into larger regional networks moved platform selection from individual sites to network procurement, raising the volume attached to each decision considerably. This reflects laboratory sector structure rather than any transaction among diagnostics suppliers. Network procurement now decides for many sites at once.
Signal: Fewer and considerably larger placement de
OCTOBER 2025

Multiplex panel reimbursement scrutiny tightens across payers

Payers increased scrutiny of multiplex protein panels, requiring justification for analytes that would not have been ordered individually and for the downstream investigation those results generate. These were reimbursement policy decisions rather than developments among the suppliers affected. Justification is now required for each analyte in a panel.
Signal: A panel returning results nobody ordered c

Antibodies, Instruments and Calibration

Antibody production, recombinant protein calibrators and reagent formulation account for roughly 34% of cost of goods across immunoassay, with antibody supply the most specialised element and the hardest to second-source. Mass spectrometry consumables carry lower material cost and higher instrument depreciation. Calibrator and control material production is a small cost line and a disproportionate source of technical difficulty across both methods.
Antibody and recombinant protein input costs rose through 2021 and 2023 as biological reagent demand competed across diagnostics and therapeutics manufacturing. Company annual reports across the diagnostics companies disclose the resulting reagent margin pressure against tendered laboratory contracts that could not be reopened. World Health Organization reporting on diagnostic supply chains documents the concentration of critical antibody and calibrator production. Antibody supply is the hardest element to second-source.

Exposure divides by method and by contract structure. Immunoassay suppliers carry antibody supply exposure against seven year reagent commitments with limited adjustment mechanisms. Mass spectrometry suppliers carry instrument capital and service cost against consumable revenue that scales with volume. Suppliers holding both absorb input movement across a wider base, which is one of the few genuine advantages of running two methods.
protein-diagnostics-market-cost-volatility-analysis-1787309207536

Build adjustment clauses into seven year reagent commitments

A seven year reagent contract written without any adjustment mechanism transfers a full input cycle onto the supplier, and antibody and recombinant protein costs have moved substantially inside such periods. Negotiating a defined reset referenced to published biological reagent indices at contract signature is far easier than reopening a laboratory agreement afterwards. Reopening afterwards is close to impossible.

Qualify secondary antibody sources during assay development

Antibody substitution changes assay performance and requires revalidation, so a single-source position becomes a supply failure rather than a cost increase. Qualifying a second antibody source during initial assay development, while validation work is already underway, preserves the option to switch without a revalidation exercise no laboratory contract can accommodate. No laboratory contract accommodates revalidation.

Recover mass spectrometry service cost through consumable pricing

Clinical mass spectrometry carries method support, troubleshooting and service obligations that automated immunoassay does not, and suppliers frequently absorb them to win placements. Pricing that support into consumable rates rather than treating it as a sales cost keeps the method economics honest and makes visible what the operator burden genuinely costs to carry. Absorbing it hides the true method economics.

Portfolio Architecture for Margin Defence

The portfolio separates on measurement method and on where the test is performed. Automated immunoassay carries the overwhelming majority of volume on speed and cost. Mass spectrometry carries specificity where it matters clinically. Point-of-care testing trades performance for location. Multiplex panels trade interpretability for breadth, and electrophoresis methods persist in specific applications nothing has displaced. Biomarker validation services sit alongside as project work rather than as
The tension is between volume economics and specificity value. Immunoassay generates the revenue and is measuring indirectly, with around 31% variance between platforms that nobody can fully resolve. Mass spectrometry answers the question properly and requires scale and skill most laboratories lack. A supplier weighted entirely toward immunoassay is defending the analytes where its method is weakest.

High-value pools concentrate where specificity changes management. Mass spectrometry for steroid hormones and therapeutic proteins, thyroglobulin monitoring after cancer treatment, and any placement into a consolidated network estate all qualify, and none of them is won on cost per test. What they share is a clinical argument a clinician will make internally, which is the only mechanism that overcomes a seven year reagent commitment.

Volume / Commodity-Adjacent Tier

Routine automated immunoassay for high-volume analytes with wide clinical thresholds, contracted on reagent price through tenders. Domestic manufacturers in Asia compete hard here, and platform performance differences rarely influence the purchasing outcome.
Gross Margin: 44-56%

Premium / Certified Tier

Specialist immunoassay, electrophoresis and immunofixation methods plus point-of-care protein testing where location rather than precision is the requirement. Menu breadth and workflow integration qualify the supplier ahead of any analytical claim.
Gross Margin: 52-64%

Sustainability / Regulatory / Next-Generation Tier

Mass spectrometry protein assays and multiplex panels addressing specificity and breadth respectively. The wide margin range separates established clinical mass spectrometry positions from panels facing hardening reimbursement scrutiny across payers.
Gross Margin: 48-74%
protein-diagnostics-market-portfolio-architecture-1787309208032

High-value Sub-segments and Strategic Watch-out

Mass Spectrometry Protein Assays

Compounding at 12.9% by identifying molecules by mass rather than by antibody binding, which resolves the 31% inter-platform variance directly. Operator skill and instrument cost keep penetration at 14% regardless of the clinical argument for it. Adoption here tracks laboratory consolidation rather than any clinical demand.
Gross Margin: 56-74%

Multiplex Protein Panels

Growing at 11.2% by measuring many analytes from one sample, and facing payer scrutiny over results nobody ordered and the downstream investigation they generate. Interpretation rather than measurement is the genuine difficulty here. Replacing several separately ordered tests remains the only clean economic case here.
Gross Margin: 50-68%

Automated Immunoassay Systems

The volume core at 6.9%, carrying most testing on speed and cost while measuring indirectly through whatever the antibody binds. Seven year reagent contracts make the revenue durable and the method problem largely irrelevant commercially. Domestic Asian manufacturers compete very hard on reagent price here.
Gross Margin: 44-58%

Point-of-Care Protein Testing

The strategic watch-out. Moving measurement to the patient has obvious appeal and consistently sacrifices analytical performance, which matters more for proteins with narrow clinical thresholds than the format's advocates concede. Narrow clinical thresholds are precisely where that sacrifice matters most, which the format's advocates tend to concede reluctantly.
Gross Margin: 42-64%

Reagents Daily, Decisions Rarely

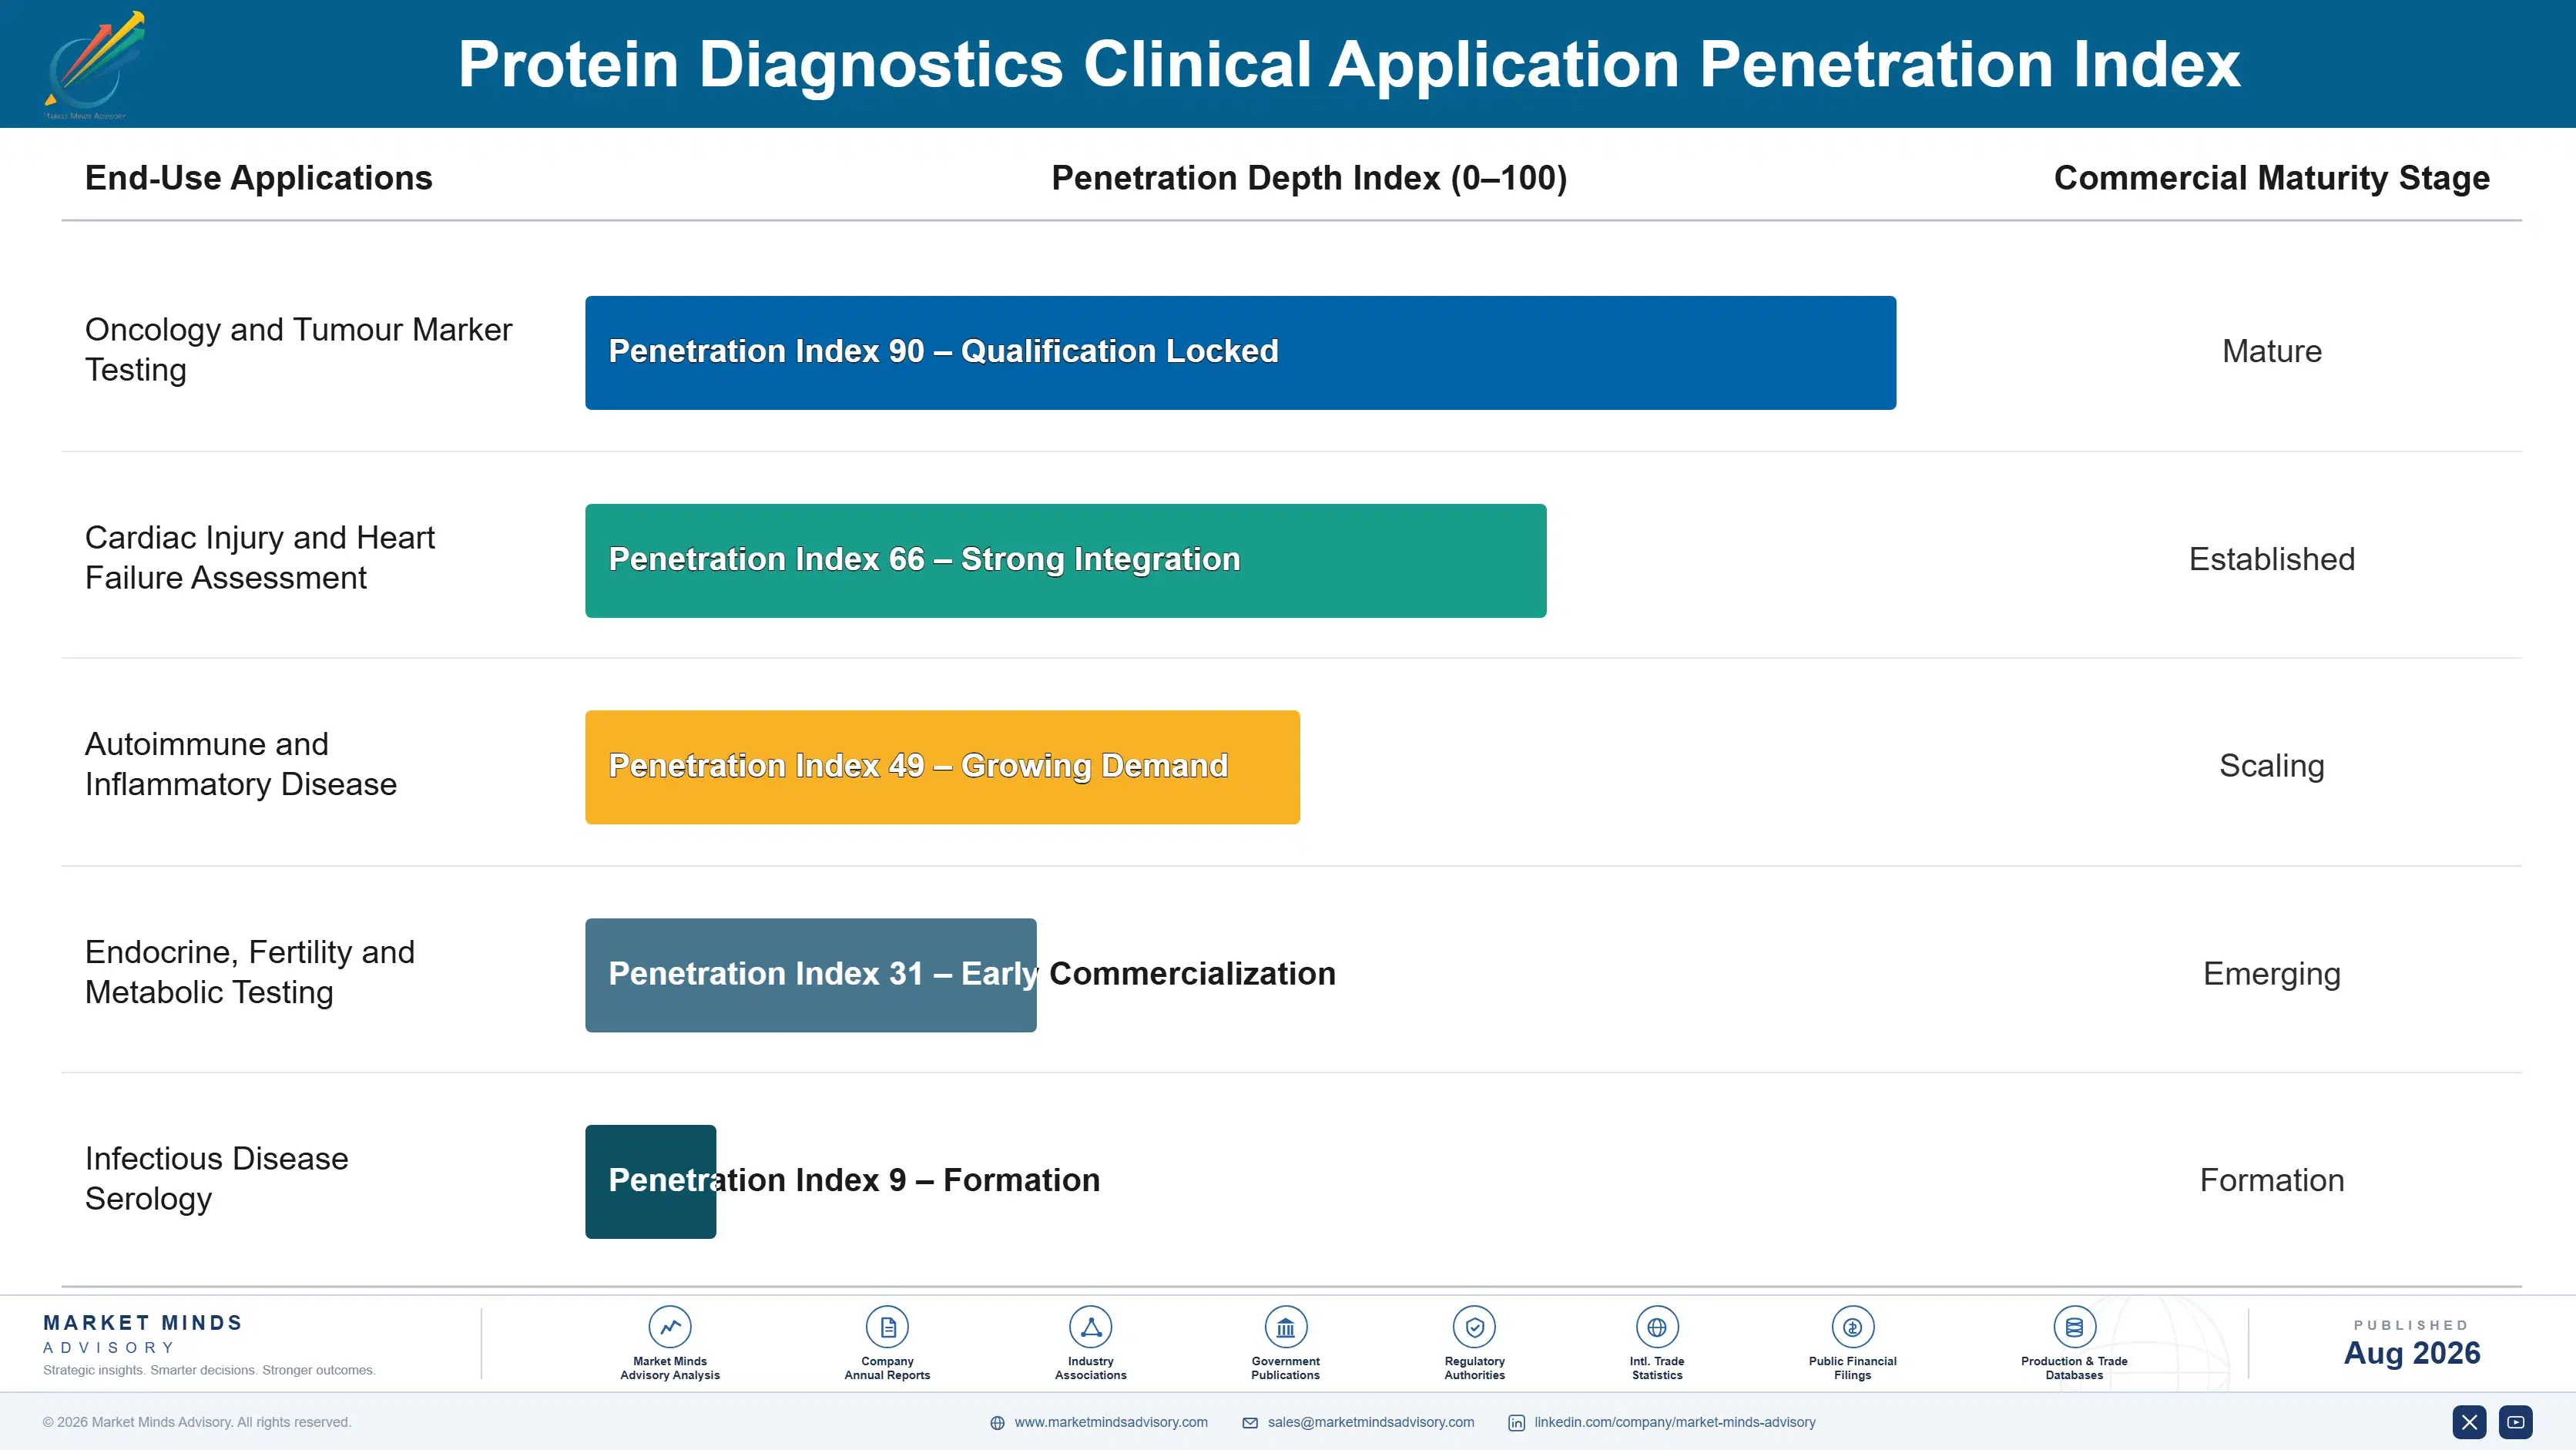
Revenue is consumable annuity revenue with an unusually long commitment behind it. Reagents represent around 78% of platform lifetime value and flow continuously against testing volume, while the decision determining who supplies them is made roughly every seven years. That produces exceptionally predictable revenue and exceptionally infrequent opportunity, which is why placement contests are fought so hard and why losing one costs most of a decade. Losing a placement costs most of a decade.
Depth varies by laboratory scale and menu breadth. Consolidated reference networks buy the widest menu across multiple methods including mass spectrometry. Large hospital laboratories buy comprehensive automated immunoassay. District laboratories buy core analytes only. Point-of-care settings buy single analytes at high cost per test, and specialist endocrine and oncology laboratories buy mass spectrometry disproportionately relative to their size.

The deciding party has moved upward with consolidation. Platform selection once sat with a hospital laboratory director and now sits with network procurement and scientific leadership together, deciding for many sites at once. Clinical users influence which analytes matter and rarely control the contract. A supplier calling on individual laboratories increasingly discovers the decision was taken elsewhere.
protein-diagnostics-market-end-use-penetration-index-1787309208521

Where Diagnostics Suppliers Win

These are among the four positions where our research anticipates prominent divergence between winners and laggards over the coming forecast period. Each is grounded in the demand model, the regulatory perimeter, and the announced capacity pipeline.
01 / CONTRACT EXPIRY TIMING

A better assay cannot be bought mid-contract at all

Reagents represent around 78% of platform lifetime value and laboratories commit for roughly seven years at installation, so a demonstrably superior assay simply cannot be purchased mid-term whatever the clinical case for it. Suppliers who track contract expiry across target laboratories and approach eighteen months ahead reach the decision while it remains genuinely open. Everyone else presents a comparison to a laboratory that cannot act on it for years, which is the most common wasted commercial effort in the whole sector.
02 / NETWORK LEVEL ACCESS

One decision now buys reagents for thirty sites

Laboratory consolidation has moved platform selection from individual sites to network procurement, so a single decision carries volume that several laboratories once represented separately. That consolidation also creates the throughput mass spectrometry economics require, which is why penetration sits at 14% and rises with structure rather than clinical demand. Suppliers who reach network leadership compete for a whole estate at once, while site-level callers find the decision already taken elsewhere, which makes network relationships worth more than broad geographic coverage.
03 / CLINICALLY CONSEQUENTIAL VARIANCE

Thirty-one percent matters for some analytes and not others

Inter-platform variance around 31% is tolerable where clinical thresholds are wide and unacceptable for steroid hormones, thyroglobulin monitoring and therapeutic protein levels. Suppliers who identify precisely which analytes a target laboratory reports where that variance changes patient management hold a clinical argument rather than a specification claim. It is the only route by which assay performance ever overcomes reagent lock-in, and a clinician rather than a purchaser makes that case internally, and that is a considerably stronger position than any purchasing conversation.
04 / HARMONISATION PARTICIPATION CHOICE

Helping standardise erodes your own differentiation usefully

Only around 22% of clinical protein analytes currently carry internationally harmonised reference measurement procedures, and expanding that coverage erodes exactly the method differentiation suppliers quietly depend upon. Participating regardless builds real credibility with laboratory medicine leadership, who tend to value it disproportionately and who influence platform decisions substantially. The alternative is ending up as the supplier whose results disagree with everybody else and who declined to help establish why that is, and networks reviewing their estates ask exactly that question now.

Engagement Snapshot From the Field

A live engagement with an industry participant carrying material or product regulatory and market exposure ahead of a defining policy shift, showing how our research translates into a defensible multi-year portfolio strategy.
MARKET MINDS ADVISORY · CLIENT ENGAGEMENT SUMMARY
Protein Diagnostics Producer Strategic Portfolio Review and Transition Roadmap 2026·Investment Scenario on Protein Diagnostics Exposure Evaluation 2025-26
CLIENT PROFILE
A consolidated pathology network operating 26 laboratories including two reference facilities, processing roughly 41 million protein tests annually, with about USD 620 million in revenue (client-reported, unverified by MMA). Immunoassay platforms had been selected site by site before consolidation and four different suppliers were installed across the estate. Variance between them had never been measured.
STRATEGIC CHALLENGE
Clinicians had raised repeated concerns about results changing when patients moved between network sites, and the network had responded by issuing guidance that results should not be compared across laboratories. Reagent costs were also above benchmark. Nobody had quantified the inter-platform variance or identified which analytes it clinically mattered for.
MMA APPROACH
MMA ran split-sample comparison across all four installed platforms for the twenty highest-volume protein analytes, then classified each by whether the measured variance exceeded the clinical decision threshold in current use. Reagent contract expiry dates were mapped across the whole estate. Testing volumes at each reference facility were assessed against the throughput mass spectrometry economically requires.
KEY FINDINGS
  1. Measured variance exceeded 30% on six of the twenty analytes, and on three of those the discrepancy was larger than the clinical decision threshold clinicians were applying.
  2. Thyroglobulin and cortisol showed the widest variance, and both were being used for monitoring where a change between sites would be interpreted as a change in the patient.
  3. Reagent contracts expired across a four year window rather than together, which meant estate-wide standardisation was impossible before the last contract ended.
  4. Neither of the two reference facilities ran mass spectrometry, despite processing volumes that would comfortably have supported it for the affected endocrine analytes.
CLIENT PROFILE
A consolidated pathology network operating 26 laboratories including two reference facilities, processing roughly 41 million protein tests annually, with about USD 620 million in revenue (client-reported, unverified by MMA). Immunoassay platforms had been selected site by site before consolidation and four different suppliers were installed across the estate. Variance between them had never been measured.
STRATEGIC CHALLENGE
Clinicians had raised repeated concerns about results changing when patients moved between network sites, and the network had responded by issuing guidance that results should not be compared across laboratories. Reagent costs were also above benchmark. Nobody had quantified the inter-platform variance or identified which analytes it clinically mattered for.
MMA APPROACH
MMA ran split-sample comparison across all four installed platforms for the twenty highest-volume protein analytes, then classified each by whether the measured variance exceeded the clinical decision threshold in current use. Reagent contract expiry dates were mapped across the whole estate. Testing volumes at each reference facility were assessed against the throughput mass spectrometry economically requires.
KEY FINDINGS
  1. Measured variance exceeded 30% on six of the twenty analytes, and on three of those the discrepancy was larger than the clinical decision threshold clinicians were applying.
  2. Thyroglobulin and cortisol showed the widest variance, and both were being used for monitoring where a change between sites would be interpreted as a change in the patient.
  3. Reagent contracts expired across a four year window rather than together, which meant estate-wide standardisation was impossible before the last contract ended.
  4. Neither of the two reference facilities ran mass spectrometry, despite processing volumes that would comfortably have supported it for the affected endocrine analytes.
RECOMMENDED STRATEGY
Phase 1: Phase 1 (months 1 to 5): Centralise the three clinically discrepant analytes to a single reference facility rather than running them across the estate. Phase 2: Phase 2 (months 5 to 15): Establish mass spectrometry at one reference facility for the affected endocrine analytes and validate against the immunoassay results. Phase 3: Phase 3 (months 15 to 30): Align remaining reagent contract expiries to allow a single estate-wide platform decision at the end of the window.
OUTCOME
Clinician concerns about cross-site comparability ceased within four months of centralising the three discrepant analytes (client-reported, unverified by MMA). Mass spectrometry was established at one reference facility and now runs the endocrine work network-wide at a lower cost per test (client-reported, unverified by MMA). Contract expiries are now managed as a single estate decision.

Frequently Asked Questions

Foundational context covering the market sizes, CAGR, scope, country, region and competition that inform every finding below. This section is provided to cover basics and most often pre-purchase conversations, answered from the MMA Primary Research Dataset.

What is the current size of the Protein Diagnostics Market?

The global market was worth USD 18.4 billion in 2025, reaching USD 19.98 billion in 2026. North America holds the largest regional share at 30% of spend.

How large will the Protein Diagnostics Market be by 2036?

MMA forecasts USD 45.59 billion by 2036, an expansion multiple of 2.28 times the 2026 base. That represents roughly USD 25.61 billion of incremental value.

What is the CAGR for the Protein Diagnostics Market 2026 to 2036?

The base case compounds at 8.6% annually, with a bull case of 9.9% and a bear case of 7.3%. Historical growth from 2020 to 2025 ran at 7.4%.

Which segment is growing fastest?

Mass spectrometry protein assays compound at 12.9%, exactly 1.50 times the market rate. Identifying molecules by mass rather than by antibody binding resolves cross-reactivity directly.

Who are the major companies in the Protein Diagnostics Market?

Roche Diagnostics, Abbott, Siemens Healthineers, Danaher and Thermo Fisher Scientific hold a combined 64% of the market. Installed analyser bases and reagent lock-in sustain those positions.

Which country is growing fastest?

China compounds at 11.8%, ahead of every other national market. Laboratory network consolidation and steadily rising testing volumes together drive most of that growth forward.

Report Segmentation Architecture

The full report scope spans multiple orthogonal segmentation dimensions, with cross-tabulated demand data provided for each dimension pair. Coverage extends further to regional breakdowns, trend trajectories, and the competitive detail needed to support segment-level decision-making.

By Measurement Method

  • Automated Immunoassay Systems
  • Mass Spectrometry Protein Assays
  • Point-of-Care Protein Testing
  • Multiplex Protein Panels
  • Electrophoresis and Immunofixation Methods
  • Protein Biomarker Discovery and Validation Services

By End-Use Industry

  • Hospital Clinical Laboratories
  • Consolidated Reference Laboratory Networks
  • Specialist Endocrine and Oncology Laboratories
  • Point-of-Care and Physician Office Settings
  • Pharmaceutical and Clinical Trial Laboratories

By Commercial Dimension

  • Reagent Rental and Platform Placement Contracts
  • Network Procurement and Tender Supply
  • Direct Instrument and Consumable Sales
  • Distributor Channel in Emerging Markets

By Region

  • North America
  • Western Europe
  • East Asia
  • South Asia and Pacific
  • Latin America
  • Middle East and Africa
  • Eastern Europe

Scope, Methodology, and Coverage

Every figure in this report is reproducible from documented input assumptions. The scope below maps the historical period, the forecast horizon, the segmentation dimensions, and the countries covered, alongside the underlying primary and qualitative methodology.
Historical Period
2020 to 2025
Forecast Period
2026 to 2036
Base Year
2025 (USD billions; MMA Primary Research Dataset, August 2026)
Market Definition
The market covers assays, reagents and instrument consumables used to measure proteins and peptides in clinical samples, spanning automated immunoassay systems, mass spectrometry protein assays, point-of-care protein testing, multiplex protein panels, electrophoresis and immunofixation methods, and protein biomarker discovery and validation services, together with the calibration and control materials supplied alongside them. Nucleic acid and molecular diagnostics, clinical chemistry analytes other than proteins, haematology and coagulation analysers, research-only proteomics instrumentation, anatomical pathology staining and immunohistochemistry, and laboratory information systems are excluded. Sizing is measured at supplier revenue in current prices.
Quantitative Units
USD billions (current prices); test volumes, installed analyser counts and inter-platform variance where applicable
Segmentation Dimensions
By Measurement Method; By End-Use Industry; By Commercial Dimension; By Region
Regions Covered
North America, Western Europe, East Asia, South Asia and Pacific, Latin America, Middle East and Africa, Eastern Europe
Countries Covered
USA, China, Germany, Japan, France, UK, Italy, Spain, Netherlands, Canada, South Korea, Taiwan, India, Australia, Brazil, Mexico, Argentina, Colombia, Turkey, Egypt, Saudi Arabia, UAE, South Africa, Poland, Czech Republic, Sweden, Denmark, Switzerland, Thailand, Indonesia, and additional markets relevant to this sector
Key Companies Profiled
Roche Diagnostics, Abbott, Siemens Healthineers, Danaher, Thermo Fisher Scientific, bioMerieux, Becton Dickinson, Bio-Rad Laboratories, Ortho Clinical Diagnostics, DiaSorin, Sysmex, Fujirebio, Waters Corporation, Shimadzu Corporation, SCIEX, Mindray Medical, Autobio Diagnostics, Snibe Diagnostics, Randox Laboratories, Quidel Ortho
Quantitative Methodology
Primary survey, n=3,800 respondents, Q4 2025, six countries; demand-side model with trade association cross-validation
Qualitative Methodology
47 expert interviews, Q4 2025; applied to validate demand model assumptions, identify emerging dynamics, and assess competitive positioning
Report Format
PDF and XLSX data workbook (Word format preview document)
Publisher
Market Minds Advisory
Report Code
MMA-2026-HLT-997
Published
August 2026
Contact
sales@marketmindsadvisory.com | www.marketmindsadvisory.com

Purchase the full Protein Diagnostics Market Report (2026 to 2036).

The full report sizes protein diagnostics across six measurement methods, three commercial dimensions and seven regions, with annual forecasts to 2036 under base, bull and bear scenarios. Inter-platform variance is measured by analyte against the clinical decision thresholds in use, which identifies exactly where method choice changes patient management. Reagent contract structures and expiry timing are analysed across laboratory networks. Harmonisation coverage is tracked by analyte and reference procedure. Antibody supply concentration is assessed across critical assay inputs, and twenty suppliers are profiled on a consistent protein diagnostics revenue basis.
Inter-platform variance measured by analyte against clinical thresholds
Reagent contract structures and expiry timing analysed across networks
Harmonisation coverage tracked by analyte and reference procedure
Laboratory consolidation mapped against mass spectrometry adoption
Multiplex panel reimbursement outcomes compared across payers
Antibody supply concentration assessed across critical assay inputs

Built For The People Who Decide

From boardroom strategy to bench-side execution, this report is read cover-to-cover by leaders shaping the next decade of their industry, turning demand scenarios, market dynamics and valuation benchmarks into decisions.
CXOs/ Presidents/ VPs/ Managers
M&A and Corporate Development
Strategy Teams and R&D Heads
Procurement and Product Directors
Regulatory and Compliance Leaders
Investor Relations and Equity Analysts