Market Minds Advisory
Protective Packaging Market

Protective Packaging Market: Paying Freight on Air, Every Parcel, Forever

Carriers bill on the space a parcel occupies rather than what it weighs, which means every cubic centimetre of void fill is a shipping charge repeated on every order a retailer ever sends.

Lead Analyst

Bilal Shaikh

Published

September 2026

Make Smarter Decisions with Customized Research Insights

Request a free sample report and evaluate market opportunities, growth trends, and competitive dynamics relevant to your business needs.

2025 MARKET VALUE$32.4BMarket Size 2025
2036 FORECAST VALUE$60.2BBase Case , 2026 to 2036
CAGR 2026 TO 20365.8 %Bull 7.0% / Bear 4.6%
INCREMENTAL OPPORTUNITY$26.0BNet 10- year value creation
EXPANSION MULTIPLE1.76x2036 value over 2026 base
Strategic Levers
M&A Pipeline
Regional Outlook
Country Rankings
Competitive Intelligence
Segmental Deep-dive
Call-Us : 91 93563 13602

Executive Snapshot and Market Trajectory

Parcel carriers charge on dimensional weight rather than actual weight for most shipments, which turns void space into a recurring freight cost rather than a one-off packaging decision. Average void inside a typical parcel runs near 34%, and the retailer pays to ship all of it.
That arithmetic reframed the category entirely. The question stopped being how to prevent damage and became how to prevent damage inside the smallest possible box, which is a considerably harder problem to solve. On-demand fit-to-size systems grow at 8.7%, half again the market rate of 5.8%, and deliver freight savings around 18% that recur on every parcel a shipper sends. Equipment cost keeps that saving out of reach for shippers below a daily parcel count.
Pulling the other way is packaging waste policy. Paper has taken 42% of void fill volume from plastic on kerbside recyclability grounds and generally protects less per gram than the systems it replaced, so a retailer reducing material knowingly accepts a higher damage rate. Parcel damage sits near 1.6% and every retailer tracks its own figure precisely. Competition stays regional at 21% top five share, since protective material ships mostly air.
Market Definition
Materials and systems protecting products in transit and storage, spanning paper void fill and cushioning, air pillows and inflatable systems, foam protection, bubble and wrap films, moulded fibre protection and on-demand fit-to-size systems, measured at converter and system supplier selling value. Excludes primary product packaging, corrugated shipping boxes sold as containers, pallets and unit load devices, and temperature-controlled packaging.
Base Year Value
$32.4B in 2025 (MMA Primary Research Dataset, August 2026)
Forecast Period
2026 to 2036, eleven discrete annual values
CAGR
5.8% base case. Bull 7.0%. Bear 4.6%.
Fastest Growth Segment
On-Demand Fit-to-Size Systems: 8.7% CAGR
Fastest Growth Country
India: 9.4% CAGR
Fastest Growth Region
South Asia and Pacific: 8.0% CAGR
Largest Region
North America: 30% of 2025 global value
Market Leaders
Sealed Air, Ranpak, Pregis, Storopack, Smurfit Westrock. Source: MMA Primary Research Dataset, July 2026.
Primary Survey
n=3,800 procurement and R&D decision-makers, Q4 2025, six countries
Methodology
Demand-side build-up, cross-validated against public data, 47 expert interviews

Protective Packaging Market Forecast Scenarios

protective-packaging-market-size-forecast-scenario-1787581024136
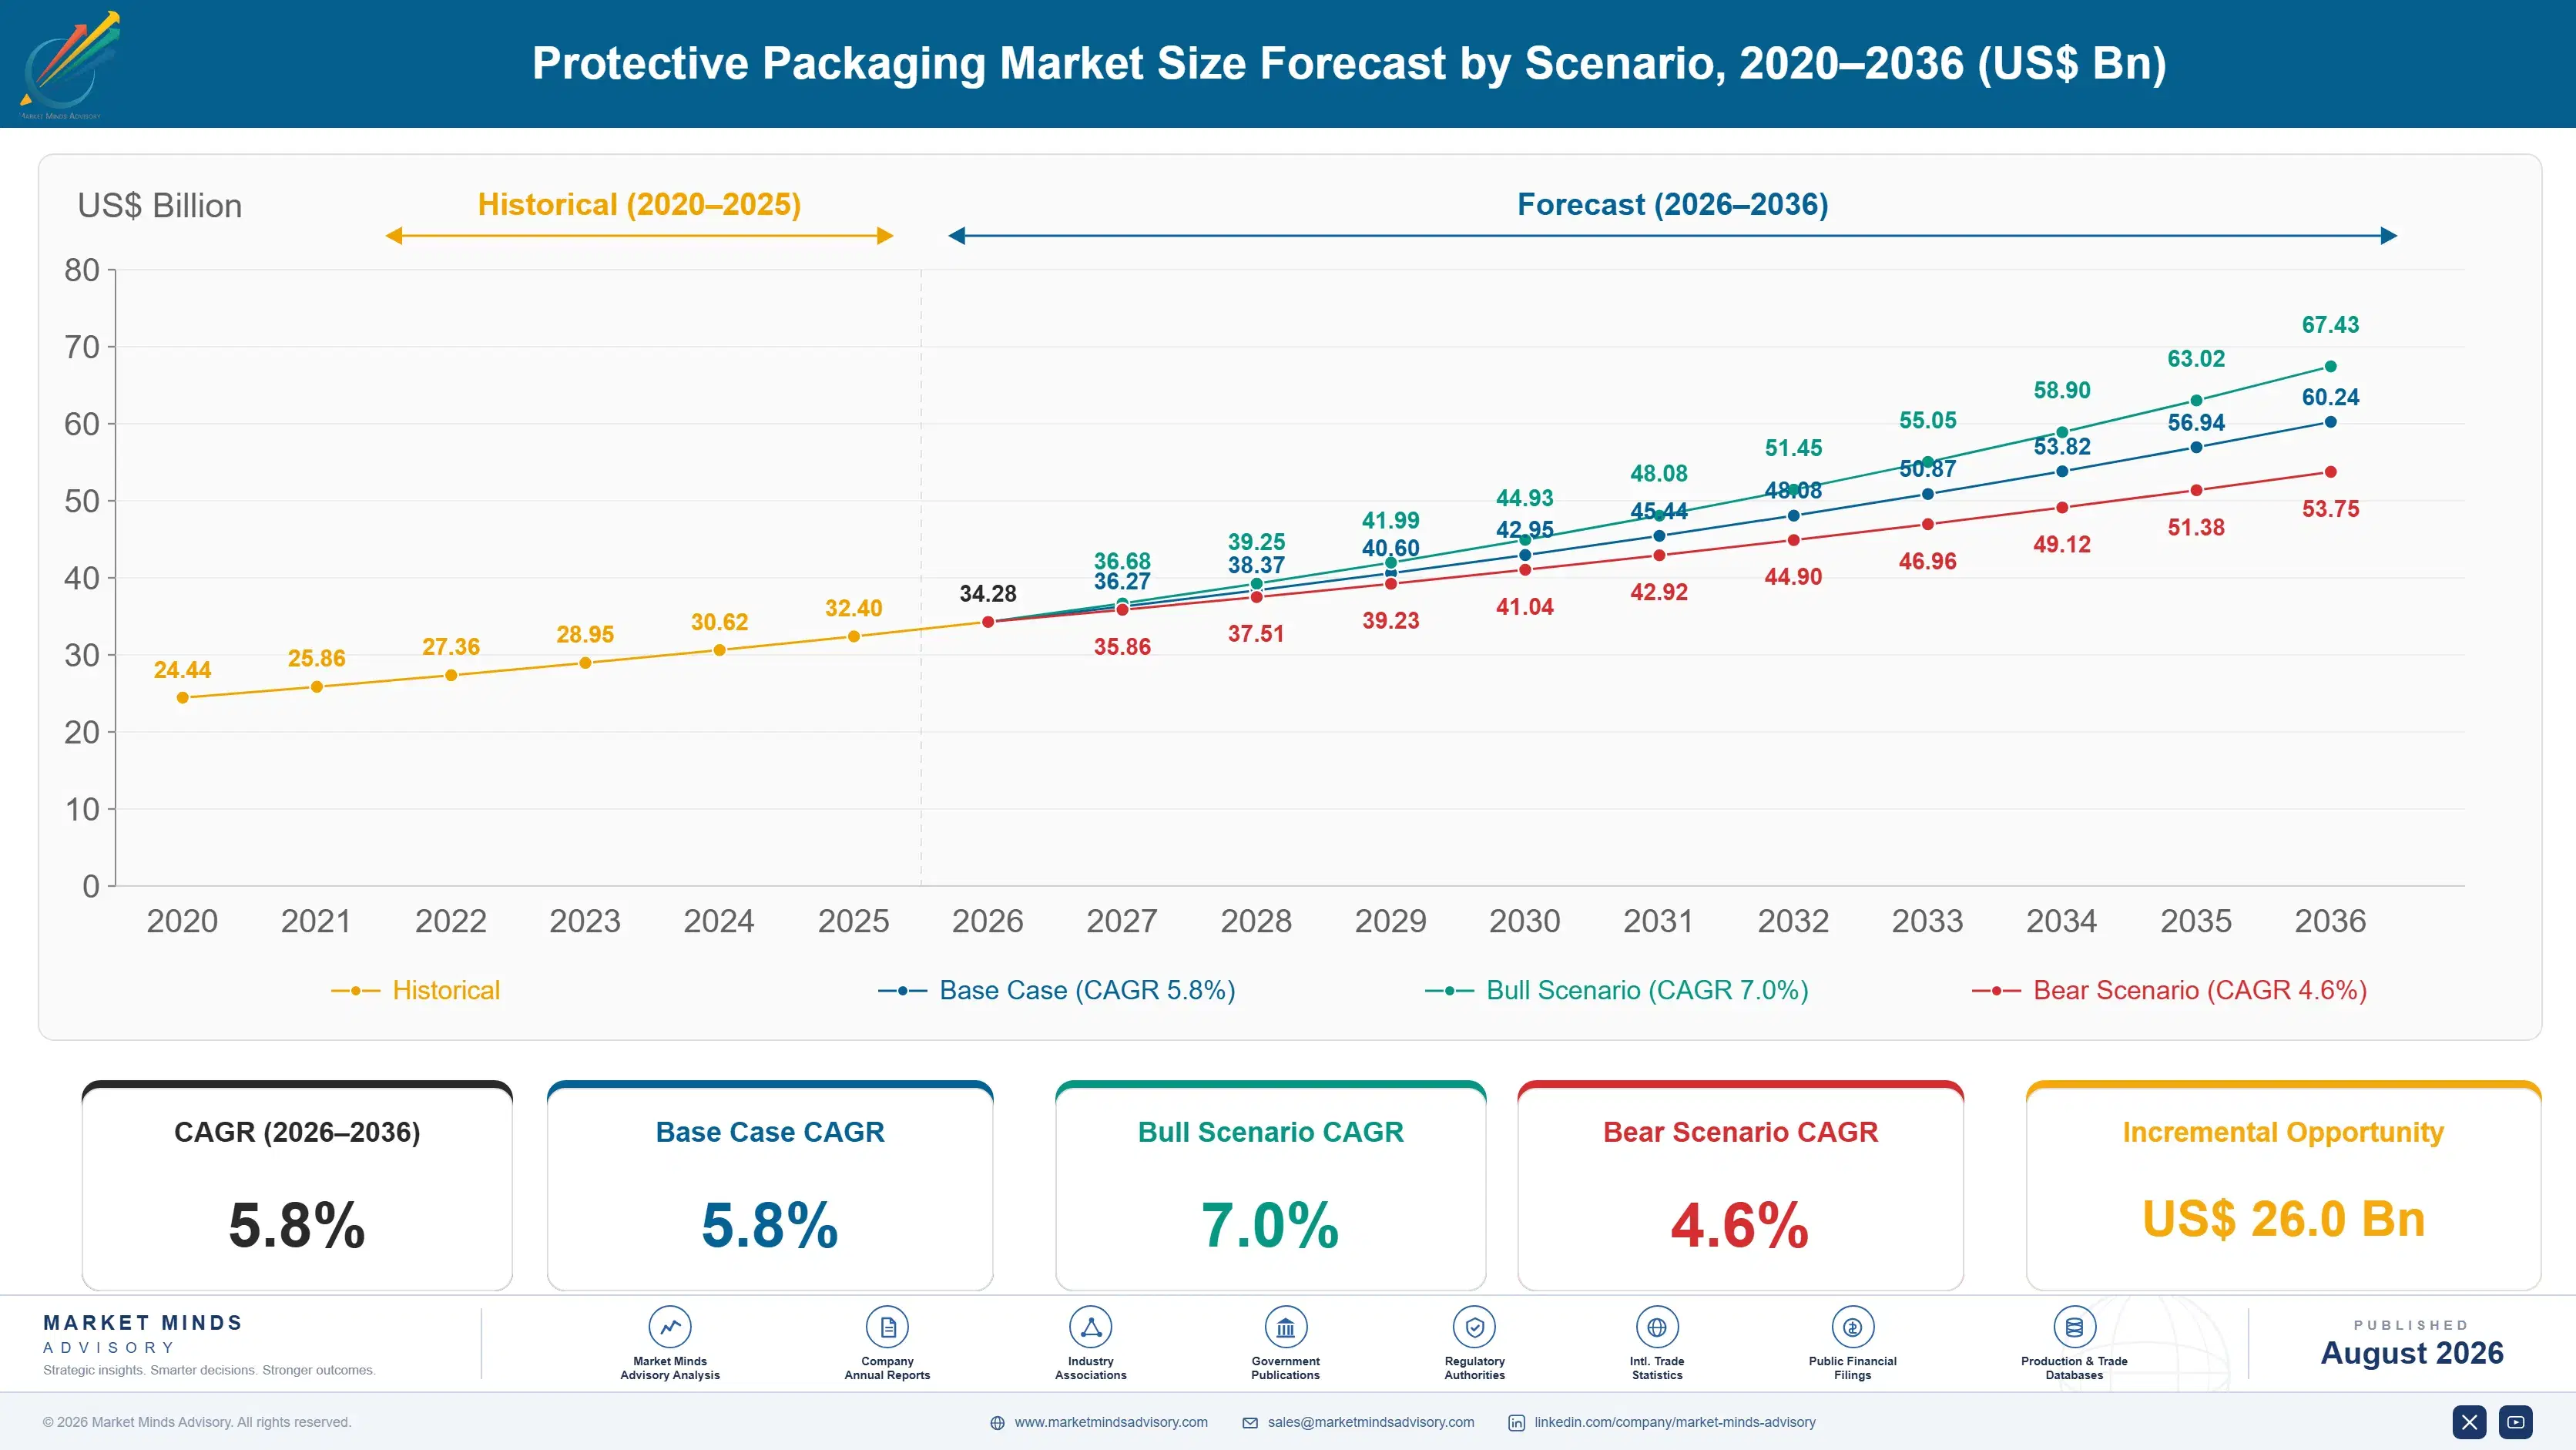
Growth ran near 4.7% between 2020 and 2025 as parcel volumes surged through the pandemic period and then normalised well above pre-pandemic levels without returning to the peak. Carrier dimensional weight pricing tightened across the same years, which made void space more expensive precisely as retailers were shipping more of it. Paper substitution accelerated on packaging waste pressure throughout, largely independent of any cost argument.
Base case 5.8% rests on three mechanisms. Dimensional weight pricing keeps making void space expensive, which drives on-demand fit-to-size adoption among retailers shipping enough parcels to justify the equipment behind it. Packaging waste rules continue pushing paper substitution regardless of protective performance per gram. And Indian and Southeast Asian e-commerce parcel volumes are growing faster than anywhere else, from a base with very little protective packaging sophistication behind it at all.
The bull case at 7.0% assumes right-sizing equipment costs fall enough to reach mid-sized shippers rather than only high-volume ones, which would broaden adoption considerably. The bear case at 4.6% is packaging waste rules forcing material reduction beyond what protection tolerates, raising damage rates and pushing retailers back toward heavier packing at lower value per parcel.

The Box Is the Freight Bill

Dimensional weight pricing changed what this industry is selling. When a carrier bills on the space a parcel occupies, a cushion of air inside an oversized box becomes a charge levied on every order forever, not a one-off packaging cost. Average void runs near 34% of parcel volume across surveyed shippers, and every cubic centimetre of it is shipped and paid for repeatedly.
TOP FIVE CONCENTRATION21%Converters compete regionally across a fragmented supplier field
VOID SPACE IN PARCELS34%Average empty volume shipped inside a typical parcel
PARCEL DAMAGE RATE1.6%Share of parcels arriving damaged across surveyed retailers
RIGHT-SIZING FREIGHT SAVING18%Reduction in shipping cost achieved by fitting the box
PAPER SUBSTITUTION PENETRATION42%Share of void fill volume now supplied in paper
REUSABLE LOOP RETURN RATE91%Containers returning through controlled closed loop delivery systems
So the commercial question moved. Preventing damage was always the brief and the brief is now preventing damage inside the smallest box the product allows, which is a considerably harder problem and a far more valuable one to solve. On-demand systems that cut and fold a box to the item deliver freight savings around 18%, which dwarfs any plausible saving on the packaging material itself.
Packaging waste policy pulls directly against protection. Paper void fill has taken 42% of the category on recyclability, and paper generally protects less per gram than the plastic systems it replaced. A retailer reducing material accepts a higher damage rate in exchange for a kerbside recyclable pack. Damage sits near 1.6% of parcels and every retailer tracks its own number to a decimal place.
"Show a logistics director a packaging price per thousand and they will negotiate. Show them what their void space costs in dimensional weight across a year of parcels and the conversation stops being about packaging at all, which is exactly where a supplier wants it."
Director, Transit Packaging and Logistics Materials Practice · MMA Packaging Practice · August 2026

Market Trends

Dimensional weight pricing driving on-demand right-sizing adoption

Carriers bill most parcels on occupied volume rather than actual weight, which makes void space a recurring freight charge repeated on every single shipment a retailer sends. On-demand systems that produce a box fitted to the item cut around 18% from shipping cost, a saving that recurs indefinitely and dwarfs anything achievable by negotiating packaging material price downward. Equipment cost limits adoption to shippers with sufficient parcel volume to justify it, which is why penetration concentrates among larger retailers and third party logistics operators, and why it is spreading downward toward mid-sized shippers only slowly.
Market Impact: Addresses 1.6% parcel damage rate
Paper substitution proceeding despite worse protection per gram

Paper void fill and cushioning has taken roughly 42% of category volume from plastic air pillows and bubble films, driven almost entirely by kerbside recyclability rather than by any protective performance advantage. Paper generally protects less per gram, which means matching the same protection requires either more material or a higher accepted damage rate. Retailers under packaging waste pressure have taken that trade knowingly rather than by accident. Paper suppliers are improving performance through honeycomb structures and engineered creping, and the gap has narrowed rather than closed. Plastic system suppliers face replacement of installed equipment rather than gradual erosion.
Market Impact: Delivers 9.4% Indian annual growth

Market Opportunities and Growth Drivers

Damage cost arithmetic supporting genuine packaging investment

A damaged parcel costs the replacement product, the return shipping, the reshipment and frequently the customer relationship as well, which makes the fully loaded cost several times the item's own value. Retailers track damage near 1.6% of parcels and know their own figure precisely, usually to a decimal place. That number justifies packaging investment that a materials price comparison never would, and suppliers presenting damage reduction test data rather than price per thousand consistently win specifications that competitors approaching the other way round never manage to reach at all. Very few suppliers arrive with that data at all.
Market Impact: Trades against 1.6% damage rate

Indian and Southeast Asian parcel volumes expanding rapidly

India grows fastest anywhere at 9.4%, as e-commerce parcel volumes expand from a base where protective packaging practice is comparatively unsophisticated and damage rates run well above developed market levels. Quick commerce is adding a second parcel stream with entirely different requirements, since a fifteen minute delivery tolerates far less packaging than a multi-day one does. Local converting serves almost all of that demand, since protective materials are bulky and low in value density, which makes imports uncompetitive across any meaningful distance. Damage arguments land well here, since the baseline rate makes any reduction visible immediately.
Market Impact: Limits reach below 18% savings

Market Restraints and Challenges

Material reduction targets conflicting with protection requirements

Packaging waste rules push retailers to reduce material while protection depends on having enough of it, and paper substitution has generally worsened protection per gram rather than improved it. The root cause is physical rather than any formulation failure, since fibre absorbs impact energy differently from trapped air. Commercially it forces a retailer to accept a higher damage rate or a heavier pack, and damage costs several times the item value once returns and reshipment are counted properly. Suppliers are engineering paper structures to close the performance gap, which has narrowed and not disappeared.
Market Impact: Cuts parcel freight cost 18%

Right-sizing equipment cost excluding mid-sized shippers

On-demand fit-to-size systems deliver freight savings near 18% and require capital equipment that only pays back above substantial daily parcel volumes. The root cause is that the machinery measures, cuts and folds to variable dimensions, which is mechanically complex and expensive to build reliably. Commercially it confines the fastest growing segment in the category to large retailers and third party logistics operators. Suppliers are developing smaller and leased configurations to reach mid-sized shippers, and the payback arithmetic remains difficult below a meaningful daily parcel count. Third party logistics operators absorb part of that gap by placing equipment themselves.
Market Impact: Covers 42% of void volume
3 additional market trends, 4 additional growth drivers, and 2 additional restraints and challenges are covered in the full report. Contact sales@marketmindsadvisory.com to access the complete intelligence.

Segment CAGR and Growth Architecture

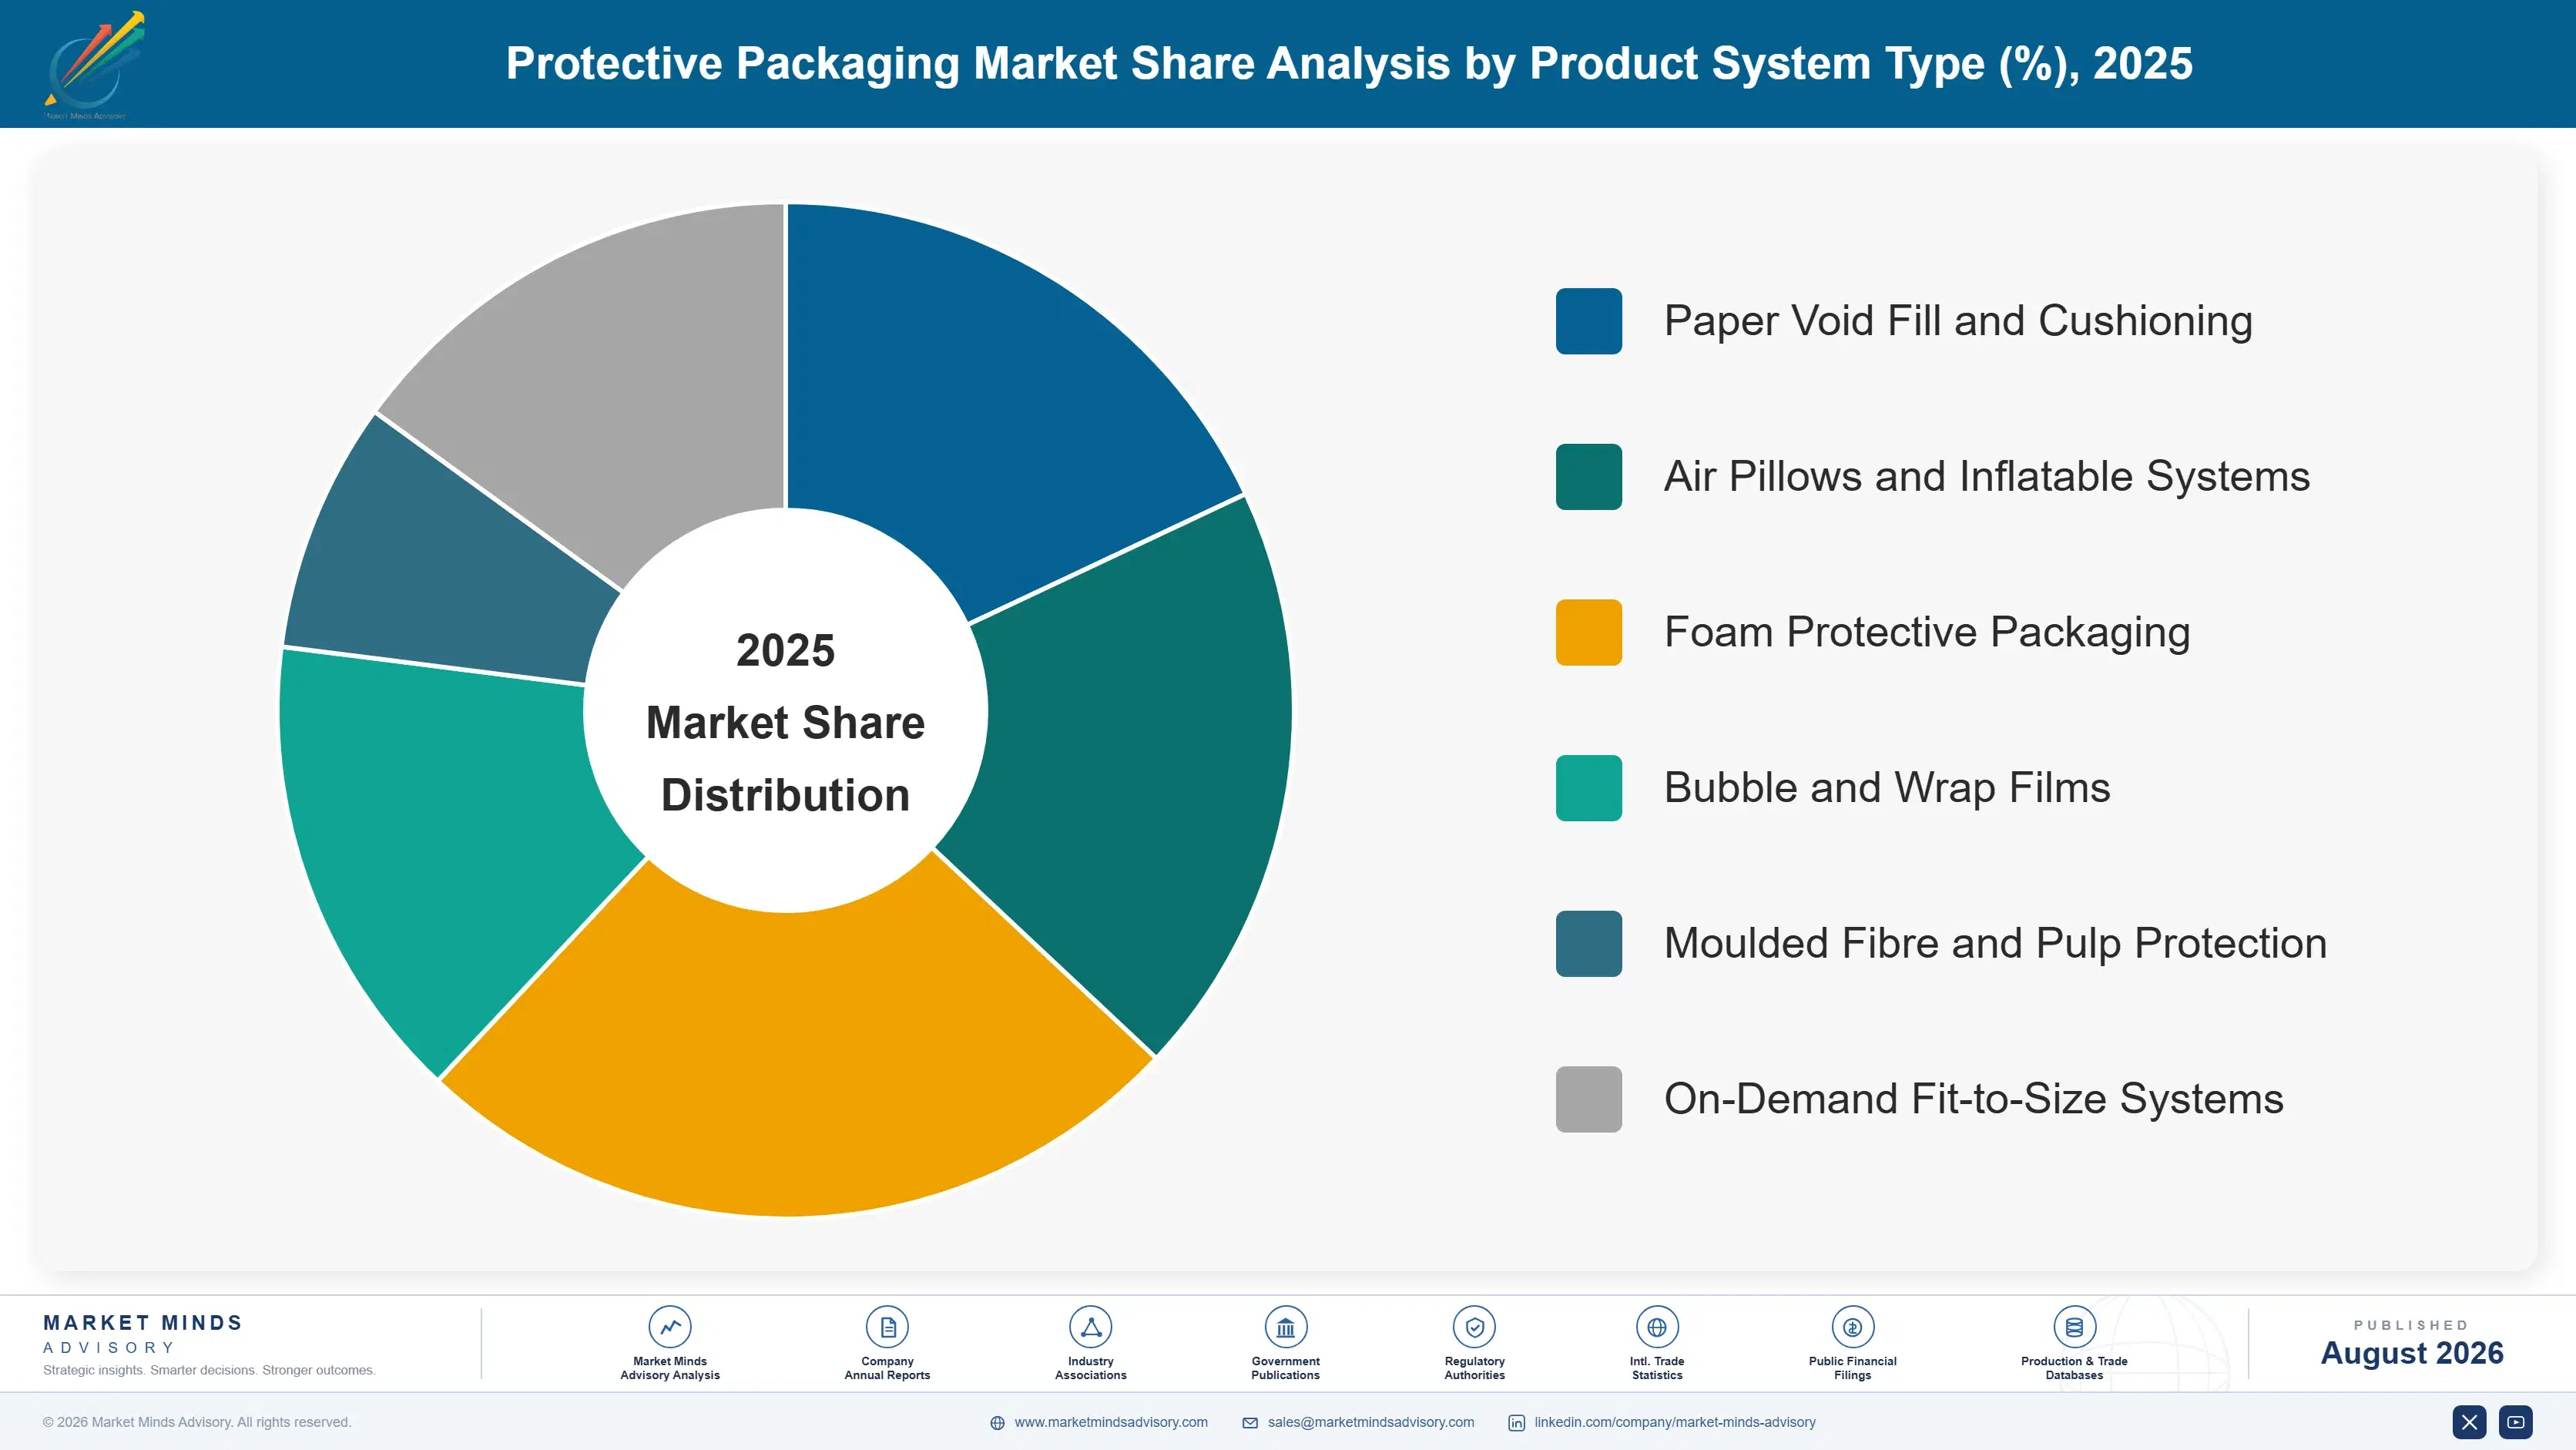
Six segments split by product system type, because each one carries a different protection mechanism, a different waste profile and a different point of purchase entirely. A roll of paper and an on-demand box machine answer the same brief through completely different commercial models. End-use industry and channel are handled in the framework instead.
protective-packaging-market-market-share-analysis-1787581024726

On-Demand Fit-to-Size Systems

Growing at 8.7%, half again the market rate of 5.8%, on-demand systems measure an item and produce a box fitted to it, eliminating the void that dimensional weight pricing charges for on every parcel a shipper sends. Freight savings run around 18% and recur indefinitely, which is an entirely different value proposition from a material cost saving negotiated once a year. Capital equipment cost confines adoption to shippers with substantial parcel volume, and that is the binding constraint rather than any doubt about the benefit itself. Consumable board revenue attaches to each installed machine, which makes the equipment sale a razor and blade arrangement in commercial practice. Third party logistics operators are the second adoption route, aggregating volume across clients.
CAGR 8.7%

Paper Void Fill and Cushioning

At 7.9% paper void fill has taken roughly 42% of category volume on kerbside recyclability rather than on protective performance, which is generally worse per gram than the plastic systems it replaced. Retailers under packaging waste pressure accept that trade knowingly, either using more material to compensate or tolerating a measurably higher damage rate. Honeycomb structures and engineered creping have narrowed the performance gap without closing it anywhere. Converting stays regional because paper void fill is bulky and low in value density, which makes freight uneconomic over distance and keeps the supplier field fragmented and local in a way consolidation has repeatedly failed to change. Suppliers built around paper equipment sit on the right side of that shift.
CAGR 7.9%
Full segment breakdown across 6 segments available in the complete report.

Regional Architecture and Country Demand Map

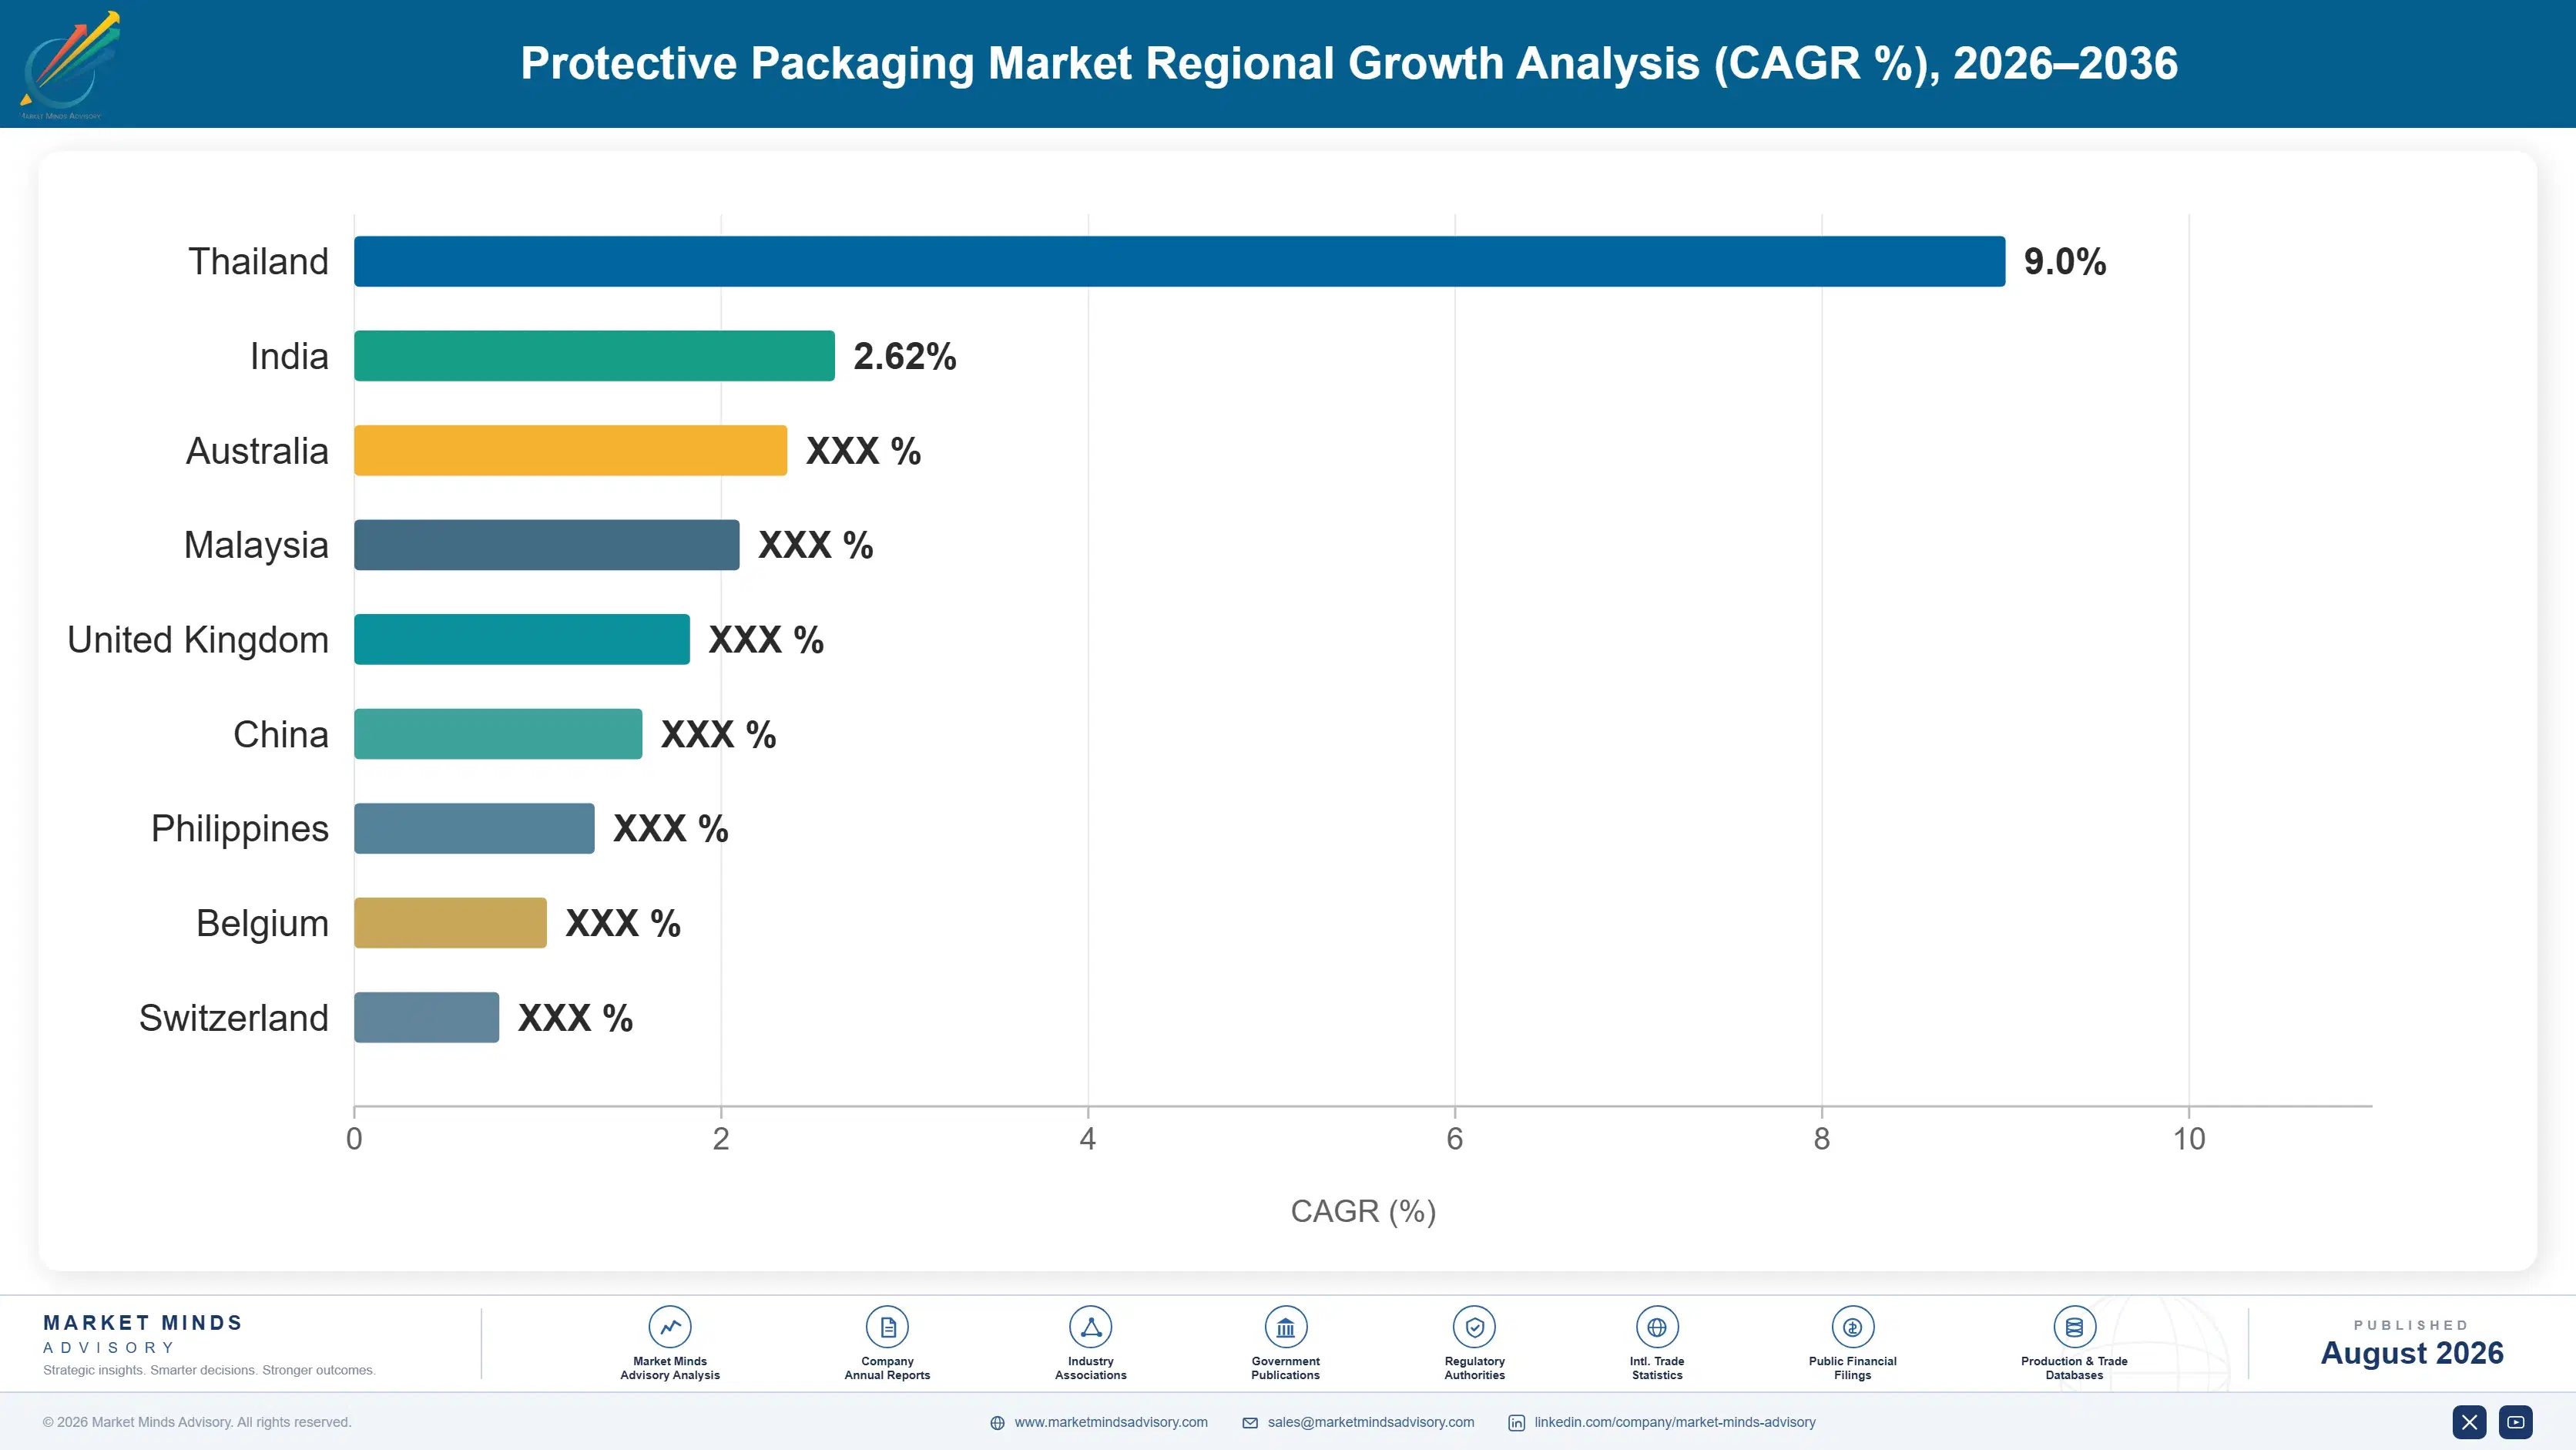
North America holds 30% of value on parcel volume and on the dimensional weight pricing that originated with its own carriers. East Asia follows at 26% on sheer e-commerce scale, with Western Europe at 22%, where packaging waste rules drive paper substitution harder than anywhere else.

North America

Dimensional weight pricing originated with American carriers and is applied more aggressively here than anywhere else, which makes void space a far more visible cost to American shippers than to their counterparts elsewhere. On-demand right-sizing penetration is correspondingly the highest of any region, concentrated among large retailers and third party logistics operators with the parcel volume to justify equipment investment. Paper substitution has proceeded on retailer commitment and state-level rules rather than on federal regulation, since no national packaging policy exists. Damage rate tracking is unusually sophisticated among American retailers, which makes the damage economics argument land more readily here than in most markets. Third party logistics operators account for a growing share of installed right-sizing capacity.
Share: 30% | CAGR: 5.0% (2026 to 2036)

Western Europe

Packaging waste rules bite harder here than anywhere and have driven paper substitution well ahead of what cost or protective performance alone would ever justify. German, Dutch and Nordic retailers have moved furthest, accepting measurably higher damage rates in exchange for kerbside recyclable packs. Carrier dimensional weight pricing is applied somewhat less aggressively than in North America, which weakens the right-sizing argument relative to the recyclability one and changes how suppliers sell. Ranpak and Storopack hold strong regional positions built on paper systems and equipment placement together, and French and Italian demand follows the same regulatory direction at a slower pace. Deposit and reuse schemes are extending from beverage containers toward transit packaging in several markets.
Share: 22% | CAGR: 4.2% (2026 to 2036)
Regional intelligence for 5 additional markets available in the complete report: East Asia, South Asia and Pacific, Latin America, Middle East and Africa, Eastern Europe. Contact sales@marketmindsadvisory.com.
protective-packaging-market-country-cagr-analysis-1787581025283

Four Moves Beyond Price Per Thousand

Selling protective material on price per thousand is selling much the least valuable thing in the entire conversation. Void space costs freight on every parcel forever, and damage costs several times the item value once returns are counted, and both of those numbers dwarf the packaging spend a buyer is trying to negotiate downward.

Quantify void space against the annual freight bill

Average void runs near 34% of parcel volume and dimensional weight pricing charges for all of it on every shipment, which across a full year of parcels produces a number no packaging price comparison ever approaches. Building that calculation for a specific shipper using their own parcel profile moves the conversation out of procurement and into logistics, where the budget available is far larger. Very few suppliers do this work and almost no shippers do it themselves, which leaves the argument sitting entirely available to whoever picks it up first.
Market Impact: Attacks the 34% void space in every parcel

Place equipment and sell the consumable behind it

On-demand fit-to-size systems deliver freight savings around 18% and require capital equipment, which converts a materials sale into an installed base with consumable board revenue attached to it. That relationship is far stickier than any material supply agreement, since removing the machine means reverting to void space the shipper has already learned to cost properly and retraining the people around it. Leased and smaller configurations extend reach toward mid-sized shippers where the payback arithmetic has historically been difficult to make work at all. Attachment rates on installed machines exceed 90% of throughput at established suppliers.
Market Impact: Locks in consumables behind an 18% freight saving

Sell damage reduction rather than material specification

A damaged parcel costs the replacement item, return freight, reshipment and frequently the customer relationship, which makes fully loaded damage cost several times the item's own value. Retailers track damage near 1.6% of parcels and know their own figure precisely, so a supplier arriving with comparative test data showing a measurable reduction is proposing a return rather than an expense. That argument reaches a different buyer entirely, and suppliers making it consistently win specifications that price-led competitors never manage to reach. It also reaches a buyer who controls a budget considerably larger than the packaging line.
Market Impact: Targets a 1.6% parcel damage rate across categories

Engineer paper structures to close the performance gap

Paper has taken 42% of void fill volume on recyclability while protecting less per gram, which leaves retailers choosing between using more material and accepting more damage than they used to. Honeycomb structures, engineered creping and multi-layer forms have narrowed that gap without closing it anywhere yet. A supplier reaching genuine performance parity in paper resolves the trade retailers are currently forced to make, and it would take share from both the plastic systems being displaced and the paper systems doing the displacing at the same time. Nobody has published independent comparative testing supporting a parity claim yet.
Market Impact: Serves the 42% of volume already in paper

Who Controls the Margin Pool

Participation is measured on annual protective packaging shipment volume by value, and the top five hold 21%. Concentration is low because protective materials are bulky and freight uneconomic over distance, which keeps converting regional even where customers are global. Sealed Air and Ranpak lead through equipment placement alongside materials rather than through converting scale alone. The gap to challengers is installed equipment base rather than manufacturing capability.
Competition runs on three things. Equipment placement decides who holds a consumable annuity rather than a renegotiable supply contract. Damage performance data decides which supplier reaches the logistics buyer rather than the procurement one. Paper performance engineering is the third front, since substitution has already happened and the retailers who made it are living with a protection gap somebody will eventually close.

The pressure ahead comes from packaging waste rules and dimensional weight pricing pulling in opposite directions. One demands less material and the other demands less space, and less material in the same box does nothing for freight while less space frequently requires better material. Expect equipment investment and paper engineering rather than acquisitions. Rankings shift as installed bases build and as material-only suppliers find themselves negotiating on price forever.
protective-packaging-market-company-positioning-matrix-1787581025800

Competitive Moat and Risk Dimensions

SEALED AIR

Moat: Installed equipment base breadth

Sealed Air places protective packaging equipment across a very large installed base and sells consumables into it, which converts a renegotiable materials relationship into an annuity attached to machinery the customer relies on daily. Removing a system means reverting to a packing method the operation has already left behind, which few logistics managers will contemplate for a marginal price difference.
SEALED AIR

Risk: Plastic system portfolio exposure

A substantial part of the installed base runs plastic air pillow and film systems facing paper substitution driven by packaging waste rules rather than by performance. Converting an installed base to paper equipment means selling replacement machinery to customers who already have working systems, which is a considerably harder sale than the original placement was.
RANPAK

Moat: Paper systems and equipment position

Ranpak built its position entirely around paper-based protective systems with equipment placed at customer sites, which puts it on the right side of a substitution that packaging waste rules keep accelerating. Being the incumbent paper equipment supplier as retailers convert away from plastic is a position competitors are trying to reach rather than defend.
RANPAK

Risk: Paper performance gap exposure

Paper protects less per gram than the plastic systems being displaced, and retailers accepting higher damage rates for recyclability may reconsider if damage costs rise or if an engineered alternative closes the gap first. A business built on paper systems carries the performance criticism of the whole substitution rather than being able to point elsewhere.

Players Tracked

Prominent Players

Sealed Air
Ranpak
Pregis
Storopack
Smurfit Westrock

Other Key Players

Sonoco
Mondi
DS Smith
Intertape Polymer Group
Veritiv
Berry Global
Huhtamaki
Packsize
Nefab
ORBIS Corporation
Schoeller Allibert
Green Light Packaging
Cascades
Sancell
TemperPack

Recent Developments

FEBRUARY 2026

Retailer deploys on-demand box sizing across its fulfilment network

A large online retailer deployed on-demand fit-to-size box production across its principal fulfilment centres, citing dimensional weight freight savings rather than packaging material cost as the justification. Equipment placement carried a multi-year consumable board supply agreement attached to each installed system. Deployment covered most of the network inside a year.
Signal: Freight cost rather than packaging cost now justifies the capital equipment sitting inside a fulfilment centre
SEPTEMBER 2025

European grocer accepts higher damage rate for recyclable protective packaging

A European grocery retailer converted protective packaging across its entire online operation from plastic to paper systems, accepting a measurably higher parcel damage rate in exchange for kerbside recyclability. The decision was documented internally as a deliberate commercial trade rather than a performance-neutral substitution. Volumes shifted inside one planning cycle.
Signal: Retailers now trade damage rate for recyclability knowingly, which is a trade most suppliers rarely acknowledge openly
JUNE 2026

Supplier launches engineered paper cushioning targeting plastic performance parity

A protective packaging supplier launched an engineered paper cushioning structure claiming protection approaching plastic air pillow systems measured per gram, using a multi-layer honeycomb geometry. Independent comparative drop testing across realistic retailer parcel conditions has not yet been published for it. Commercial launch preceded that testing rather than following it.
Signal: Closing the paper performance gap would resolve a trade that retailers are presently forced to accept

Paper, Resin and the Truck

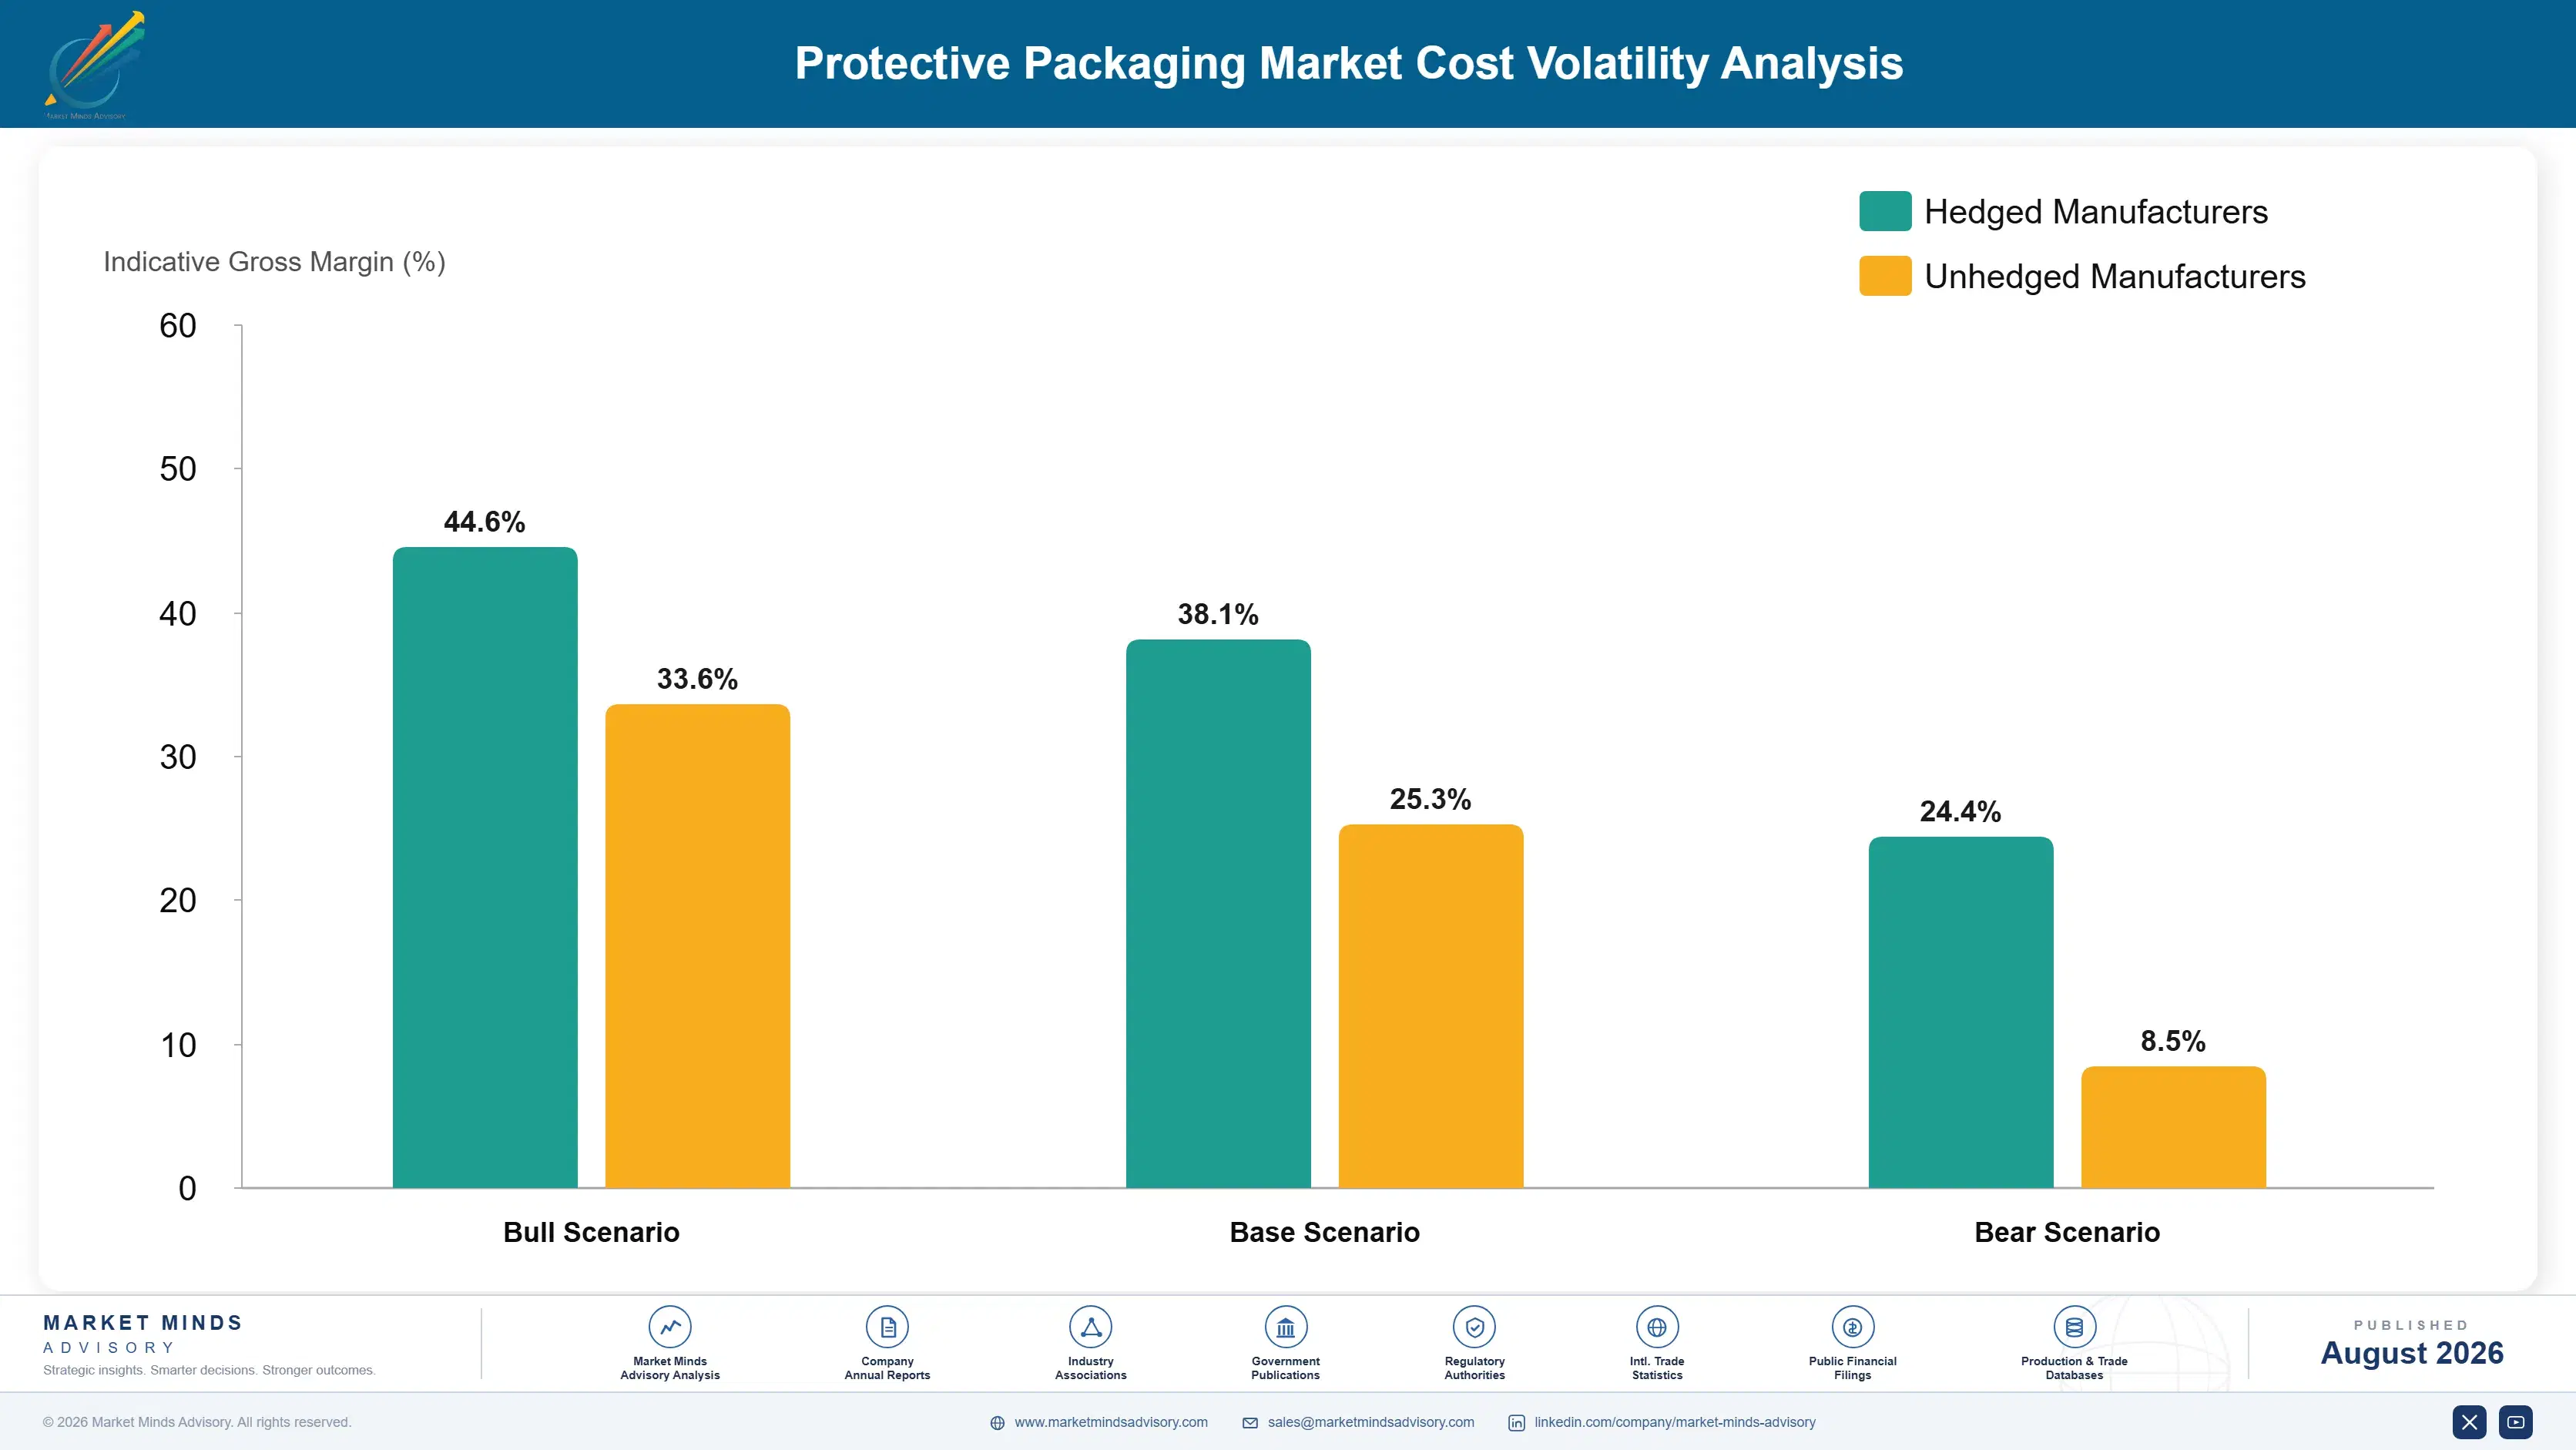
Kraft paper accounts for roughly 46% of cost in paper-based systems, sourced from regional mills and priced against containerboard and kraft grades. Polyethylene resin carries about 41% in film and air pillow systems, which is a similar dependency on a different chain entirely. Converting energy and labour add around 18%, and outbound freight is unusually significant because protective materials ship mostly air by definition.
Kraft paper pricing rose sharply through 2021 and 2022 as containerboard demand surged with parcel volumes and European energy costs climbed, per published pulp and paper pricing for the period. Converters holding annual retail agreements absorbed a substantial share, since protective packaging pricing is set with the customer annually and rarely reopened. Polyethylene moved on a separate cycle, which advantaged converters running both material systems.

Exposure divides on material breadth and on freight geography. A converter running paper and film systems can shift emphasis as the two cycles diverge, while a single-material producer carries whichever one it sits in. Freight matters more here than in almost any packaging category, since protective material is bulky and low in value density, which is exactly why converting stays regional and concentration sits at only 21%.
protective-packaging-market-cost-volatility-analysis-1787581025996

Operate both paper and polymer material systems

Kraft paper and polyethylene move on entirely separate cycles driven by containerboard and petrochemical markets respectively, so a converter running both material systems can shift emphasis as the two diverge. The capital requirement is the obstacle, since these are genuinely different production lines. Converters holding both came through the last input cycle considerably better than single-material producers did.

Index customer agreements to published material references

Material is around 46% of cost in paper systems and pricing with retailers is agreed annually, which guarantees margin variance whenever kraft or resin moves. Indexing to published references passes movement through with a defined lag. Large retail customers accept indexing far more readily than distributors do, which shapes which accounts are worth pursuing when inputs are volatile.

Site converting inside the fulfilment geography served

Protective material ships mostly air, so delivered cost rises steeply with distance and converting economics stay regional regardless of how global the customer's own footprint happens to be. Placing capacity near fulfilment centres beats optimising a single large plant almost every time. This constraint is why concentration in the category sits at only 21% after decades of attempted consolidation.

Portfolio Architecture for Margin Defence

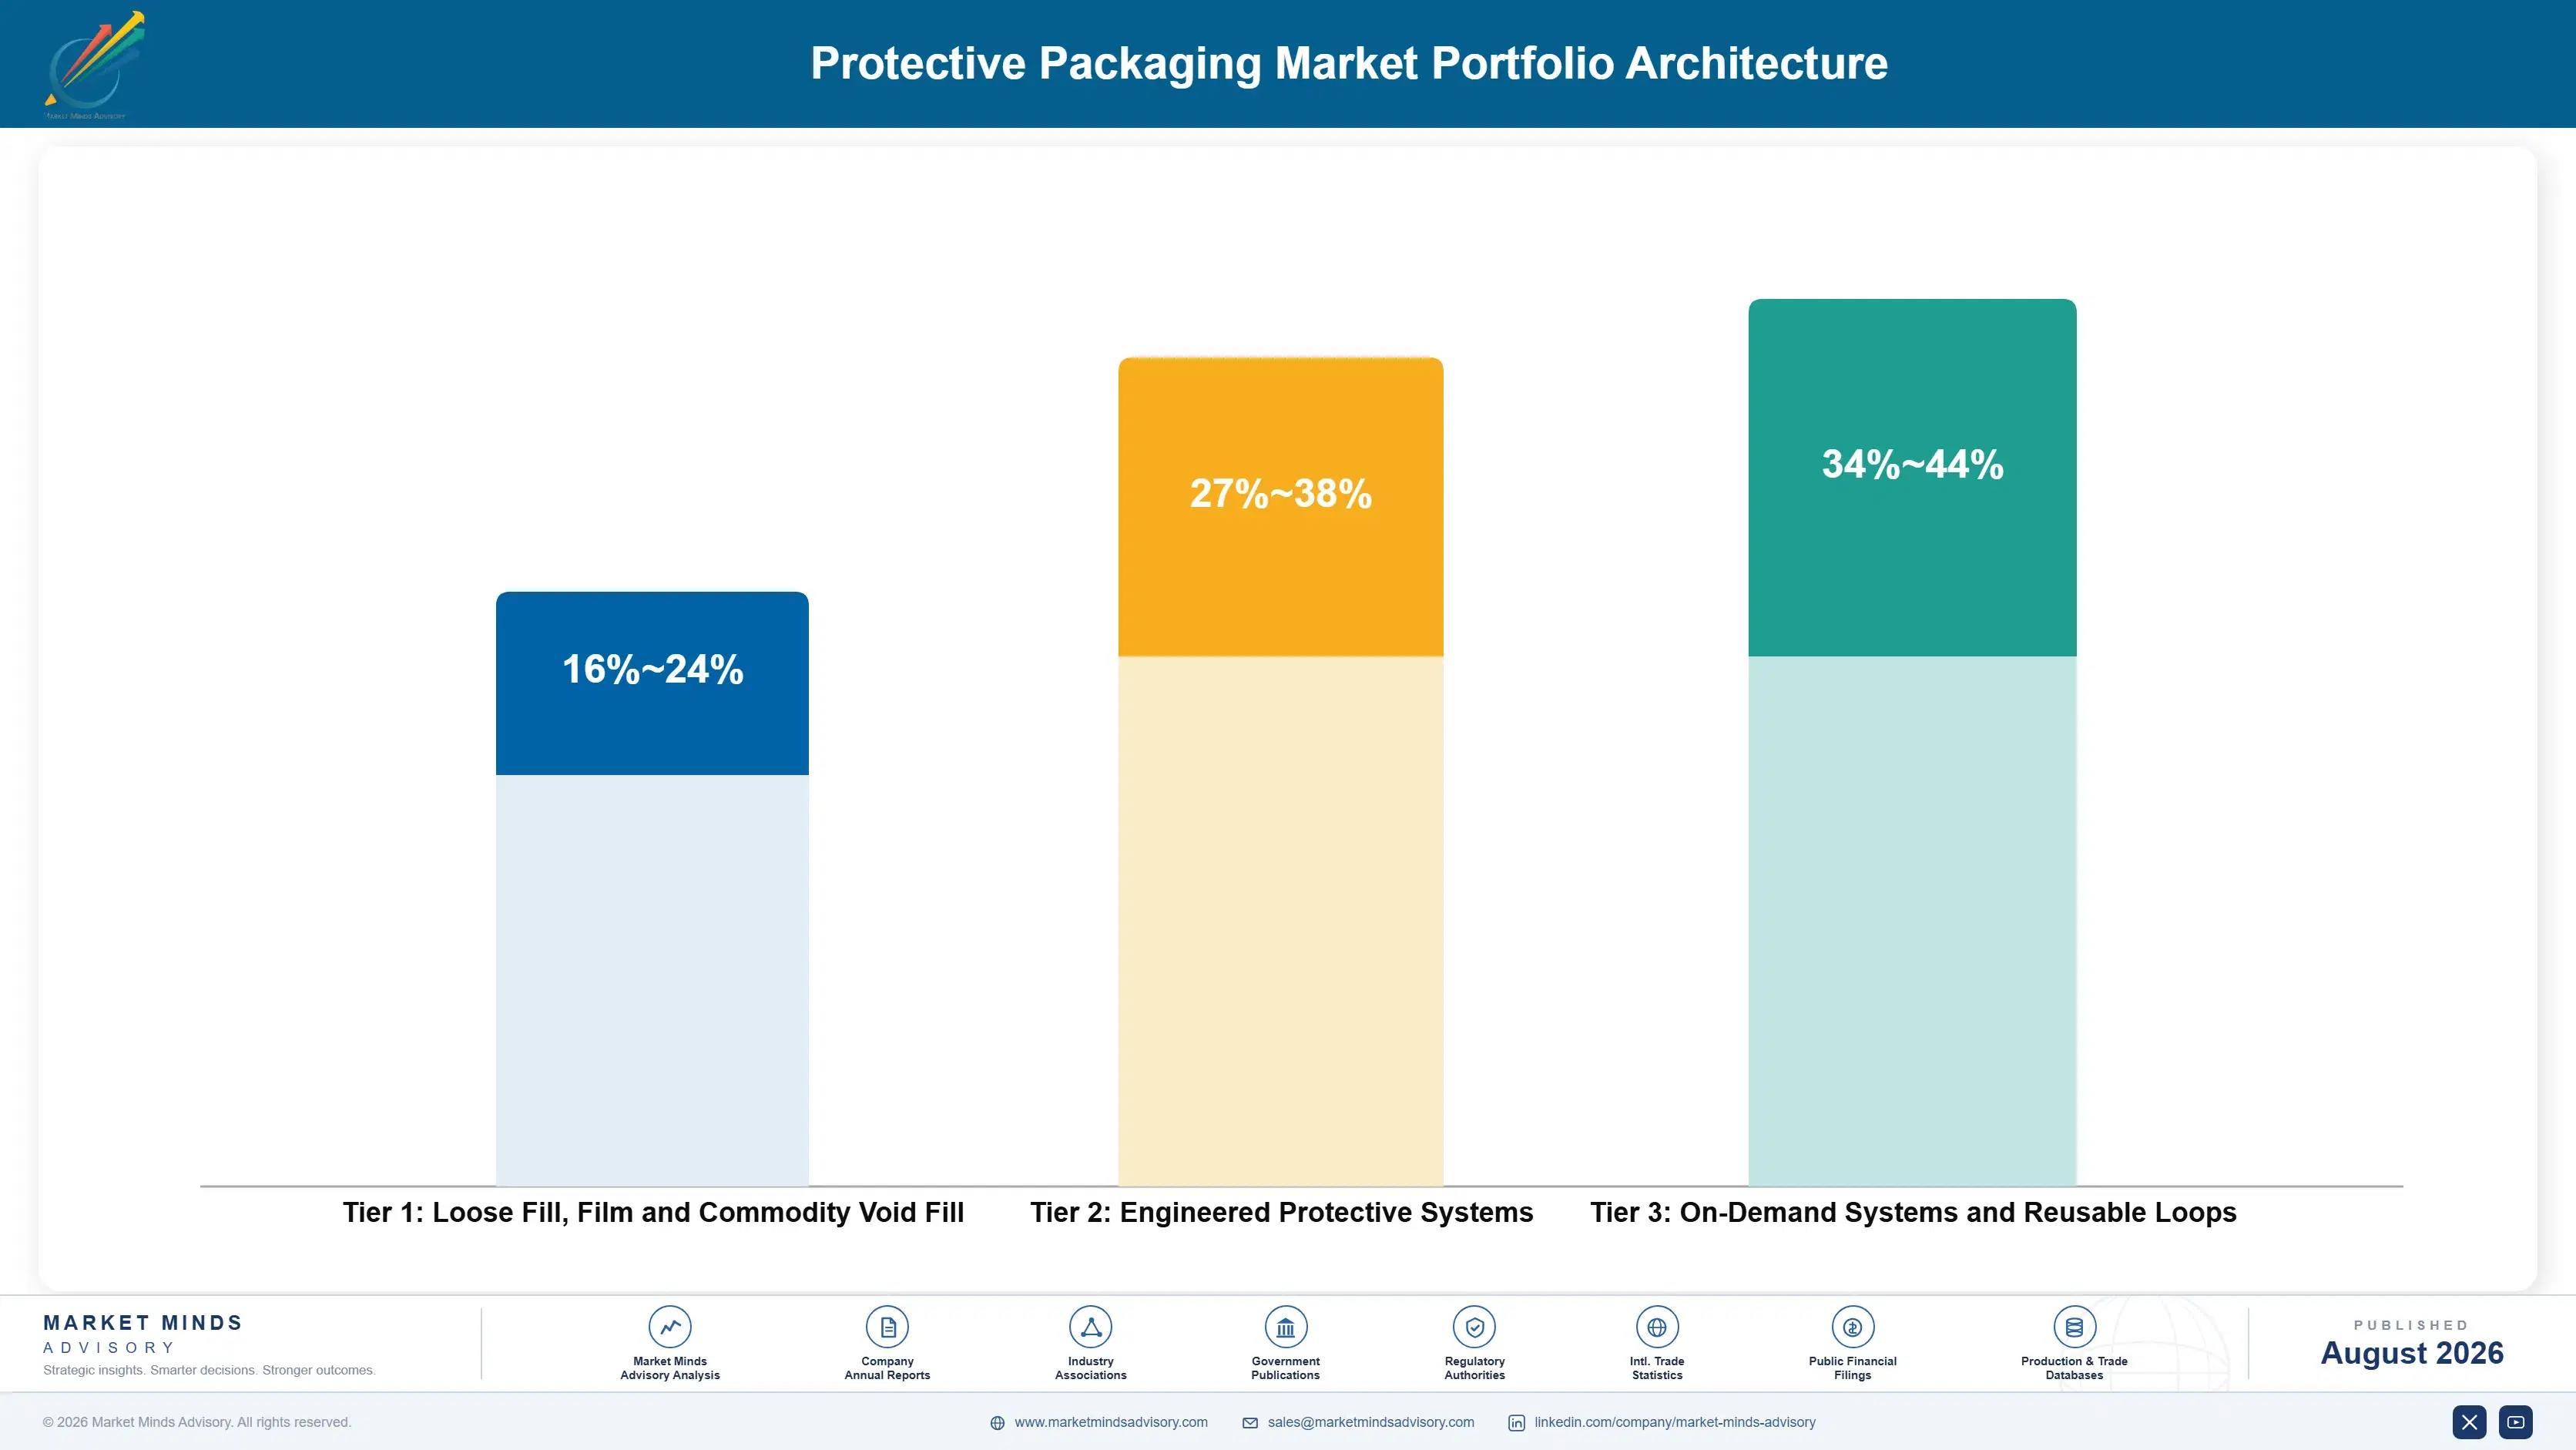
Margin here tracks whether equipment sits behind the material or not. Loose fill, standard bubble film and commodity paper void fill earn margins in the high teens, because any regional converter can supply them and the buyer renegotiates annually against a price per thousand. Freight cost protects a local position without conferring any pricing power on whoever holds it.
Engineered protective systems do considerably better at margins in the high twenties to high thirties, because a specification developed against a retailer's own damage data and product profile is much harder to displace than a commodity roll. The range reflects how far a supplier helped develop that specification. Validation work nobody wants to repeat is what holds the account rather than any contract term.

On-demand equipment with attached consumables holds the strongest position of all, running into the low forties, because a machine installed in a fulfilment centre carries a consumable annuity and removing it means reverting to a packing method the operation has already abandoned. Those margins reflect a switching barrier the customer effectively helped to build themselves. Reusable container loops sit alongside at similar margins where return rates hold above 90%.

Loose Fill, Film and Commodity Void Fill

Standard bubble film, loose fill and commodity paper void fill supplied on price per thousand. The eight point range reflects converting scale and freight position rather than any specification a competitor cannot match.
Gross Margin: 16-24%

Engineered Protective Systems

Protective specifications developed against a customer's own damage data and product profile. The eleven point range reflects how far the supplier participated in developing the specification rather than quoting against a completed one.
Gross Margin: 27-38%

On-Demand Systems and Reusable Loops

Fit-to-size equipment with consumable supply attached, alongside reusable container systems running in controlled loops. The ten point range reflects equipment placement depth and how completely the consumable relationship is captured.
Gross Margin: 34-44%
protective-packaging-market-portfolio-architecture-1787581026494

High-value Sub-segments and Strategic Watch-out

On-Demand Fit-to-Size Systems

High value and the fastest growth in the category at 8.7%, justified by freight savings near 18% rather than by any material cost argument. Installed equipment carries consumable revenue and a switching barrier the customer effectively built for themselves. Adoption is spreading downward toward mid-sized shippers slowly.
Gross Margin: 36-44%

Engineered Paper Protective Structures

High value and growing on a substitution already well under way. Whoever reaches genuine performance parity in paper resolves a trade retailers are currently forced to accept between accepting damage and offering kerbside recyclability to their own customers. No independent parity testing has been published.
Gross Margin: 29-38%

Commodity Void Fill and Film

The volume core, permanently negotiated on price per thousand at every annual renewal. Any regional converter can supply it, and freight protects local position without conferring any pricing power at all on whoever happens to be holding it. Consolidation attempts have repeatedly failed against that freight arithmetic.
Gross Margin: 16-24%

Plastic Systems Facing Substitution

The strategic watch-out for the category. Paper has already taken 42% of void fill volume on recyclability rather than on performance, and installed plastic equipment bases now face outright replacement rather than the gradual erosion suppliers had planned around. Replacement sales are far harder than original placement was.
Gross Margin: 14-26%

How the Consumable Repeats

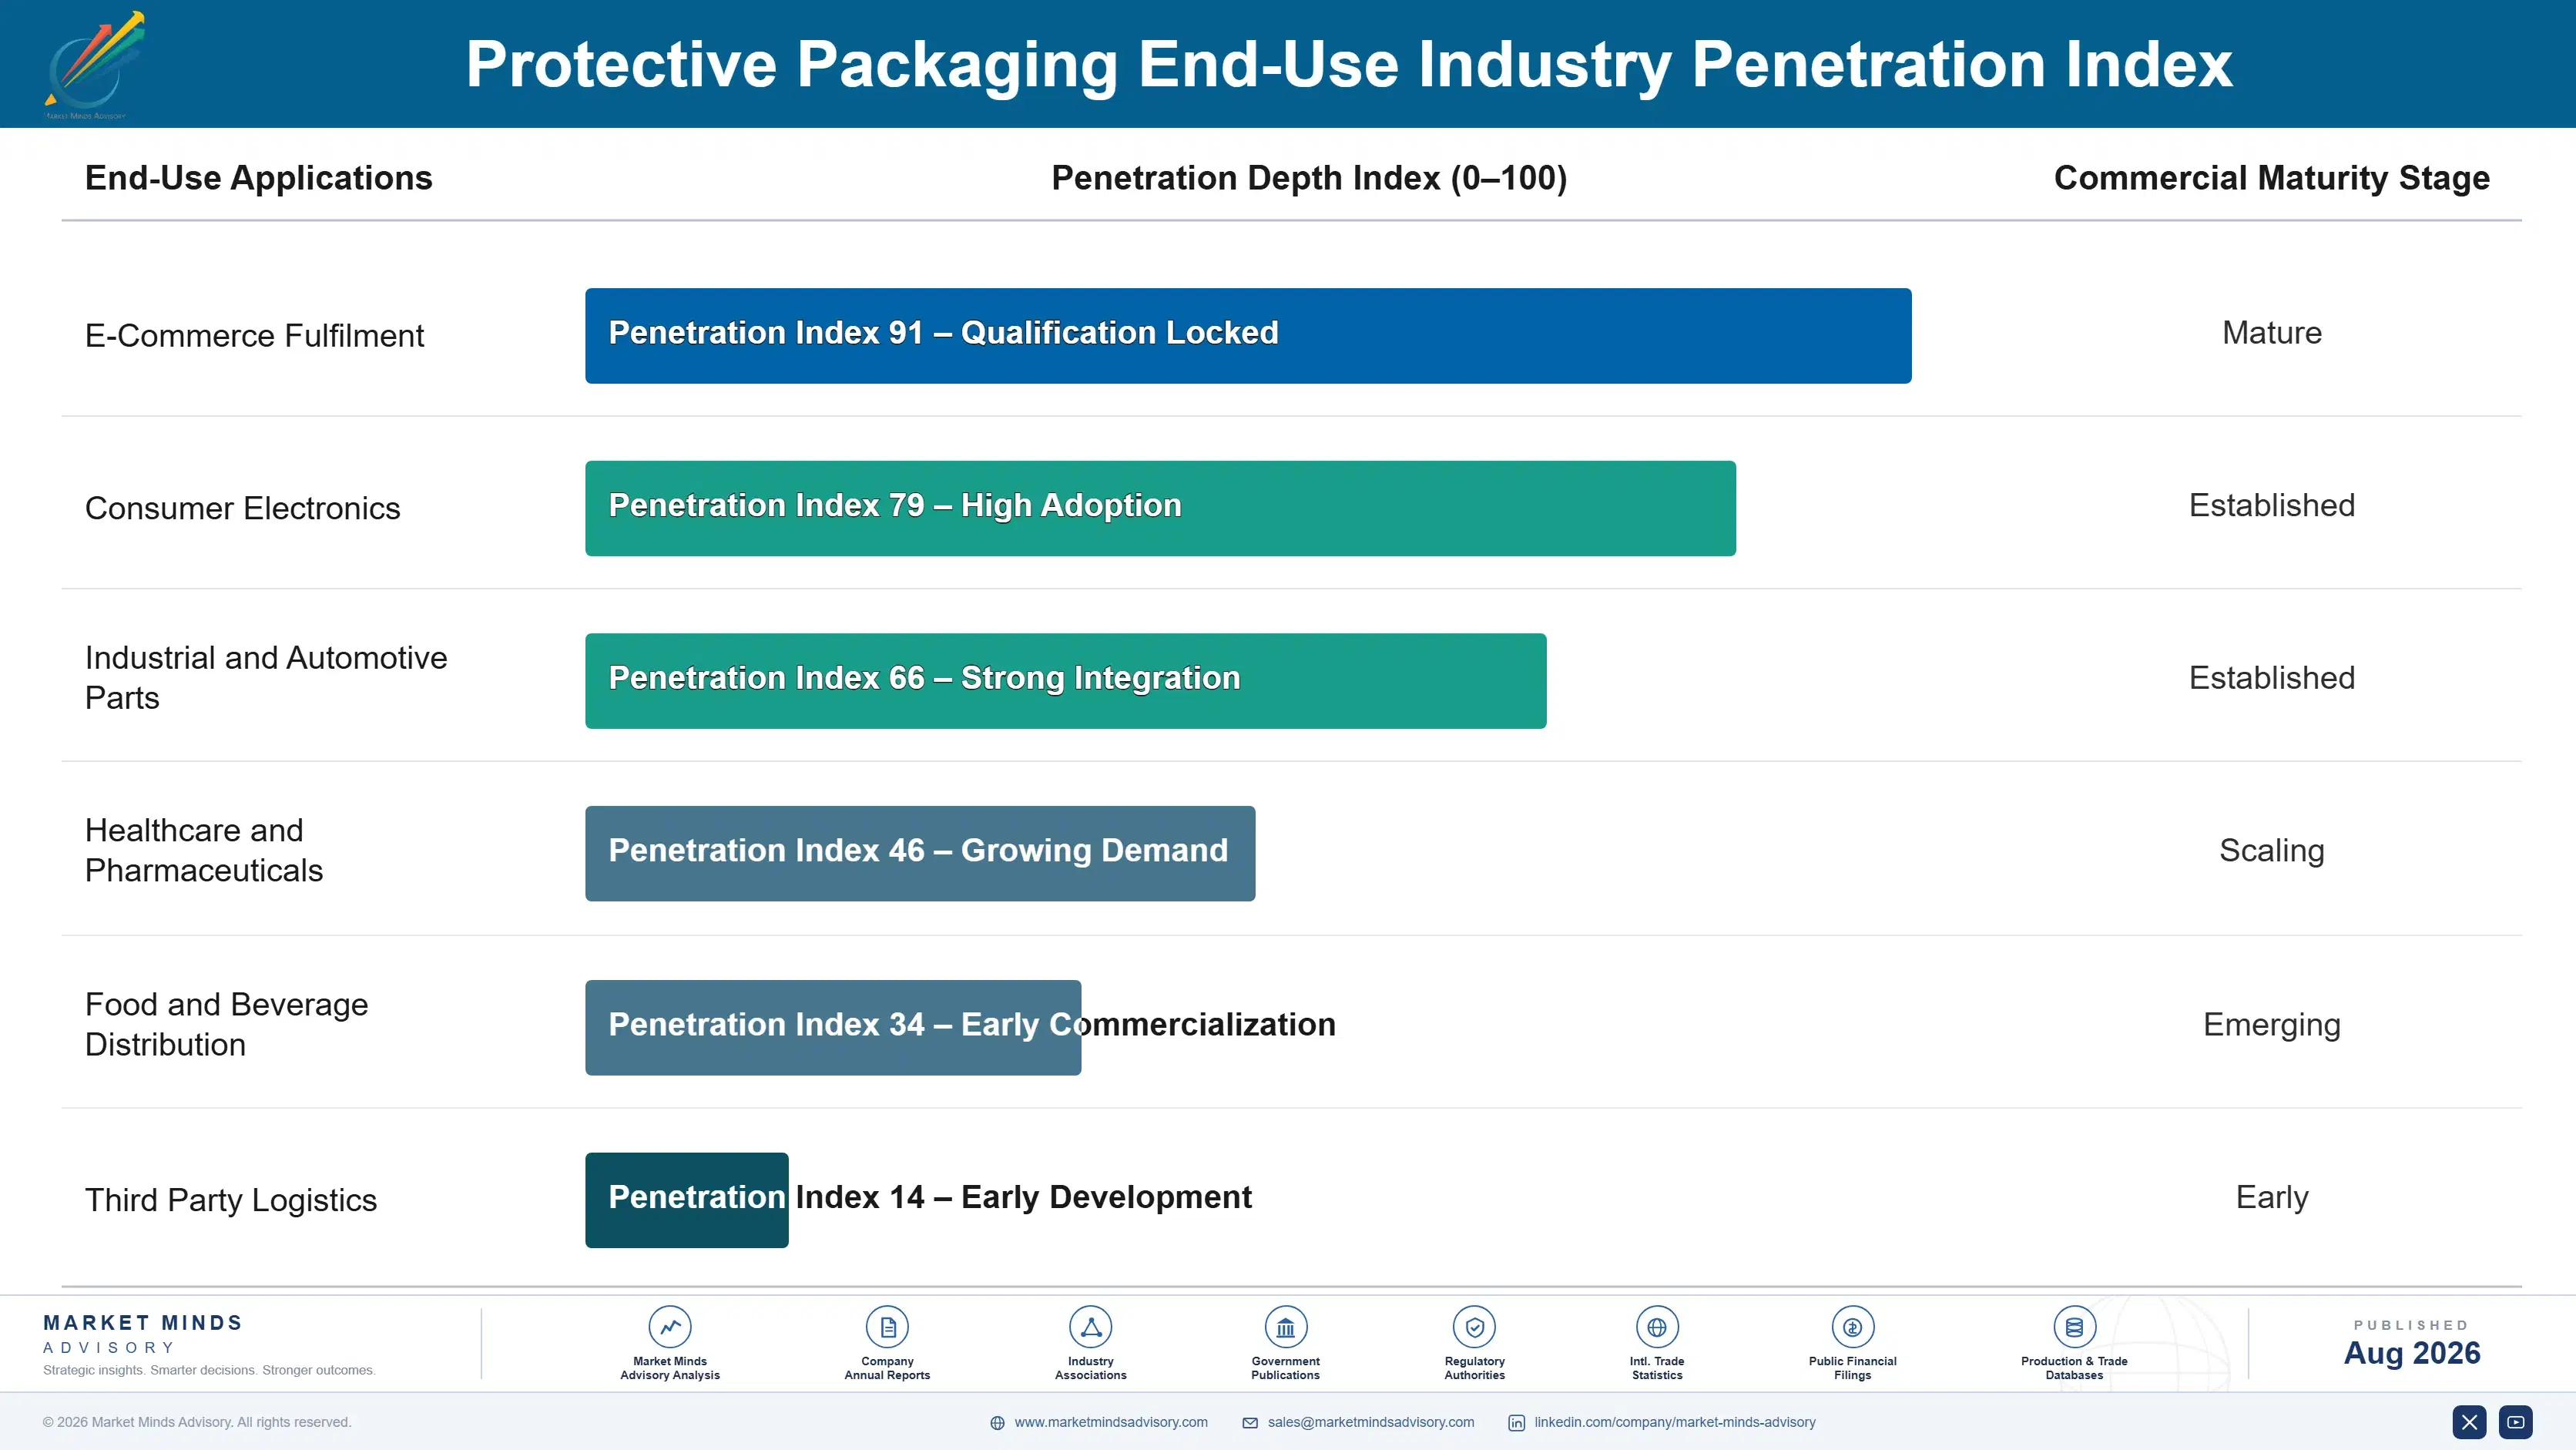
Protective packaging demand repeats with every parcel shipped, which makes volume a direct function of a customer's own order book rather than of any purchasing decision. A fulfilment centre consumes material every shift and cannot pause, so supply reliability matters more than price on any given day. What varies is which supplier provides it, and in commodity tiers that is renegotiated annually against a comparison a buyer can make in an afternoon.
Stickiness follows equipment almost exactly. A supplier with a machine installed holds a consumable annuity, since removing it means reverting to a packing method the operation has abandoned and retraining people around it. Engineered specifications developed against a retailer's damage data come next, held by validation work nobody wants to repeat. Commodity void fill switches on price at every renewal without any friction at all.

The specifying buyer moved when the argument moved. Protective packaging was bought by procurement comparing price per thousand for decades. Dimensional weight freight cost and damage economics both sit in logistics budgets rather than packaging ones, which means a supplier making either argument is talking to somebody procurement does not usually involve in a packaging decision.
protective-packaging-market-end-use-penetration-index-1787581026981

Where We Would Focus Effort

These are among the four positions where our research anticipates prominent divergence between winners and laggards over the coming forecast period. Each is grounded in the demand model, the regulatory perimeter, and the announced capacity pipeline.
01 / VOID COST QUANTIFICATION

Show the annual freight bill, not the price per thousand

Average void runs near 34% of parcel volume and dimensional weight pricing charges for every cubic centimetre of it on every shipment, which across a year of parcels produces a number no packaging price comparison ever approaches. Building that calculation from a specific shipper's own parcel profile moves the conversation out of procurement and into logistics, where the available budget is very much larger. Very few suppliers do that work and almost no shippers do it themselves, which leaves the argument sitting available.
02 / EQUIPMENT PLACEMENT STRATEGY

Put a machine in the building and sell what it eats

On-demand fit-to-size systems deliver freight savings around 18% and require capital equipment, which converts a renegotiable materials contract into an installed base with recurring consumable revenue firmly attached to it. That relationship is considerably stickier than any supply agreement, because removing the machine means reverting to void space the shipper has already learned to cost properly and retraining the packers around it. Leased and smaller configurations extend the reach toward mid-sized shippers where payback arithmetic has historically been difficult to make work.
03 / DAMAGE ECONOMICS SELLING

Propose a return, not an expense, using their own data

A damaged parcel costs the replacement item, return freight, reshipment and frequently the customer relationship itself, which makes fully loaded damage cost several times the item's own value at the till. Retailers track damage near 1.6% of parcels and reliably know their own figure to a decimal place. A supplier arriving with comparative test data showing a measurable reduction is proposing a return rather than an expense, and that argument consistently wins specifications price-led competitors have never once managed to reach.
04 / PAPER PERFORMANCE ENGINEERING

Close the gap retailers are currently paying for in damage

Paper has taken roughly 42% of void fill volume on recyclability grounds while protecting measurably less per gram than the plastic it displaced, which leaves retailers choosing between using more material and accepting more damage. Honeycomb structures and engineered creping have narrowed that performance gap without closing it anywhere yet. A supplier reaching genuine parity resolves a trade retailers are presently forced into, and would take share from the displaced plastic and the displacing paper at very much the same time.

Engagement Snapshot From the Field

A live engagement with an industry participant carrying material or product regulatory and market exposure ahead of a defining policy shift, showing how our research translates into a defensible multi-year portfolio strategy.
MARKET MINDS ADVISORY · CLIENT ENGAGEMENT SUMMARY
Protective Packaging Producer Strategic Portfolio Review and Transition Roadmap 2026·Investment Scenario on Protective Packaging Exposure Evaluation 2025-26
CLIENT PROFILE
A European protective packaging converter supplying paper void fill, bubble film and loose fill from four regional plants, with annual revenue near 240 million euros (client-reported, unverified by MMA). Sales were made almost entirely on price per thousand through procurement contacts at each account, and the business placed no equipment at customer sites at all.
STRATEGIC CHALLENGE
Two large e-commerce customers had installed on-demand box sizing equipment from a competitor and cut void fill purchases sharply as a result. Margins on remaining commodity volume had compressed through three consecutive annual renegotiations. Management needed to decide whether to enter equipment placement, invest in engineered paper performance, or defend the material business on cost.
MMA APPROACH
MMA quantified void space and dimensional weight cost across the client's twelve largest customers using their own parcel profiles, benchmarked engineered paper structures against plastic systems on drop test performance, and costed equipment placement models including leasing. Buyer access was tested across procurement and logistics functions. Interviews with 47 experts covered protective packaging, fulfilment operations and carrier pricing.
KEY FINDINGS
  1. Dimensional weight cost attributable to void space across the twelve customers examined exceeded their combined annual protective packaging spend by a factor of more than three.
  2. None of the twelve customers had been shown that calculation by any supplier, and nine had never discussed protective packaging with anyone outside their procurement function.
  3. Equipment placement required capital the client could fund through leasing structures, and consumable attachment rates at competitors exceeded 90% of installed machine throughput.
  4. Engineered paper structures narrowed but did not close the performance gap against plastic systems in the client's own comparative drop testing across parcel types.
CLIENT PROFILE
A European protective packaging converter supplying paper void fill, bubble film and loose fill from four regional plants, with annual revenue near 240 million euros (client-reported, unverified by MMA). Sales were made almost entirely on price per thousand through procurement contacts at each account, and the business placed no equipment at customer sites at all.
STRATEGIC CHALLENGE
Two large e-commerce customers had installed on-demand box sizing equipment from a competitor and cut void fill purchases sharply as a result. Margins on remaining commodity volume had compressed through three consecutive annual renegotiations. Management needed to decide whether to enter equipment placement, invest in engineered paper performance, or defend the material business on cost.
MMA APPROACH
MMA quantified void space and dimensional weight cost across the client's twelve largest customers using their own parcel profiles, benchmarked engineered paper structures against plastic systems on drop test performance, and costed equipment placement models including leasing. Buyer access was tested across procurement and logistics functions. Interviews with 47 experts covered protective packaging, fulfilment operations and carrier pricing.
KEY FINDINGS
  1. Dimensional weight cost attributable to void space across the twelve customers examined exceeded their combined annual protective packaging spend by a factor of more than three.
  2. None of the twelve customers had been shown that calculation by any supplier, and nine had never discussed protective packaging with anyone outside their procurement function.
  3. Equipment placement required capital the client could fund through leasing structures, and consumable attachment rates at competitors exceeded 90% of installed machine throughput.
  4. Engineered paper structures narrowed but did not close the performance gap against plastic systems in the client's own comparative drop testing across parcel types.
RECOMMENDED STRATEGY
Phase 1: Phase one: build void space and freight cost calculations for the twelve largest customers, since none has ever been shown the number that dwarfs their packaging spend. Phase 2: Phase two: enter equipment placement through leasing structures, converting renegotiable material contracts into installed bases with recurring consumable revenue attached to each machine. Phase 3: Phase three: continue paper performance development without claiming parity, since the client's own testing does not yet support that claim.
OUTCOME
The converter built freight cost analyses for its largest customers during 2026 and reported gaining access to logistics decision makers at seven of the twelve (client-reported, unverified by MMA). Equipment placement began through a leasing arrangement, and commodity void fill volume was allowed to decline rather than defended on price.

Frequently Asked Questions

Foundational context covering the market sizes, CAGR, scope, country, region and competition that inform every finding below. This section is provided to cover basics and most often pre-purchase conversations, answered from the MMA Primary Research Dataset.

What is the current size of the Protective Packaging Market?

MMA sizes it at USD 32.4 billion in 2025, rising to USD 34.28 billion in 2026. The figure covers materials and systems protecting products in transit at converter and system supplier selling value.

How large will the Protective Packaging Market be by 2036?

USD 60.24 billion by 2036, an incremental USD 25.96 billion over the 2026 base and an expansion multiple of 1.76 times. On-demand systems account for a disproportionate share.

What is the CAGR for the Protective Packaging Market 2026 to 2036?

5.8% in the base case, with a bull case at 7.0% and a bear case at 4.6%. The spread turns on right-sizing equipment reach and on how far material reduction is pushed.

Which segment is growing fastest?

On-demand fit-to-size systems at 8.7%, half again the market rate of 5.8%. Freight savings around 18% recur on every parcel and dwarf any packaging material saving.

Who are the major companies in the Protective Packaging Market?

Sealed Air, Ranpak, Pregis, Storopack and Smurfit Westrock lead on annual shipment volume by value. Fifteen further participants are profiled in the full report on that basis.

Which country is growing fastest?

India at 9.4%, as e-commerce parcel volumes expand from a base where protective practice is unsophisticated and damage rates run well above developed market levels.

Report Segmentation Architecture

The full report scope spans multiple orthogonal segmentation dimensions, with cross-tabulated demand data provided for each dimension pair. Coverage extends further to regional breakdowns, trend trajectories, and the competitive detail needed to support segment-level decision-making.

By Product System Type

  • Paper Void Fill and Cushioning
  • Air Pillows and Inflatable Systems
  • Foam Protective Packaging
  • Bubble and Wrap Films
  • Moulded Fibre and Pulp Protection
  • On-Demand Fit-to-Size Systems

By End-Use Industry

  • E-Commerce Fulfilment
  • Consumer Electronics
  • Industrial and Automotive Parts
  • Healthcare and Pharmaceuticals
  • Food and Beverage Distribution
  • Third Party Logistics

By Commercial Dimension

  • Direct Supply to Shippers
  • Equipment Placement Agreements
  • Distributor and Wholesale Channels
  • Contract Packaging Supply
  • Leased Systems Arrangements
  • Export and Cross-Border Supply

By Region

  • North America
  • Western Europe
  • East Asia
  • South Asia and Pacific
  • Latin America
  • Middle East and Africa
  • Eastern Europe

Scope, Methodology, and Coverage

Every figure in this report is reproducible from documented input assumptions. The scope below maps the historical period, the forecast horizon, the segmentation dimensions, and the countries covered, alongside the underlying primary and qualitative methodology.
Historical Period
2020 to 2025
Forecast Period
2026 to 2036
Base Year
2025 (USD billions; MMA Primary Research Dataset, August 2026)
Market Definition
Materials and systems protecting products in transit and storage, spanning paper void fill and cushioning, air pillows and inflatable systems, foam protection, bubble and wrap films, moulded fibre and pulp protection and on-demand fit-to-size systems including attached consumables, measured at converter and system supplier selling value. Primary product packaging, corrugated shipping boxes sold as containers, pallets and unit load devices, and temperature-controlled packaging systems are excluded from scope.
Quantitative Units
USD billions (current prices); billion parcels protected annually; USD per thousand parcels by system type
Segmentation Dimensions
Product system type; end-use industry; commercial dimension; region
Regions Covered
North America, Western Europe, East Asia, South Asia and Pacific, Latin America, Middle East and Africa, Eastern Europe
Countries Covered
United States, Canada, Mexico, Germany, Netherlands, United Kingdom, France, Sweden, China, Japan, South Korea, India, Indonesia, Vietnam, Australia, Brazil, United Arab Emirates, Saudi Arabia, South Africa, Poland
Key Companies Profiled
Sealed Air, Ranpak, Pregis, Storopack, Smurfit Westrock, Sonoco, Mondi, DS Smith, Intertape Polymer Group, Veritiv, Berry Global, Huhtamaki, Packsize, Nefab, ORBIS Corporation, Schoeller Allibert, Green Light Packaging, Cascades, Sancell, TemperPack
Quantitative Methodology
Primary survey, n=3,800 respondents, Q4 2025, six countries; demand-side model with trade association cross-validation
Qualitative Methodology
47 expert interviews, Q4 2025; applied to validate demand model assumptions, identify emerging dynamics, and assess competitive positioning
Report Format
PDF and XLSX data workbook (Word format preview document)
Publisher
Market Minds Advisory
Report Code
MMA-2026-PAC-119
Published
August 2026
Contact
sales@marketmindsadvisory.com | www.marketmindsadvisory.com

Purchase the full Protective Packaging Market Report (2026 to 2036).

The full report costs void space against dimensional weight carrier pricing rather than treating protective packaging as a materials purchase, and sizes each of the six system types independently through 2036. It quantifies fully loaded damage cost across retailer categories, benchmarks engineered paper structures against plastic systems on protection per gram, and models on-demand equipment payback against daily parcel volume thresholds. Regional chapters cover all seven regions with fulfilment geography and converting capacity detail wherever disclosure permits it. Competitive profiling covers 20 participants on a single consistent shipment value basis.
Each system type sized independently through 2036
Void space costed against dimensional weight carrier pricing
Fully loaded damage cost quantified by retailer category
Paper and plastic benchmarked on protection per gram
Twenty participants profiled on one consistent basis
Equipment payback modelled against parcel volume thresholds

Built For The People Who Decide

From boardroom strategy to bench-side execution, this report is read cover-to-cover by leaders shaping the next decade of their industry, turning demand scenarios, market dynamics and valuation benchmarks into decisions.
CXOs/ Presidents/ VPs/ Managers
M&A and Corporate Development
Strategy Teams and R&D Heads
Procurement and Product Directors
Regulatory and Compliance Leaders
Investor Relations and Equity Analysts