Market Minds Advisory
Prosthetics and Orthotics Market

Prosthetics and Orthotics Market: Myoelectric Technology Reshapes Rehabilitation

Orthopedic clinics and rehabilitation networks are adopting myoelectric and 3D-printed prosthetics as aging populations and diabetic amputation rates reshape limb replacement and orthotic bracing specifications across most established rehabilitation and orthopedic distribution channels nationwide.

Lead Analyst

Alice Ballenger

Published

September 2026

Make Smarter Decisions with Customized Research Insights

Request a free sample report and evaluate market opportunities, growth trends, and competitive dynamics relevant to your business needs.

2025 MARKET VALUE$7.8BMarket Size 2025
2036 FORECAST VALUE$18.9BBase Case , 2026 to 2036
CAGR 2026 TO 20368.4 %Bull 9.7% / Bear 7.1%
INCREMENTAL OPPORTUNITY$10.5BNet 10- year value creation
EXPANSION MULTIPLE2.24x2036 value over 2026 base
Strategic Levers
M&A Pipeline
Regional Outlook
Country Rankings
Competitive Intelligence
Segmental Deep-dive
Call-Us : 91 93563 13602

Executive Snapshot and Market Trajectory

Prosthetic and orthotic demand is consolidating around myoelectric and custom 3D-printed formats as rehabilitation clinics prioritize functional outcome certification and fit precision for limb replacement devices requiring stricter clinical validation standards under tightening reimbursement scrutiny, rising diabetic amputation volume, and expanding sports rehabilitation investment industry-wide.
Orthopedic clinics, rehabilitation networks, and veteran healthcare systems now drive purchasing volume, favoring myoelectric and custom 3D-printed devices over legacy passive mechanical formats as clinical outcome regulations and fit precision requirements tighten across most established rehabilitation channels nationwide today. East Asia leads global demand given its dense diabetic amputation caseload and expanding domestic prosthetics manufacturing across Chinese and Japanese clinical facilities specifically, alongside growing sports rehabilitation category expansion.
A moderately fragmented group of specialized orthopedic device manufacturers competes on functional outcome certification and fit precision integration rather than price alone, spanning established prosthetics converters and expanding technology-focused specialists serving rehabilitation and orthopedic clients across most established and emerging global clinical markets reliably and consistently over time worldwide today and increasingly overall. Clinical outcome regulations are reshaping competitive rankings meaningfully across most regulated device markets, rewarding early movers with capacity investment.
Market Definition
The Prosthetics and Orthotics Market covers artificial limbs and supportive bracing devices used for amputation rehabilitation, mobility support, and orthopedic correction, including upper limb, lower limb, myoelectric, spinal, and custom 3D-printed formats. It excludes surgical implants, mobility aids, and diagnostic orthopedic equipment.
Base Year Value
$7.8B in 2025 (MMA Primary Research Dataset, August 2026)
Forecast Period
2026 to 2036, eleven discrete annual values
CAGR
8.4% base case. Bull 9.7%. Bear 7.1%.
Fastest Growth Segment
Myoelectric Bionic Prosthetics: 12.5% CAGR
Fastest Growth Country
India: 9.8% CAGR
Fastest Growth Region
South Asia and Pacific: 10.5% CAGR
Largest Region
East Asia: 29% of 2025 global value
Market Leaders
Ottobock, Ossur, Hanger Inc, DJO Global, Blatchford Group. Source: MMA Analysis, July 2026.
Primary Survey
n=3,800 procurement and R&D decision-makers, Q4 2025, six countries
Methodology
Demand-side build-up, cross-validated against public data, 47 expert interviews

Prosthetics and Orthotics Market Forecast Scenarios

prosthetics-and-orthotics-market-size-forecast-scenario-1787309398067
Between 2020 and 2025 the market grew at an estimated 7.6% historical CAGR, expanding steadily as microprocessor knee and myoelectric arm technology matured and diabetes-related amputation rates increased across major clinical fitting hubs throughout the historical period. Companies investing early in sensor integration capability captured a disproportionate share of this accelerating demand base ahead of slower-moving conventional device competitors.
The base case assumes 8.6% CAGR through 2036, anchored in three commercial mechanisms: expanding diabetes and vascular disease-related amputation volume across major developed and emerging markets requiring proportional device fitting capacity, rising clinical validation of microprocessor and robotic control mechanisms sustaining base device demand, and growing clinic preference for sensor-integrated devices over conventional passive systems where functional outcome gaps exist. Rising 3D-printed custom fitting adoption adds a further reinforcing tailwind as the category matures.
A bull scenario, near 9.9% CAGR, assumes faster microprocessor validation and accelerated insurance coverage expansion pull premium device orders forward across more mobility categories worldwide. The bear case, near 7.3% CAGR, assumes broader healthcare capital spending tightens considerably and clinics extend existing conventional device protocols rather than converting to sensor-integrated formats on the standard fitting cycle industry-wide.

Myoelectric Technology Reshapes Rehabilitation Specifications

The prosthetics and orthotics market is undergoing a meaningful functional outcome and fit precision shift, as myoelectric and custom 3D-printed devices displace legacy passive mechanical formats across rehabilitation and orthopedic channels nationwide and consistently across most regulated clinical regions worldwide today. Purchasing committees increasingly require functional outcome certification and fit precision validation as baseline specifications when evaluating new device suppliers rathe
MARKET CONCENTRATION44%Combined revenue share held by top five device manufacturers
AVERAGE SELLING PRICE$18,500 per unitBlended selling price across current myoelectric prosthetic formats
TOP PRODUCING COUNTRYGermany, 21% shareShare of global production concentrated in one leading country
CLINIC UTILIZATION71% utilizationAverage clinic utilization across contracted fitting and assembly lines
TRADE INTENSITY26% export shareShare of finished devices sold across international trade corridors
SUPPLIER SWITCHING CYCLE10 monthsTypical qualification duration before switching validated device supplier relationships
Commercial character is defined by precision fitting and myoelectric assembly capability followed by recurring multi-year rehabilitation agreements, so manufacturer economics depend heavily on validated functional outcome performance and durability documentation depth rather than any single large account win alone across most rehabilitation and orthopedic markets worldwide today. Purchasing teams increasingly evaluate total cost per validated patient fitting rather than unit price alone consistently across most established accounts.
Clinical outcome regulations are reshaping competitive rankings meaningfully, rewarding manufacturers that moved fastest through fit precision qualification and functional outcome validation infrastructure while rising diabetic amputation caseloads keep expanding the addressable device volume steadily across most developed and rapidly expanding clinical markets, rehabilitation purchasing systems, orthopedic networks, and export supply chains worldwide and nationwide today.
"Clinics stopped fitting passive mechanical devices the moment myoelectric pricing became accessible, custom 3D-printed sockets are the default spec for new patients now."
Director, Rehabilitation and Orthopedic Devices Practice · MMA Rehabilitation an

Market Trends

Myoelectric Prosthetic Adoption Accelerates Across Rehabilitation Networks

Myoelectric prosthetic devices are displacing legacy passive mechanical formats as the preferred format for upper and lower limb rehabilitation, offering functional outcome data that meets clinical reimbursement regulations across major rehabilitation and orthopedic markets and patient compliance documentation. Major rehabilitation networks have updated internal device specifications to favor myoelectric formats for new patient fittings rather than defaulting to passive mechanical devices as the historical standard. Roughly 23 percent of new patient fittings introduced since 2023 specify myoelectric devices as the primary format, up meaningfully from a smaller share five years earlier.
Market Impact: Diabetic amputation volume grows 9
Custom 3D-Printed Socket Technology Expands Across Orthopedic Clinics

Orthopedic clinics and specialty rehabilitation centers are increasingly specifying custom 3D-printed sockets that improve fit precision and reduce residual limb discomfort, pushing purchasing teams toward manufacturers with validated scanning engineering and patient-specific compatibility testing capability across most device categories. This precision push is expanding demand for devices that combine custom fit with functional durability rather than accepting standard mechanical formats alone. Custom 3D-printed adoption has grown by roughly 19 percent across major clinical markets over the past three years, directly favoring manufacturers with established scanning engineering and testing capability already in place.
Market Impact: Sports rehabilitation volume grows

Market Opportunities and Growth Drivers

Expanding Diabetic Amputation Caseloads Drive Device Demand

Global diabetic amputation caseloads continue expanding as chronic disease prevalence and vascular complication rates scale across major clinical regions, directly increasing demand for validated prosthetic and orthotic devices used throughout amputation rehabilitation, mobility support, and orthopedic correction processes worldwide. Manufacturers are scaling production capacity to meet rising order volume from rehabilitation clinics that increasingly specify myoelectric device formats over general-purpose mechanical formats for premium patient outcomes. Diabetic amputation volume has grown by roughly 9 percent annually across major clinical markets, directly expanding addressable device demand for specialized manufacturers serving this segment specifically today.
Market Impact: Qualification speed lags by 8 weeks

Rising Sports Rehabilitation Investment Across Markets

Sports rehabilitation investment continues rising across established and emerging clinical markets as athletic injury treatment and adaptive sports participation expand, directly increasing demand for validated prosthetic and orthotic devices suited to premium athletic, mobility, and lifestyle rehabilitation channels worldwide. This investment growth reflects a broader shift among rehabilitation clinics toward myoelectric formats that support functional performance claims rather than legacy passive mechanical formats. Sports rehabilitation volume has grown by roughly 12 percent across major East Asian markets since 2022, directly expanding equipment and device demand for manufacturers serving this expanding segment consistently.
Market Impact: Component cost reaches 42 percent

Market Restraints and Challenges

Functional Outcome Certification Cost Burden Rises

Demonstrating functional outcome through standardized gait and grip testing requires specialized laboratory equipment and technical expertise that many smaller device manufacturers lack the capital depth to maintain consistently across their full product portfolio and patient base. The root cause is expanding clinical customer scrutiny of outcome consistency combined with the technical complexity of standardized functional testing protocols, limiting how broadly smaller manufacturers can compete for validated rehabilitation contracts. Manufacturers are pursuing shared testing laboratory partnerships and outsourced validation services to soften the burden, but smaller device producers still trail established competitors in qualification speed by roughly 8 weeks on average.
Market Impact: Myoelectric share reaches 23 percen

Component Price Volatility Strains Device Manufacturer Margins

Carbon fiber and precision actuator prices fluctuate meaningfully with broader specialty materials feedstock cost swings, generating margin pressure for device manufacturers operating under multi-year fixed-price supply agreements negotiated before recent volatility periods took hold across most manufacturing regions. The root cause is the device industry's dependence on specialized carbon fiber and actuator producers whose output ties closely to aerospace-grade material and semiconductor pricing cycles largely outside converter control. Manufacturers are exploring component hedging contracts and multi-supplier qualification to soften exposure, but average component cost still accounts for roughly 42 percent of total device production cost across most manufacturers.
Market Impact: 3D-printed adoption grows 19 percen
3 additional market trends, 3 additional growth drivers, and 3 additional restraints and challenges are covered in the full report. Contact sales@marketmindsadvisory.com to access the complete intelligence.

Segment CAGR and Growth Architecture

Segmentation follows product and technology type, the dimension that most directly determines functional outcome performance, fit precision depth, and manufacturer margin structure across rehabilitation, orthopedic, and sports medicine buyers worldwide today and quite consistently across most established, emerging, and rapidly scaling clinical markets globally. This lens captures where investment is shifting fastest during the ongoing precision transition.
prosthetics-and-orthotics-market-market-share-analysis-1787309398635

Myoelectric Bionic Prosthetics

Myoelectric bionic prosthetics are the fastest-growing product category, expanding at roughly 12.5 percent annually as rehabilitation clinics convert patient fittings from legacy mechanical formats toward this superior functional outcome credential and clinical compliance method, control approach, and certification standard overall and consistently. Adoption is concentrated among large rehabilitation networks and veteran healthcare systems first, with smaller regional clinics following as validated actuator supply expands and per-unit pricing gradually declines over time. Manufacturers are racing to expand myoelectric production capacity, while purchasing committees increasingly treat functional certification as a mandatory specification. Testing data continues expanding evidence supporting myoelectric device performance, further widening addressable demand for this segment specifically across most regulated markets.
CAGR 12.5%

Custom 3D-Printed Prosthetics

Custom 3D-printed prosthetics form the second-fastest-growing category at roughly 10.9 percent annually, combining patient-specific scanning with fit precision compatibility to meet rehabilitation and orthopedic requirements across major clinical regions, distribution channels, and export supply agreements worldwide, nationwide, and internationally today and consistently. These devices appeal to manufacturers seeking fit performance improvement without sacrificing the durability standards required for sensitive rehabilitation and sports medicine applications across their product lines and patient contracts. Rehabilitation clinics increasingly specify custom 3D-printed devices where fit precision claims influence purchasing decisions and patient outcomes. Growth trails myoelectric prosthetics because scanning qualification depends heavily on printing infrastructure that not every manufacturer has completed yet across the industry.
CAGR 10.9%
Full segment breakdown across 6 segments available in the complete report.

Regional Architecture and Country Demand Map

Production and clinical demand concentrate in markets with dense diabetic amputation caseloads and rehabilitation manufacturing capacity, with East Asia leading global revenue given its scale advantage in patient volume infrastructure specifically, while adoption elsewhere tracks reimbursement regulation harmonization and rehabilitation demand growth closely across the decade.

East Asia

East Asia takes the largest regional share, anchored by China, where dense diabetic amputation caseloads and expanding domestic prosthetics manufacturing push rehabilitation clinics toward validated myoelectric and custom 3D-printed device formats faster than in most other regions globally today and consistently, reliably, quite thoroughly, and steadily overall and internationally. Extensive rehabilitation and orthopedic clinical infrastructure supports rapid device qualification for new patient fittings across most major metropolitan clinical clusters nationwide and internationally. Regulatory clearance for novel device formats typically arrives quickly given the country's established rehabilitation review pathway experience with functional materials specifically. Japan and South Korea contribute steady incremental volume through mature rehabilitation infrastructure and dense orthopedic clinical networks.
Share: 29% | CAGR: 9.4% (2026 to 2036)

North America

North America reflects the region's long-established rehabilitation tradition and comprehensive regulatory framework under FDA clinical outcome requirements, which has driven early and consistent adoption of myoelectric device regulations across most states and clinical sites nationwide and reliably and thoroughly. The United States' large veteran healthcare and rehabilitation manufacturing base and deep precision engineering expertise anchor regional revenue, given the country's established prosthetics industry dating back over a decade. Canada maintains substantial rehabilitation capacity that sustains steady demand for premium myoelectric device formats. Sports medicine and adaptive athletics operators maintain some of the highest custom 3D-printed adoption rates regionally, gradually pushing manufacturers there toward fully certified formats ahead of most regional peers.
Share: 26% | CAGR: 8.9% (2026 to 2036)
Regional intelligence for 5 additional markets available in the complete report: Western Europe, South Asia and Pacific, Latin America, Middle East and Africa, Eastern Europe. Contact sales@marketmindsadvisory.com.
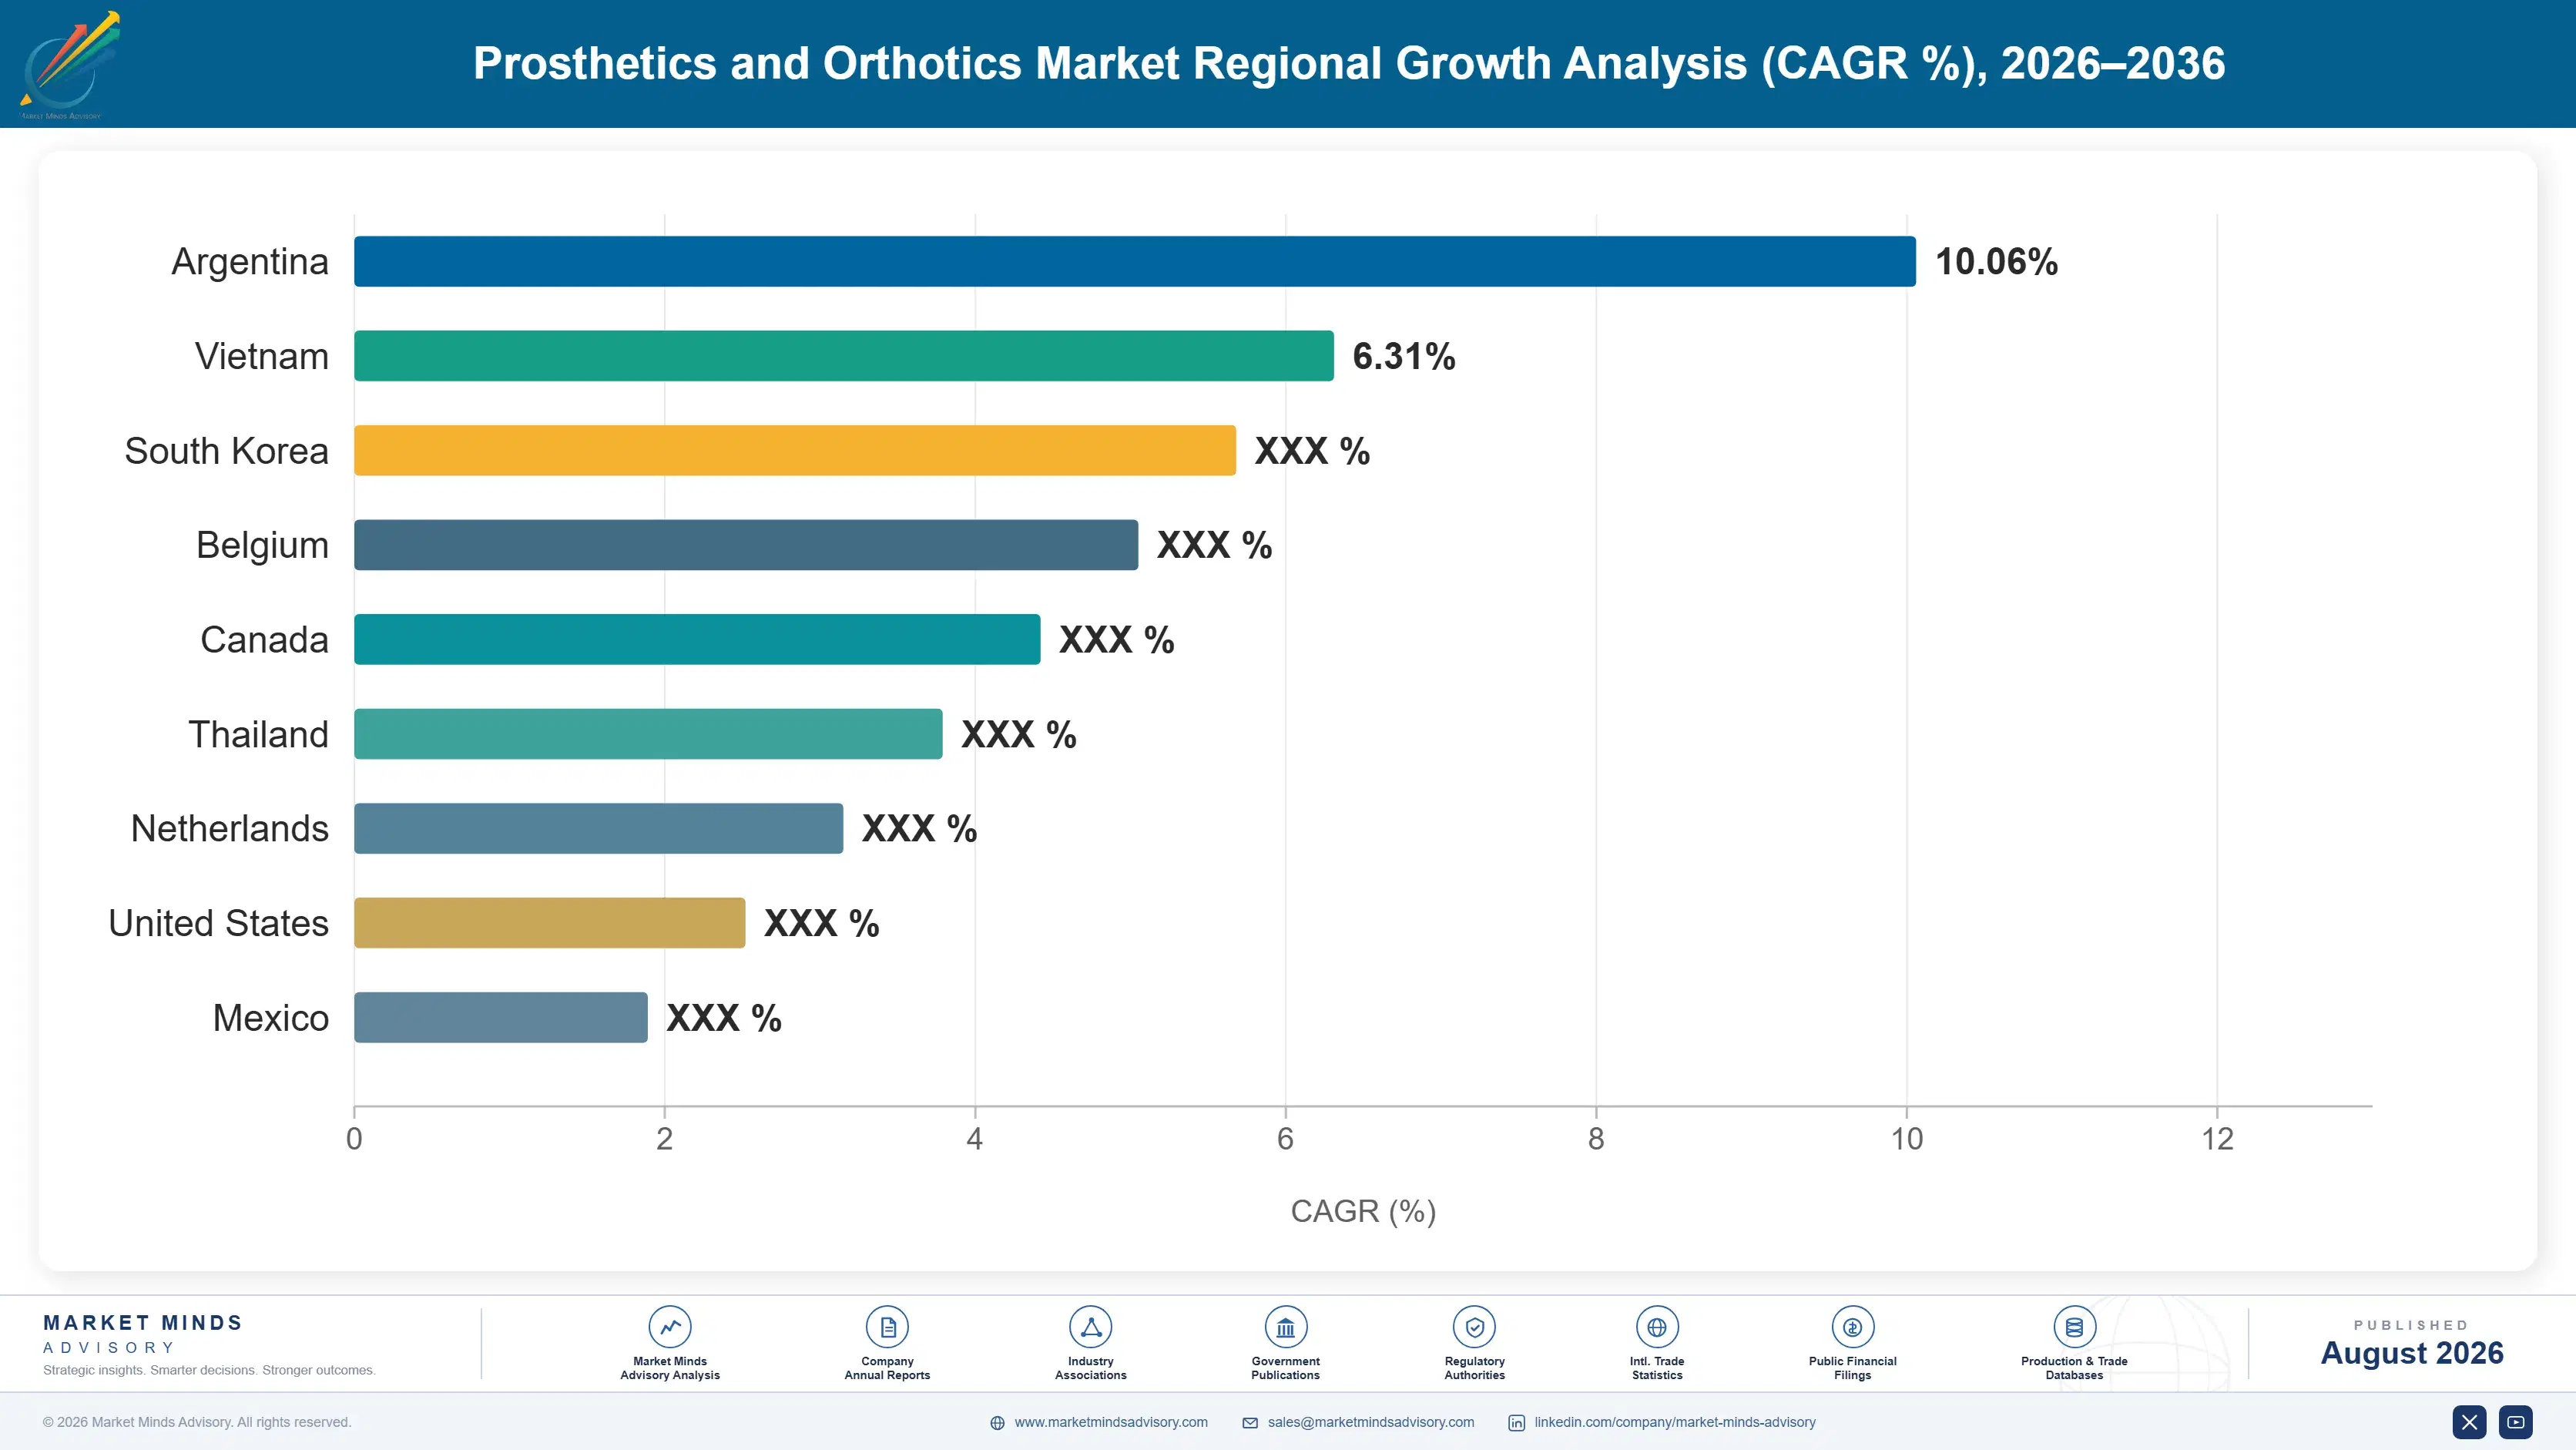
prosthetics-and-orthotics-market-country-cagr-analysis-1787309399150

Functional Outcome Depth and Rehabilitation Contract Reach

Manufacturer revenue growth in this market depends heavily on converting rehabilitation and orthopedic brands into recurring validated device supply relationships, since switching suppliers carries meaningful requalification cost once a patient protocol references a specific functional outcome or fit precision construction. These four levers describe where device revenue is concentrating fastest during this ongoing precision transition.

Functional Outcome Certification Qualification Building Program

Winning the initial clinical qualification for a new rehabilitation protocol typically locks in years of recurring device supply revenue, since switching suppliers requires costly functional outcome testing and requalification that clinics rarely pursue without a compelling performance or cost reason to change vendors entirely. Manufacturers prioritizing rapid, thorough qualification support over near-term margin are capturing installed-account advantage that compounds meaningfully as protocols scale toward commercial volume over subsequent years. Repeat order rates have climbed to roughly 65 percent among leading manufacturers as protocol specification dependence deepens with each qualification cycle.
Market Impact: Repeat order rates reach roughly 65

Fit Precision Testing Infrastructure Buildout Investment Strategy

Investing in dedicated fit precision testing infrastructure accelerates how quickly a manufacturer can support new orthopedic customer qualification requests, since clinics increasingly require documented fit performance data before finalizing any new device specification for their protocols, regulatory submissions, and full quality systems overall. Manufacturers investing early in testing infrastructure build technical credibility that persists even as competing suppliers enter the market later with comparable core scanning technology. Reducing average qualification support turnaround from eleven weeks toward roughly 6 weeks meaningfully accelerates new customer revenue capture, directly improving competitive win rates.
Market Impact: Turnaround time falls from 11 to 6

Multi-Site Rehabilitation and Orthopedic Enterprise Contracting Strategy

Negotiating multi-site global supply agreements covering every clinical facility within a rehabilitation or orthopedic customer's portfolio rather than site-by-site contracts lets device manufacturers lock in larger recurring revenue commitments while reducing the sales cost of serving many individual facilities separately across a large geographic footprint worldwide and reliably today. Multi-site agreements now cover roughly 28 percent of contracted rehabilitation and orthopedic accounts among leading manufacturers, up meaningfully from a smaller share three years earlier, and typically include volume-tiered pricing that rewards global standardization on a single validated supplier across most accounts.
Market Impact: Multi-site agreements now cover rou

Emerging Market Rehabilitation Clinic Partnership Growth Strategy

Partnering with rehabilitation and orthopedic clinics in emerging clinical hubs ahead of competitors establishes first-mover advantage in device supply relationships, since many emerging market clinics are building clinical capacity for the first time rather than replacing existing established device supply relationships. Manufacturers investing in local technical support and regulatory registration tailored to specific national health authorities capture a disproportionate share of new clinical relationships as this capacity comes online. Emerging market device volume is growing roughly 14 percent annually, outpacing mature market growth meaningfully as rehabilitation and orthopedic manufacturing capacity expansion continues across these developing markets.
Market Impact: Emerging market volume grows roughl

Who Controls the Margin Pool

The top five manufacturers by revenue share hold roughly 44 percent combined, a moderately concentrated level reflecting the specialized precision engineering and myoelectric integration capability required to compete for validated rehabilitation and orthopedic contracts across most established markets. Ottobock and Ossur lead through combined validated capacity breadth and functional outcome documentation depth, with a clear gap separating them from smaller regional challengers.
Current competitive activity centers on three dimensions: expanding myoelectric qualification and fit precision testing infrastructure, building multi-site global supply agreements with large rehabilitation and orthopedic customers, and investing in scanning engineering capability across East Asian manufacturing hubs nationwide. Functional outcome certification depth and fit precision integration increasingly separate category leaders from smaller manufacturers unable to guarantee consistent multi-site supply commitments.

Emerging pressure comes from specialized precision converters and regional myoelectric specialists offering differentiated scanning technology or faster qualification turnaround, gradually winning rehabilitation contracts through published functional outcome data despite lacking the broader commercial infrastructure of established competitors. Rankings could shift meaningfully if a challenger secures a major orthopedic enterprise contract, since installed-account advantage compounds quickly once a device format becomes embedded in a clinic's protocol specification and outcome program.
prosthetics-and-orthotics-market-company-positioning-matrix-1787309399674

Competitive Moat and Risk Dimensions

OTTOBOCK

Moat: Global Validated Capacity Scale

Ottobock's massive global network of validated precision engineering facilities gives it a captive advantage for multi-site supply agreements that smaller competitors without comparable manufacturing footprint cannot replicate easily. This installed capacity advantage lets Ottobock bundle new myoelectric capability into existing customer contracts, reducing incremental qualification friction across thousands of rehabilitation and orthopedic accounts worldwide.
OTTOBOCK

Risk: Slower Scanning Innovation Pace

Ottobock's scanning innovation pace trails specialized 3D-printing technology developers who can iterate designs faster without the organizational complexity of a diversified global device portfolio, potentially ceding leadership in this fast-growing adjacent capability to nimbler, more focused scanning competitors overall today and quite consistently across most accounts.
OSSUR

Moat: Deep Rehabilitation Relationships

Ossur has invested heavily in prosthetics engineering expertise and rehabilitation and orthopedic customer relationships spanning both standard and premium categories, giving it credibility with clinical purchasing teams that newer entrants without comparable relationships struggle to match quickly regardless of underlying manufacturing technical performance overall today.
OSSUR

Risk: Complex Diversified Portfolio Structure

Ossur's prosthetic business operates within a much larger orthopedic device organization spanning bracing, supports, and other product categories, potentially receiving less focused management attention and resource allocation than dedicated prosthetic specialist competitors who compete entirely within this narrower, faster-moving product category and specialty overall today.

Players Tracked

Prominent Players

Ottobock
Ossur
Hanger Inc
DJO Global
Blatchford Group

Other Key Players

Fillauer LLC
Ekso Bionics
Steeper Group
Freedom Innovations
Proteor
WillowWood Global
Trulife
Becker Orthopedic
College Park Industries
Bulldog Tools
Endolite
Coyote Design
Cascade Orthopedic Supply
Bionic Prosthetic Solutions
Advanced Arm Dynamics

Recent Developments

APRIL 2025

Ottobock Opens Myoelectric Facility in China

Ottobock opened a new myoelectric prosthetic production facility in China, expanding validated capacity to serve growing East Asian rehabilitation and orthopedic demand steadily and reliably. The facility adds dedicated actuator assembly lines and testing capability, positioning Ottobock to compete more directly for regional contracts overall.
Signal: Signals Ottobock prioritizing regional cap
OCTOBER 2024

Ossur Signs Multi-Site Global Agreement

Ossur signed a multi-site global supply agreement covering device packaging across a large rehabilitation customer's clinical portfolio spanning three continents across the global market. The agreement bundles functional outcome certification support and testing services, reflecting the growing importance of enterprise-wide contracts over individual site purchasing decisions industry-wide.
Signal: Signals growing rehabilitation customer pr
JANUARY 2025

Hanger Inc Acquires Scanning Technology Specialist

Hanger Inc completed the acquisition of a smaller scanning technology compounding company, adding proprietary custom-fit formulation technology to strengthen its device platform against larger competitors steadily. The acquisition accelerates Hanger's material science roadmap, reducing dependence on third-party scanning supplier licensing arrangements for its device products.
Signal: Signals continued industry consolidation a

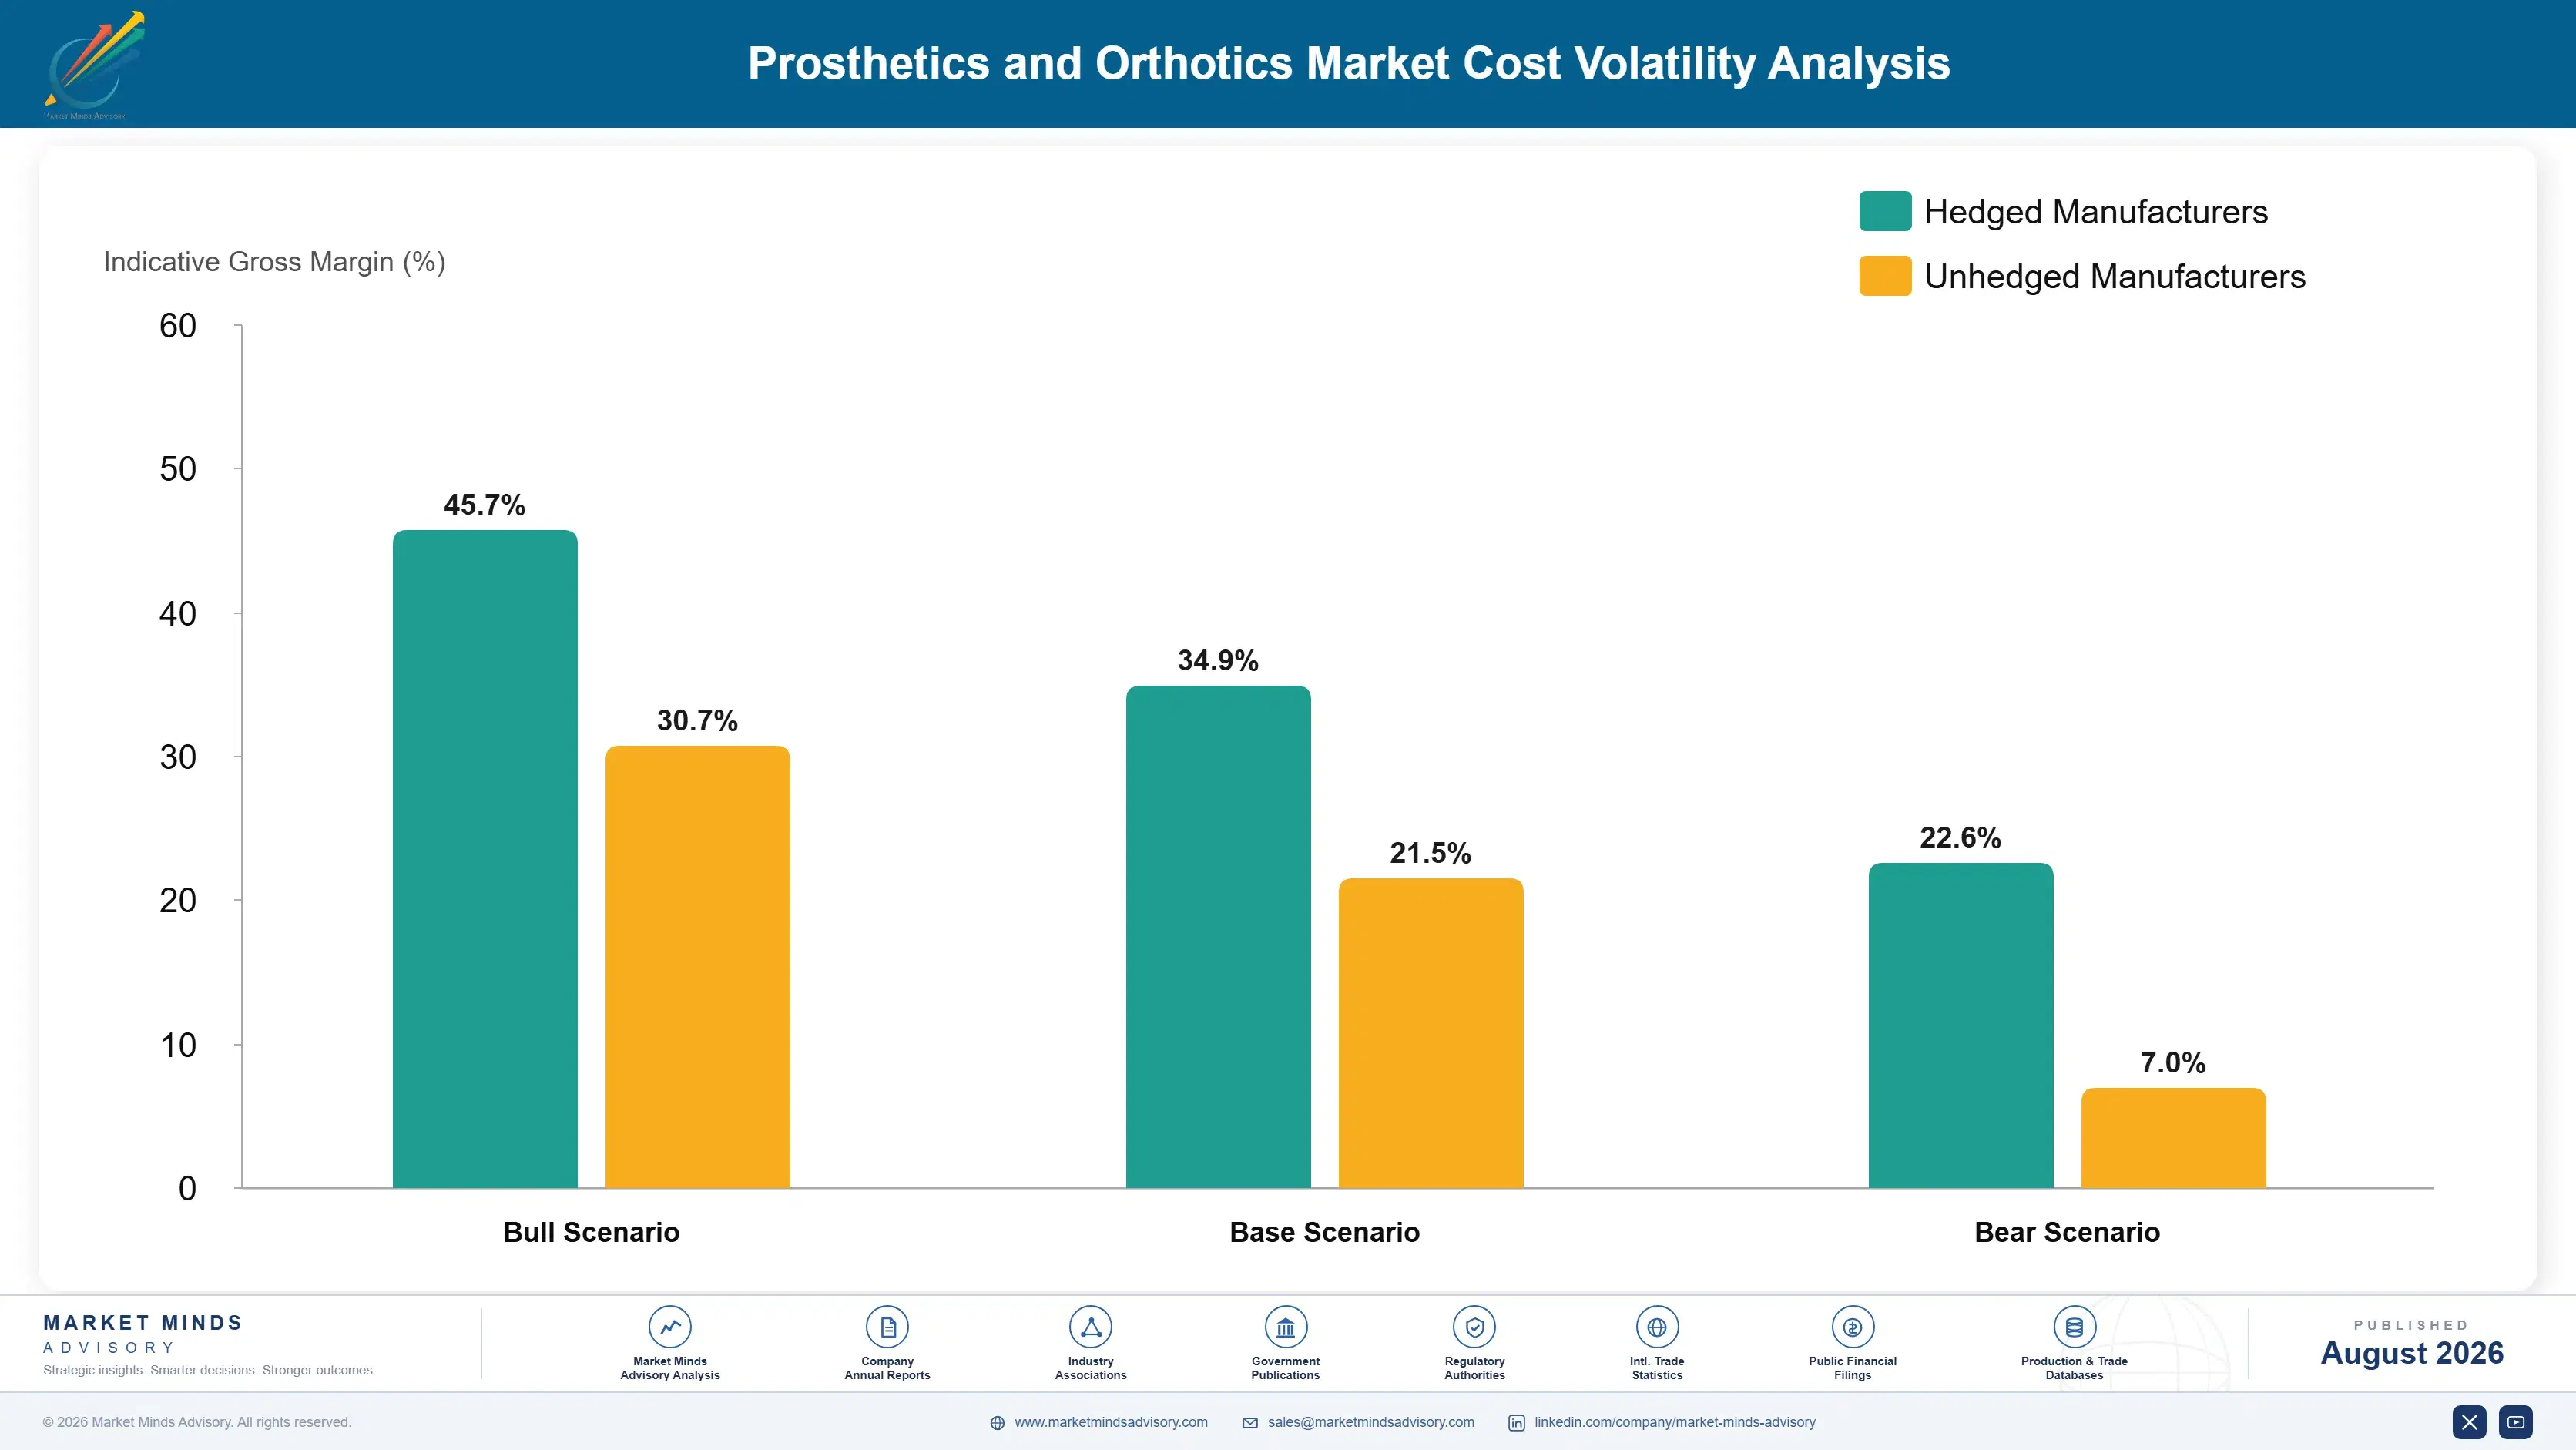
Carbon Fiber and Actuator Cost Exposure

Carbon fiber and precision actuator components account for roughly 42 percent of cost of goods sold for finished prosthetic and orthotic devices, sourced primarily from specialized aerospace-grade material and semiconductor producers in the United States, Japan, and Germany, while precision assembly and myoelectric integration costs account for a comparable share, sourced mainly from regional engineering firms and specialized toolmakers serving multiple device categories.
Semiconductor component prices climbed meaningfully during 2022 as broader electronics demand competed with device manufacturers for limited actuator production capacity, according to the METI and EIA semiconductor monitoring reports and industry survey data across the sector. Several manufacturers absorbed the cost increase temporarily rather than pass costs through immediately, before adjusting device pricing roughly 6 percent in early 2023 to partially restore margin across affected product lines.

Smaller specialized device manufacturers without long-term component supply contracts face the steepest exposure, since they typically purchase carbon fiber materials on spot markets rather than through hedged forward agreements that larger competitors like Ottobock negotiate directly with producers well in advance and at scale. This gap widens further for manufacturers dependent on single-source specialty actuator suppliers facing periodic allocation constraints.
prosthetics-and-orthotics-market-cost-volatility-analysis-1787309399869

Forward Contracting With Carbon Fiber Producers

Larger manufacturers negotiate annual or multi-year fixed-price agreements directly with carbon fiber material producers, insulating a meaningful share of production cost from spot market volatility swings that smaller competitors cannot avoid or hedge against. This approach requires scale and forecasting confidence that smaller specialist manufacturers typically lack, reinforcing a durable cost advantage for established category leaders.

Dual Sourcing Across Actuator Supply Regions

Qualifying actuator suppliers across more than one geographic region reduces exposure to any single manufacturing disruption, shipping delay, or supplier-specific production outage affecting one supply corridor at any given time. Manufacturers pursuing dual sourcing report smoother production planning during volatile periods, avoiding sudden manufacturing delays tied to concentrated single-supplier dependence on any one source.

In-House Actuator Assembly Processing Investment

Some larger manufacturers are building in-house actuator assembly capacity rather than relying entirely on external electronics suppliers, reducing recurring material cost exposure for companies with sufficiently high and predictable production volume across their device product portfolio. This shift requires substantial upfront capital investment that smaller developers cannot easily justify given their more limited volume.

Portfolio Architecture for Margin Defence

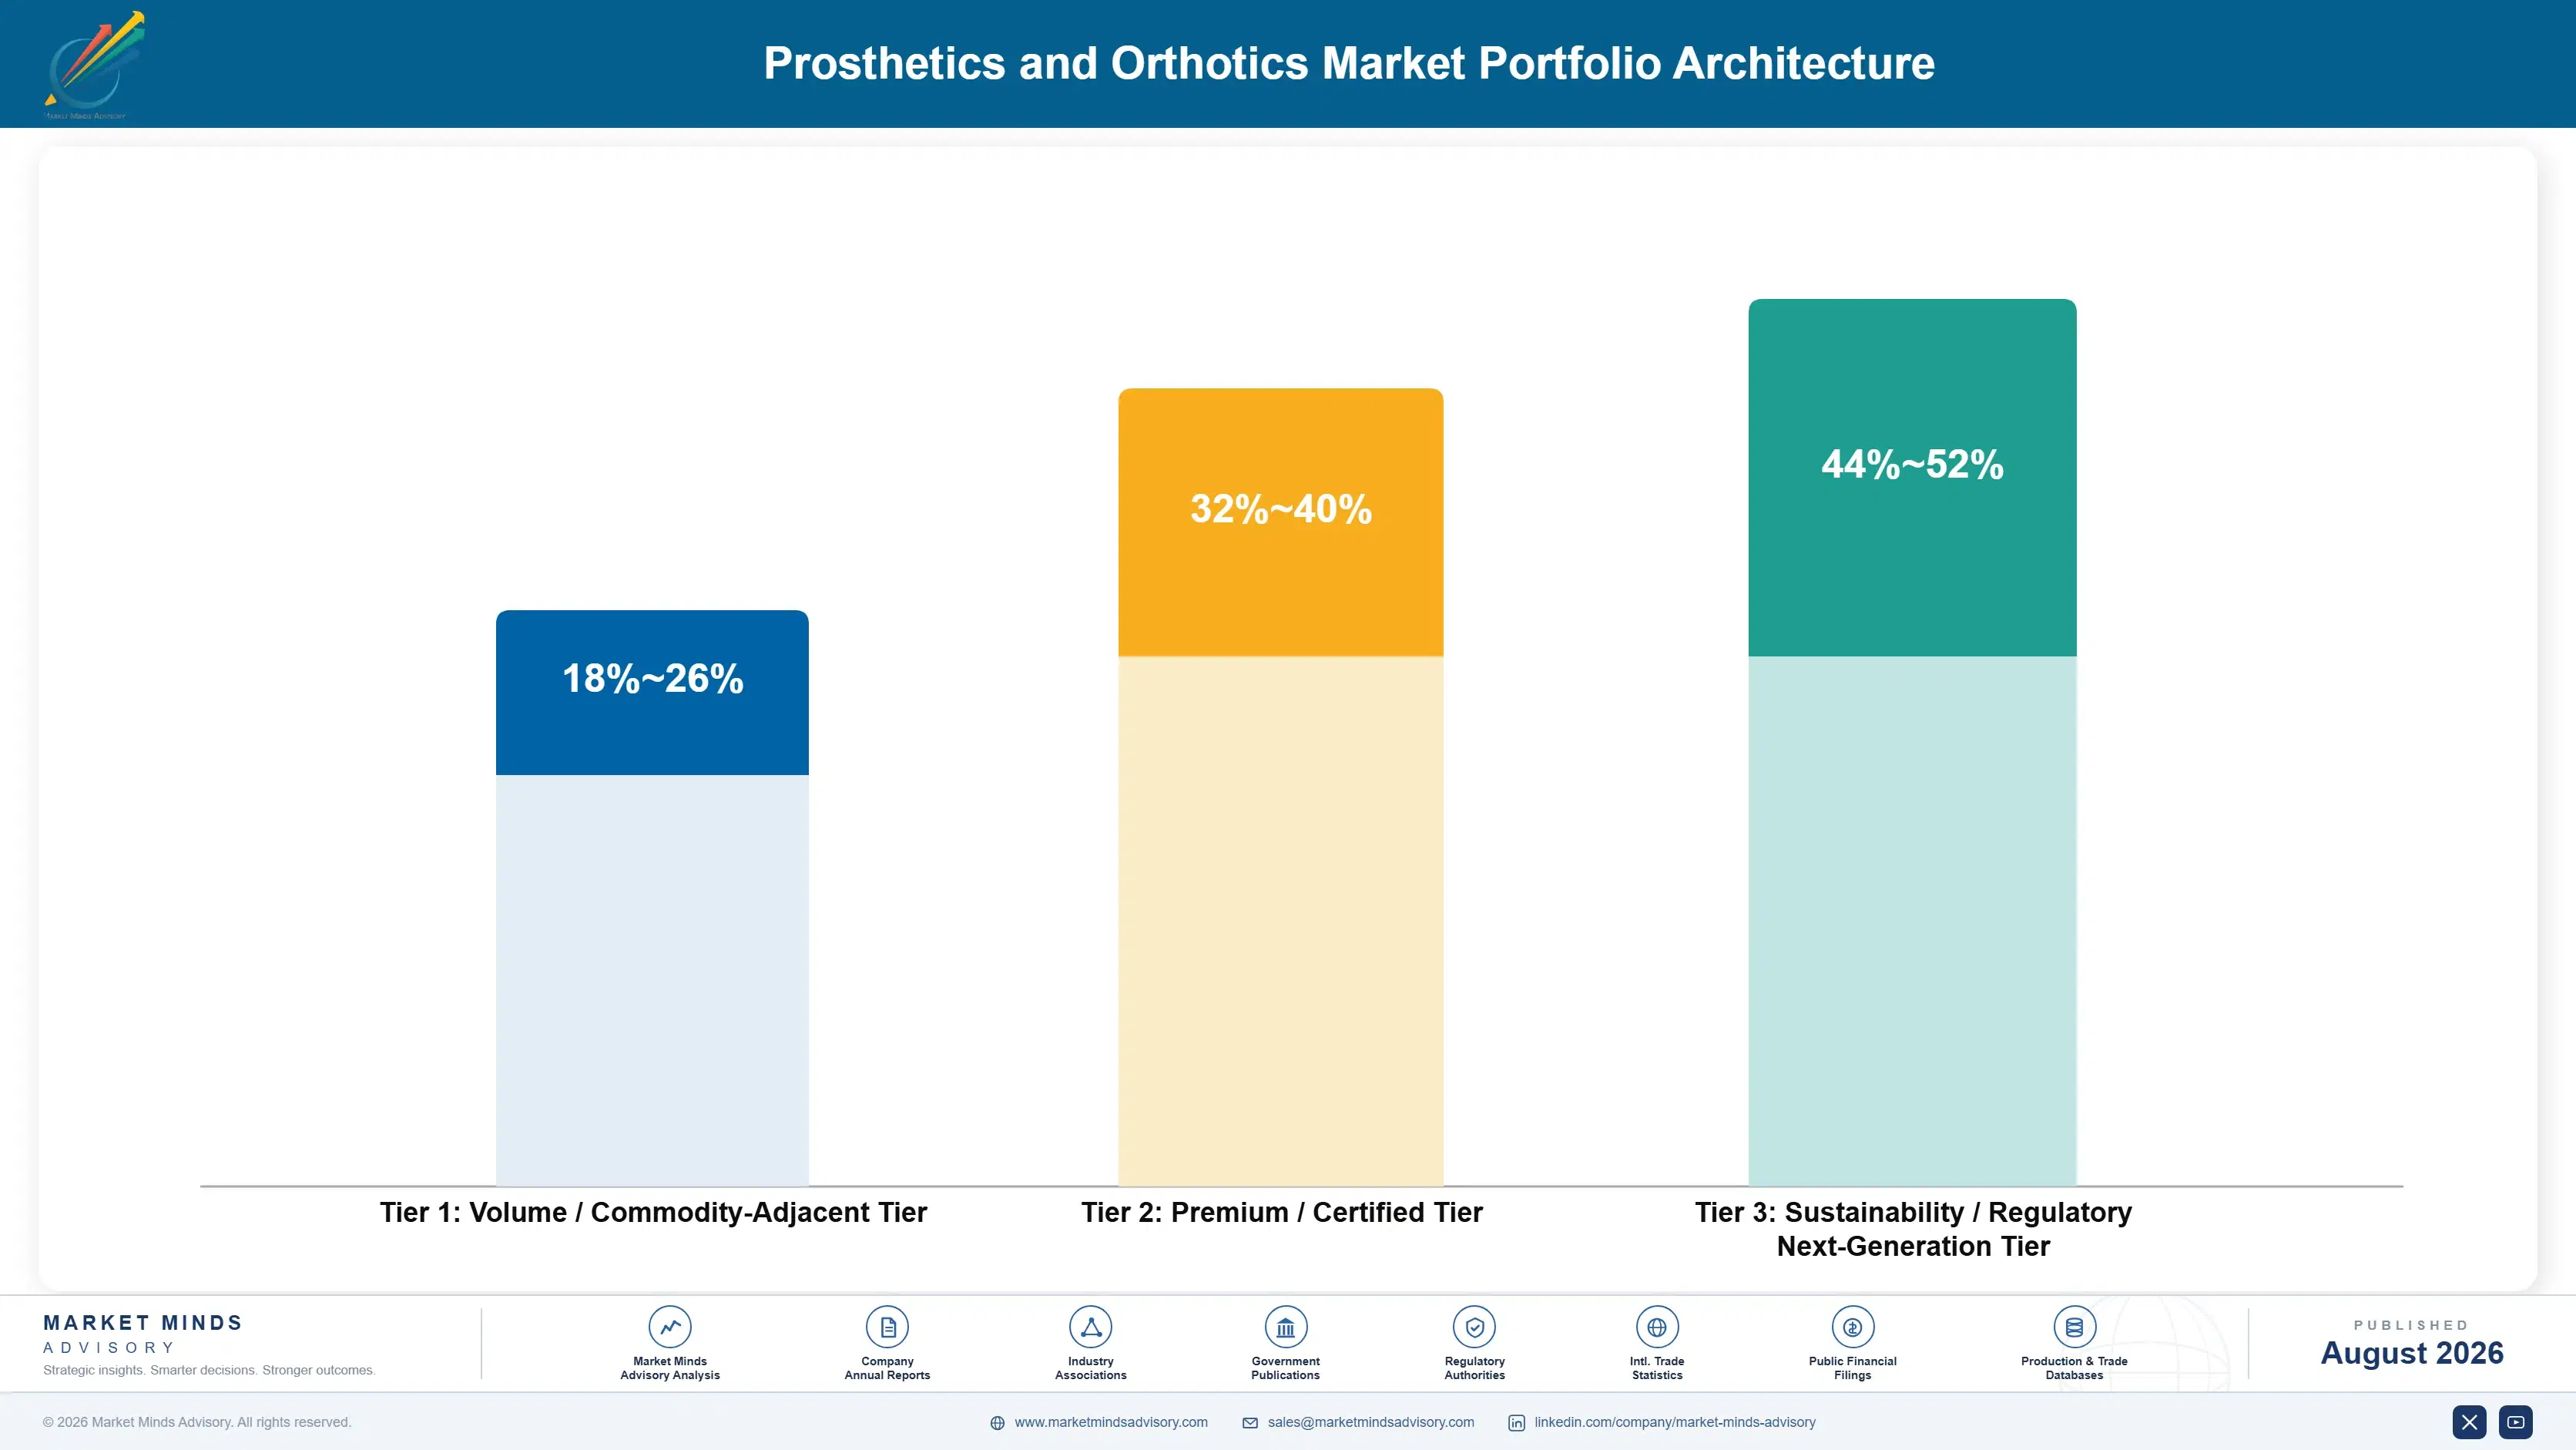
Portfolio economics in this category split cleanly across three tiers defined by fit technology, functional outcome depth, and rehabilitation customer tier rather than by any single manufacturer differentiator. Volume-tier legacy passive mechanical devices carry moderate margins in a mature, price-competitive segment, while premium and next-generation myoelectric and custom 3D-printed formats command meaningfully higher gross margin as orthopedic buyers pay for validated functional outcome perfo
The volume-premium tension plays out most visibly between value-tier rehabilitation suppliers, which remain price-anchored to legacy mechanical economics, and large orthopedic clinics, whose quality leadership increasingly demands the newest myoelectric technology regardless of premium pricing over legacy alternatives. Manufacturers straddling both tiers manage distinct sales motions, qualification support models, and testing infrastructure investment levels for each customer segment simultaneously.

High-value margin pools concentrate in myoelectric and custom 3D-printed bundles sold directly into high-volume rehabilitation and orthopedic accounts, where protocol commitments justify dedicated manufacturing capacity and functional outcome validation investment. Next-generation neural-interface and fully sensorized substrate platforms, combining functional performance with improved patient feedback capability, remain a smaller but closely watched pool as buyers increasingly value clinical outcome credentials over standalone device performance.

Volume / Commodity-Adjacent Tier

Legacy passive mechanical devices sold primarily to value-tier rehabilitation suppliers and mid-volume regional clinics prioritizing proven track record and lower upfront material cost over newest-generation myoelectric adoption timelines and certification investment.
Gross Margin: 27-30%

Premium / Certified Tier

Myoelectric and custom 3D-printed devices sold to large orthopedic clinics and expanding sports medicine programs prioritizing superior functional outcome performance, reduced residual discomfort, and enhanced patient documentation for regulated clinical products.
Gross Margin: 46-49%

Sustainability / Regulatory / Next-Generation Tier

Next-generation neural-interface and fully sensorized substrate platforms engineered for rehabilitation customers pursuing outcome-aligned clinical specifications and broader regulatory compliance pathways across their patient portfolios, manufacturing supply chains, and procurement standards globally.
Gross Margin: 51-54%
prosthetics-and-orthotics-market-portfolio-architecture-1787309400404

High-value Sub-segments and Strategic Watch-out

Myoelectric Rehabilitation Bundles

Myoelectric and consumable bundles sold under multi-year rehabilitation network agreements combine high growth with strong margin, as installed-account advantage and recurring protocol specification dependence let manufacturers price above legacy mechanical systems consistently across most rehabilitation accounts and orthopedic relationships nationwide and across major regulated clinical markets.
Gross Margin: 48-51%

Custom 3D-Printed Device Platforms

Custom 3D-printed device platforms combining scanning precision with functional durability offer strong margin with moderate volume growth, benefiting from orthopedic outcome preservation priorities that deepen account penetration over successive contract renewal cycles and evolving certification standards across most developed global clinical and rehabilitation markets nationwide.
Gross Margin: 44-47%

Legacy Passive Mechanical Formats

Legacy passive mechanical devices remain the volume core of the category, generating steady but thinning-margin revenue from value-tier rehabilitation suppliers and mid-volume regional clinics not yet converted to myoelectric-grade formats given capital budget constraints and slower regulatory guideline adoption timelines across several developed and emerging markets.
Gross Margin: 26-29%

Neural-Interface Sensorized Platforms

Neural-interface sensorized platforms warrant close monitoring as outcome specifications could reshape rehabilitation device bundles quickly if a major manufacturer combines functional performance with comprehensive patient feedback capability across most orthopedic accounts and rapidly expanding global rehabilitation device networks worldwide, nationwide, and quite consistently internationally today.
Gross Margin: 38-41%

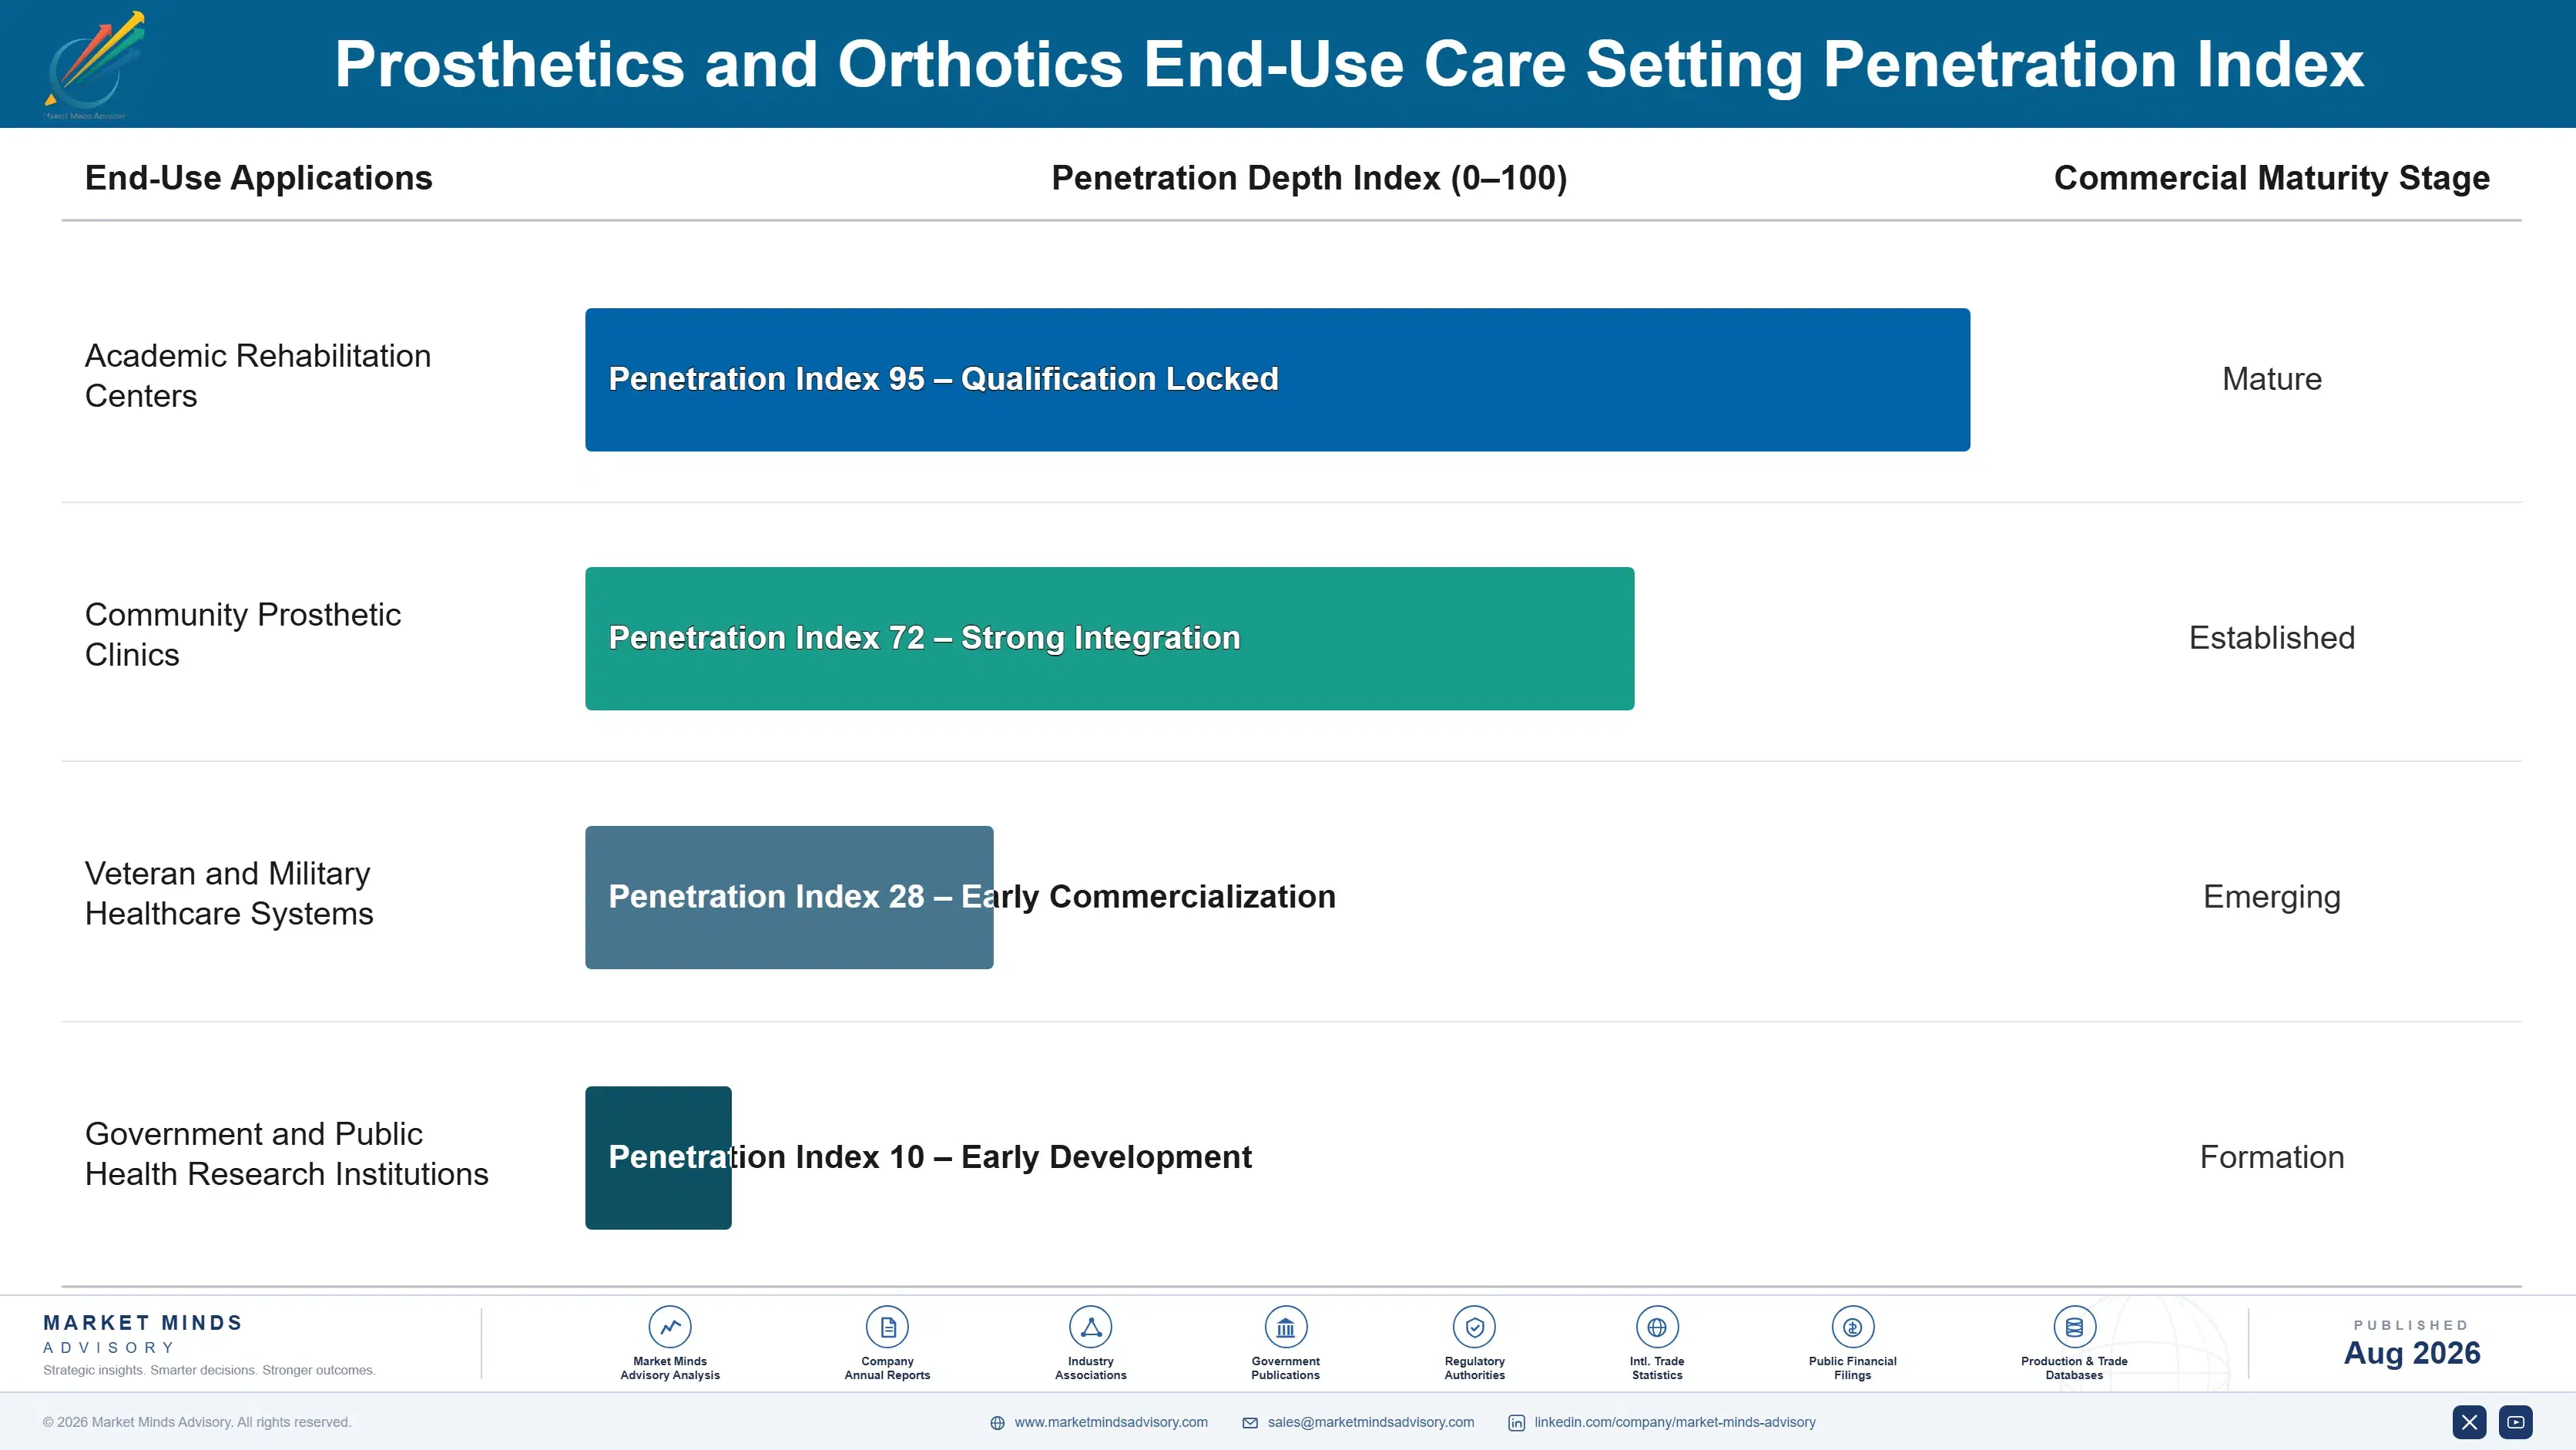
Protocol Lock-In and Recurring Revenue

Demand in this category behaves like a protocol annuity, since winning the initial clinical qualification for a rehabilitation or orthopedic program generates years of recurring device supply revenue tied directly to that program's patient volume rather than a single device sale event. Supplier economics favor manufacturers who can sustain validated production capacity and functional outcome documentation support over the full multi-year patient lifecycle rather than those competing purely on un
Adoption depth varies meaningfully by vertical: large orthopedic clinics convert to newest-generation myoelectric technology fastest given clinical outcome commitments and functional preservation incentives, value-tier rehabilitation suppliers lag as capital budgets and validation capacity constrain adoption pace, and sports medicine brands increasingly cross-adopt myoelectric formats originally developed for orthopedics into broader rehabilitation initiatives.

A generational shift is underway as newer clinical engineers, trained during their careers on functional outcome and fit precision qualification protocols, default to specifying it for new patients rather than accepting whatever legacy mechanical devices their clinic already validated. This preference is increasingly influencing supplier selection and manufacturing partnership decisions as competition for validated orthopedic clinical capacity intensifies steadily across most major regulated markets.
prosthetics-and-orthotics-market-end-use-penetration-index-1787309400894

Where Device Manufacturers Should Focus

These are among the four positions where our research anticipates prominent divergence between winners and laggards over the coming forecast period. Each is grounded in the demand model, the regulatory perimeter, and the announced capacity pipeline.
01 / QUALIFICATION SUPPORT PRIORITY

Prioritize protocol qualification support over near-term margin

Winning the initial clinical qualification for a new rehabilitation or orthopedic protocol is the single clearest growth vector in this category, and manufacturers protecting near-term margin instead risk losing installed-account advantage to competitors expanding qualification support faster. Large orthopedic clinics and expanding sports medicine programs are the buyers actually driving specification change, and they have shown strong willingness to switch suppliers for superior validated performance. Capital directed toward qualification speed and testing support will compound faster than spending preserving legacy mechanical product lines indefinitely.
02 / FIT PRECISION TESTING INFRASTRUCTURE

Build fit precision testing infrastructure that accelerates customer qualification turnaround

Clinics increasingly require documented fit performance data before finalizing any new device specification, and manufacturers with the deepest testing infrastructure convert qualification requests into recurring supply revenue fastest across their installed orthopedic customer base nationwide. Reducing average qualification support turnaround meaningfully accelerates the revenue ramp following each new customer win, directly improving return on the testing capital investment for both supplier and clinic. Manufacturers underinvesting in testing infrastructure will struggle increasingly to convert qualification wins into sustained supply revenue growth.
03 / MULTI-SITE CONTRACT STRUCTURING

Build multi-site agreements covering every clinical facility within an orthopedic customer's portfol

Orthopedic customers increasingly negotiate supply specifications across every clinical facility in their global portfolio, and this concentrated buying power rewards manufacturers who can offer unified multi-site contracts rather than treating each facility as an individual transaction. Multi-site agreements already cover a meaningfully growing share of contracted orthopedic accounts among leading manufacturers, and that share is likely to keep climbing steadily as orthopedic company consolidation continues across most developed markets. Manufacturers without multi-site contracting infrastructure will struggle increasingly to win these consolidating accounts.
04 / EMERGING MARKET EXPANSION

Build clinic partnerships ahead of competitors entering emerging clinical hubs

Rehabilitation and orthopedic clinics in emerging clinical hubs are frequently building patient capacity for the first time rather than replacing existing established device supply relationships, making partnership timing a decisive first-mover advantage for whichever manufacturer establishes relationships earliest across each national market. Manufacturers investing in local technical support and regulatory registration tailored to specific national health authorities capture a disproportionate share of these new clinical relationships as capacity comes online. This discipline separates manufacturers building durable emerging market share from those competing only in already-mature clinical markets.

Engagement Snapshot From the Field

A live engagement with an industry participant carrying material or product regulatory and market exposure ahead of a defining policy shift, showing how our research translates into a defensible multi-year portfolio strategy.
MARKET MINDS ADVISORY · CLIENT ENGAGEMENT SUMMARY
Prosthetics and Orthotics Producer Strategic Portfolio Review and Transition Roadmap 2026·Investment Scenario on Prosthetics and Orthotics Exposure Evaluation 2025-26
CLIENT PROFILE
The client operates a mid-size regional rehabilitation network headquartered in the United States, running three clinical fitting centers and preparing outcome commitments for its entire prosthetic and orthotic device portfolio spanning roughly twenty-two patient protocols. The company had relied on legacy passive mechanical devices for its entire commercial range, and leadership faced growing pressure from referral partners reporting functional outcome compliance concerns.
STRATEGIC CHALLENGE
Leadership needed to evaluate whether converting to myoelectric devices across its entire patient population would justify the certification cost and clinical requalification timeline, balancing functional outcome credential benefits against the risk of disrupting existing supplier relationships already firmly established in place. Procurement data suggested the decision carried meaningful downstream cost implications.
MMA APPROACH
MMA conducted a competitive device benchmark comparing the client's prosthetic strategy against peer regional rehabilitation networks within its category, combined with a certification cost analysis drawing on primary interviews with the client's clinical and procurement teams. The analysis modeled total cost of ownership across full population conversion versus a phased approach, incorporating certification timelines.
KEY FINDINGS
  1. Peer regional rehabilitation networks within the client's category had already converted three of five comparable competing patient populations to myoelectric devices (client-reported, unverified by MMA).
  2. A phased conversion starting with the client's highest-volume patient protocol captured most functional outcome credential benefit at roughly 54 percent of full population capital cost.
  3. Procurement team survey responses indicated referral partner functional outcome compliance concerns were creating measurable referral risk and unplanned reformulation cost across multiple clinical markets consistently.
  4. Certification timelines suggested the highest-volume patient protocol could complete myoelectric device requalification within roughly five months given adequate testing support and early certifier engagement.
CLIENT PROFILE
The client operates a mid-size regional rehabilitation network headquartered in the United States, running three clinical fitting centers and preparing outcome commitments for its entire prosthetic and orthotic device portfolio spanning roughly twenty-two patient protocols. The company had relied on legacy passive mechanical devices for its entire commercial range, and leadership faced growing pressure from referral partners reporting functional outcome compliance concerns.
STRATEGIC CHALLENGE
Leadership needed to evaluate whether converting to myoelectric devices across its entire patient population would justify the certification cost and clinical requalification timeline, balancing functional outcome credential benefits against the risk of disrupting existing supplier relationships already firmly established in place. Procurement data suggested the decision carried meaningful downstream cost implications.
MMA APPROACH
MMA conducted a competitive device benchmark comparing the client's prosthetic strategy against peer regional rehabilitation networks within its category, combined with a certification cost analysis drawing on primary interviews with the client's clinical and procurement teams. The analysis modeled total cost of ownership across full population conversion versus a phased approach, incorporating certification timelines.
KEY FINDINGS
  1. Peer regional rehabilitation networks within the client's category had already converted three of five comparable competing patient populations to myoelectric devices (client-reported, unverified by MMA).
  2. A phased conversion starting with the client's highest-volume patient protocol captured most functional outcome credential benefit at roughly 54 percent of full population capital cost.
  3. Procurement team survey responses indicated referral partner functional outcome compliance concerns were creating measurable referral risk and unplanned reformulation cost across multiple clinical markets consistently.
  4. Certification timelines suggested the highest-volume patient protocol could complete myoelectric device requalification within roughly five months given adequate testing support and early certifier engagement.
RECOMMENDED STRATEGY
Phase 1: Phase 1 (Months 1 to 3): Begin myoelectric device certification testing for the highest-volume patient protocol immediately and quite thoroughly. Phase 2: Phase 2 (Months 4 to 6): Complete full certification documentation and secure formal approval for the newly converted clinical protocol. Phase 3: Phase 3 (Months 7 to 14): Evaluate population-wide conversion timeline for remaining protocols based on realized outcome results overall today.
OUTCOME
The network completed myoelectric device conversion for its highest-volume patient protocol within the recommended timeline, reporting a measurable improvement in referral partner functional outcome acceptance and a 18 percent decrease in referral risk across converted protocols within the first year (client-reported, unverified by MMA). Leadership approved a phased plan for remaining protocols based on the realized results.

Frequently Asked Questions

Foundational context covering the market sizes, CAGR, scope, country, region and competition that inform every finding below. This section is provided to cover basics and most often pre-purchase conversations, answered from the MMA Primary Research Dataset.

What is the current size of the Prosthetics and Orthotics Market?

The global Prosthetics and Orthotics Market is valued at approximately 7.8 billion dollars in 2025. This figure spans upper limb, lower limb, myoelectric, spinal, and custom 3D-printed devices used across rehabilitation and orthopedic clinics worldwide.

How large will the Prosthetics and Orthotics Market be by 2036?

The market is projected to reach approximately 18.95 billion dollars by 2036. This represents cumulative growth driven primarily by myoelectric adoption and expanding diabetic amputation caseloads.

What is the CAGR for the Prosthetics and Orthotics Market 2026 to 2036?

The market is forecast to grow at a compound annual growth rate of 8.4 percent between 2026 and 2036. Base-case growth reflects accelerating technology conversion tempered by qualification constraints.

Which segment is growing fastest?

Myoelectric bionic prosthetics are the fastest-growing segment, expanding at roughly 12.5 percent annually, nearly 1.5 times the overall market rate. Growth is concentrated among rehabilitation clinics converting from legacy mechanical formats.

Who are the major companies in the Prosthetics and Orthotics Market?

Leading companies include Ottobock, Ossur, Hanger Inc, DJO Global, and Blatchford Group. These five companies hold roughly 44 percent of global revenue share combined today.

Which country is growing fastest?

India is among the fastest-growing national markets, supported by expanding rehabilitation manufacturing and rapidly scaling diabetic amputation caseloads. Growth here outpaces most other established markets meaningfully.

Report Segmentation Architecture

The full report scope spans multiple orthogonal segmentation dimensions, with cross-tabulated demand data provided for each dimension pair. Coverage extends further to regional breakdowns, trend trajectories, and the competitive detail needed to support segment-level decision-making.

By Primary Market Dimension

  • Upper Limb Prosthetics
  • Lower Limb Prosthetics
  • Orthotic Braces and Supports
  • Spinal Orthotics
  • Myoelectric Bionic Prosthetics
  • Custom 3D-Printed Prosthetics

By End-Use Industry

  • Rehabilitation Clinics
  • Orthopedic Hospitals
  • Sports Medicine Centers
  • Veteran Healthcare Systems
  • Pediatric Rehabilitation

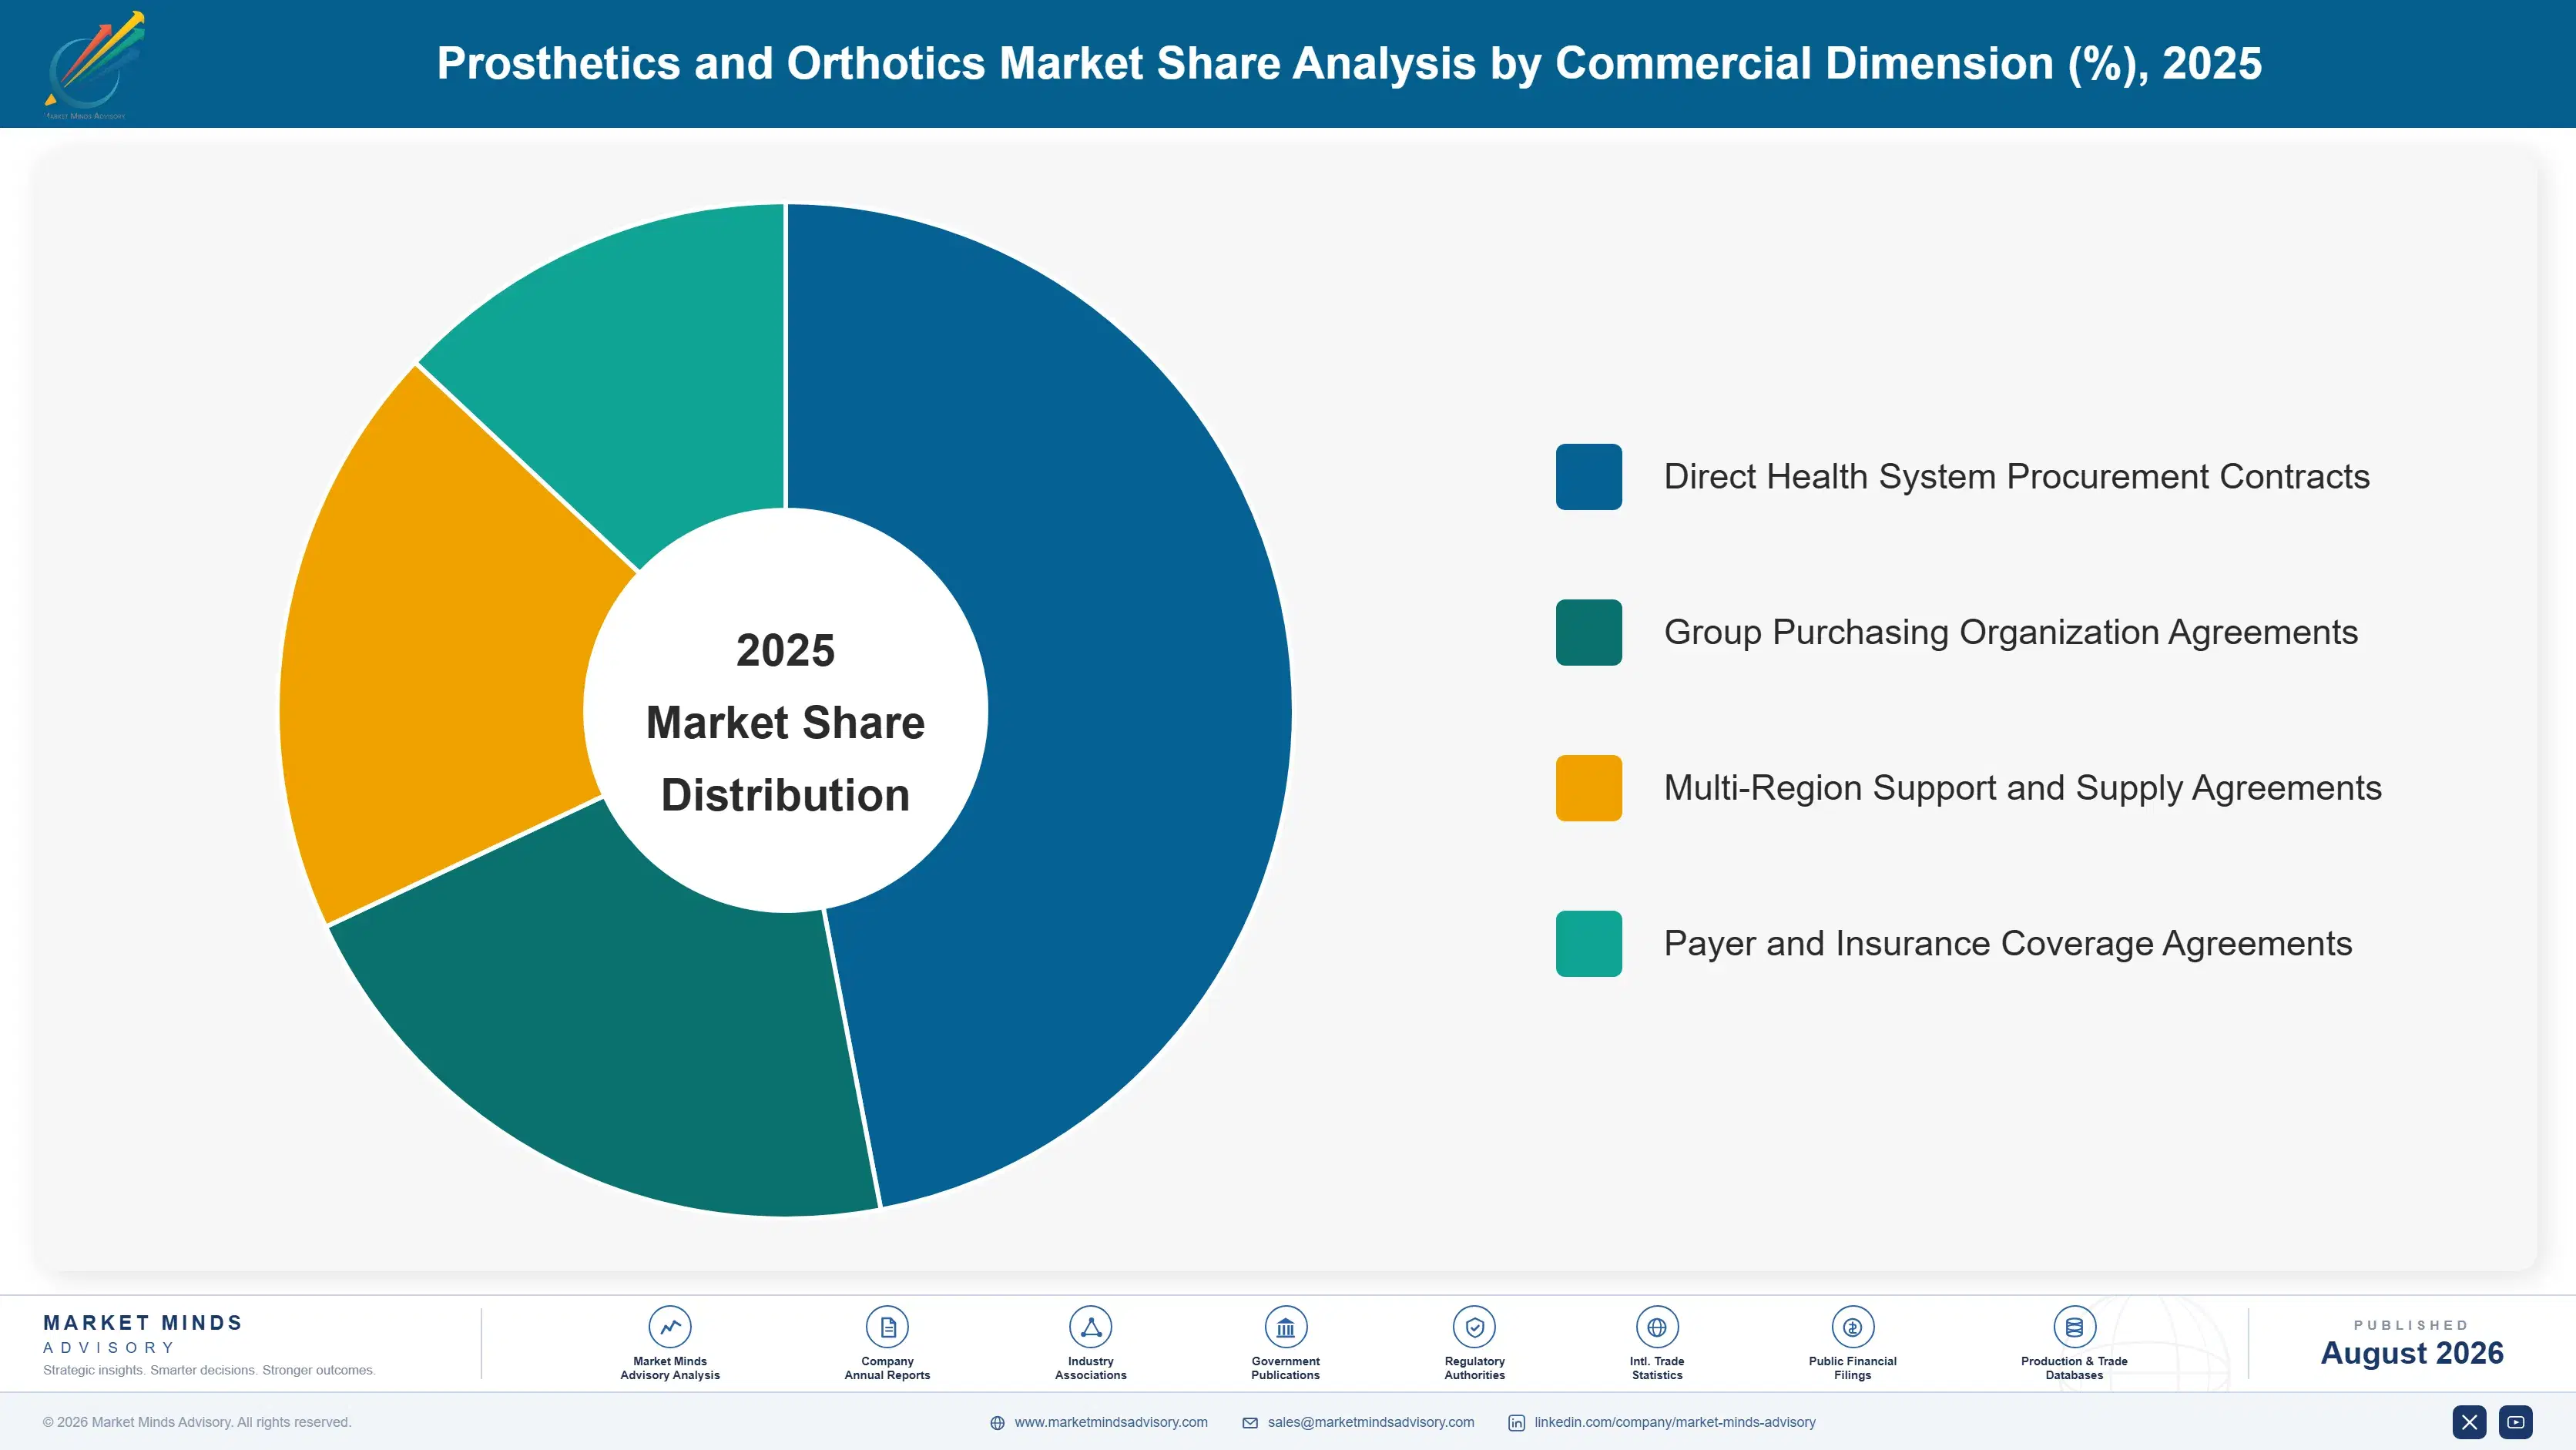
By Commercial Dimension

  • Direct Clinic Sales
  • Multi-Year Reimbursement Contracts
  • Distributor and Prosthetist Channels
  • Export Trading Company Sales

By Region

  • East Asia
  • North America
  • Western Europe
  • South Asia and Pacific
  • Latin America
  • Middle East and Africa
  • Eastern Europe

Scope, Methodology, and Coverage

Every figure in this report is reproducible from documented input assumptions. The scope below maps the historical period, the forecast horizon, the segmentation dimensions, and the countries covered, alongside the underlying primary and qualitative methodology.
Historical Period
2020 to 2025
Forecast Period
2026 to 2036
Base Year
2025 (USD billions; MMA Primary Research Dataset, August 2026)
Market Definition
The Prosthetics and Orthotics Market covers artificial limbs and supportive bracing devices used for amputation rehabilitation, mobility support, and orthopedic correction, including upper limb, lower limb, myoelectric, spinal, and custom 3D-printed formats. It excludes surgical implants, mobility aids, and diagnostic orthopedic equipment.
Quantitative Units
USD billions (current prices); unit volume in thousands of fitted devices
Segmentation Dimensions
By Product and Technology Type; By End-Use Industry; By Commercial Dimension; By Region
Regions Covered
East Asia, North America, Western Europe, South Asia and Pacific, Latin America, Middle East and Africa, Eastern Europe
Countries Covered
USA, China, Germany, France, UK, Japan, South Korea, India, Australia, Canada, Brazil, Mexico, Indonesia, Vietnam, Thailand, Malaysia, UAE, Saudi Arabia, South Africa, Nigeria, Turkey, Poland, Netherlands, Italy, Spain, Sweden, Switzerland, Colombia, Czech Republic, Singapore, and additional markets relevant to this sector
Key Companies Profiled
Ottobock, Ossur, Hanger Inc, DJO Global, Blatchford Group, Fillauer LLC, Ekso Bionics, Steeper Group, Freedom Innovations, Proteor, WillowWood Global, Trulife, Becker Orthopedic, College Park Industries, Bulldog Tools, Endolite, Coyote Design, Cascade Orthopedic Supply, Bionic Prosthetic Solutions, Advanced Arm Dynamics
Quantitative Methodology
Primary survey, n=3,800 respondents, Q4 2025, six countries; demand-side model with trade association cross-validation
Qualitative Methodology
47 expert interviews, Q4 2025; applied to validate demand model assumptions, identify emerging dynamics, and assess competitive positioning
Report Format
PDF and XLSX data workbook (Word format preview document)
Publisher
Market Minds Advisory
Report Code
MMA-2026-MED-101
Published
August 2026
Contact
sales@marketmindsadvisory.com | www.marketmindsadvisory.com

Purchase the full Prosthetics and Orthotics Market Report (2026 to 2036).

This report delivers a full quantitative and qualitative assessment of the global Prosthetics and Orthotics Market, covering historical performance from 2020 through 2025 and forecasts through 2036 across base, bull, and bear scenarios. It profiles twenty companies spanning precision engineering, myoelectric integration, and scanning technology sourcing, benchmarked on a consistent revenue basis. Regional analysis spans all seven major world regions, with detailed demand mechanisms specific to each. The report also includes segmentation analysis, input cost exposure assessment, competitive positioning, and an anonymized client case study illustrating practical device conversion decision-making.
Ten-year historical and forecast market sizing
Product and technology segmentation with growth rates
Seven-region demand mapping and competitive benchmarking
Twenty-company competitive profiling and moat analysis
Input cost exposure and mitigation strategy assessment
Anonymized client case study and strategic verdict

Built For The People Who Decide

From boardroom strategy to bench-side execution, this report is read cover-to-cover by leaders shaping the next decade of their industry, turning demand scenarios, market dynamics and valuation benchmarks into decisions.
CXOs/ Presidents/ VPs/ Managers
M&A and Corporate Development
Strategy Teams and R&D Heads
Procurement and Product Directors
Regulatory and Compliance Leaders
Investor Relations and Equity Analysts