Market Minds Advisory
Prostate Cancer Market

Prostate Cancer Market: Growth Comes From Duration, Not From Diagnosis

Incidence has barely moved while median time on therapy has roughly tripled. This market grew by keeping men on treatment for years rather than months, and that mechanism now meets a large exclusivity cliff.

Lead Analyst

Alice Ballenger

Published

September 2026

Make Smarter Decisions with Customized Research Insights

Request a free sample report and evaluate market opportunities, growth trends, and competitive dynamics relevant to your business needs.

2025 MARKET VALUE$17.8BMarket Size 2025
2036 FORECAST VALUE$36.7BBase Case , 2026 to 2036
CAGR 2026 TO 20366.8 %Bull 8.0% / Bear 5.6%
INCREMENTAL OPPORTUNITY$17.7BNet 10- year value creation
EXPANSION MULTIPLE1.93x2036 value over 2026 base
Strategic Levers
M&A Pipeline
Regional Outlook
Country Rankings
Competitive Intelligence
Segmental Deep-dive
Call-Us : 91 93563 13602

Executive Snapshot and Market Trajectory

Prostate cancer incidence rises slowly and predictably with ageing populations. Median time on active therapy has roughly tripled, because agents developed for late metastatic disease kept moving into earlier settings where men live for years. Duration rather than diagnosis built this market, and that mechanism now meets a patent cliff.
Growth runs at 6.8%, held down by exclusivity losses across androgen receptor pathway inhibitors that carry 34% of current market value into generic exposure within this decade. Radioligand therapy grows fastest at 10.2%, exactly 1.50 times the market rate, constrained by isotope logistics rather than by any shortage of clinical demand. PARP inhibitors and their combination regimens follow at 9.4% on biomarker-selected populations.
Concentration reaches 68% across the top five measured on annual prostate cancer therapy revenue, high because a handful of molecules define current treatment practice worldwide. North America holds 44%, far above its framework band, on United States branded pricing that runs at multiples of European reference-priced equivalents for the identical molecule. China contributes the fastest national growth at 10.4% on reimbursement listing expansion, while Asia broadly grows on treated volume rather than price.
Market Definition
This market covers pharmaceutical and radiopharmaceutical therapies for prostate cancer across all disease stages, measured at manufacturer net realised prices after rebates and discounts, spanning androgen receptor pathway inhibitors, androgen deprivation therapy, radioligand therapy, PARP inhibitors and combinations, cytotoxic chemotherapy, and immunotherapy. Diagnostic imaging agents, surgical and radiotherapy procedures, active surveillance pathways, supportive care medicines, and screening programmes fall outside scope.
Base Year Value
$17.8B in 2025 (MMA Primary Research Dataset, August 2026)
Forecast Period
2026 to 2036, eleven discrete annual values
CAGR
6.8% base case. Bull 8.0%. Bear 5.6%.
Fastest Growth Segment
Radioligand Therapy: 10.2% CAGR
Fastest Growth Country
China: 10.4% CAGR
Fastest Growth Region
South Asia and Pacific: 9.0% CAGR
Largest Region
North America: 44% of 2025 global value
Market Leaders
Astellas Pharma, Johnson & Johnson, Bayer, Novartis, AstraZeneca. Source: MMA Analysis based on company annual reports.
Primary Survey
n=3,800 procurement and R&D decision-makers, Q4 2025, six countries
Methodology
Demand-side build-up, cross-validated against public data, 47 expert interviews

Prostate Cancer Market Forecast Scenarios

prostate-cancer-market-size-forecast-scenario-1787299645200
The 2020 to 2025 period ran at 6.0% and almost all of it came from treating the same men for longer. Androgen receptor pathway inhibitors moved from metastatic castration-resistant disease into hormone-sensitive and then non-metastatic settings, where survival is measured in years and therapy continues throughout. Radioligand therapy arrived commercially and immediately hit supply limits. Generic abiraterone removed a large block of branded value in the same window.
Three mechanisms carry the 6.8% base case. Continued line advancement is the largest, since each move into an earlier setting multiplies treated months per patient rather than adding patients. Radioligand expansion is the second, growing at 10.2% as manufacturing and radiopharmacy capacity finally catches up with demand that has existed since approval. And Asian access expansion is the third, as reimbursement listings bring modern agents to populations previously treated with older hormonal therapy.
The 8.0% bull case rests on radioligand therapy moving into hormone-sensitive disease, which would multiply the treated population several times over against a supply base already straining. The 5.6% bear case is faster and deeper erosion after enzalutamide exclusivity ends, since payers in every major market prepared substitution policies well in advance of the date itself.

Why Treated Months Matter More Than Cases

The arithmetic behind this market is simple once stated. Prostate cancer incidence tracks male ageing and rises at low single digits. Median time on active therapy has moved from under a year to roughly 31 months, because agents proven in late metastatic disease were then tested and approved in hormone-sensitive and non-metastatic settings where men survive for years. Every step earlier multiplies treated months without adding a single new diagnosis.
TOP FIVE CONCENTRATION68%High because a handful of molecules define current practice
MEDIAN THERAPY DURATION31 monthsAcross current lines against far shorter historic treatment courses
EXCLUSIVITY LOSS EXPOSURE34%Of current market value facing generic entry this decade
RADIOLIGAND ISOTOPE HALF-LIFE6.6 daysWhich makes stockpiling impossible and logistics the binding constraint
IMAGING STAGE MIGRATION17%Of patients reclassified upward after modern imaging replaced older scans
TREATMENT LINE ADVANCEMENT3 settingsWhere leading agents now hold approval beyond their original one
Modern imaging complicates the picture in a way that flatters the numbers. Prostate-specific membrane antigen imaging finds disease that older bone scans and computed tomography missed, which reclassifies roughly 17% of patients into a more advanced stage than they would previously have been assigned. Nothing about their biology changed. They simply moved into a treatment line with different economics attached.
Against that, agents carrying 34% of current value face generic entry within this decade. Abiraterone already went, and the next wave is larger. Radioligand therapy is the clearest growth answer at 10.2%, and its constraint is not clinical: the isotope has a 6.6-day half-life, so nothing can be stockpiled and every dose is a logistics problem.
"Everybody models incidence and almost nobody models treated months. The men are largely the same men. What changed is that we now treat them for two and a half years instead of ten months, and that single fact explains most of the last decade."
Director, Oncology Therapeutics and Radiopharmaceuticals Practice · MMA Healthca

Market Trends

Radioligand Supply Is A Logistics Problem Not Demand

Lutetium-177 has a half-life of 6.6 days, which means a dose decays measurably between manufacture and administration and nothing can be held in inventory against a demand surge. Production requires reactor irradiation, radiochemistry, and delivery to a treatment centre inside a window measured in days, with patient scheduling fixed to that window rather than to clinical convenience. Growth runs at 10.2% against 6.8% for the market, and manufacturing plus radiopharmacy capacity rather than clinical demand has set the pace since launch. A dose that misses its window is not deferred revenue, it is revenue permanently lost.
Market Impact: Approval across 3 treatment settings

Imaging Reclassification Moves Patients Between Treatment Lines

Prostate-specific membrane antigen imaging detects metastatic disease that conventional bone scanning and computed tomography missed, and roughly 17% of patients are staged more advanced than they would have been under older imaging. Biology has not changed for those men, but their treatment line and the economics attached to it have. That shift inflates apparent metastatic incidence, flatters survival statistics in both the group left behind and the group joined, and complicates every comparison against historical trial populations that used older staging. Guideline committees are still working out what that means for evidence generated before the shift.
Market Impact: China grows at 10.4% annually

Market Opportunities and Growth Drivers

Each Move To An Earlier Line Multiplies Treated Months

An agent approved in metastatic castration-resistant disease treats a man for perhaps ten to fourteen months before progression. The same agent approved in metastatic hormone-sensitive disease treats him for two to three years, and in the non-metastatic setting for longer still. Leading agents now hold approval across three settings where they originally had one. That expansion adds no new diagnoses whatsoever and multiplies revenue per patient several times over, which is why regulatory submissions in earlier lines dominate development spending across the category. Nothing else in the category returns as much per dollar spent.
Market Impact: 34% of value loses exclusivity

Asian Reimbursement Listings Open Large Untreated Populations

Modern androgen receptor pathway inhibitors were unaffordable across most of Asia until national reimbursement listings brought them within reach, and men in those markets were previously managed on older hormonal therapy or surgical castration. China contributes the fastest national growth rate in this forecast at 10.4%, driven by listing expansions alongside genuinely rising incidence as the population ages. Indian access is following through domestic generic manufacture rather than through listing. The treated population expands far faster than diagnosis rates in both cases. Volume rather than price carries all of this growth.
Market Impact: Supply constrained for 3 years

Market Restraints and Challenges

A Third Of Current Value Faces Generic Entry

Agents carrying roughly 34% of present market value lose exclusivity within this decade, with abiraterone already gone and larger molecules following. The root cause is simply that the products which built this market were approved a decade or more ago and patent terms are finite. Commercial impact is severe because payers in every major market have prepared substitution policies well ahead of the dates and switching is clinically straightforward. Companies are responding with earlier-line label expansion, combination regimens, and radioligand portfolios that generics cannot copy. None of those answers arrives quickly enough for the molecules going first.
Market Impact: Half-life of 6.6 days

Radiopharmacy Networks Cannot Be Built Quickly

Delivering a therapy whose isotope decays with a 6.6-day half-life requires manufacturing sites, licensed radiopharmacies, and treatment centres arranged so that every dose reaches a scheduled patient in time. The root cause is physics rather than any commercial choice. Commercial impact is that demand documented at approval went unserved for years while capacity was built, and centres outside major cities remain hard to supply at all. Mitigation runs through regional manufacturing, additional licensed sites, and scheduling systems built around isotope decay rather than clinic convenience. Physics rather than commercial ambition sets the pace here.
Market Impact: Reclassifies about 17% of patients
3 additional market trends, 4 additional growth drivers, and 2 additional restraints and challenges are covered in the full report. Contact sales@marketmindsadvisory.com to access the complete intelligence.

Segment CAGR and Growth Architecture

Segmentation follows therapeutic class, because class determines the mechanism, the patient population selected, the treated duration achieved, the manufacturing and supply model required, and the exposure each product carries to generic entry. Disease stage and care setting both cut across every class rather than separating them, which makes either a weak primary dimension for this market.
prostate-cancer-market-market-share-analysis-1787299645735

Radioligand Therapy

The fastest class at 10.2%, exactly 1.50 times the market rate, and the only one whose ceiling is set by physics rather than by clinical evidence. A targeting molecule binds prostate-specific membrane antigen on the tumour surface and carries a radioisotope directly to it, delivering radiation where conventional external beam cannot reach. Lutetium-177 decays with a 6.6-day half-life, so manufacturing, radiopharmacy, and patient scheduling must all align inside a narrow window and nothing can be held in stock. Generic entry is effectively impossible against that supply chain, which is why the class carries so much of the sector's forward value expectation. Nothing about that protection depends on a patent term.
CAGR 10.2%

PARP Inhibitors And Combinations

Second fastest at 9.4%, and the class that made biomarker testing routine in a disease where it previously was not. Men carrying homologous recombination repair mutations, including BRCA alterations, respond to poly ADP-ribose polymerase inhibition in a way that unselected populations do not, which turned genomic testing into a prerequisite for prescribing. Combination regimens pairing these agents with androgen receptor pathway inhibitors have extended the addressable group beyond mutation carriers alone. Testing rates remain the practical constraint, since a substantial share of eligible men are never sequenced and therefore never identified as candidates at all. Funding sequencing therefore expands this market more reliably than additional clinical evidence would. Nobody has solved that gap.
CAGR 9.4%
Full segment breakdown across 6 segments available in the complete report.

Regional Architecture and Country Demand Map

Value follows pricing rather than incidence, which is why the largest share sits well outside its framework band. United States net prices for branded oncology agents run at multiples of European reference-priced equivalents for the identical molecule, and that gap dominates the regional picture entirely.

North America

Forty-four percent, far above the framework band, and the justification is pricing rather than epidemiology: United States net realised prices for branded prostate cancer agents run at multiples of European reference-priced equivalents for the identical molecule, and no other market structure permits that. Medicare Part B and Part D coverage carries the majority of treated men given the age distribution of the disease. Radioligand therapy has been adopted fastest here, with the largest network of licensed treatment centres anywhere. Growth at 6.2% sits below the global rate precisely because exclusivity losses bite hardest where branded prices are highest, and payers have prepared substitution policies well in advance. Canadian pricing sits far closer to European levels.
Share: 44% | CAGR: 6.2% (2026 to 2036)

Western Europe

Reference pricing and health technology assessment set the terms here rather than clinical demand, and both compress realised prices well below United States levels for the same agents. German and French uptake of newer classes is fastest, while southern European access lags on budget grounds rather than on guideline disagreement. Radioligand adoption has been slowed by nuclear medicine capacity as much as by reimbursement, since licensed treatment centres are unevenly distributed across the region. Growth at 5.4% is the slowest of any region, reflecting mature treatment penetration, active generic substitution policy, and reference pricing that transmits any price reduction across borders quickly. Nordic and Benelux systems adopted radioligand therapy furthest relative to population, since nuclear medicine infrastructure was already strong.
Share: 23% | CAGR: 5.4% (2026 to 2036)
Regional intelligence for 5 additional markets available in the complete report: East Asia, South Asia and Pacific, Latin America, Middle East and Africa, Eastern Europe. Contact sales@marketmindsadvisory.com.
prostate-cancer-market-country-cagr-analysis-1787299646297

Managing A Market Built On Duration

Treated months rather than diagnoses built this business, and roughly 34% of its current value now faces generic entry within the decade. Value comes from moving agents earlier while exclusivity still allows it, from raising biomarker testing rates, from building radiopharmacy reach ahead of demand, and from planning erosion rather than being surprised by it.

Move Earlier While Exclusivity Still Permits It

An agent treating metastatic castration-resistant disease holds a man for perhaps twelve months, while the same agent in hormone-sensitive disease holds him for two to three years and in non-metastatic disease longer again. Each earlier-line approval multiplies treated months roughly 2.5 times without adding a single diagnosis. The trials are large and slow, so the work has to begin at least six years before exclusivity ends to be worth anything at all. Companies that started late are now running expansion trials whose readouts arrive after the generics do. That timing error cannot be recovered afterward.
Market Impact: Each earlier line multiplies treated months 2.5 times

Raise Genomic Testing Rates To Find Eligible Men

PARP inhibitors require homologous recombination repair mutation status, and a substantial share of eligible men are never sequenced and therefore never identified as candidates for a therapy that would work for them. Funding testing infrastructure, reimbursement navigation, and pathology turnaround expands the addressable population without any new clinical evidence whatsoever. A national testing support programme costs around 4 million dollars annually and typically lifts identified eligibility by a third. Very few companies fund testing as seriously as they fund promotion of the drug itself. It is the cheapest population expansion available in this market.
Market Impact: Lifts identified eligibility by roughly 33% per market

Build Radiopharmacy Reach Before Demand Materialises

A 6.6-day half-life means every dose must reach a scheduled patient within days of manufacture, so the geography of licensed radiopharmacies and treatment centres determines who can actually be treated. Demand documented at approval went unserved for roughly three years while capacity was built, which is revenue that never returns. A regional manufacturing and radiopharmacy node costs in the region of 90 million dollars and takes three years to license and commission. Building against the population you will have rather than the one you have today is the only sequencing that works.
Market Impact: A regional node costs roughly 90 million dollars

Plan Erosion Rather Than Being Surprised By It

Payers in every major market prepare substitution policies well before an exclusivity date, so post-generic erosion is faster and deeper than internal forecasts typically assume. Modelling erosion from actual payer policy documents rather than from historical analogues changes the number materially, often by 15 to 20 percentage points in the first year. That difference decides whether a company invests in defending the molecule or redirects spending into the portfolio replacing it. Getting it wrong in the optimistic direction wastes commercial spend on a product already lost. Most internal forecasts still use the analogue method.
Market Impact: Forecast error reaches 20 percentage points year one

Who Controls the Margin Pool

Concentration reaches 68% across the top five measured on annual prostate cancer therapy revenue, which is high even for oncology and reflects how few molecules define current treatment practice. Two androgen receptor pathway inhibitors between them account for the majority of treated men across developed markets, and the gap between the leader and the nearest challenger is narrow enough that quarterly reporting reorders it. Generic entrants sit outside that ranking and will reshape it entirely.
Competitive activity runs on three fronts. Earlier-line label expansion is the first and it has absorbed most development spending in the category for a decade. Radioligand manufacturing and radiopharmacy reach is the second, and it is a supply chain contest rather than a clinical one. Biomarker testing infrastructure is the third, since a company that finds eligible men creates its own addressable population.

Pressure comes from two directions. Generic manufacturers with established oncology supply will take substantial volume as exclusivity ends across the category, and payer substitution policies drafted years in advance will accelerate that transfer considerably. And radiopharmaceutical specialists without legacy small-molecule revenue are building supply networks that established companies cannot easily replicate, which is where rankings shift next.
prostate-cancer-market-company-positioning-matrix-1787299646815

Competitive Moat and Risk Dimensions

ASTELLAS PHARMA

Moat: Deepest earlier-line label breadth

Holding approval across metastatic castration-resistant, metastatic hormone-sensitive, and non-metastatic settings means a single molecule captures a man across most of his disease course rather than one line of it. That breadth took a decade of large trials and cannot be assembled quickly by anybody starting now. It also anchors treatment guidelines.
ASTELLAS PHARMA

Risk: Concentrated exclusivity cliff exposure

Revenue concentrated in a molecule approaching the end of its exclusivity term faces erosion that payers have prepared substitution policies to accelerate. Label breadth increases what is lost rather than protecting it, since generics inherit every approved setting at once. Replacing that revenue requires a portfolio built years earlier, and the window for starting has already closed.
JOHNSON & JOHNSON

Moat: Portfolio spanning multiple mechanisms

Holding agents across androgen receptor pathway inhibition and into combination regimens means the loss of any single molecule does not remove the company from the treatment pathway. Breadth across mechanisms also allows combination development inside one portfolio without partnership negotiation, which is faster and commercially cleaner. Guideline presence across several lines compounds the effect considerably.
JOHNSON & JOHNSON

Risk: Limited radioligand supply position

The fastest growing class in this market is a supply chain business requiring reactor access, radiochemistry, and licensed radiopharmacies rather than conventional pharmaceutical manufacturing. A company without that infrastructure cannot enter quickly, since a regional node takes roughly three years to license. Small-molecule strength provides no advantage at all against a product with a 6.6-day half-life.

Players Tracked

Prominent Players

Astellas Pharma
Johnson & Johnson
Bayer
Novartis
AstraZeneca

Other Key Players

Pfizer
Merck & Co
Sanofi
Ferring Pharmaceuticals
Sumitomo Pharma
Accord Healthcare
Dr. Reddy's Laboratories
Teva Pharmaceutical Industries
Sun Pharmaceutical Industries
Zydus Lifesciences
Eli Lilly
Lantheus Holdings
Telix Pharmaceuticals
Curium
Tolmar

Recent Developments

MARCH 2025

Radiopharmaceutical manufacturer commissions additional regional production node

A radiopharmaceutical manufacturer commissioned an additional production and radiopharmacy node to shorten delivery distance for a lutetium-based therapy whose isotope decays within days. The investment was organic capital expenditure rather than any joint venture, acquisition of a competing radiopharmacy network, or licensing arrangement with a reactor operator.
Signal: Geography rather than clinical evidence determines who can be treated when the isotope decays this quickly
JUNE 2025

Oncology group funds national genomic testing support programme

A pharmaceutical company funded pathology turnaround and reimbursement navigation support for homologous recombination repair testing across a national health system, aiming to identify eligible men who currently go unsequenced. The programme was company-funded infrastructure support rather than any acquisition, joint venture, or commercial arrangement with a diagnostics manufacturer.
Signal: Companies that fund testing create their own addressable population without generating a single new clinical result
SEPTEMBER 2025

Generic manufacturers file ahead of major androgen receptor inhibitor expiry

Several generic manufacturers filed abbreviated applications ahead of the exclusivity expiry of a leading androgen receptor pathway inhibitor, with launch preparations extending across major regulated markets. The filings were routine regulatory submissions rather than any settlement agreement, licensing arrangement, or partnership with the originator company.
Signal: Payer substitution policies were drafted well before the date, which makes erosion faster than historical analogues suggest

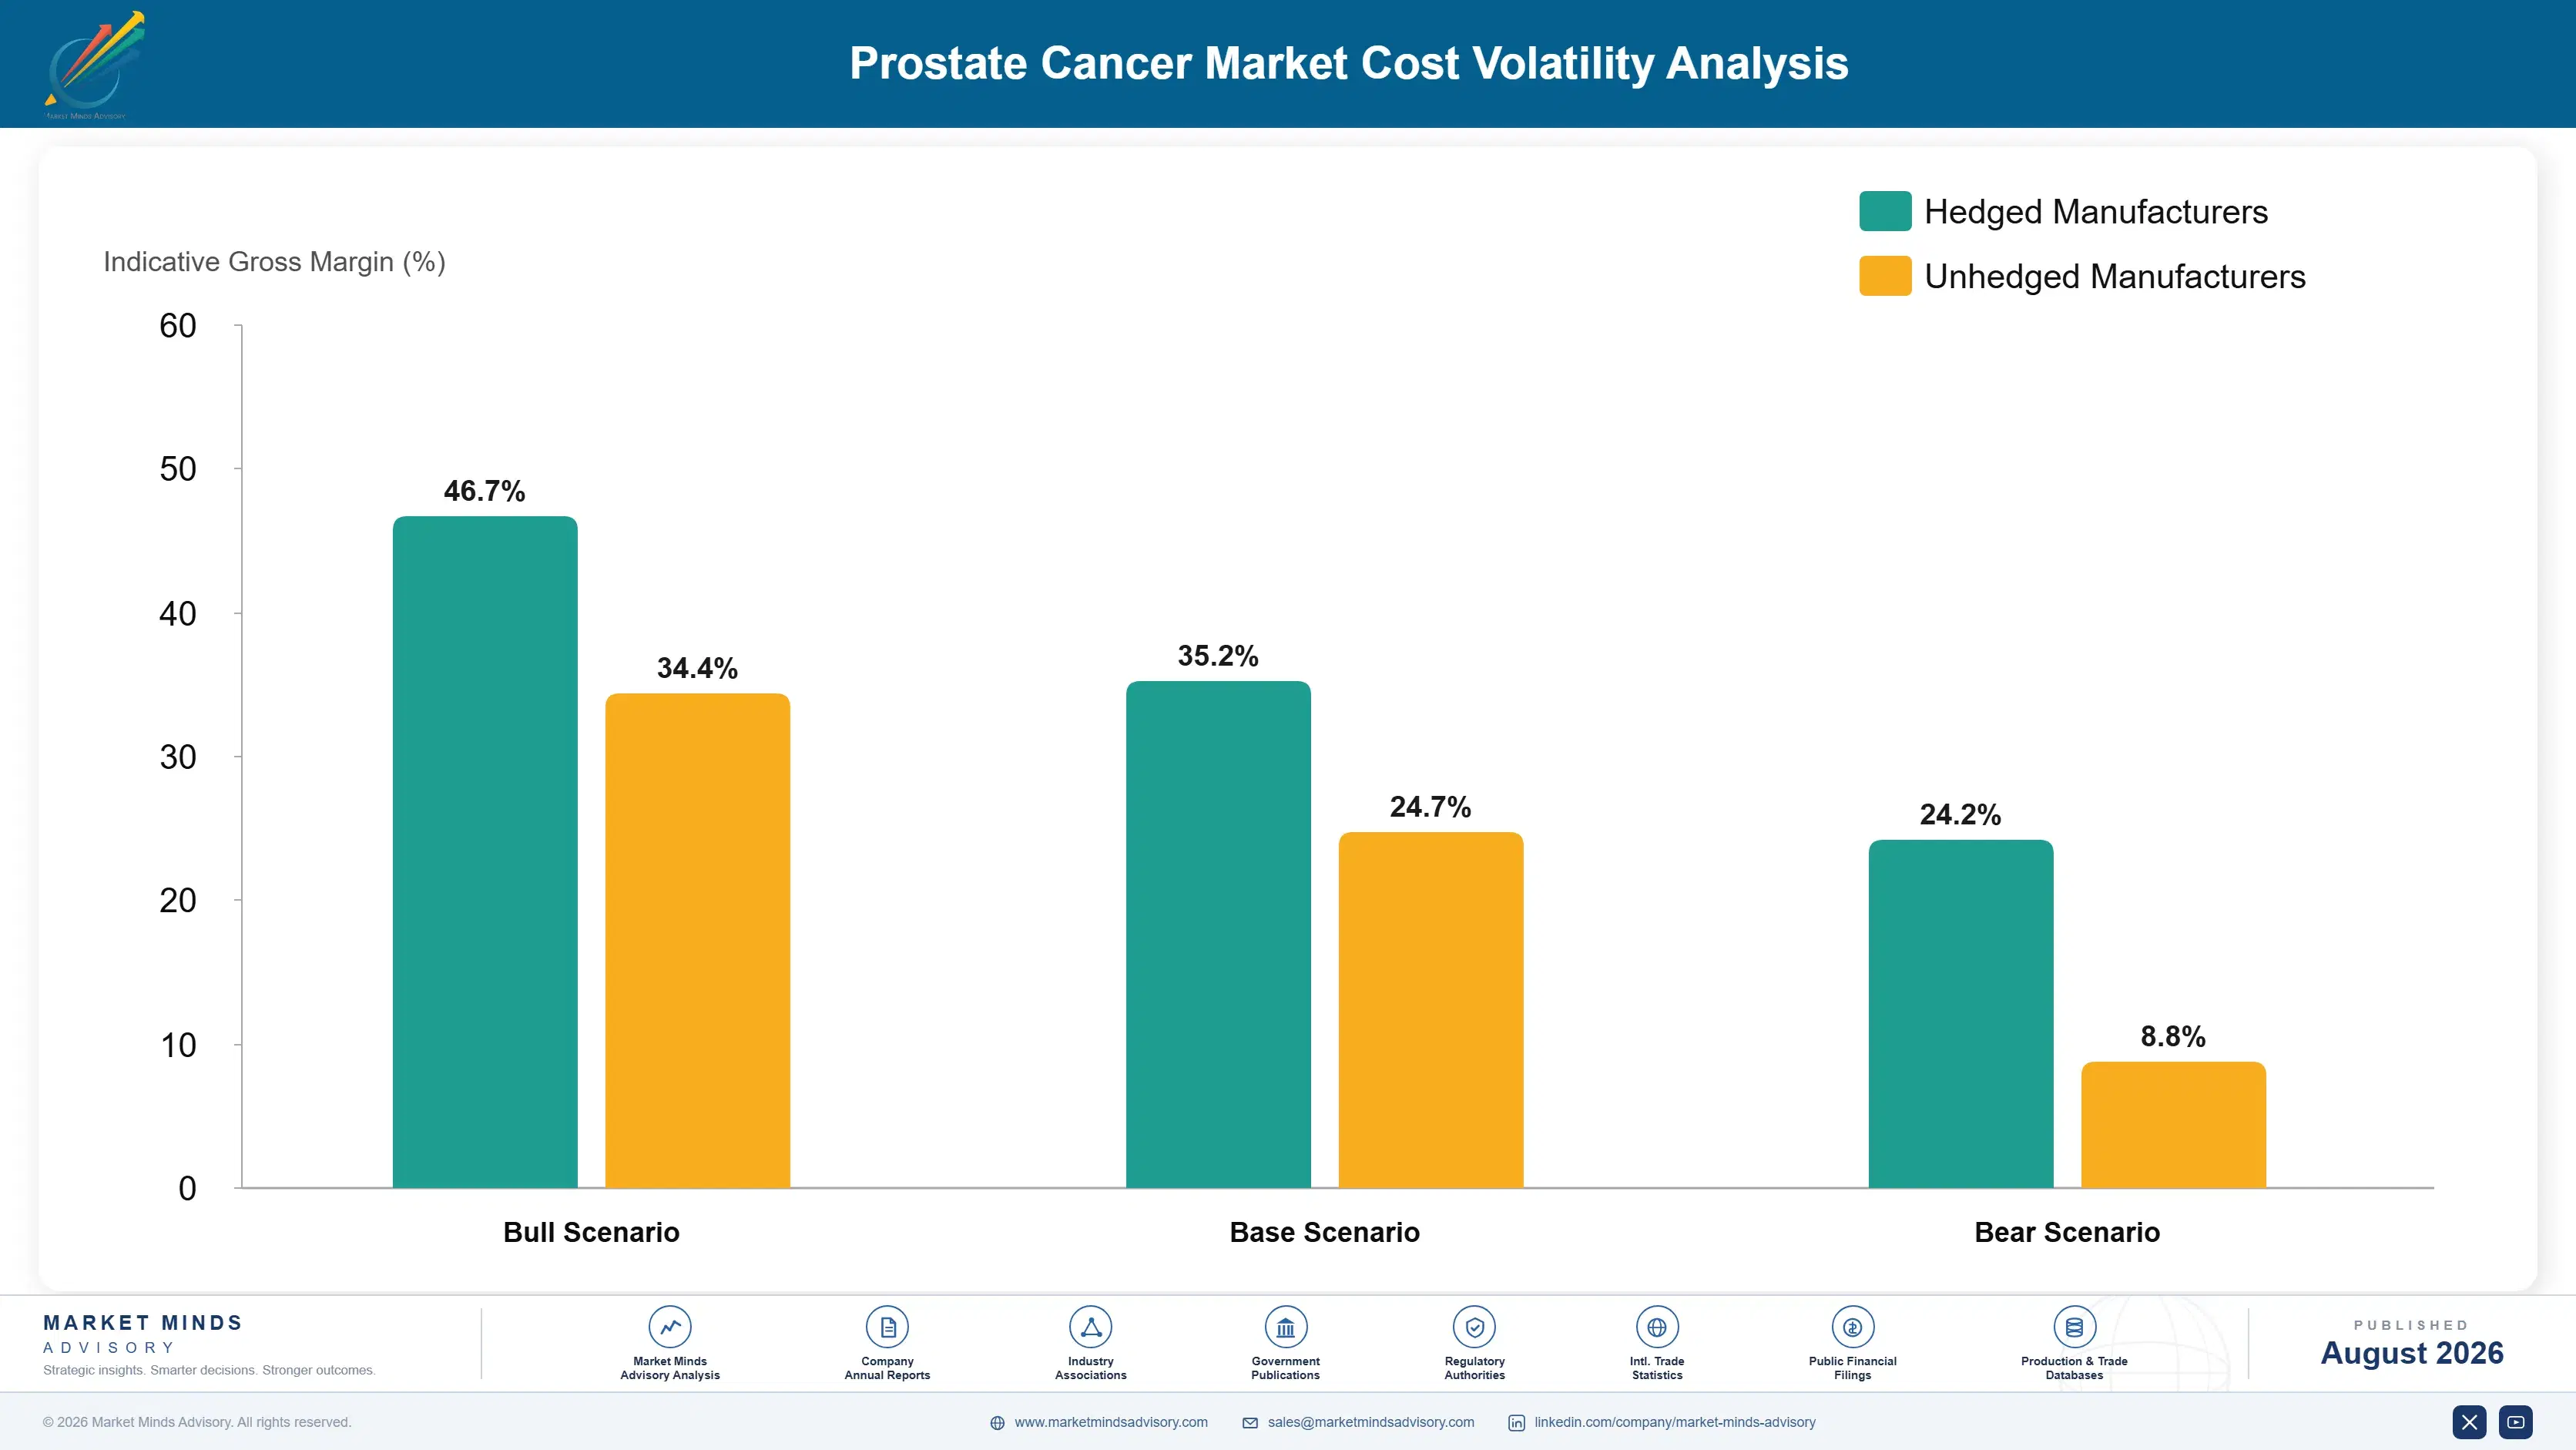
Where The Real Supply Cost Sits

Cost of goods behaves very differently across this market. For small-molecule agents, active pharmaceutical ingredient runs about 31% of a modest cost base, with fill-finish and packaging near 18% and specialty distribution around 14%, all sourced from established manufacturing in Europe, India, and China. For radioligand therapy the picture inverts: reactor irradiation, isotope processing, and radiochemistry carry roughly 26% against a far higher cost base per patient.
The radioligand supply constraint through 2022 and 2023 was the event that mattered, and Novartis documented it directly in its annual reporting, describing manufacturing capacity limits that restricted dosing while clinical demand went unserved. Nothing about that shortage was commercial. An isotope with a 6.6-day half-life cannot be stockpiled ahead of a capacity gap, so every week of shortfall was revenue permanently lost rather than deferred into a later quarter somewhere.

The competitive disadvantage mechanism runs through supply infrastructure rather than through manufacturing cost. A company holding reactor access, licensed radiochemistry, and a distributed radiopharmacy network can serve patients that a company without them simply cannot reach at any price. Small-molecule scale confers nothing here. Exposure also varies by geography, since centres outside major cities sit beyond the decay window whatever payers decide.
prostate-cancer-market-cost-volatility-analysis-1787299647010

Secure diversified reactor and isotope supply agreements

Medical isotope production depends on a small number of research reactors, several of which are old and subject to unplanned outages that halt supply entirely for weeks. Multi-source agreements across reactors in different countries remove the single point of failure that has stopped supply repeatedly. Holding contracted capacity across two sources costs very little.

Place production nodes against patient geography not convenience

A 6.6-day half-life converts distance into lost activity, so a node placed for construction convenience rather than for patient density leaves treatable men outside the delivery window permanently. Mapping licensed treatment centres and expected patient volumes before siting production changes which populations can be served at all. That decision cannot be corrected quickly afterward.

Schedule patients around isotope decay rather than clinic calendars

Treatment centres accustomed to booking patients at clinical convenience waste activity when a dose arrives ahead of an appointment and loses potency while it waits. Scheduling systems built around manufacture and delivery timing recover a meaningful share of doses that would otherwise be partly wasted. The change is administrative rather than capital, and cheap.

Portfolio Architecture for Margin Defence

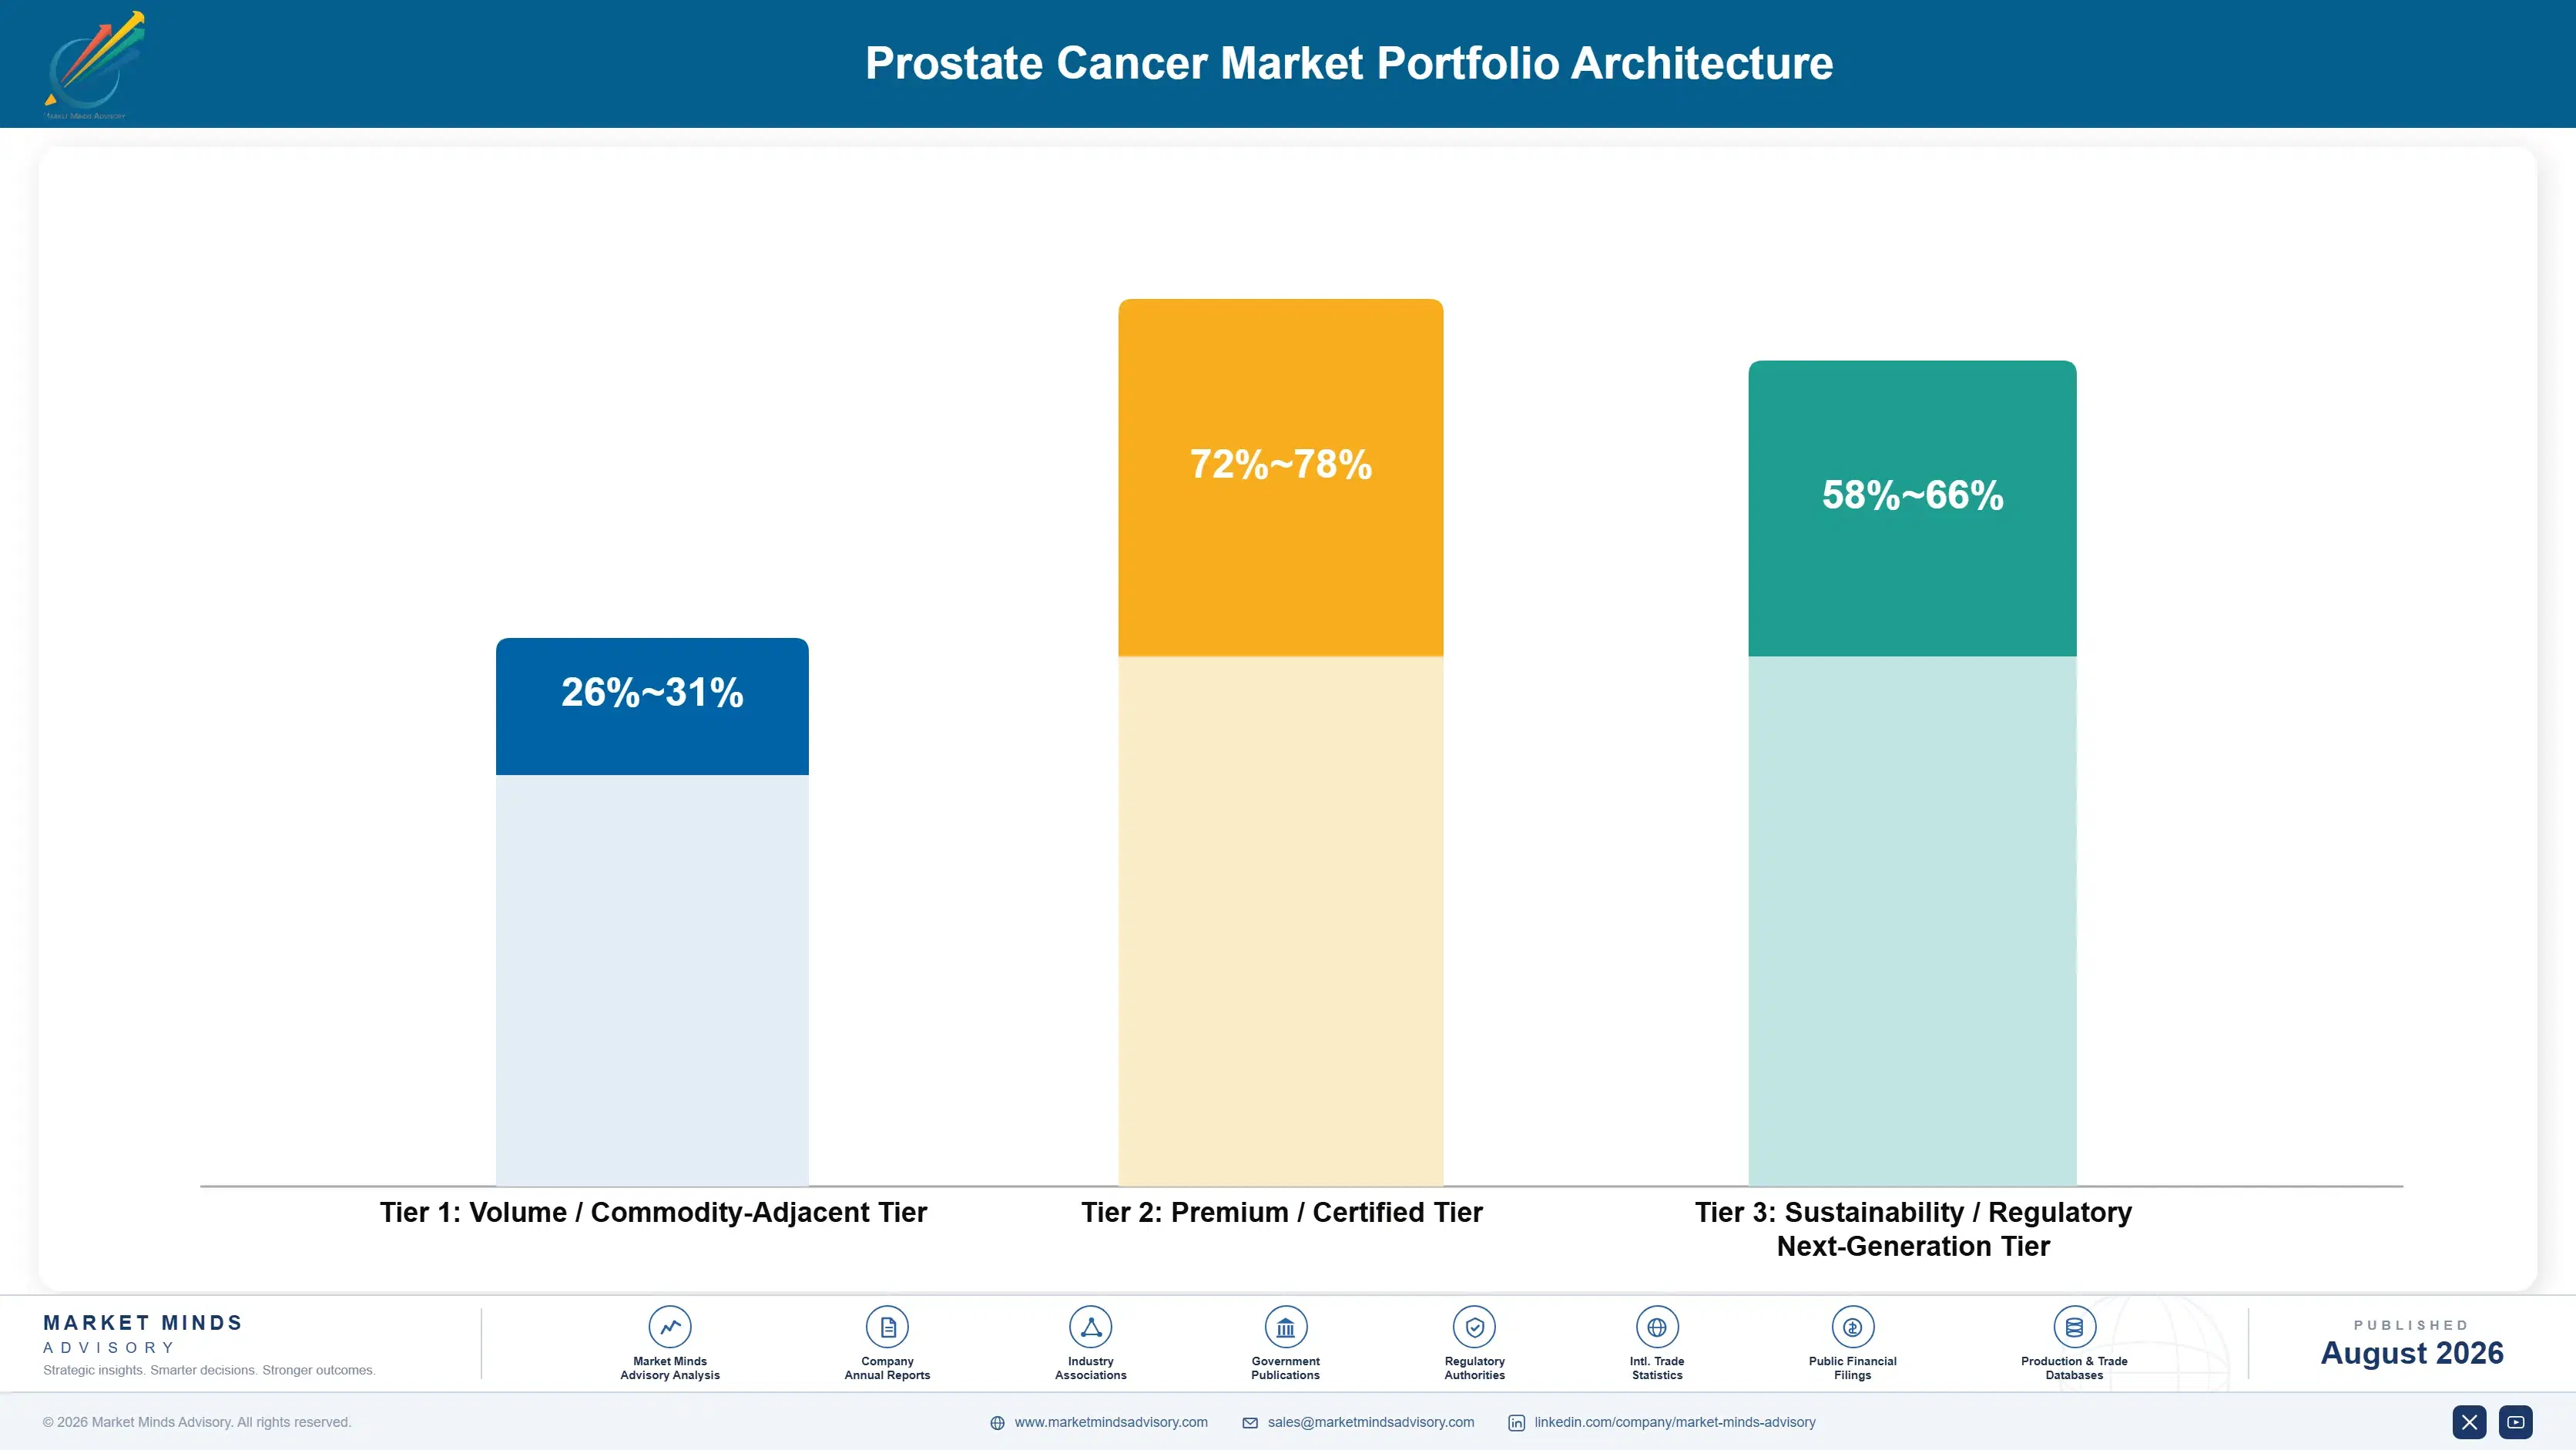
Three tiers describe this market and the spread is set by substitutability rather than by clinical value. Genericised hormonal agents sit at the bottom, where abiraterone and older androgen deprivation therapy compete on price alone and margin has collapsed toward manufacturing cost. Branded androgen receptor pathway inhibitors sit far higher while exclusivity holds. Radioligand and biomarker-selected therapies occupy a third tier protected by supply and by testing infrastructure.
The tension is that the tier facing erosion still funds everything else. Branded androgen receptor pathway inhibitors carry the commercial organisation, the medical affairs presence, and the trial programmes that the replacement portfolio depends on. Companies that cut that spending early to protect margin have found their earlier-line expansion trials slowed at exactly the moment those readouts needed to arrive ahead of generic entry.

High-value pools concentrate where a generic cannot follow. Radioligand therapy is protected by a supply chain rather than by a patent, and biomarker-selected regimens are protected by testing infrastructure that a generic entrant has no reason to fund. Both protections outlast any patent term, which is why forward value expectation in this sector concentrates there rather than in the branded molecules still earning most of the money today.

Volume / Commodity-Adjacent Tier

Genericised abiraterone and older androgen deprivation therapy competing on price across every major market. Margin has fallen toward manufacturing cost, but the volume sustains manufacturing scale and keeps suppliers present in tender processes that occasionally reach into higher tiers.
Gross Margin: 26-31%

Premium / Certified Tier

Branded androgen receptor pathway inhibitors holding approval across multiple disease settings while exclusivity lasts. Margin reflects guideline position and treated duration rather than manufacturing complexity, and it funds the commercial and trial infrastructure everything else depends on.
Gross Margin: 72-78%

Sustainability / Regulatory / Next-Generation Tier

Radioligand therapy and biomarker-selected regimens protected by supply chain and testing infrastructure rather than by patent alone. Margin is lower than branded small molecules because isotope and logistics cost is real, but the protection outlasts any exclusivity term.
Gross Margin: 58-66%
prostate-cancer-market-portfolio-architecture-1787299647511

High-value Sub-segments and Strategic Watch-out

Radioligand Therapy

Fastest growth at 10.2%, exactly 1.50 times the market rate, and protected by a supply chain that generic entrants cannot replicate at all. A 6.6-day isotope half-life makes geography the binding constraint, so reach rather than evidence determines who gets treated. Nothing here depends on a patent term.
Gross Margin: 58-66%

Biomarker-Selected Combination Regimens

Strong margin and 9.4% growth, protected by genomic testing infrastructure that no generic entrant has any incentive whatsoever to fund. Testing rates rather than clinical evidence limit the addressable population here, so any company funding sequencing effectively creates its own market as it goes along.
Gross Margin: 58-66%

Branded Androgen Receptor Pathway Inhibitors

The value core at the highest margin anywhere in this market, holding approval across three settings and anchoring treatment guidelines worldwide. It also carries the 34% of market value facing generic entry, which makes it simultaneously the best and most exposed position. Both things are true simultaneously.
Gross Margin: 72-78%

Genericised Hormonal Therapy

The strategic watch-out, where price competition has already compressed margin toward manufacturing cost and further entrants keep arriving. It nonetheless treats a very large share of men worldwide, particularly across Asia and Latin America where nothing else is affordable. Volume there is very large and value very small.
Gross Margin: 26-31%

How Treated Months Accumulate

Revenue here recurs monthly for as long as a man remains on therapy, which in earlier disease settings now means two to three years of continuous prescribing rather than the ten to fourteen months late-line treatment produced. That makes duration the entire commercial variable and progression the event that ends it. A single earlier-line approval therefore does more for revenue than any pricing decision could, because it multiplies the months rather than the monthly amount, and it does so across
Stickiness varies by class and by how the therapy is delivered. Androgen deprivation is the deepest, since men stay on it for years alongside whatever else they receive and switching offers no clinical benefit. Radioligand therapy sticks differently: it runs as a fixed course of doses rather than continuous therapy, so the relationship is with the treatment centre rather than the patient. Biomarker-selected regimens stick hardest where testing identified the patient, because that result follows him through subsequent decisions.

Buyer profiles have shifted toward multidisciplinary teams. Urologists once controlled prescribing largely alone; medical oncologists, nuclear medicine physicians, and molecular pathologists now share it.
prostate-cancer-market-end-use-penetration-index-1787299648004

What We Would Tell a Board

These are among the four positions where our research anticipates prominent divergence between winners and laggards over the coming forecast period. Each is grounded in the demand model, the regulatory perimeter, and the announced capacity pipeline.
01 / EARLIER LINE SEQUENCING

Expansion trials had to start six years ago

Moving an agent from metastatic castration-resistant disease into hormone-sensitive and then non-metastatic settings multiplies treated months by roughly 2.5 times without adding a single new diagnosis anywhere. Those trials are large and slow, which means the programme has to begin at least six years before exclusivity ends to generate revenue while the molecule is still protected. Companies that started late are now running expansion studies whose readouts will arrive after the generic entrants do, at which point the expanded label belongs to everybody rather than to them.
02 / GENOMIC TESTING INVESTMENT

Fund the sequencing, not just the promotion

PARP inhibitors require homologous recombination repair status, and a large share of eligible men are never sequenced and therefore never become candidates for a therapy that would genuinely work for them. Funding pathology turnaround and reimbursement navigation costs around 4 million dollars a year nationally and typically lifts identified eligibility by a third, which expands the addressable population without any new clinical evidence. Almost nobody funds testing infrastructure as seriously as they fund promotion of the drug itself, which is a straightforward misallocation.
03 / RADIOPHARMACY NETWORK REACH

A 6.6-day half-life makes geography the constraint

Every radioligand dose must reach a scheduled patient within days of manufacture, so licensed radiopharmacy and treatment centre geography rather than clinical evidence decides who can actually be treated at all. Demand documented at approval went unserved for roughly three years while capacity was built, and that revenue never returns to anybody. A regional production node costs in the region of 90 million dollars and takes three years to license, so building has to run against the population you expect rather than the one currently referred.
04 / EROSION FORECAST REALISM

Payers wrote the substitution policy years ago

Roughly 34% of current market value faces generic entry this decade, and payers across every major market prepared substitution policies well ahead of the dates rather than reacting to them. Erosion modelled from those actual policy documents rather than from historical analogues typically comes out 15 to 20 percentage points steeper in the first year. That difference decides whether a company defends a molecule already lost or redirects that spending into the portfolio actually meant to replace it, which is the whole point of doing the work.

Engagement Snapshot From the Field

A live engagement with an industry participant carrying material or product regulatory and market exposure ahead of a defining policy shift, showing how our research translates into a defensible multi-year portfolio strategy.
MARKET MINDS ADVISORY · CLIENT ENGAGEMENT SUMMARY
Prostate Cancer Producer Strategic Portfolio Review and Transition Roadmap 2026·Investment Scenario on Prostate Cancer Exposure Evaluation 2025-26
CLIENT PROFILE
An international pharmaceutical group with prostate cancer revenue of approximately 2.1 billion dollars annually (client-reported, unverified by MMA), concentrated in a branded androgen receptor pathway inhibitor approaching the end of its exclusivity term. The portfolio included an early-stage radioligand asset without any manufacturing infrastructure and a combination programme that had not yet begun registrational trials.
STRATEGIC CHALLENGE
Internal forecasts assumed post-generic erosion in line with historical oncology analogues, and the commercial plan retained substantial promotional spending on the branded molecule through the transition. The board wanted an independent view on whether that erosion assumption was defensible before approving a three-year commercial budget built entirely on top of it.
MMA APPROACH
We built erosion scenarios from published payer substitution policies and formulary decisions across the client's twelve largest markets rather than from historical analogues. Radioligand supply requirements were mapped against patient geography and licensing timelines. Genomic testing rates were measured across the same markets, and the combination programme timeline was assessed against the exclusivity date it needed to precede.
KEY FINDINGS
  1. Payer substitution policies already drafted in nine of twelve markets implied first-year erosion roughly 18 percentage points steeper than the internal forecast assumed.
  2. The radioligand asset had no manufacturing or radiopharmacy plan, and a licensed regional node would take three years, placing first meaningful revenue well beyond the transition.
  3. Genomic testing rates across the twelve markets averaged under half of eligible men, meaning the combination programme addressed a population smaller than the label implied.
  4. Promotional spending planned for the final two exclusivity years exceeded what those years could plausibly return under any of the payer-derived erosion scenarios modelled.
CLIENT PROFILE
An international pharmaceutical group with prostate cancer revenue of approximately 2.1 billion dollars annually (client-reported, unverified by MMA), concentrated in a branded androgen receptor pathway inhibitor approaching the end of its exclusivity term. The portfolio included an early-stage radioligand asset without any manufacturing infrastructure and a combination programme that had not yet begun registrational trials.
STRATEGIC CHALLENGE
Internal forecasts assumed post-generic erosion in line with historical oncology analogues, and the commercial plan retained substantial promotional spending on the branded molecule through the transition. The board wanted an independent view on whether that erosion assumption was defensible before approving a three-year commercial budget built entirely on top of it.
MMA APPROACH
We built erosion scenarios from published payer substitution policies and formulary decisions across the client's twelve largest markets rather than from historical analogues. Radioligand supply requirements were mapped against patient geography and licensing timelines. Genomic testing rates were measured across the same markets, and the combination programme timeline was assessed against the exclusivity date it needed to precede.
KEY FINDINGS
  1. Payer substitution policies already drafted in nine of twelve markets implied first-year erosion roughly 18 percentage points steeper than the internal forecast assumed.
  2. The radioligand asset had no manufacturing or radiopharmacy plan, and a licensed regional node would take three years, placing first meaningful revenue well beyond the transition.
  3. Genomic testing rates across the twelve markets averaged under half of eligible men, meaning the combination programme addressed a population smaller than the label implied.
  4. Promotional spending planned for the final two exclusivity years exceeded what those years could plausibly return under any of the payer-derived erosion scenarios modelled.
RECOMMENDED STRATEGY
Phase 1: Phase 1 (months one to nine): rebuild the erosion forecast on payer policy evidence and redirect late-cycle promotional spending into the replacement portfolio. Phase 2: Phase 2 (months nine to thirty): commit capital to radioligand manufacturing and radiopharmacy siting mapped against patient geography rather than construction convenience. Phase 3: Phase 3 (months thirty to sixty): fund national genomic testing support in the largest markets ahead of combination readouts. Testing rates set the ceiling.
OUTCOME
The three-year commercial budget was rebuilt on payer-derived erosion. Late-cycle promotional spending was cut substantially and redirected, radioligand manufacturing siting was approved against patient geography, and testing support programmes began in four markets ahead of the combination readout (client-reported, unverified by MMA). Erosion assumptions now drive the whole plan.

Frequently Asked Questions

Foundational context covering the market sizes, CAGR, scope, country, region and competition that inform every finding below. This section is provided to cover basics and most often pre-purchase conversations, answered from the MMA Primary Research Dataset.

What is the current size of the Prostate Cancer Market?

The market is valued at USD 17.8 billion in 2025, rising to USD 19.01 billion in 2026. Scope covers pharmaceutical and radiopharmaceutical therapy at manufacturer net realised prices.

How large will the Prostate Cancer Market be by 2036?

MMA forecasts USD 36.70 billion by 2036, an increase of USD 17.69 billion over the 2026 base. That represents an expansion multiple of 1.93 times across the forecast period.

What is the CAGR for the Prostate Cancer Market 2026 to 2036?

The base case CAGR is 6.8%, with a bull case of 8.0% and a bear case of 5.6%. The historical rate from 2020 to 2025 was 6.0%, despite substantial generic entry within that window.

Which segment is growing fastest?

Radioligand therapy at 10.2%, exactly 1.50 times the market rate. Its constraint is isotope logistics rather than clinical demand, since lutetium-177 decays with a 6.6-day half-life.

Who are the major companies in the Prostate Cancer Market?

Astellas Pharma, Johnson & Johnson, Bayer, Novartis, and AstraZeneca lead on annual prostate cancer therapy revenue. The top five hold 68%, since few molecules define current treatment practice.

Which country is growing fastest?

China at 10.4%, driven by reimbursement listing expansions bringing modern androgen receptor pathway inhibitors to men previously managed on older hormonal therapy or surgical castration.

Report Segmentation Architecture

The full report scope spans multiple orthogonal segmentation dimensions, with cross-tabulated demand data provided for each dimension pair. Coverage extends further to regional breakdowns, trend trajectories, and the competitive detail needed to support segment-level decision-making.

By Therapeutic Class

  • Androgen Receptor Pathway Inhibitors
  • Androgen Deprivation Therapy
  • Radioligand Therapy
  • PARP Inhibitors And Combinations
  • Cytotoxic Chemotherapy
  • Immunotherapy And Cellular Therapy

By Care Setting

  • Academic And Comprehensive Cancer Centres
  • Community Oncology Practices
  • Urology Specialty Clinics
  • Nuclear Medicine And Radiotherapy Departments
  • Hospital Inpatient Oncology Services

By Payer Channel

  • Public Reimbursement And National Formularies
  • Commercial And Private Insurance
  • Medicare Part B And Part D
  • Hospital Tender And Group Purchasing
  • Patient Self-Pay And Assistance Programmes

By Region

  • North America
  • Western Europe
  • East Asia
  • South Asia and Pacific
  • Latin America
  • Middle East and Africa
  • Eastern Europe

Scope, Methodology, and Coverage

Every figure in this report is reproducible from documented input assumptions. The scope below maps the historical period, the forecast horizon, the segmentation dimensions, and the countries covered, alongside the underlying primary and qualitative methodology.
Historical Period
2020 to 2025
Forecast Period
2026 to 2036
Base Year
2025 (USD billions; MMA Primary Research Dataset, August 2026)
Market Definition
This market comprises pharmaceutical and radiopharmaceutical therapies indicated for prostate cancer across localised, non-metastatic, metastatic hormone-sensitive, and metastatic castration-resistant disease, measured at manufacturer net realised prices after rebates, discounts, and mandatory price reductions. Class coverage spans androgen receptor pathway inhibitors, androgen deprivation therapy including agonists and antagonists, radioligand therapy, PARP inhibitors and combination regimens, cytotoxic chemotherapy, and immunotherapy and cellular therapy. Diagnostic imaging agents, genomic testing services, surgical and external beam radiotherapy procedures, active surveillance pathways, supportive care medicines, and population screening programmes fall outside scope.
Quantitative Units
USD billions (current prices); treated patients by disease setting; treated months per patient; net realised price per treated month
Segmentation Dimensions
By Therapeutic Class; By Care Setting; By Payer Channel; By Region
Regions Covered
North America, Western Europe, East Asia, South Asia and Pacific, Latin America, Middle East and Africa, Eastern Europe
Countries Covered
USA, Canada, Germany, France, UK, Italy, Spain, Netherlands, Sweden, Switzerland, Belgium, Austria, Poland, Czechia, Romania, Russia, Japan, China, South Korea, Taiwan, India, Australia, Singapore, Brazil, Mexico, Argentina, Colombia, Saudi Arabia, UAE, Israel, South Africa, and additional markets relevant to this sector
Key Companies Profiled
Astellas Pharma, Johnson & Johnson, Bayer, Novartis, AstraZeneca, Pfizer, Merck & Co, Sanofi, Ferring Pharmaceuticals, Sumitomo Pharma, Accord Healthcare, Dr. Reddy's Laboratories, Teva Pharmaceutical Industries, Sun Pharmaceutical Industries, Zydus Lifesciences, Eli Lilly, Lantheus Holdings, Telix Pharmaceuticals, Curium, Tolmar
Quantitative Methodology
Primary survey, n=3,800 respondents, Q4 2025, six countries; demand-side model with trade association cross-validation
Qualitative Methodology
47 expert interviews, Q4 2025; applied to validate demand model assumptions, identify emerging dynamics, and assess competitive positioning
Report Format
PDF and XLSX data workbook (Word format preview document)
Publisher
Market Minds Advisory
Report Code
MMA-2026-HLT-413
Published
August 2026
Contact
sales@marketmindsadvisory.com | www.marketmindsadvisory.com

Purchase the full Prostate Cancer Market Report (2026 to 2036).

The full report sizes prostate cancer therapy across six therapeutic classes, five care settings, five payer channels, and seven regions, with country detail for the thirty largest markets. Treated months per patient are modelled by disease setting and by agent, since duration rather than diagnosis has driven almost all growth in this category. Exclusivity timelines and payer substitution policies are tracked molecule by molecule across major markets to produce erosion forecasts grounded in policy rather than analogue. Competitive profiling covers twenty companies on annual prostate cancer revenue. Radiopharmacy and treatment centre geography is mapped against isotope decay windows.
Treated months modelled by disease setting and agent
Exclusivity timelines tracked molecule by molecule across markets
Payer substitution policies assessed ahead of generic entry
Radiopharmacy geography mapped against isotope decay windows
Genomic testing rates measured across major national systems
Imaging-driven stage migration quantified by country and setting

Built For The People Who Decide

From boardroom strategy to bench-side execution, this report is read cover-to-cover by leaders shaping the next decade of their industry, turning demand scenarios, market dynamics and valuation benchmarks into decisions.
CXOs/ Presidents/ VPs/ Managers
M&A and Corporate Development
Strategy Teams and R&D Heads
Procurement and Product Directors
Regulatory and Compliance Leaders
Investor Relations and Equity Analysts