Market Minds Advisory
Programmable Robots Market

Programmable Robots Market: Programmable Robots Market: Integration Economics, Payback Thresholds and Deployment Density 2026 to 2036

The robot is rarely the expensive part. Integration, tooling and programming typically cost more than the arm itself, which is why cheaper hardware has not produced the adoption everybody predicted.

Lead Analyst

Published

September 2026

Make Smarter Decisions with Customized Research Insights

Request a free sample report and evaluate market opportunities, growth trends, and competitive dynamics relevant to your business needs.

2025 MARKET VALUE$21.8BMarket Size 2025
2036 FORECAST VALUE$54.1BBase Case , 2026 to 2036
CAGR 2026 TO 20368.6 %Bull 9.8% / Bear 7.3%
INCREMENTAL OPPORTUNITY$30.4BNet 10- year value creation
EXPANSION MULTIPLE2.28x2036 value over 2026 base
Strategic Levers
M&A Pipeline
Regional Outlook
Country Rankings
Competitive Intelligence
Segmental Deep-dive
Call-Us : 91 93563 13602

Executive Snapshot and Market Trajectory.

The robot is rarely the expensive part of a robot project. Integration, tooling, safety assessment and programming typically cost more than the arm, frequently two or three times more. That ratio explains why falling hardware prices have not produced the adoption wave that vendors kept predicting through the past decade.
The market reaches USD 23.7 billion in 2026 and USD 54.1 billion by 2036, a 2.28 times expansion at 8.6% annually. Collaborative and force-limited robots grow at 12.9%, half again the market rate of 8.6%, because they cut safety fencing and assessment work that dominates integration cost. East Asia holds 44% of unit shipments and installations worldwide, and India compounds fastest of any market at 14.1% on manufacturing capacity that is being built entirely new.
Five manufacturers hold 52% of robot shipment revenue, and the position is unusually durable because a factory standardises on one controller and one programming environment. FANUC, ABB, Yaskawa, KUKA and Kawasaki Heavy Industries lead the field. Switching supplier means retraining engineers and rewriting working programmes, which plant managers avoid for reasons that have nothing at all to do with hardware capability.
Market Definition
This report covers programmable industrial and service robots by robot class: articulated industrial robots, collaborative and force-limited robots, SCARA and high-speed assembly robots, delta and parallel-kinematic robots, autonomous mobile robots and automated guided vehicles, and Cartesian and gantry robots. It excludes end-of-arm tooling and grippers sold separately, machine vision systems, integration and programming services, fixed automation and hard-tooled machinery, consumer and educational robots, and surgical robotic systems.
Base Year Value
$21.8B in 2025 (MMA Primary Research Dataset, September 2026)
Forecast Period
2026 to 2036, eleven discrete annual values
CAGR
8.6% base case. Bull 9.8%. Bear 7.3%.
Fastest Growth Segment
Collaborative And Force-Limited Robots: 12.9% CAGR
Fastest Growth Country
India: 14.1% CAGR
Fastest Growth Region
South Asia and Pacific: 10.8% CAGR
Largest Region
East Asia: 44% of 2025 global value
Market Leaders
FANUC, ABB, Yaskawa, KUKA and Kawasaki Heavy Industries lead on programmable robot shipment revenue. Source: MMA Analysis.
Primary Survey
n=3,800 procurement and R&D decision-makers, Q4 2025, six countries
Methodology
Demand-side build-up, cross-validated against public data, 47 expert interviews

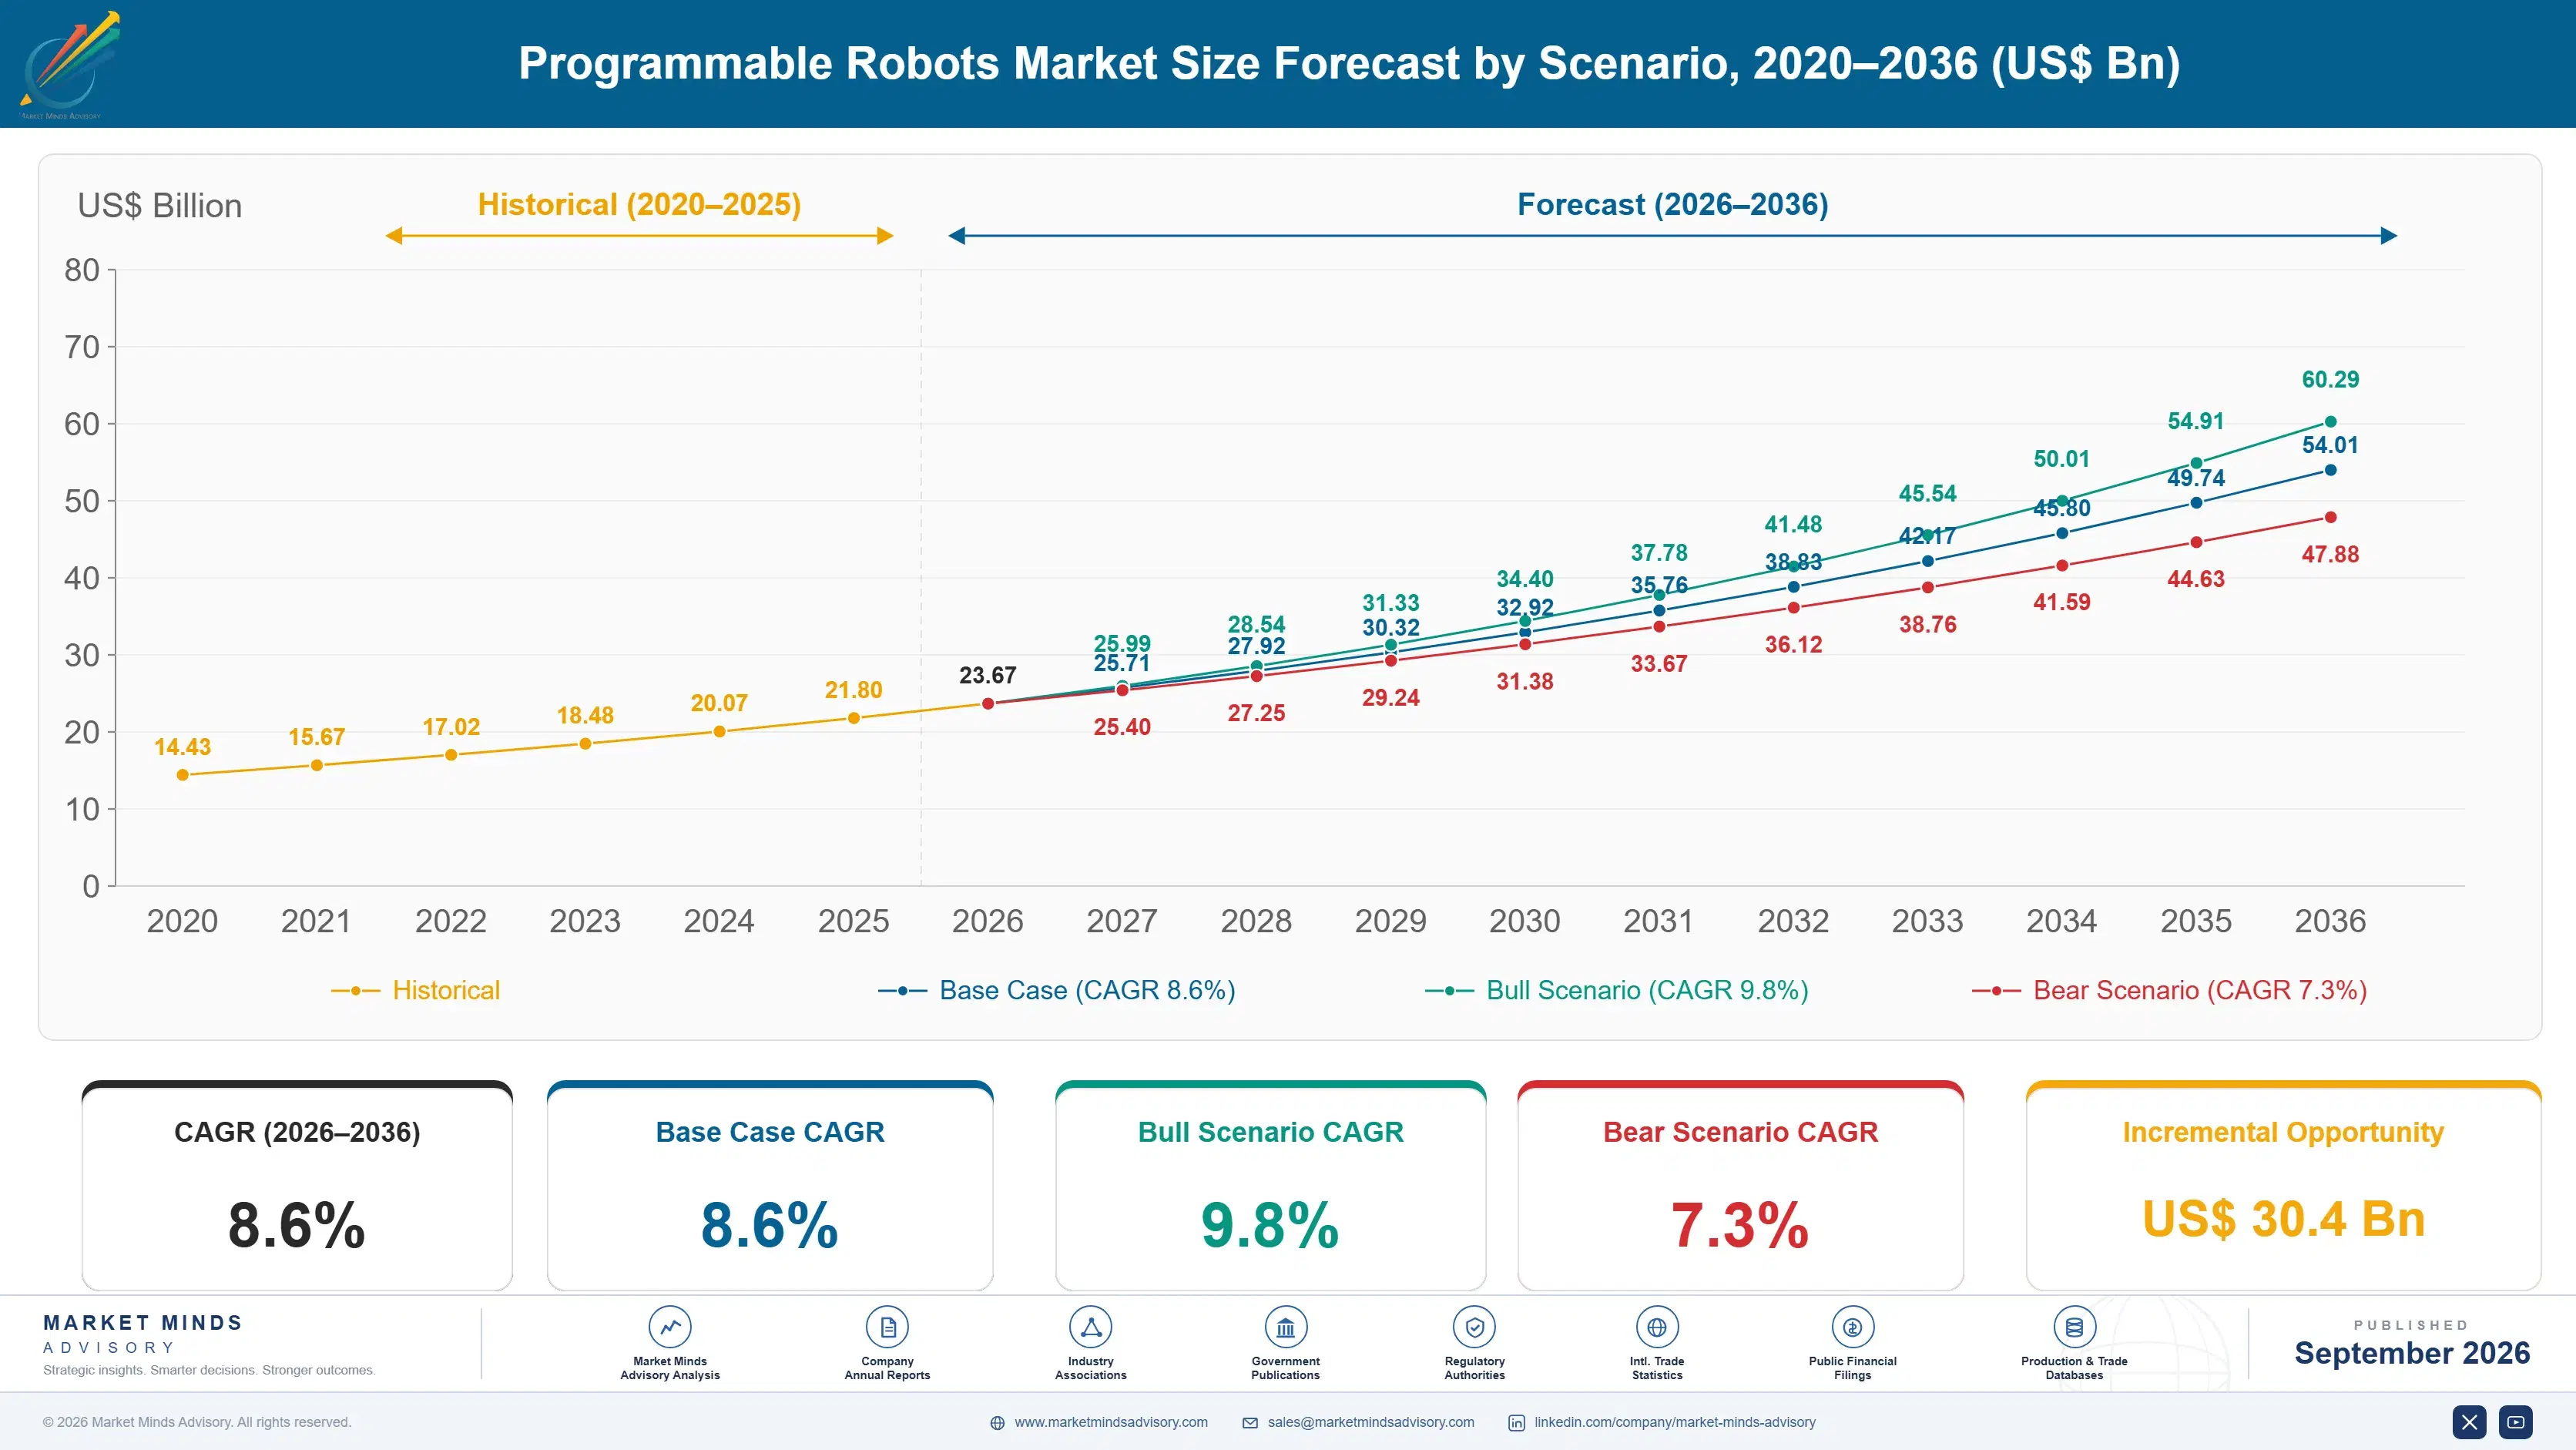
Programmable Robots Market Forecast Scenarios

programmable-robots-market-size-forecast-scenario-1789993891557
Between 2020 and 2025 the category compounded at 7.4%, through a period that contained one sharp distortion. Labour shortages across manufacturing and warehousing pulled forward automation decisions that would otherwise have taken years, then order rates corrected as those positions were filled or the work was redesigned. Underneath the distortion, collaborative robots kept taking applications that never justified a fenced installation and never would have.
The base case holds 8.6% on three mechanisms. Integration cost keeps falling as programming environments improve and reusable application templates spread across suppliers, which brings shorter-run production into the payback window for the first time. Manufacturing capacity built new across India and Southeast Asia specifies automation from the outset rather than retrofitting it later. And collaborative robots keep reaching applications where fencing and safety assessment previously made the project uneconomic.
The bull case at 9.8% assumes programming becomes genuinely accessible to production engineers rather than specialists, which would remove the constraint that has capped adoption for two decades. The bear case at 7.3% is that integration cost proves stickier than expected: hardware has fallen steadily for years without producing the adoption anybody forecast, because the hardware was never the binding constraint.

Hardware Is Not The Constraint

Robot hardware prices have fallen steadily for two decades and adoption has not accelerated in the way that should imply. The reason is that integration, tooling, safety assessment and programming typically cost around 2.4 times the arm itself. Cutting the hardware price by a fifth moves total project cost by a few percent, which rarely brings a marginal project inside the 26 month payback threshold that manufacturing finance functions apply.
TOP FIVE CONCENTRATION52%Held by manufacturers whose controllers factories standardise around
INTEGRATION COST MULTIPLE2.4 timesProject cost against the robot hardware price alone
TARGET PAYBACK PERIOD26 monthsTypical threshold before a manufacturing investment gets approved
ROBOT DENSITY LEADER1,012 per 10kInstalled robots against manufacturing employees in the leading country
PROGRAMMING SPECIALIST RATIO1 per 14Trained programmers available against the deployed robot count
SERVICE LIFE12 yearsTypical operating life before replacement or major refurbishment
That arithmetic is why collaborative robots have grown as they have. A force-limited robot working alongside people removes fencing, reduces the safety assessment burden and shrinks the floor space a cell needs, which attacks the expensive part of the project rather than the cheap part. They grow at 12.9% against 8.6% for the market. Their payload and speed limits are real, and for a great many applications they simply do not matter.
The second constraint is people. Roughly one trained robot programmer exists for every fourteen deployed robots, and that ratio has tightened rather than eased as installations grew. Manufacturers report deferring projects for want of anybody to programme them, which is a peculiar failure mode for a technology sold on removing labour dependency.
"Every few years somebody announces that cheap robots will change manufacturing. The arm has been affordable for a long time. What nobody has made affordable is the eleven weeks of engineering that turns an arm into a working cell, and that is the number that decides whether a project happens."
Director, Industrial Automation and Robotics Practice · MMA Industrial Equipment Practice · September 2026

Market Trends

Collaborative Designs Attack Integration Rather Than Hardware Cost

A force-limited robot working alongside people removes safety fencing, reduces the risk assessment burden considerably and shrinks the floor space a working cell actually requires. That attacks the expensive part of a project rather than the cheap part, since integration and tooling together typically run around 2.4 times the hardware price. Collaborative and force-limited robots grow at 12.9% against 8.6% for the market as a whole. Payload and speed limits are genuine constraints, and across a very large number of real applications they simply do not bind at all in practice.
Market Impact: India compounds at 14.1% annually
Programming Skill Shortage Constrains Deployment Directly

Roughly one trained robot programmer exists for every fourteen robots deployed, and that ratio has tightened rather than eased as installation volumes grew across every major market worldwide. Manufacturers report deferring already approved projects for want of anybody available to programme and commission them, which is an unusual failure mode for a technology sold on reducing labour dependency. Vendors have responded with graphical programming tools and pre-built application templates for common tasks, though the adoption of those tools has run well behind the shortage they were originally built to address.
Market Impact: Payback threshold sits at 26 months

Market Opportunities and Growth Drivers

New Manufacturing Capacity Specifies Automation From Design

Factories built new across India, Vietnam, Thailand and Mexico specify automation during design rather than retrofitting it into an existing layout years afterwards, which removes most of the integration cost that makes retrofit projects marginal. India compounds at 14.1%, faster than any other market, on manufacturing capacity that did not exist five years ago. A greenfield plant designs the cell layout, the material flow and the safety case together, so the robot arrives into a facility built around it rather than being squeezed into one designed without it in mind.
Market Impact: Integration costs 2.4 times hardware

Warehouse Automation Extends Beyond Traditional Manufacturing

Autonomous mobile robots and automated guided vehicles have moved robotics squarely into distribution centres, which carried almost no installed base a decade ago and now represent substantial annual deployment volume worldwide. The economics differ fundamentally from manufacturing: the payback comes from labour hours saved across an entire building rather than from cycle time at one single station, and the deployment is incremental rather than requiring a single large capital project approval. That deployment structure suits the 26 month payback threshold considerably better than any conventional fixed robot cell ever manages to.
Market Impact: Service life runs 12 years

Market Restraints and Challenges

Integration Cost Keeps Marginal Projects Outside Payback

Integration, tooling, safety assessment and programming typically cost around 2.4 times the robot hardware, which means falling arm prices barely move total project economics at all. The root cause is that every cell is engineered for a specific part, process and layout, so very little of the work carries across between installations. Commercially this keeps a very large volume of applications sitting outside the 26 month payback threshold. Mitigation runs through reusable application templates, collaborative designs that remove the fencing requirement, and integrators standardising cell architecture across similar customers and processes.
Market Impact: Integration runs 2.4 times hardware

Controller Standardisation Locks Plants To One Supplier

A factory standardises on one robot controller and programming environment, then trains its engineers and writes its programmes against it, which makes changing supplier considerably more expensive than any hardware price difference. The root cause is simply that robot programming is not portable between manufacturers in any practical sense at all. Commercially this entrenches incumbent supplier positions across the full 12 year equipment life and well beyond it. Mitigation here is limited: some manufacturers now offer programme conversion assistance, and open control architectures do exist, though genuine adoption of them remains distinctly modest.
Market Impact: One programmer per 14 robots
3 additional market trends, 4 additional growth drivers, and 2 additional restraints and challenges are covered in the full report. Contact sales@marketmindsadvisory.com to access the complete intelligence.

Segment CAGR and Growth Architecture

Segmentation follows robot class, since kinematic structure determines payload, speed, working envelope and safety requirement, and those together decide which applications are commercially reachable. Six classes cover the market, from articulated industrial arms through collaborative, SCARA, delta, mobile and gantry designs. Application industry and deployment model are separate commercial dimensions handled elsewhere in this report.
programmable-robots-market-market-share-analysis-1789993892123

Collaborative And Force-Limited Robots

Collaborative robots grow at 12.9%, half again the market rate of 8.6%, and the reason is integration economics rather than any hardware advantage. Force limiting lets the robot work alongside people without fencing, which removes the safety enclosure, reduces the risk assessment burden considerably and shrinks the floor space a cell occupies. Since integration typically runs around 2.4 times the hardware price, attacking that side of the project moves the payback calculation far more than a cheaper arm ever could. Payload and speed limits are genuine constraints, and yet across a very large number of assembly, inspection and machine tending applications they simply do not bind at all in practice.
CAGR 12.9%

Autonomous Mobile Robots And Automated Guided Vehicles

Mobile robots and guided vehicles compound at 11.6% on a deployment model that differs fundamentally from fixed robot cells. The payback comes from labour hours saved across a whole building rather than from cycle time at a single station, and units are added incrementally rather than requiring one large capital approval up front. That structure fits the 26 month payback threshold considerably better than a fixed cell does, since the operator can start small and expand against demonstrated results. Distribution centres had almost no installed base a decade ago and now represent substantial volume, which is where the great majority of this segment's growth has actually come from so far.
CAGR 11.6%
Full segment breakdown across 6 segments available in the complete report.

Regional Architecture and Country Demand Map

East Asia holds 44% of programmable robot demand, far above the standard band ceiling, because the region contains both the highest robot density manufacturing anywhere in the world and four of the five leading manufacturers. Western Europe follows at 20% on automotive and machinery automation.

East Asia

East Asia holds 44% of programmable robot demand, far above the 30% band ceiling, and no other region comes close for reasons that are both industrial and industrial-policy driven. South Korea, Japan, Singapore and China occupy the leading positions on robot density measured against manufacturing employment, with the leader exceeding 1,012 installed robots per ten thousand workers. FANUC, Yaskawa and Kawasaki Heavy Industries are Japanese, and Chinese domestic manufacturers have taken substantial share in their home market. Growth at 9.6% sits above the global rate. Manufacture and consumption sit within the same region here, which is genuinely uncommon for capital equipment of this kind. Domestic Chinese suppliers compete hard on price and delivery.
Share: 44% | CAGR: 9.6% (2026 to 2036)

Western Europe

Twenty percent of demand reaches Western Europe, where automotive assembly and machinery manufacturing account for the majority of installations. German automotive plants operate at robot density among the highest anywhere outside East Asia, and ABB and KUKA both hold significant European positions from long-established regional bases. Italian and Spanish machinery manufacturers deploy at smaller unit scale across a considerably more fragmented industrial base. Programming skill shortage is acute here, with manufacturers reporting deferred projects for want of commissioning capacity. Growth at 7.0% is the slowest of any region measured, on an installed robot density that is already high across the major manufacturing economies. Nordic industrial automation adds smaller volume at high density.
Share: 20% | CAGR: 7.0% (2026 to 2036)
Regional intelligence for 5 additional markets available in the complete report: North America, South Asia and Pacific, Latin America, Middle East and Africa, Eastern Europe. Contact sales@marketmindsadvisory.com.
programmable-robots-market-country-cagr-analysis-1789993892655

Where Robot Projects Are Won

Integration costs roughly two and a half times the hardware, a shortage of trained programmers keeps deferring projects that have already been approved, and the fastest growing markets are building new factories rather than retrofitting old ones. The four levers below follow those conditions rather than any argument about payload, reach or cycle time.

Sell Total Project Cost Rather Than Hardware Price

Integration, tooling, safety assessment and programming typically run around 2.4 times the robot price, so cutting hardware cost by a fifth moves the project total by only a few percent and rarely brings a marginal application inside the 26 month payback threshold that manufacturing finance functions routinely apply to capital requests. Vendors competing on arm price alone are competing over much the smaller of the two numbers involved. Vendors reducing commissioning time and supplying reusable application templates are attacking the number that actually decides whether a project gets approved at all.
Market Impact: Integration runs fully 2.4 times the hardware cost

Reach New Factories During Facility Design

A plant built new designs cell layout, material flow and the safety case together, which removes most of the integration cost that makes retrofit projects marginal. India compounds at 14.1% and Gulf industrial programmes are funding manufacturing capacity built from nothing at all. Reaching those projects means engaging with plant engineering and design contractors rather than with procurement, since the decision is effectively made when the layout is drawn. Vendors arriving only at the equipment purchase stage find the cell has already been designed around somebody else's controller and programming environment.
Market Impact: India alone compounds at fully 14.1% each year

Treat Commissioning Capacity As A Product

Roughly 1 trained programmer exists for every 14 deployed robots, and manufacturers routinely defer approved and funded projects for want of anybody available to commission them. That is a constraint no hardware improvement addresses in any way at all. Vendors providing graphical programming, tested application templates and actual commissioning capacity as part of the offer remove a barrier that competitors leave standing. It costs real money and it reliably converts deferred approvals into actual installations, which is worth considerably more than the margin protected by declining to fund the work.
Market Impact: A single programmer serves 14 deployed robots today

Defend The Controller Rather Than The Arm

A factory standardises on a single controller and programming environment, trains its own engineers against it and writes all its programmes for it, which makes switching cost far exceed any hardware price difference across a 12 year service life. The commercial position lives entirely in the controller rather than anywhere in the mechanics of the arm itself. Vendors competing on arm specification are defending the substitutable half of the product. Those investing in the programming environment and in engineer training are defending the half that actually holds onto the account.
Market Impact: Robot service life spans a full 12 years

Who Controls the Margin Pool

Five manufacturers hold 52% of programmable robot shipment revenue, and the position is more durable than that figure suggests because factories standardise on one controller and programming environment. FANUC, ABB, Yaskawa, KUKA and Kawasaki Heavy Industries lead. Chinese domestic manufacturers have taken substantial share in their home market specifically. All participants here are assessed on robot shipment revenue rather than on any broader automation revenue.
Competition runs on controller capability, application template libraries and commissioning support far more than on arm specification, since payload and reach are broadly comparable between suppliers at any given class. The second dimension is integration partner coverage, because most projects are delivered by system integrators rather than by the robot manufacturer directly, and integrator familiarity with a particular controller effectively decides a great many of those selections before the customer is involved.

Pressure is emerging from collaborative robot specialists who compete on removing integration cost rather than on hardware performance, and from Chinese manufacturers competing hard on price in their domestic market. Rankings shift where factories are being built new rather than where existing plants replace worn equipment, particularly across India and Southeast Asia where capacity is arriving from nothing.
programmable-robots-market-company-positioning-matrix-1789993893185

Competitive Moat and Risk Dimensions

FANUC

Moat: Controller Standardisation Depth

FANUC controllers are the environment a very large number of factories standardised on, and the engineers in those plants are trained against them while the programmes were written for them. Switching costs far exceed any hardware price difference across a 12 year service life. That position accumulated across decades and cannot be reached by building a better arm.
FANUC

Risk: Retrofit Market Dependency

Controller entrenchment protects existing plants and offers nothing at a factory being built new, where no incumbent standard exists and the decision is made during facility design. India compounds at 14.1% and much of the fastest growth is greenfield. Defending installed positions does not win those projects, which require engagement with plant designers rather than with existing customers.
ABB

Moat: Integrator Network Breadth

ABB has built integrator relationships across an unusually wide range of industries and geographies, which matters because most robot projects are delivered by system integrators rather than by the manufacturer. An integrator familiar with one controller specifies it by default, since the alternative means learning a different environment on the customer's project.
ABB

Risk: Collaborative Segment Exposure

Collaborative robots grow at 12.9% and specialists compete there on removing integration cost rather than on hardware capability, which is a different argument from the one a broad industrial portfolio is built to win. Integrator networks matter less where the customer commissions the robot themselves. That segment reaches buyers who would never have run a conventional robot project.

Players Tracked

Prominent Players

FANUC
ABB
Yaskawa
KUKA
Kawasaki Heavy Industries

Other Key Players

Universal Robots
Mitsubishi Electric
Denso Wave
Epson Robots
Staubli
Comau
Omron Adept
Doosan Robotics
Techman Robot
Estun Automation
Siasun Robot and Automation
Hyundai Robotics
Nachi-Fujikoshi
Zebra Technologies
Locus Robotics

Recent Developments

JUNE 2025

Indian Manufacturers Specify Automation In New Plant Designs

Multiple Indian automotive and electronics manufacturers specified robot automation during the design of new production facilities, capacity development rather than any corporate transaction. Designing cell layout, material flow and the safety case together removes much of the integration cost that makes retrofit automation projects economically marginal in existing plants.
Signal: A greenfield plant designs around the robot rather than fitting one into a layout built without it.
MARCH 2025

Universal Robots Broadens Application Template Library

Universal Robots broadened its library of tested application templates covering machine tending, palletising and inspection tasks, an organic product development rather than any acquisition. Around one trained programmer exists per fourteen deployed robots, so pre-built application configurations address the constraint that actually defers approved automation projects.
Signal: Commissioning capacity rather than hardware capability is what now determines whether approved projects ever actually proceed.
OCTOBER 2024

Chinese Robot Manufacturers Expand Domestic Production Capacity

Several Chinese robot manufacturers expanded domestic production capacity serving local industrial customers, organic capacity expansion rather than merger activity. Domestic suppliers have taken substantial share in their home market on price and delivery, in a region already holding the highest installed robot density measured anywhere globally.
Signal: Domestic supply competes hardest in exactly the region that already automates far more than anywhere else.

What Building A Robot Costs

Precision reduction gearing accounts for roughly 31% of robot manufacturing cost, sourced from a very small number of Japanese specialists who between them supply most of the industry. Servo motors and drives take around 22%, controllers and electronics about 18%, and mechanical structure, castings and assembly absorb most of the remaining balance across a comparatively labour-intensive build.
Precision gearing supply tightened significantly through 2021 and 2022 as automation demand rose faster than specialist capacity could expand, extending lead times on complete robots well beyond a year in some classes. FANUC Annual Report 2022 and ABB Annual Report 2022 both record component availability as a delivery constraint during that period. Manufacturers holding long-term gearing allocations delivered considerably better than those buying against demand.

The competitive disadvantage mechanism is gearing allocation rather than gearing price. A manufacturer with committed supply can quote delivery dates a customer will plan a plant commissioning around, while one without it cannot commit at all. Exposure concentrates among smaller manufacturers and newer entrants lacking the volume to secure priority allocation, which is a barrier entirely unrelated to how good their robots actually are.
programmable-robots-market-cost-volatility-analysis-1789993893382

Contract Precision Gearing Allocation Long Term

Precision reduction gearing runs roughly 31% of manufacturing cost and comes from a very small group of specialist suppliers. Availability rather than price has repeatedly been the binding constraint on delivery, and committed multi-year allocation lets a manufacturer quote dates customers can plan commissioning around. Manufacturers buying against demand cannot commit to delivery, which loses orders regardless of product quality.

Qualify Second Sources For Servo Components

Servo motors and drives take around 22% of manufacturing cost and, unlike precision gearing, genuine alternative suppliers do exist for many specifications. Qualifying second sources before a shortage arrives costs engineering time against no immediate return and preserves delivery capability when supply tightens. Manufacturers discovering mid-shortage that nothing is qualified have already lost the delivery window entirely.

Invest In Controller Software Over Mechanical Content

Mechanical structure and assembly carry comparatively low margin while the controller and programming environment hold the customer across a 12 year service life. Directing engineering investment toward software rather than toward marginal mechanical improvement builds the position that actually defends the account. Manufacturers competing on payload and reach specification are investing in the substitutable half of their own product.

Portfolio Architecture for Margin Defence

Margin architecture separates on controller content and application specificity. Cartesian and gantry robots earn least, since the mechanics are comparatively simple and many suppliers can build them competently. SCARA and delta robots sit above on speed and precision engineering. Collaborative robots, mobile platforms and high-payload articulated arms earn most, because each carries substantial software content or serves applications where the genuine alternatives are very limited indeed.
The volume versus premium tension runs between hardware and controller rather than between robot classes. Arms are increasingly comparable between suppliers at any given specification, while the controller and programming environment hold the account for a 12 year service life. Manufacturers competing hard on arm price are defending the substitutable half of their product and neglecting the half that actually retains customers.

High-value pools concentrate in collaborative robots and mobile platforms, both of which reach buyers who would never have approved a conventional robot cell. Neither is won on hardware specification. Reaching them requires application templates, accessible programming and commissioning support, which are capabilities that most manufacturers have historically treated as service overhead rather than as genuine product investment deserving engineering funding.

Volume / Commodity-Adjacent

Cartesian and gantry robots and basic articulated arms at lower payloads, where mechanics are comparatively simple and many suppliers compete capably on price. The ten point spread separates manufacturers holding service and spares attachment from those selling equipment transactionally.
Gross Margin: 26% to 36%

Premium / Certified

SCARA, delta and higher-payload articulated robots, where speed, precision and reliability engineering determine selection alongside price. The twelve point spread tracks manufacturing scale and precision gearing allocation, both of which differ considerably between the largest manufacturers and everybody else.
Gross Margin: 40% to 52%

Sustainability / Regulatory / Next-Generation

Collaborative robots, autonomous mobile platforms and controller software, where application templates and programming accessibility rather than mechanical specification determine value. The fourteen point spread reflects software content, which varies enormously across this layer.
Gross Margin: 54% to 68%
programmable-robots-market-portfolio-architecture-1789993893894

High-value Sub-segments and Strategic Watch-out

Collaborative And Force-Limited Robots

Grows at 12.9% by removing fencing and safety assessment work rather than by improving on any underlying hardware capability. The fourteen point spread here reflects underlying software content. Integration typically runs 2.4 times the hardware price, which is precisely the number that this segment attacks directly.
Gross Margin: 54% to 68%

Autonomous Mobile Robots And Guided Vehicles

Grows at 11.6% on incremental deployment that fits the 26 month payback threshold considerably better than one large capital approval does. The fourteen point spread here reflects fleet management software depth. Distribution centres carried almost no installed base at all as recently as a decade ago.
Gross Margin: 54% to 68%

SCARA And High-Speed Assembly Robots

Grows at 7.8% on electronics and precision assembly work of every kind, where cycle time rather than payload capacity determines the entire selection. The twelve point spread here reflects precision engineering depth. Competition here concentrates among the small group of manufacturers holding genuine high-speed engineering capability.
Gross Margin: 40% to 52%

Cartesian And Gantry Robots

Grows at 4.1%, slowest of the six robot classes, on comparatively simple mechanics that a wide range of suppliers can build to a competent standard. The ten point spread reflects service attachment. Very little controller lock-in exists here for a manufacturer to defend a position with.
Gross Margin: 26% to 36%

Why Controllers Hold Accounts

The annuity here lives in the controller rather than in the machine. A plant standardises on one programming environment, trains its engineers against it and writes its programmes for it, so switching means retraining people and rewriting work that already functions. Robots run around 12 years and get expanded, reprogrammed and redeployed throughout. An incumbent supplier is consequently selling into its own installed base for more than a decade.
Stickiness varies sharply by robot class and by who commissions the cell. Articulated arms inside integrated production lines are the most entrenched, since the programme and the process were developed together. Collaborative robots commissioned by the customer's own staff are considerably less locked, because the programming was never specialist work. Mobile robot fleets sit somewhere between, held by fleet management software rather than by anything mechanical.

The buyer has shifted from manufacturing engineering toward plant management and, increasingly, facility design. An engineering function evaluated payload, reach and cycle time. A plant manager evaluates total project cost against a 26 month payback. A facility designer decides during layout whether a robot appears at all. Suppliers still selling on arm specification are addressing the least influential of those three conversations.
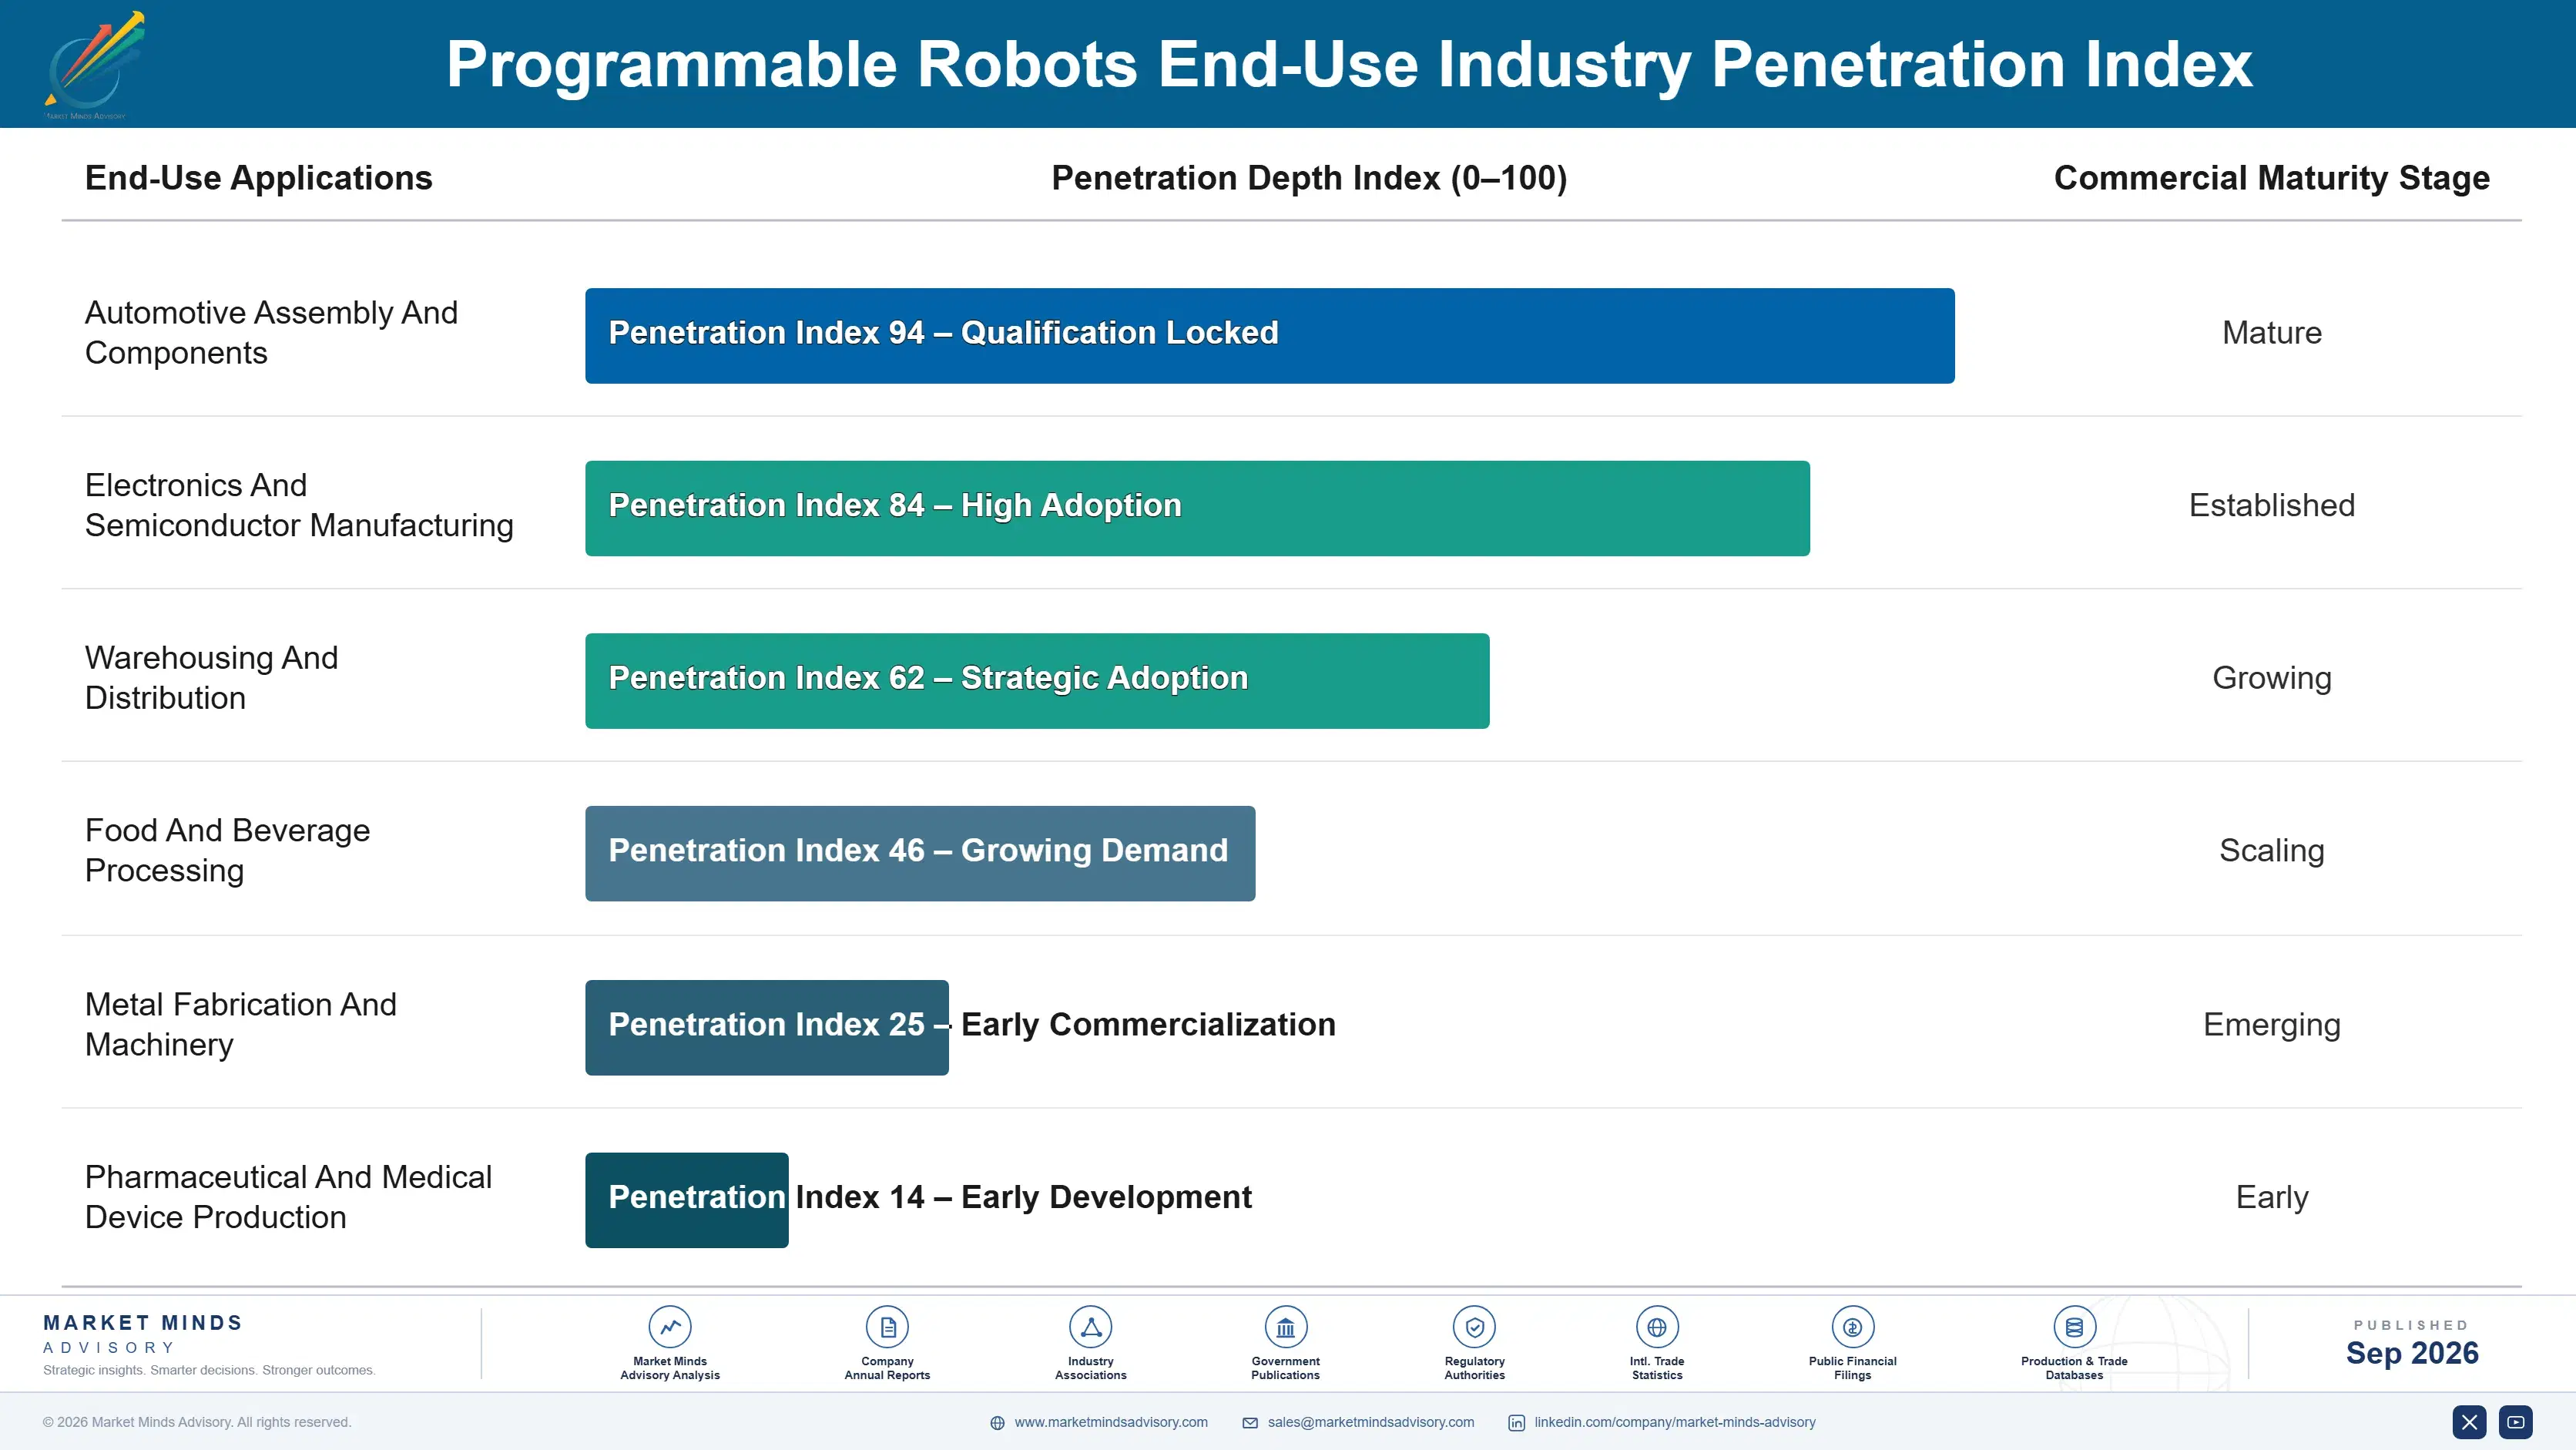
programmable-robots-market-end-use-penetration-index-1789993894390

What Decides Robot Projects

These are among the four positions where our research anticipates prominent divergence between winners and laggards over the coming forecast period. Each is grounded in the demand model, the regulatory perimeter, and the announced capacity pipeline.
01 / PROJECT COST POSITIONING

Attack Integration Cost, Not Hardware Price

Integration, tooling, safety assessment and programming typically run around 2.4 times the robot hardware price, so cutting the arm cost by a fifth moves the total project by only a few percent and rarely brings a marginal application inside the 26 month payback threshold. Vendors competing on arm price alone are competing over much the smaller of the two numbers entirely. Reducing commissioning time and supplying reusable application templates attacks the figure that actually decides whether a project gets approved or shelved.
02 / FACILITY DESIGN ENGAGEMENT

Win The Layout Before The Purchase Order

A plant built new designs its cell layout, material flow and safety case together, which removes most of the integration cost making retrofit projects marginal in existing facilities. India compounds at 14.1%, and much of the fastest growth anywhere in the world is greenfield capacity rather than replacement of anything existing. Reaching those projects means engaging with plant engineering teams and design contractors rather than with procurement, because the decision is effectively made at the moment somebody draws the layout on paper.
03 / COMMISSIONING CAPACITY SUPPLY

Treat Programming Capacity As Product

Roughly one trained robot programmer now exists for every fourteen robots actually deployed, and manufacturers routinely defer projects they have already approved for want of anybody available to commission them properly. That is a constraint that no amount of hardware improvement addresses in any way whatsoever, however good the robot may be. Vendors supplying graphical programming, tested application templates and commissioning capacity within the offer remove a barrier that competitors appear content to leave standing squarely in front of the customer.
04 / CONTROLLER POSITION DEFENCE

Protect The Environment, Not The Mechanics

A factory standardises on a single controller and programming environment, trains its own engineers against it and writes all its programmes for it, which together make the switching cost far exceed any hardware price difference across a full 12 year service life. The commercial position lives entirely in the controller and its programming environment rather than in the mechanics of the arm. Manufacturers competing on payload and reach specification alone are defending the substitutable half of their own product while neglecting the other.

Engagement Snapshot From the Field

A live engagement with an industry participant carrying material or product regulatory and market exposure ahead of a defining policy shift, showing how our research translates into a defensible multi-year portfolio strategy.
MARKET MINDS ADVISORY · CLIENT ENGAGEMENT SUMMARY
Programmable Robots Producer Strategic Portfolio Review and Transition Roadmap 2026·Investment Scenario on Programmable Robots Exposure Evaluation 2025-26
CLIENT PROFILE
A contract electronics manufacturer operating four assembly plants across two countries, with automation deployed unevenly and a growing backlog of approved robot projects that had never been commissioned. Management believed the binding constraint was capital allocation. Plant managers believed it was something else entirely, and nobody had reconciled the two positions with any actual measurement.
STRATEGIC CHALLENGE
Corporate engineering wanted to standardise on a single robot supplier across all four plants to reduce cost, and had negotiated pricing on that basis. Two plant managers objected on grounds nobody had quantified. Meanwhile approved projects sat uncommissioned for periods measured in quarters, and no one had established why that backlog was accumulating.
MMA APPROACH
MMA traced every approved but uncommissioned project across the four plants and established what had actually stalled each one. We compared total project cost against hardware cost for completed installations, and assessed the standardisation proposal against the switching cost at plants already running a different controller. Work drew on 47 expert interviews conducted in Q4 2025 with manufacturers and integrators.
KEY FINDINGS
  1. Every stalled project was waiting on commissioning capacity rather than on capital, with 3 of them approved for more than nine months.
  2. Integration and programming ran around 2.5 times hardware cost across the completed installations, so the negotiated hardware discounts moved project economics very little indeed.
  3. Standardising the two plants already running a different controller would have required retraining every engineer and rewriting existing programmes (client-reported, unverified by MMA).
  4. Collaborative robots commissioned directly by plant staff avoided the specialist bottleneck entirely, and every one of those projects had completed on schedule.
CLIENT PROFILE
A contract electronics manufacturer operating four assembly plants across two countries, with automation deployed unevenly and a growing backlog of approved robot projects that had never been commissioned. Management believed the binding constraint was capital allocation. Plant managers believed it was something else entirely, and nobody had reconciled the two positions with any actual measurement.
STRATEGIC CHALLENGE
Corporate engineering wanted to standardise on a single robot supplier across all four plants to reduce cost, and had negotiated pricing on that basis. Two plant managers objected on grounds nobody had quantified. Meanwhile approved projects sat uncommissioned for periods measured in quarters, and no one had established why that backlog was accumulating.
MMA APPROACH
MMA traced every approved but uncommissioned project across the four plants and established what had actually stalled each one. We compared total project cost against hardware cost for completed installations, and assessed the standardisation proposal against the switching cost at plants already running a different controller. Work drew on 47 expert interviews conducted in Q4 2025 with manufacturers and integrators.
KEY FINDINGS
  1. Every stalled project was waiting on commissioning capacity rather than on capital, with 3 of them approved for more than nine months.
  2. Integration and programming ran around 2.5 times hardware cost across the completed installations, so the negotiated hardware discounts moved project economics very little indeed.
  3. Standardising the two plants already running a different controller would have required retraining every engineer and rewriting existing programmes (client-reported, unverified by MMA).
  4. Collaborative robots commissioned directly by plant staff avoided the specialist bottleneck entirely, and every one of those projects had completed on schedule.
RECOMMENDED STRATEGY
Phase 1: Phase one: fund commissioning capacity directly, since that constraint rather than capital allocation was holding every stalled project across the network. Phase 2: Phase two: standardise controllers only at the plants without an already established environment, rather than forcing switching where working programmes already exist. Phase 3: Phase three: prefer collaborative robots wherever the payload permits, because plant staff can commission them without waiting for scarce specialist capacity.
OUTCOME
The manufacturer funded commissioning capacity and cleared most of the stalled backlog within two quarters (client-reported, unverified by MMA). Standardisation proceeded only at the two plants without an existing controller environment. Project approvals are now assessed against commissioning availability rather than capital alone, which is the change that outlasted the engagement.

Frequently Asked Questions

Foundational context covering the market sizes, CAGR, scope, country, region and competition that inform every finding below. This section is provided to cover basics and most often pre-purchase conversations, answered from the MMA Primary Research Dataset.

What is the current size of the Programmable Robots Market?

Global value reaches USD 23.7 billion in 2026, measured as robot shipment revenue across six robot classes. The 2025 base for the market is USD 21.8 billion.

How large will the Programmable Robots Market be by 2036?

The market reaches USD 54.1 billion by 2036, an increase of USD 30.4 billion across the forecast period. That represents 2.28 times expansion from the 2026 base.

What is the CAGR for the Programmable Robots Market 2026 to 2036?

The base case runs at 8.6% annually, with a bull case at 9.8% if programming becomes accessible to production engineers and a bear case at 7.3% if integration cost proves stickier than expected.

Which segment is growing fastest?

Collaborative and force-limited robots grow at 12.9%, half again the market rate of 8.6%. They remove fencing and safety assessment work, which dominates project integration cost.

Who are the major companies in the Programmable Robots Market?

FANUC, ABB, Yaskawa, KUKA and Kawasaki Heavy Industries lead on robot shipment revenue, together holding 52%. Universal Robots, Denso Wave and Staubli hold smaller positions.

Which country is growing fastest?

India leads at 14.1%, on manufacturing capacity built new that specifies automation during facility design rather than retrofitting it. Vietnam and Mexico follow behind it.

Report Segmentation Architecture

The full report scope spans multiple orthogonal segmentation dimensions, with cross-tabulated demand data provided for each dimension pair. Coverage extends further to regional breakdowns, trend trajectories, and the competitive detail needed to support segment-level decision-making.

By Robot Class

  • Collaborative And Force-Limited Robots
  • Autonomous Mobile Robots And Automated Guided Vehicles
  • Articulated Industrial Robots
  • SCARA And High-Speed Assembly Robots
  • Delta And Parallel-Kinematic Robots
  • Cartesian And Gantry Robots

By End-Use Industry

  • Automotive Assembly And Components
  • Electronics And Semiconductor Manufacturing
  • Warehousing And Distribution
  • Food And Beverage Processing
  • Metal Fabrication And Machinery
  • Pharmaceutical And Medical Device Production

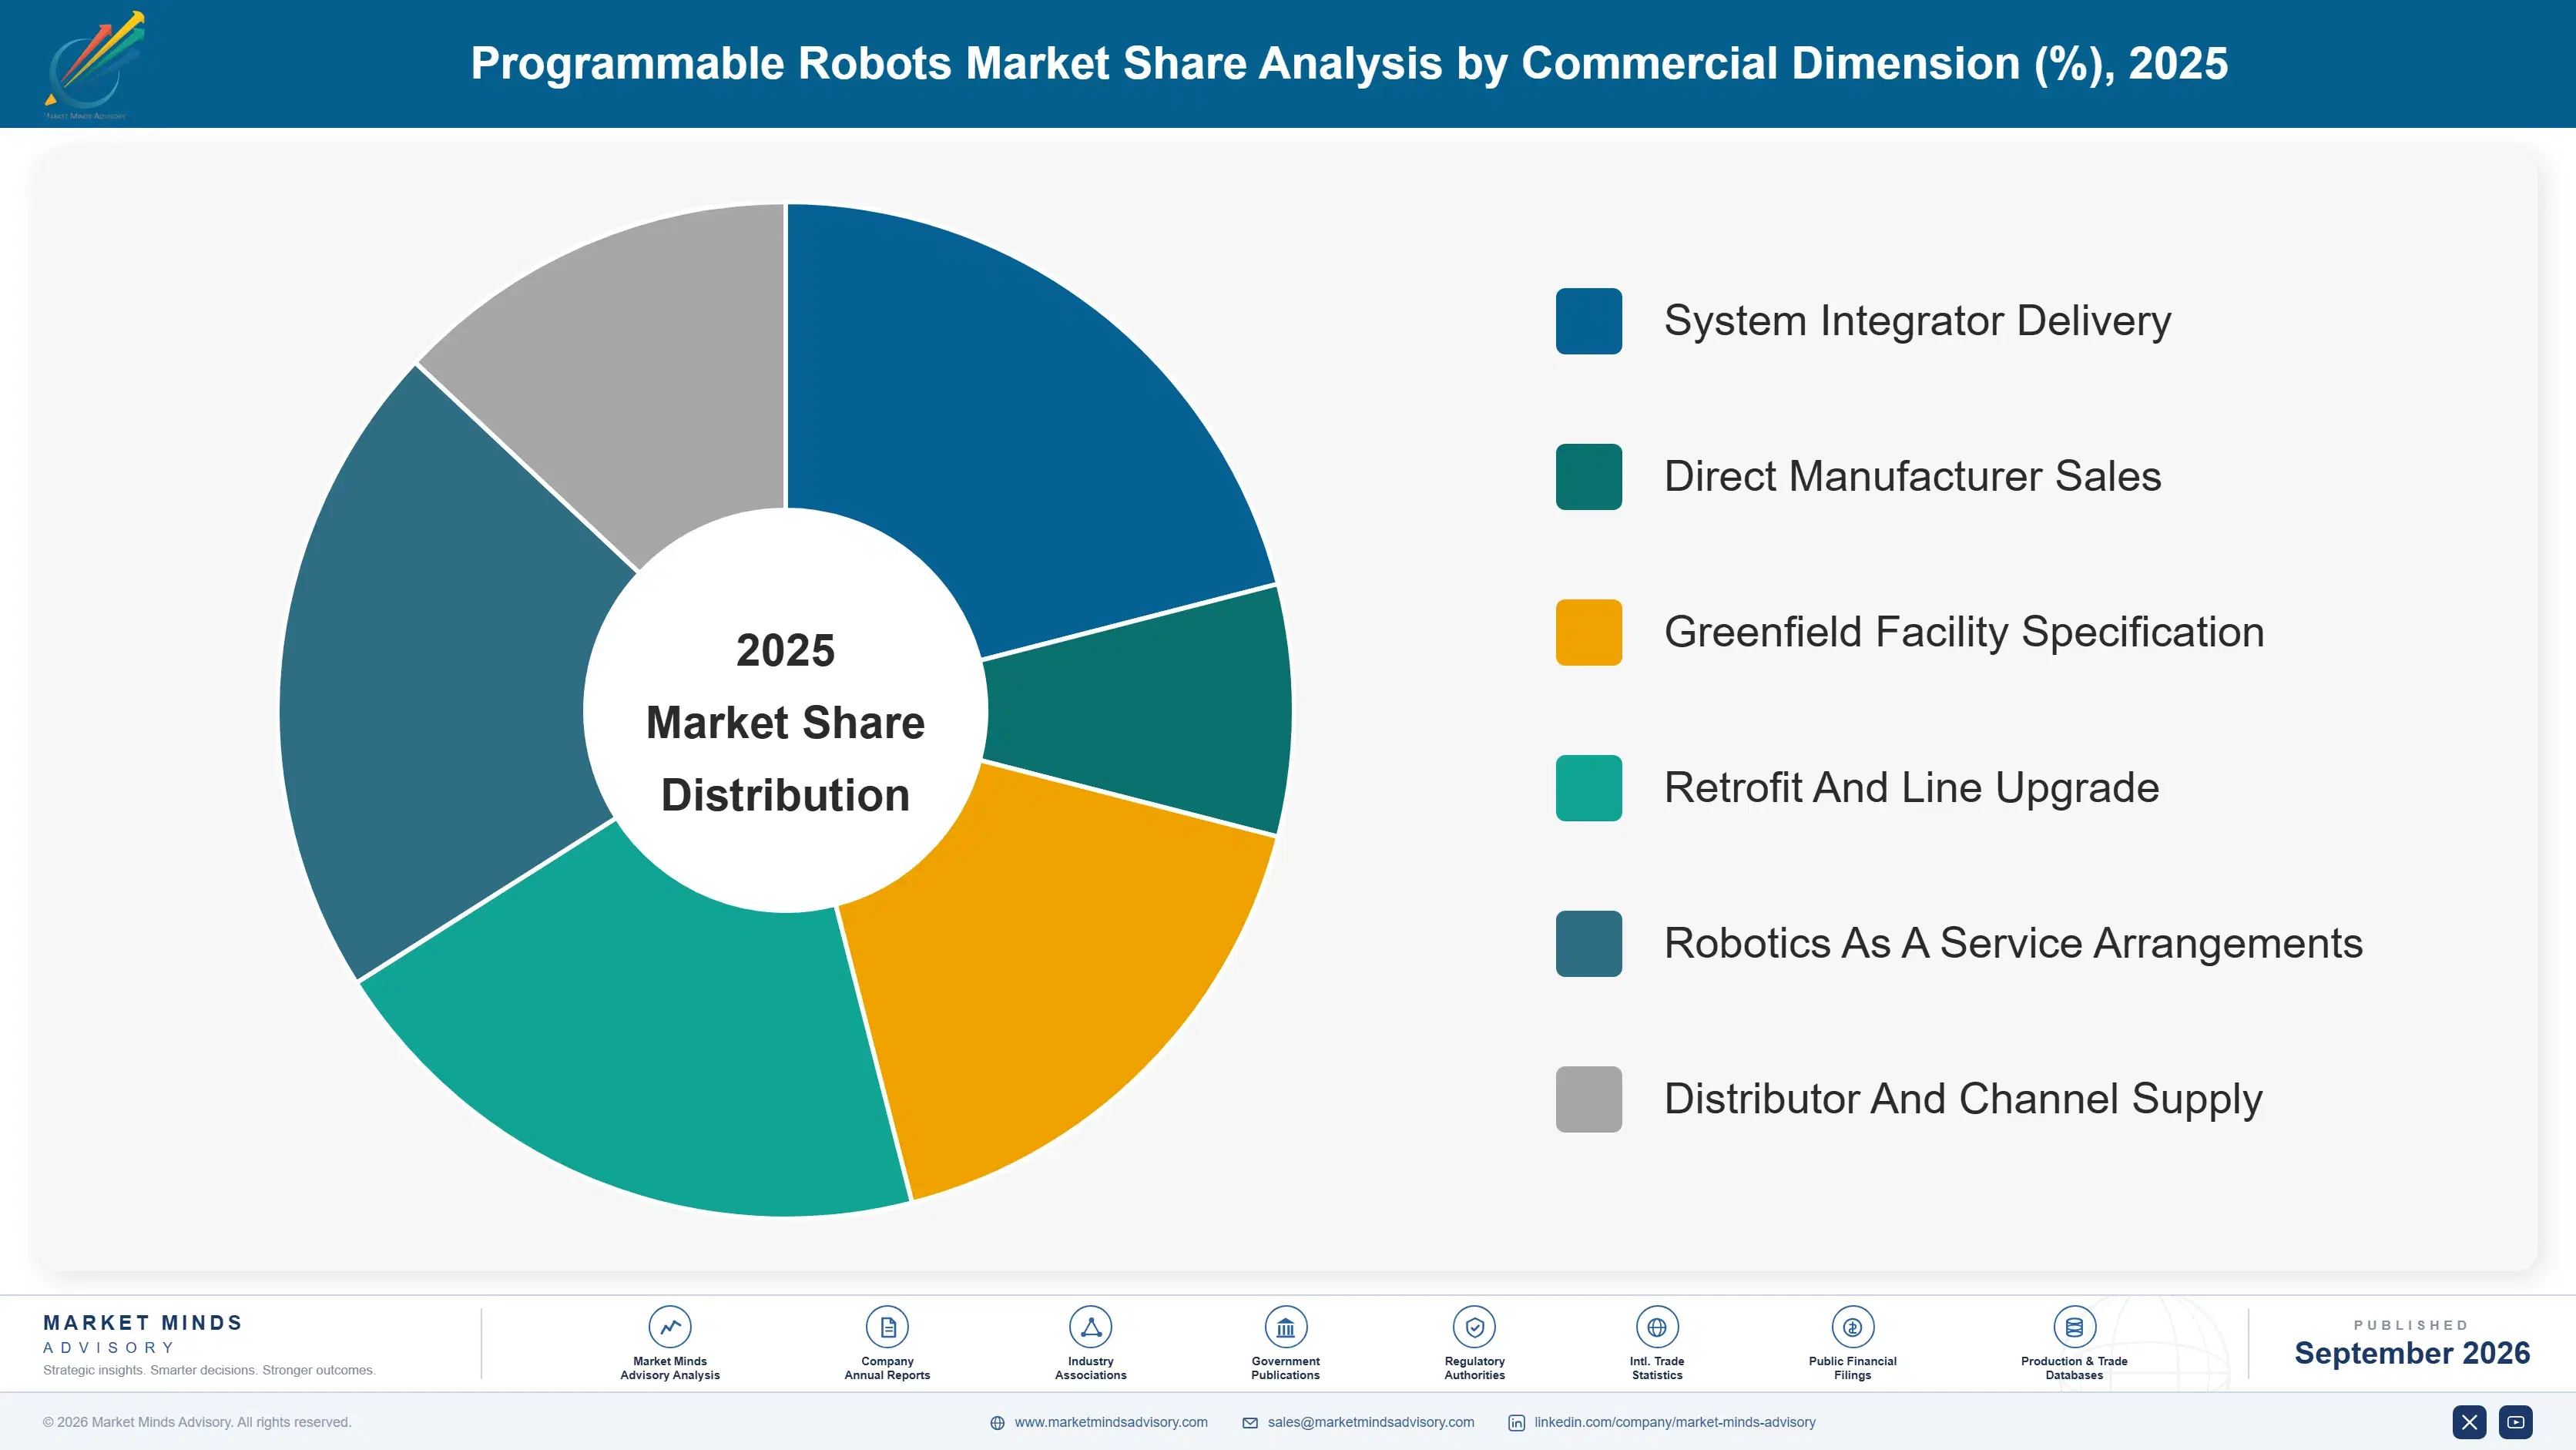
By Commercial Dimension

  • System Integrator Delivery
  • Direct Manufacturer Sales
  • Greenfield Facility Specification
  • Retrofit And Line Upgrade
  • Robotics As A Service Arrangements
  • Distributor And Channel Supply

By Region

  • North America
  • Western Europe
  • East Asia
  • South Asia and Pacific
  • Latin America
  • Middle East and Africa
  • Eastern Europe

Scope, Methodology, and Coverage

Every figure in this report is reproducible from documented input assumptions. The scope below maps the historical period, the forecast horizon, the segmentation dimensions, and the countries covered, alongside the underlying primary and qualitative methodology.
Historical Period
2020 to 2025
Forecast Period
2026 to 2036
Base Year
2025 (USD billions; MMA Primary Research Dataset, September 2026)
Market Definition
This report covers programmable industrial and service robots by robot class: articulated industrial robots, collaborative and force-limited robots, SCARA and high-speed assembly robots, delta and parallel-kinematic robots, autonomous mobile robots and automated guided vehicles, and Cartesian and gantry robots. It excludes end-of-arm tooling sold separately, machine vision systems, integration and programming services, fixed automation and hard-tooled machinery, consumer and educational robots, and surgical robotic systems.
Quantitative Units
USD millions, robot shipment revenue basis; installed units; robot density per ten thousand manufacturing employees; integration cost as a multiple of hardware price; payback period and service life in months and years.
Segmentation Dimensions
Robot class; end-use industry; commercial delivery route and deployment model; geography across seven regions.
Regions Covered
North America, Western Europe, East Asia, South Asia and Pacific, Latin America, Middle East and Africa, Eastern Europe
Countries Covered
China, Japan, South Korea, Singapore, Taiwan, India, Vietnam, Thailand, Australia, United States, Canada, Mexico, Brazil, Germany, Italy, France, Spain, Poland, Czechia, South Africa.
Key Companies Profiled
FANUC, ABB, Yaskawa, KUKA, Kawasaki Heavy Industries, Universal Robots, Mitsubishi Electric, Denso Wave, Epson Robots, Staubli, Comau, Doosan Robotics, Estun Automation, Hyundai Robotics, Locus Robotics.
Quantitative Methodology
Primary survey, n=3,800 respondents, Q4 2025, six countries; demand-side model with trade association cross-validation
Qualitative Methodology
47 expert interviews, Q4 2025; applied to validate demand model assumptions, identify emerging dynamics, and assess competitive positioning
Report Format
PDF and XLSX data workbook (Word format preview document)
Publisher
Market Minds Advisory
Report Code
MMA-2026-CON-681
Published
September 2026
Contact
sales@marketmindsadvisory.com | www.marketmindsadvisory.com

Purchase the full Programmable Robots Market Report (2026 to 2036).

This report sizes the global programmable robots market from 2026 to 2036 across six robot classes, six end-use industries and seven regions. It explains why falling hardware prices have not produced the adoption wave repeatedly forecast, quantifying integration and programming at around 2.4 times the robot price against a 26 month payback threshold. The programming skill shortage at roughly one specialist per fourteen deployed robots is analysed as a direct constraint on installations. Manufacturing cost composition is sourced to company annual reports. Regional analysis explains why East Asia holds 44% of demand.
Six robot classes sized through to 2036
Integration cost quantified against hardware price directly
Programming capacity constraint measured across major markets
Twenty named manufacturers assessed on shipment revenue
Four revenue levers with quantified commercial impact
Anonymised electronics manufacturer automation engagement documented in full

Built For The People Who Decide

From boardroom strategy to bench-side execution, this report is read cover-to-cover by leaders shaping the next decade of their industry, turning demand scenarios, market dynamics and valuation benchmarks into decisions.
CXOs/ Presidents/ VPs/ Managers
M&A and Corporate Development
Strategy Teams and R&D Heads
Procurement and Product Directors
Regulatory and Compliance Leaders
Investor Relations and Equity Analysts