Market Minds Advisory
Professional Services Automation Software Market

Professional Services Automation Software Market: Professional Services Automation Software Market. Resource Planning, Time Tracking, and Revenue Recognition Platforms, 2026 to 2036

Professional services firms squeezed between client pressure for fixed-fee pricing and rising talent costs are turning to automation software to protect margins that manual spreadsheet-based resourcing can no longer reliably defend.

Lead Analyst

Published

September 2026

Make Smarter Decisions with Customized Research Insights

Request a free sample report and evaluate market opportunities, growth trends, and competitive dynamics relevant to your business needs.

2025 MARKET VALUE$5.4BMarket Size 2025
2036 FORECAST VALUE$15.4BBase Case , 2026 to 2036
CAGR 2026 TO 203610.0 %Bull 11.2% / Bear 8.8%
INCREMENTAL OPPORTUNITY$9.5BNet 10- year value creation
EXPANSION MULTIPLE2.59x2036 value over 2026 base
Strategic Levers
M&A Pipeline
Regional Outlook
Country Rankings
Competitive Intelligence
Segmental Deep-dive
Call-Us : 91 93563 13602

Executive Snapshot and Market Trajectory.

Professional services firms are replacing spreadsheet-based resourcing with dedicated automation software as margin pressure from fixed-fee client contracts collides with rising talent costs across nearly every practice area and geography, making utilization visibility a genuine competitive necessity rather than a back-office nicety anymore for firms of any size.
AI-driven resource planning and utilization optimization is growing fastest as firms deploy predictive staffing tools that match project demand against consultant skills and availability automatically, reducing the bench time that erodes margin most directly across every practice group. North America leads regional demand given its concentration of large consulting, IT services, and creative agency headquarters driving enterprise software adoption at scale nationwide.
Competitive character increasingly centers on depth of financial integration rather than project management features alone, since firms now demand native revenue recognition and billing automation tightly coupled to resourcing data rather than bolted-on accounting connectors that require constant manual reconciliation each billing cycle. Vendors offering only shallow integrations are steadily losing ground to platforms built around this specific workflow from the outset, and consolidation among smaller point-solution vendors has picked up noticeably as a result.
Market Definition
The Professional Services Automation Software Market covers platforms that manage project resourcing, time and expense tracking, billing, and revenue recognition specifically for consulting, IT services, agency, and similar billable-hour businesses. It excludes general-purpose project management tools, enterprise resource planning suites, and accounting software that lacks native billable-services workflow support.
Base Year Value
$5.4B in 2025 (MMA Primary Research Dataset, September 2026)
Forecast Period
2026 to 2036, eleven discrete annual values
CAGR
10.0% base case. Bull 11.2%. Bear 8.8%.
Fastest Growth Segment
AI-Driven Resource Planning and Utilization Optimization: 14.0% CAGR
Fastest Growth Country
Ireland: 13.0% CAGR
Fastest Growth Region
South Asia and Pacific: 12.0% CAGR
Largest Region
North America: 31% of 2025 global value
Market Leaders
Leading vendors: Kantata, Certinia, Deltek, Oracle NetSuite, Replicon. Source: MMA Primary Research Dataset, July 2026.
Primary Survey
n=3,800 procurement and R&D decision-makers, Q4 2025, six countries
Methodology
Demand-side build-up, cross-validated against public data, 47 expert interviews

Professional Services Automation Software Market Forecast Scenarios

professional-services-automation-software-market-size-forecast-scenario-1789993162416
Growth through 2020 to 2025 was steady rather than explosive, as most mid-sized professional services firms treated resourcing software as a nice-to-have upgrade from spreadsheets rather than a genuine strategic priority worth significant budget. Adoption accelerated gradually as remote and hybrid work made informal resourcing coordination noticeably harder to sustain across distributed teams working from multiple time zones.
Base case growth through 2036 rests on three commercial mechanisms: rising fixed-fee and outcome-based client contracts that punish poor utilization directly and immediately across every engagement, broader adoption of AI-driven staffing recommendation tools that were previously limited to the largest global consultancies with dedicated data science teams, and tighter integration demands linking resourcing data to revenue recognition as finance teams gain more say in software procurement decisions across the buying committee.
A bull scenario turns on faster enterprise adoption as AI staffing tools prove their return on investment convincingly across more industry verticals, pulling budget away from generic project management tools entirely and permanently. The bear risk is that broader horizontal work management platforms add enough PSA-specific features to satisfy smaller firms without requiring a dedicated standalone purchase at all.

The Economics Behind Utilization-Driven Software Buying

Professional services firms operate on a fundamentally different economic model than product companies, since billable hours and utilization rates determine profitability far more directly than revenue growth alone matters to their bottom line each quarter. Software that cannot connect resourcing decisions to margin outcomes in near real time increasingly fails to justify its own subscription cost to skeptical finance leadership evaluating every renewal closely.
MARKET CONCENTRATIONCR5: 35%Top five vendors hold roughly a third of the market
AVERAGE ANNUAL CONTRACT VALUE$38,000Typical mid-market firm annual subscription spend across seats deployed
TOP ADOPTING COUNTRY SHAREUSA: 34%Reflects concentration of large consulting and IT services headquarters
CONSULTANT UTILIZATION RATE UPLIFT9 percentage pointsAverage improvement firms report after full platform deployment completes
IMPLEMENTATION TIMELINE3 to 5 monthsTypical time from contract signing to full firm-wide rollout
CUSTOMER RENEWAL RATE91%Annual subscription renewal rate reported across leading platform vendors
Vendors compete less on feature breadth today and more on how tightly resourcing, billing, and revenue recognition data flow together without manual reconciliation, since firms have grown tired of stitching together separate point solutions that each solve one piece of the workflow while leaving finance teams to reconcile everything manually at month end using spreadsheets and workarounds that introduce errors.
AI-driven staffing recommendation tools have moved from an experimental add-on to a genuine purchasing criterion within the past two years, as firms increasingly expect software to proactively flag bench risk and suggest optimal project staffing rather than simply displaying utilization dashboards after the damage from poor assignment decisions has already occurred and margin has already been lost for that particular engagement.
"Firms buying this software for the project management dashboards are missing the point entirely. The vendors winning deals right now are the ones who can prove a direct line from their software to next quarter's realized margin."
Practice Lead, Professional Services and Enterprise Software Research · MMA Technology Practice · September 2026

Market Trends

AI Staffing Recommendations Become a Standard Purchasing Requirement

Vendors across the category have rushed to add AI-driven resource matching capability over the past two years, moving from simple skill-tag filtering to genuinely predictive models that weigh consultant availability, project margin targets, and career development goals simultaneously when suggesting staffing assignments across an entire firm's active project portfolio. Several leading platforms report that customers using these recommendation features see utilization improve measurably faster than customers relying on manual staffing decisions, and RFPs from larger firms now routinely list AI-driven matching as a required rather than optional evaluation criterion during vendor selection.
Market Impact: Fixed-fee mix exceeds 45%
Finance Teams Gain Greater Influence Over Software Procurement

Purchasing decisions that once sat entirely with operations or delivery leadership increasingly involve finance teams directly and early, since revenue recognition compliance and margin visibility have become board-level concerns at firms managing complex multi-year, multi-currency client engagements spanning several jurisdictions and multiple accounting standards at once. This shift has pushed vendors to build deeper native accounting integrations and audit-ready reporting rather than treating financial connectivity as an afterthought add-on, and several vendors have restructured entire product roadmaps around finance-team requirements specifically over the past eighteen months, hiring dedicated finance-focused product managers.
Market Impact: Distributed teams: 60% of engagements

Market Opportunities and Growth Drivers

Fixed-Fee Contracts Expose Firms to Direct Margin Risk

Clients across consulting, IT services, and creative agencies increasingly demand fixed-fee or outcome-based pricing rather than open-ended time and materials billing, shifting scope overrun risk entirely onto the services firm rather than the client purchasing the engagement in the first place. Firms without accurate real-time utilization and margin visibility routinely discover a project has gone unprofitable only after the engagement closes, well past the point where corrective action was still possible, and several large consultancies have publicly cited fixed-fee mix growth as a direct driver of their software modernization investment.
Market Impact: Implementations run 3 to 5 months

Remote and Distributed Delivery Teams Require Digital Coordination

Professional services delivery has become genuinely global and distributed, with project teams routinely spanning multiple offices and time zones on a single client engagement in ways that were far less common before widespread remote work adoption reshaped how firms staff and manage every project. Informal resourcing coordination through hallway conversations and shared spreadsheets simply does not scale across distributed teams, pushing firms toward dedicated software that gives every stakeholder the same real-time view of who is available and what they are already committed to across the entire active project portfolio.
Market Impact: Horizontal tools undercut price by 40%

Market Restraints and Challenges

Implementation Complexity Deters Smaller Services Firms

Full deployment of a professional services automation platform typically requires migrating historical project, billing, and consultant data from a patchwork of spreadsheets and legacy accounting systems, and the root cause is that most smaller firms never standardized their internal processes enough to make migration genuinely straightforward. Implementation timelines routinely stretch past initial estimates as a result, and vendors are mitigating the friction by offering pre-built templates for common practice types and dedicated onboarding specialists who guide firms through data cleanup before go-live rather than leaving it entirely to internal staff.
Market Impact: Utilization improves 9 points faster

Horizontal Work Management Platforms Compete on Price

General-purpose work management tools like Asana, Monday.com, and Smartsheet have added enough billing and resourcing features to satisfy smaller firms that do not need the deeper financial integration dedicated PSA platforms provide, and the underlying cause is that these horizontal platforms already have large existing user bases and meaningfully lower price points that make switching costs feel unjustified for simpler practices with basic needs. PSA vendors are mitigating this by emphasizing revenue recognition compliance and deeper reporting capability that horizontal tools genuinely cannot match at any price point currently offered.
Market Impact: Finance-led deals now 42% of sales
3 additional market trends, 2 additional growth drivers, and 4 additional restraints and challenges are covered in the full report. Contact sales@marketmindsadvisory.com to access the complete intelligence.

Segment CAGR and Growth Architecture

The market divides into five segments by functional capability, spanning AI-driven resource planning and utilization optimization, time and expense tracking, billing and revenue recognition, project and portfolio management, and analytics and business intelligence reporting, each addressing a distinct workflow step within the professional services delivery lifecycle from initial project staffing through final client invoicing.
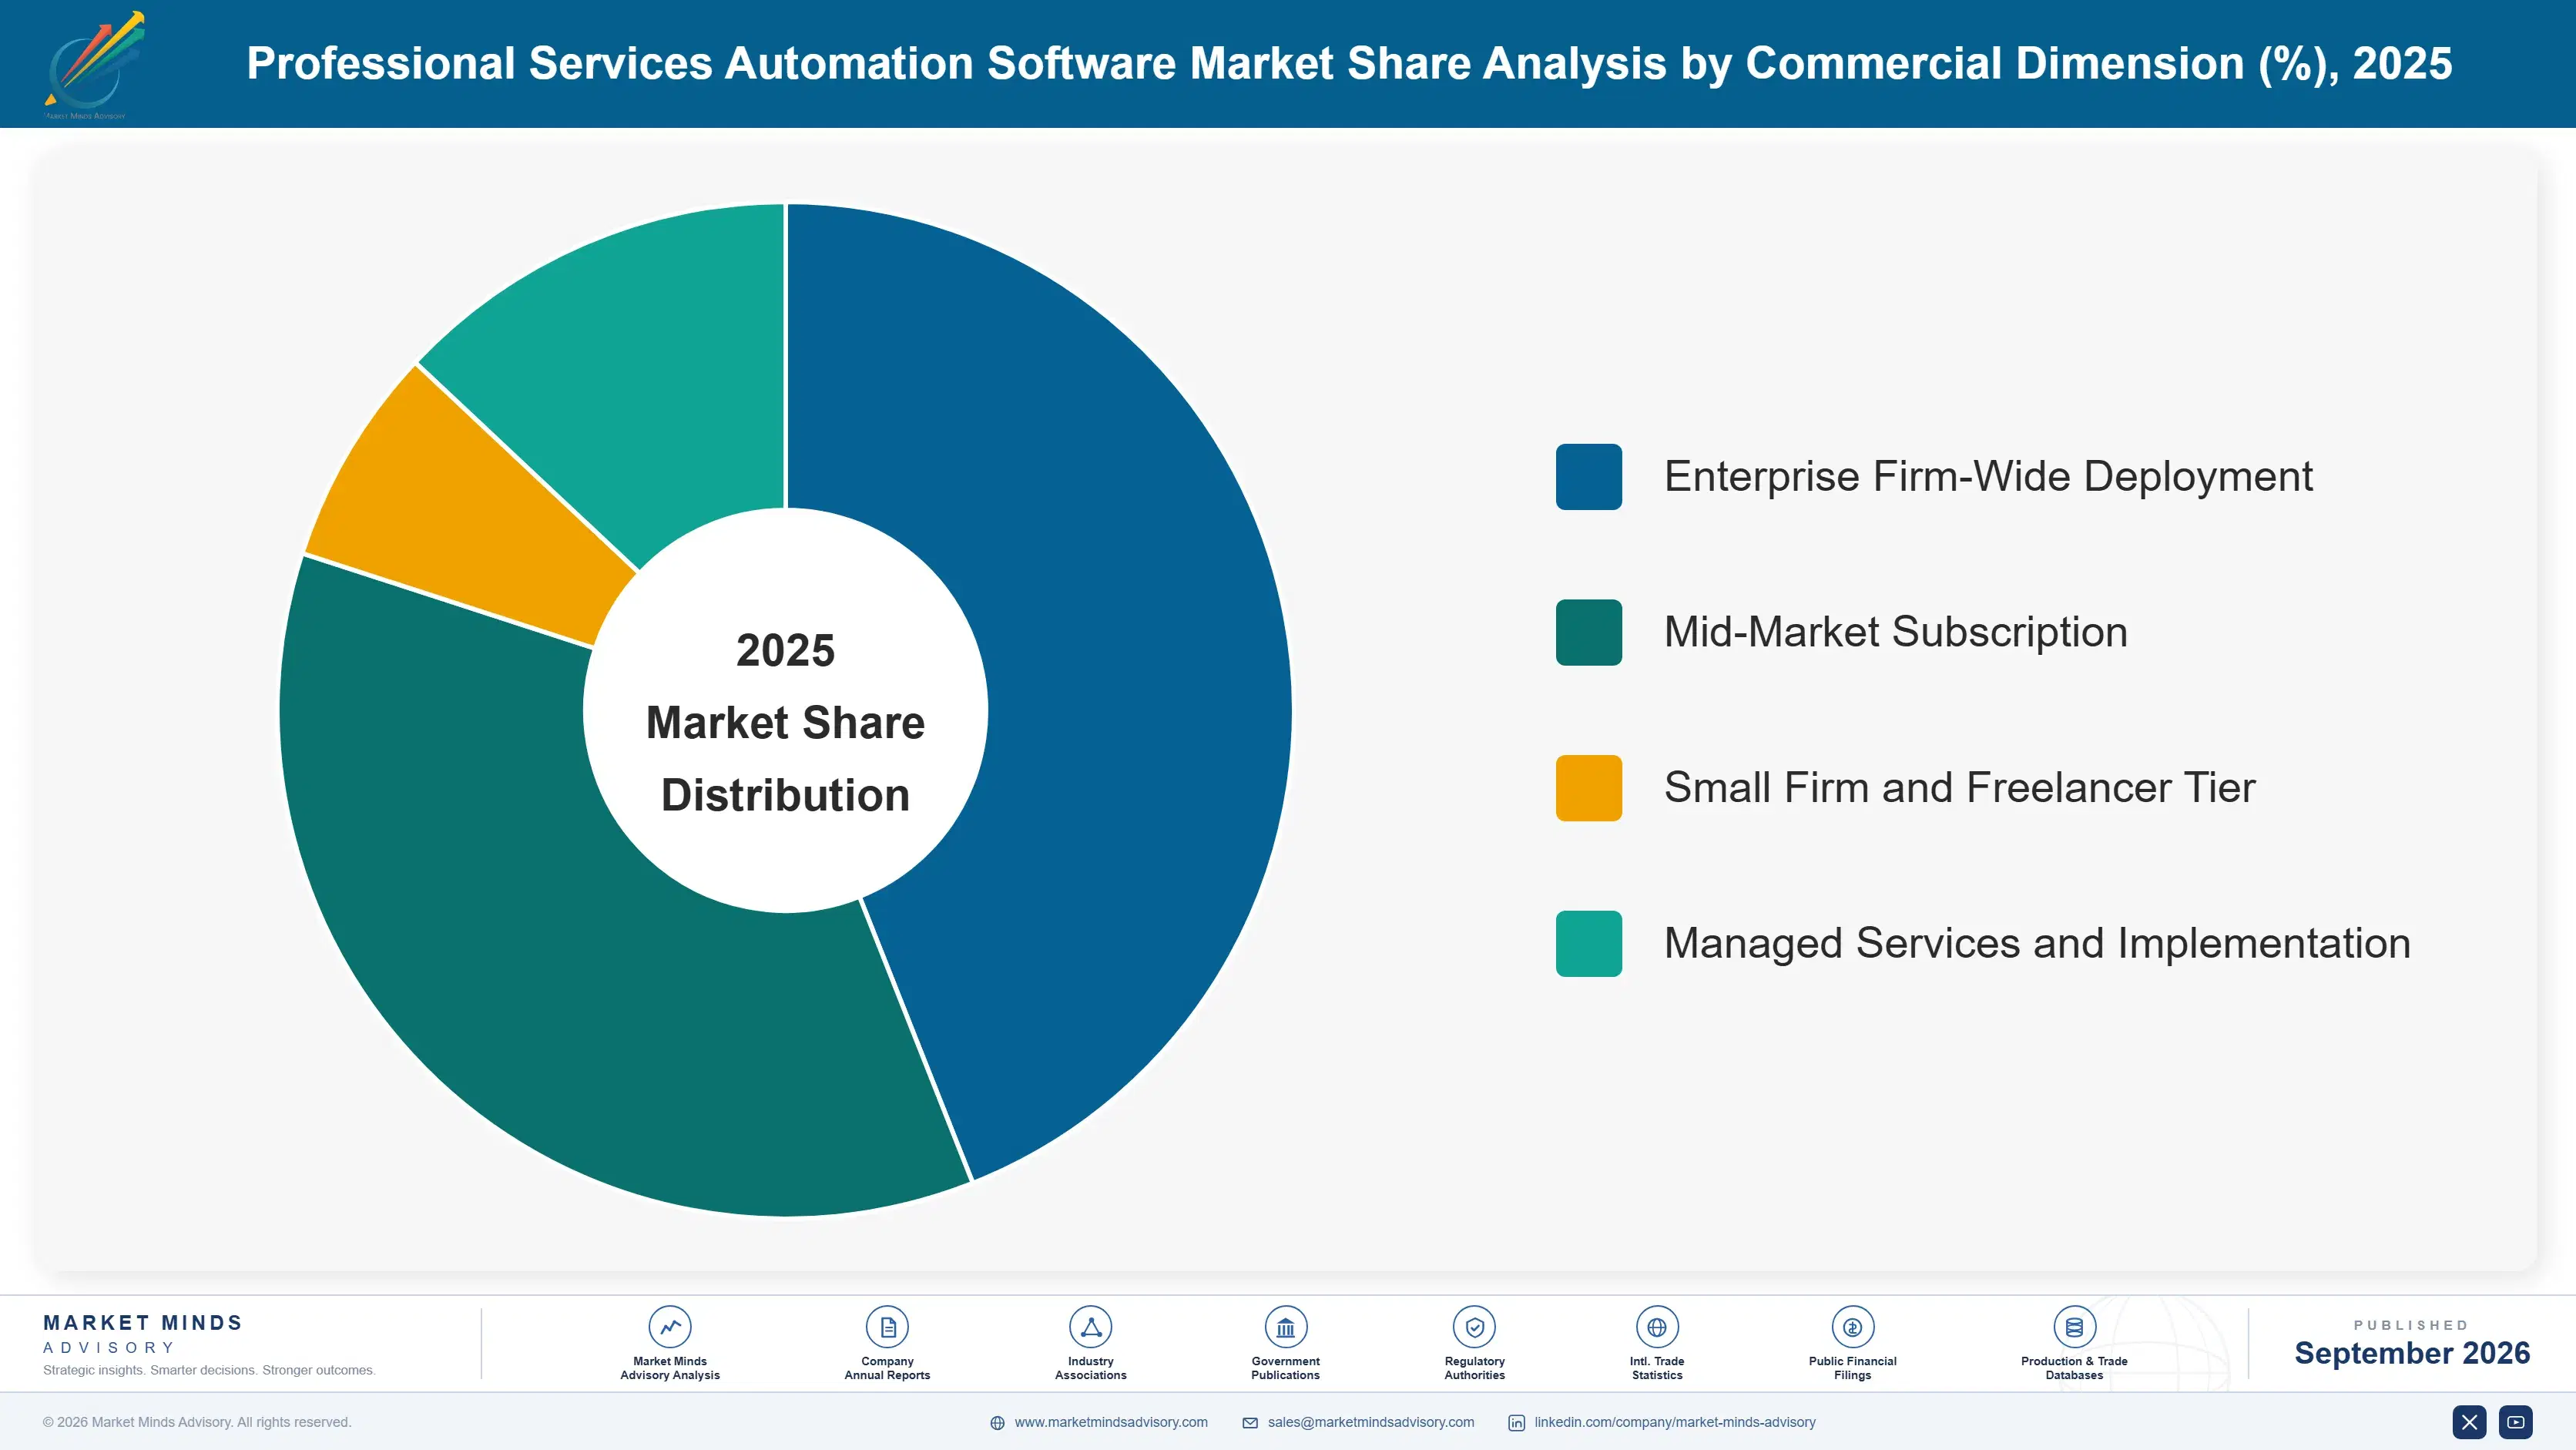
professional-services-automation-software-market-market-share-analysis-1789993163024

AI-Driven Resource Planning and Utilization Optimization

AI-driven resource planning and utilization optimization is growing fastest as firms move beyond passive dashboards toward software that actively recommends staffing assignments based on consultant skills, availability, career development goals, and project margin targets calculated simultaneously across the entire active portfolio in real time rather than reviewed weekly in a static spreadsheet report. Vendors have invested heavily in this capability specifically because it maps directly to the utilization metric that determines profitability at professional services firms, making it the single easiest capability to justify budget for during procurement conversations with skeptical finance stakeholders who demand measurable return on investment before approving any new software spend at all this fiscal year.
CAGR 14.0%

Billing and Revenue Recognition Software

Billing and revenue recognition software has become the second-fastest-growing segment as finance teams gain far more influence over software procurement decisions and demand native compliance with complex, multi-element revenue recognition standards rather than relying on manual spreadsheet calculations prone to error at month end close and annual audit review by external accountants and auditors. This segment increasingly determines vendor selection at larger firms managing complex multi-year, multi-currency engagements, since resourcing and project management capability alone can no longer justify a platform purchase without genuinely deep native financial integration built specifically for billable-services businesses rather than adapted from generic accounting software originally designed for product companies selling physical goods to consumers.
CAGR 12.0%
Full segment breakdown across 5 segments available in the complete report.

Regional Architecture and Country Demand Map

North America leads on the sheer concentration of large consulting, IT services, and creative agency headquarters driving enterprise software adoption at scale nationwide, while East Asia and Western Europe follow with substantial demand from their own established professional services sectors and increasingly digitized delivery models.

North America

Large American consulting firms, IT services integrators, and creative agencies collectively represent the single largest buyer concentration for professional services automation software anywhere in the world, with enterprise deals routinely running into hundreds of seats per contract at the largest global consultancies headquartered across the country and its major metropolitan business centers nationwide and beyond. Fixed-fee client pricing pressure has intensified noticeably across the technology consulting sector specifically, pushing firms to adopt AI-driven staffing tools faster than their counterparts in most other regions worldwide. Canadian firms contribute a smaller but steady secondary demand pool, often adopting software through cross-border corporate parent relationships with larger American consultancies operating on shared technology platforms.
Share: 31% | CAGR: 11.2% (2026 to 2036)

Western Europe

German and British consultancies drive the bulk of Western European demand, with London serving as a genuine regional hub for financial and management consulting firms managing complex multi-currency, multi-jurisdiction client engagements that require sophisticated revenue recognition capability built into their core systems. Ireland has emerged as a notably fast-growing pocket within the region, reflecting its concentration of multinational professional services and technology firm European headquarters operations based there for tax and talent reasons. French firms have adopted more cautiously, often citing data residency requirements and integration concerns with legacy national accounting systems as reasons for slower rollout timelines. Growth trails North America given generally smaller average firm size across most of the region overall.
Share: 22% | CAGR: 8.7% (2026 to 2036)
Regional intelligence for 5 additional markets available in the complete report: East Asia, South Asia and Pacific, Latin America, Middle East and Africa, Eastern Europe. Contact sales@marketmindsadvisory.com.
professional-services-automation-software-market-country-cagr-analysis-1789993163540

Where Margin Actually Comes From

Beyond raw seat count growth, four distinct commercial mechanisms determine which vendors actually expand margin rather than simply chasing subscriber growth alone each fiscal quarter of the year: AI feature upselling to the existing installed base, finance-team-led expansion deals, vertical practice specialization, and services attach revenue layered on top of the core software subscription itself.

Upselling AI Staffing Modules to Existing Base Customers

Vendors that launch AI-driven staffing recommendation modules as a paid add-on to existing customers rather than bundling it into base pricing capture meaningful incremental revenue per account, since customers who have already proven utilization improves by even a few percentage points readily justify the extra spend on a proven capability that pays for itself quickly. Several leading platforms report add-on attach rates approaching 35% within the first year of launching these modules, turning an already-installed customer base into the single fastest-growing revenue line without requiring any new logo acquisition at all this year.
Market Impact: AI module attach rate now near 35% overall

Expanding Seat Count Through Finance Team Champions

Deals initiated or expanded by finance team champions rather than operations leadership tend to close at meaningfully higher contract values, since finance stakeholders push for firm-wide rollout across every practice group rather than a limited pilot deployment confined to just one division or office within the entire firm as a whole entity. Vendors that build dedicated finance-focused sales motions, complete with compliance-oriented product demonstrations and audit-ready reporting samples, report expansion deal values running 2 to 3 times larger than deals originated through operations contacts alone across the entire customer base.
Market Impact: Finance-led deals run 2 to 3x larger overall

Building Deeper Vertical Practice-Specific Product Configurations

Vendors that build pre-configured workflows tailored to specific practice types, such as architecture and engineering firms or management consultancies, win deals faster and command premium pricing over generic configurable platforms that require lengthy customization before go-live can even begin in earnest at all for these particular kinds of buyers. Practice-specific templates reduce implementation time meaningfully, and several vendors have found that verticalized go-to-market motions targeting a single practice type produce win rates roughly 20% higher than horizontal sales approaches targeting any professional services firm regardless of specialty or overall size.
Market Impact: Vertical templates lift win rates 20% or more

Layering Managed Implementation and Advisory Services

Vendors increasingly bundle paid implementation, data migration, and ongoing advisory services on top of the core software subscription, capturing revenue that would otherwise flow to independent systems integrators or consultants hired separately by the customer during rollout and well beyond that initial phase. Services attach revenue now represents a meaningful share of total contract value at several leading vendors, sometimes exceeding 15% of first-year deal value, and this bundling also deepens customer relationships and reduces churn risk since switching vendors means re-doing a costly implementation entirely from scratch at considerable expense.
Market Impact: Services attach reaches over 15% of deal value

Who Controls the Margin Pool

Competitive concentration sits at a moderate CR5 near 35%, evaluated on annualized recurring revenue across the category, leaving meaningful daylight between the two established leaders and a long tail of smaller challengers. Kantata and Certinia hold the largest revenue bases, both built through consolidation of smaller point solutions, and the gap to the next tier remains wide given their financial integration depth.
Current competitive activity centers on AI staffing capability and finance-team feature depth rather than basic project management functionality, which most serious vendors now treat as table stakes. Several vendors have pursued acquisitions of smaller AI-focused resourcing startups over the past two years specifically to accelerate this capability rather than build it natively, while others have doubled down on vertical practice-specific configurations targeting narrower segments.

Rankings are most likely to shift as horizontal work management platforms continue adding PSA-adjacent features that satisfy smaller firms without a dedicated purchase, squeezing vendors that compete primarily on price. Consolidation among mid-tier vendors appears increasingly likely, and private equity interest in the category has picked up as buyers recognize the recurring revenue durability that comes with software this deeply embedded in a firm's core billing workflow.
professional-services-automation-software-market-company-positioning-matrix-1789993164073

Competitive Moat and Risk Dimensions

KANTATA

Moat: Consolidated Resourcing Data Depth

Kantata's platform, formed through the merger of Mavenlink and Kimble, holds an unusually deep base of historical resourcing and utilization data across thousands of consulting and agency customers, letting its AI staffing recommendations draw on patterns competitors with smaller installed bases simply cannot match at comparable statistical confidence.
KANTATA

Risk: Post-Merger Integration Overhang

Years after combining two previously separate platforms, some customers still report friction migrating between legacy Mavenlink and Kimble product lines, and competitors have used this integration overhang directly in competitive sales conversations to win business from customers frustrated by a still-incomplete unification of the two systems.
CERTINIA

Moat: Native Salesforce Platform Integration

Certinia, formerly FinancialForce, is built natively on the Salesforce platform, giving it a genuine integration advantage with the CRM system many professional services firms already use to manage client relationships and sales pipeline before a project even begins, avoiding a costly separate integration project most competitors require.
CERTINIA

Risk: Salesforce Platform Dependency Risk

Deep dependence on Salesforce's underlying platform exposes Certinia to pricing and roadmap decisions entirely outside its own control, and any firm not already committed to Salesforce for CRM faces a steeper adoption path than competitors offering standalone deployment options unconstrained by a third-party platform vendor.

Players Tracked

Prominent Players

Kantata
Certinia
Deltek
Oracle NetSuite
Replicon

Other Key Players

Accelo
Scoro
Productive
BQE Software
Wrike
Harvest
Workamajig
Rocketlane
Projector PSA
Ravetree
Screendragon
Priority Software
Journyx
Precursive
Adobe Workfront

Recent Developments

FEBRUARY 2026

Kantata Acquires AI Resource Matching Startup

Kantata acquired a smaller AI-focused resource matching startup in February 2026 to accelerate its predictive staffing recommendation engine, adding machine learning talent and proprietary matching algorithms that had previously required a slower internal development timeline spanning multiple product release cycles. The deal closed for an undisclosed amount.
Signal: Signals accelerating AI capability consolidation across the leading vendor tier through acquisition rather than internal development timelines
APRIL 2026

Certinia Expands Native Salesforce Integration Depth

Certinia announced deeper native integration with Salesforce's revenue lifecycle management tools in April 2026, tightening the connection between client relationship data and project billing that many customers had previously managed through third-party connector applications requiring separate maintenance and support contracts. The update ships to all customers automatically.
Signal: Signals platform-native vendors deepening customer lock-in through much tighter native platform integration rather than third-party connectors
JUNE 2026

Deltek Signs Supply Agreement With Major System Integrator

Deltek signed a multi-year reseller and implementation partnership agreement with a major global systems integrator in June 2026, expanding its enterprise sales reach into large multinational consultancies that previously evaluated Deltek only through direct sales channels lacking dedicated implementation support resources at scale. Terms were not disclosed publicly.
Signal: Signals growing vendor reliance on channel partnerships to reach large enterprise accounts previously served only directly

Talent and Cloud Costs Squeeze Margin

Engineering and product talent represents the largest cost input for PSA vendors, running roughly 45% of cost of goods sold, concentrated in North American and Western European software engineering labor markets where senior AI and machine learning talent commands premium compensation. Cloud hosting infrastructure adds a smaller but meaningful secondary cost line that scales directly with customer data volume.
A notable talent cost spike hit the category in early 2025 as competition for AI and machine learning engineers intensified sharply following widespread enterprise AI adoption across the broader software industry, a trend documented in multiple company investor updates and referenced in named annual reports from publicly traded enterprise software peers facing similar hiring pressure. Several vendors slowed hiring pace in response while raising compensation for existing senior staff to prevent costly attrition.

Vendors without significant existing scale face a real cost disadvantage against Kantata and Certinia, both of which can spread fixed AI research and development costs across a considerably larger installed customer base than smaller competitors managing the same engineering headcount. This exposure varies by geography too, since vendors based in lower-cost offshore engineering markets can offer competitive pricing that pure North American cost structures increasingly struggle to match.
professional-services-automation-software-market-cost-volatility-analysis-1789993164269

Diversifying Engineering Hiring Across Lower-Cost Regions

Leading vendors increasingly build engineering teams across multiple geographies, including lower-cost markets in Eastern Europe, Latin America, and South Asia, rather than concentrating hiring entirely in expensive North American and Western European talent markets, reducing average blended engineering cost per employee substantially over time while still maintaining strong technical quality standards throughout the organization.

Extending AI Model Reuse Across Product Lines

Vendors are increasingly building shared AI infrastructure and model components reusable across multiple product features rather than developing separate machine learning capability for each new module independently and entirely from scratch, spreading fixed AI research investment across a broader revenue base and reducing marginal cost per new feature shipped to customers each release cycle.

Retaining Senior Staff Through Equity and Career Paths

Vendors are investing more heavily in equity compensation and defined technical career progression paths specifically to reduce costly senior engineer attrition during a persistently competitive hiring market, since replacing an experienced AI engineer costs meaningfully more in both direct recruiting fees and lost institutional knowledge than simply retaining one through much better structured incentives.

Portfolio Architecture for Margin Defence

The market splits between commodity-tier tools serving smaller firms with basic time tracking and invoicing needs, priced accessibly with thinner margins, and premium platforms carrying meaningfully higher gross margins because deep financial integration, AI staffing capability, and dedicated implementation support justify substantially higher contract values at larger enterprise accounts managing complex multi-currency engagements across many practice groups simultaneously and continuously.
Tension between volume and premium tiers plays out in how vendors allocate product investment, since commodity tools require ongoing basic maintenance while premium capability demands continuous AI and integration development that smaller firms rarely fund adequately given their limited technology budgets. Most successful vendors treat commodity tiers as an acquisition funnel rather than a standalone profit center, funding premium development from that steadier baseline revenue instead.

The highest-value margin pools concentrate around AI-driven resourcing capability and deep native financial integration serving large multinational consultancies willing to pay premium rates for measurable utilization improvement, a customer set that increasingly determines which vendors capture the fastest-growing and most profitable share of the entire category going forward, leaving commodity-tier competitors fighting over thinner margins on a shrinking base.

Volume / Commodity-Adjacent

Basic time tracking, expense capture, and simple invoicing tools priced accessibly for small firms and freelancers with limited budgets and straightforward billing needs across a single practice area and modest headcount overall.
Gross Margin: 20-30%

Premium / Certified

Full resourcing, project management, and revenue recognition platforms serving mid-market and larger firms requiring deeper financial integration and dedicated implementation support at every contract renewal cycle going forward each year.
Gross Margin: 45-55%

Sustainability / Regulatory / Next-Generation

AI-driven staffing optimization and compliance-ready revenue recognition capability serving the largest multinational consultancies willing to pay premium rates for measurable, sustained utilization gains across their entire global practice network and every office location.
Gross Margin: 50-60%
professional-services-automation-software-market-portfolio-architecture-1789993164772

High-value Sub-segments and Strategic Watch-out

AI-Driven Resource Planning and Utilization Optimization

High-value and high-growth, this segment commands premium pricing from firms willing to pay for measurable utilization improvement, and its growth rate outpaces every other segment in the market currently by a wide and widening margin as adoption accelerates across every firm size and practice type.
Gross Margin: 50-60%

Billing and Revenue Recognition Software

High-value with moderate growth, finance-led buyers pay premium rates for compliance-ready revenue recognition capability, though adoption has matured enough at larger firms that growth has settled into a much steadier annual pace than the newer, considerably faster-growing AI resourcing segment described above in this section.
Gross Margin: 45-55%

Time and Expense Tracking

The volume core of the market, this segment generates the bulk of transaction count and seat-based recurring revenue across thousands of smaller firm accounts, even though per-seat margins run well below the premium tiers described above and show little sign of meaningfully expanding in coming years.
Gross Margin: 20-30%

Standalone Project Management Tools

A strategic watch-out segment: horizontal work management platforms keep steadily adding PSA-adjacent features that satisfy smaller firms without requiring a dedicated purchase, and vendors must watch this encroachment closely since it threatens the commodity tier most directly and could eventually spread further upmarket over time.
Gross Margin: 15-25%

Software Woven Into Daily Billing Operations

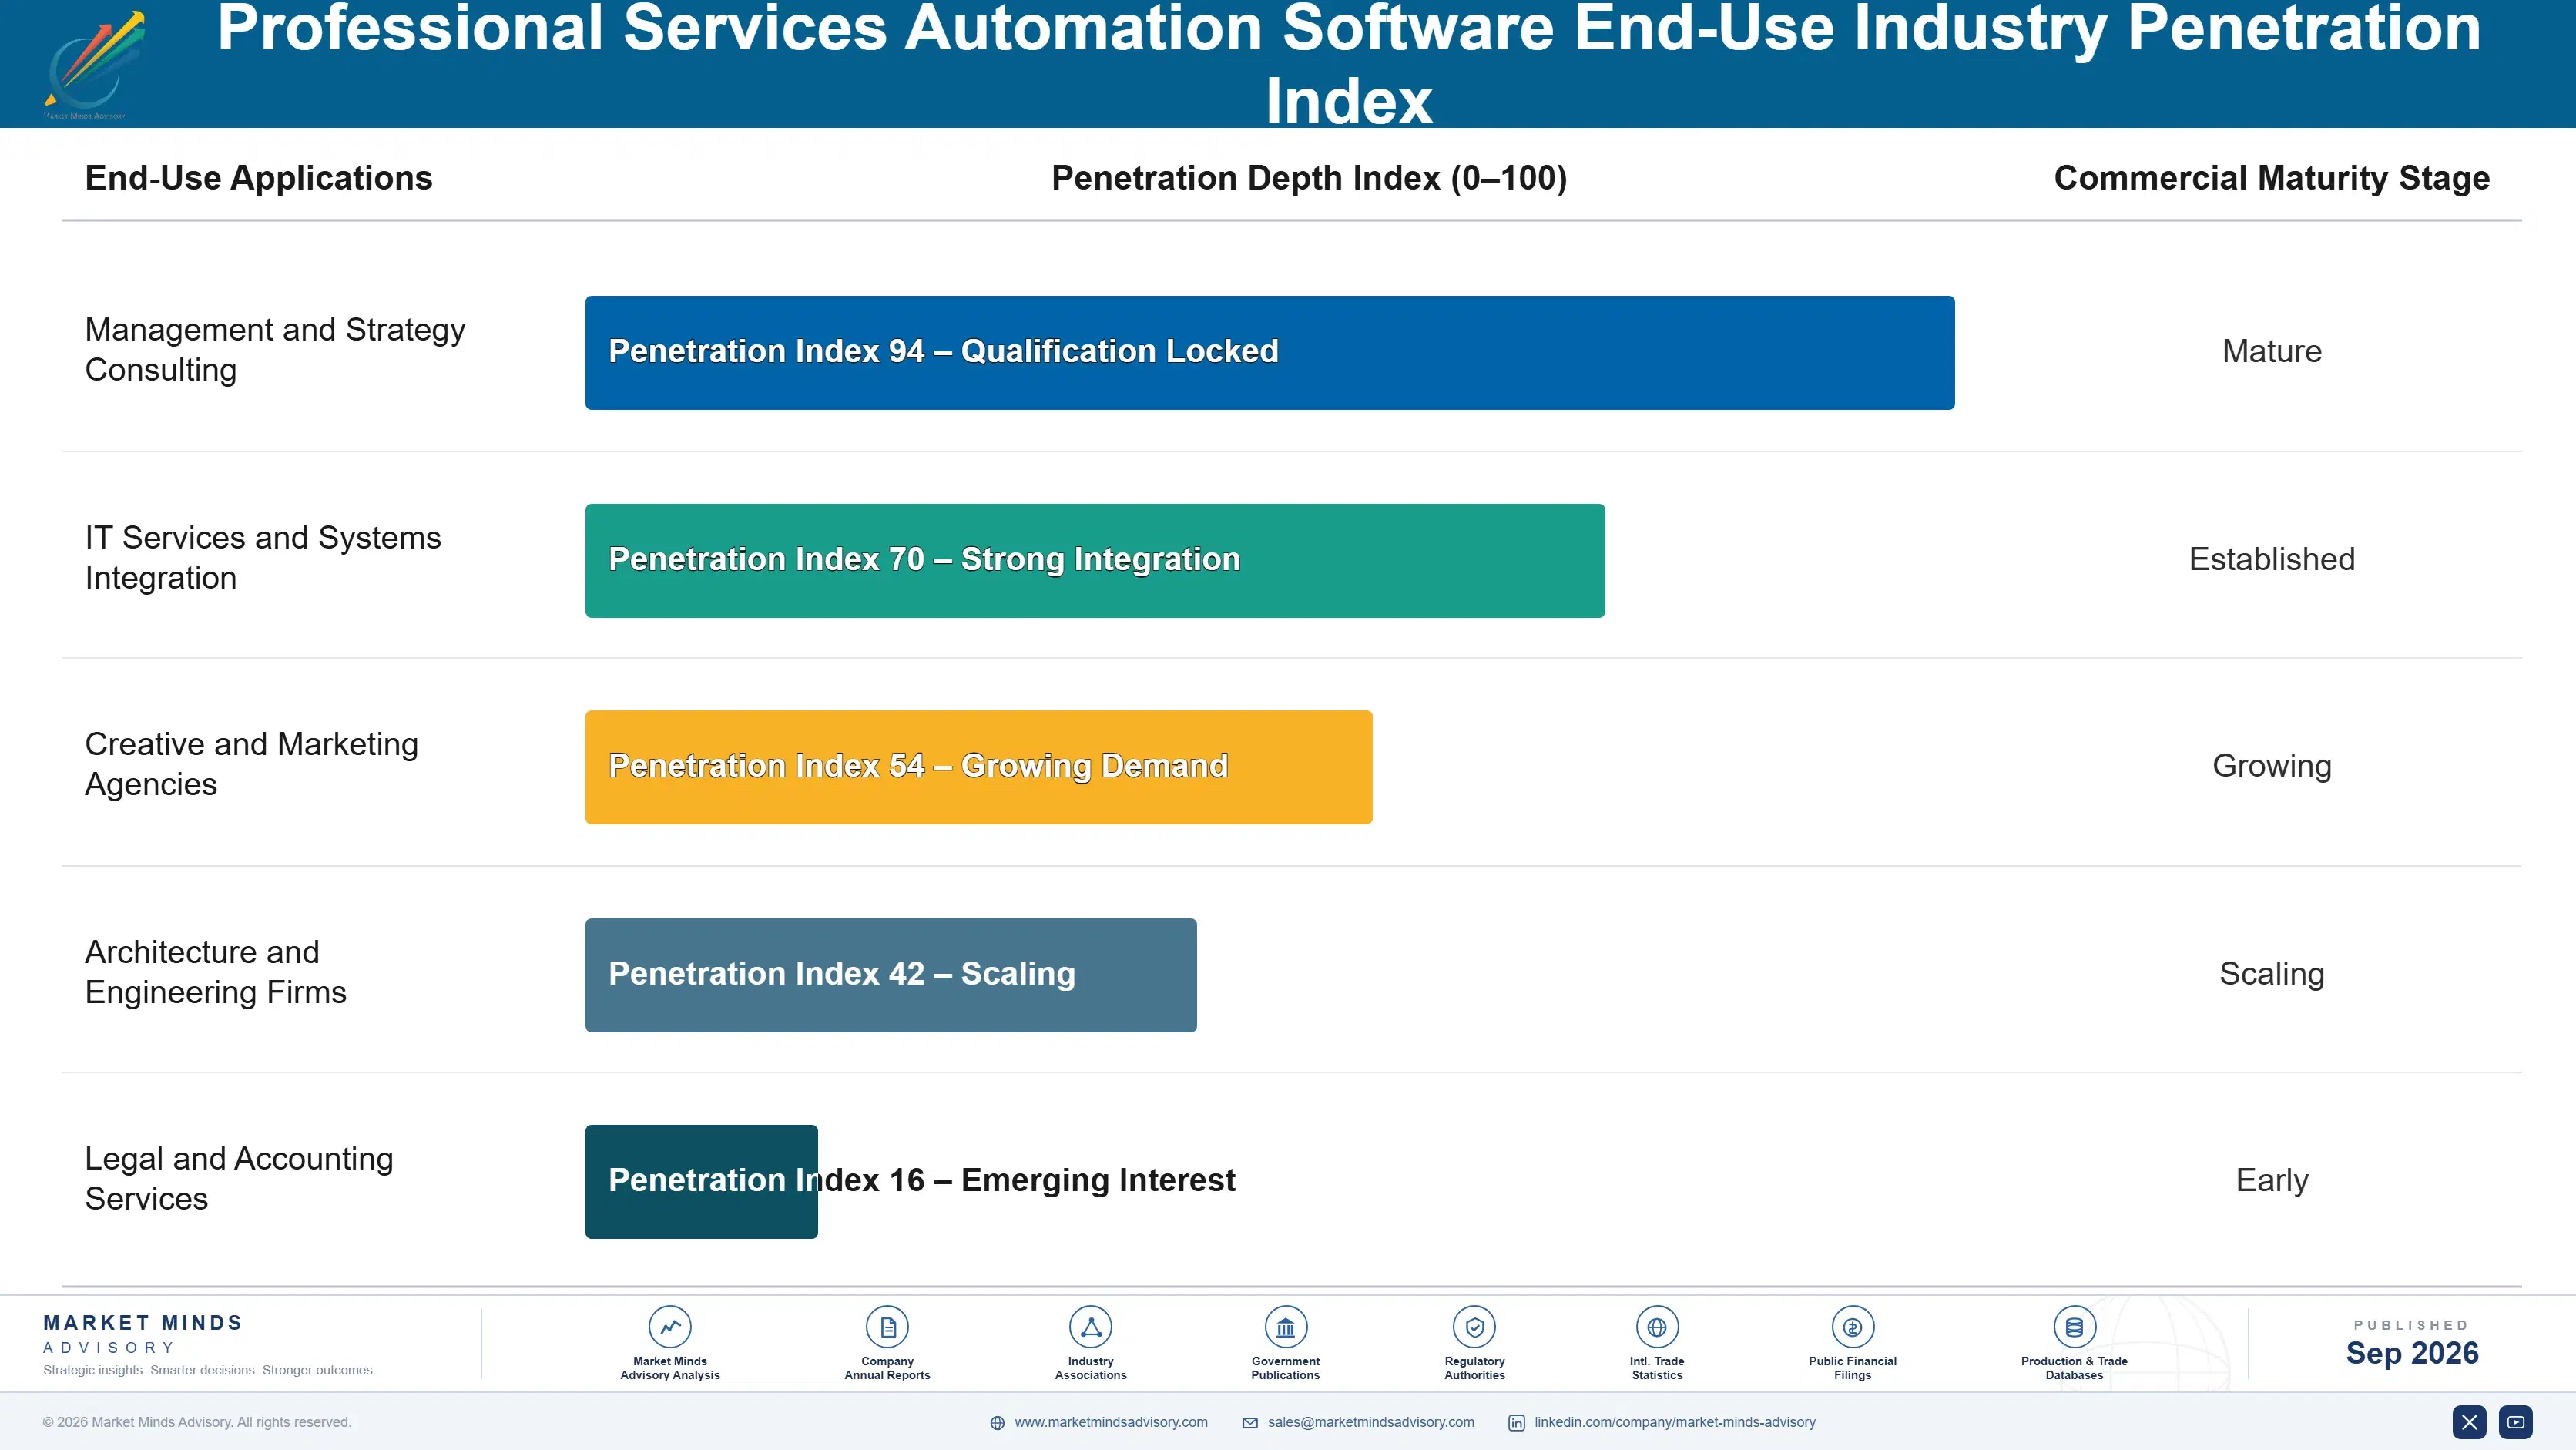
PSA software runs almost entirely on annual subscription contracts rather than one-time licensing, since firms need continuous resourcing and billing capability every single working day rather than a single point-in-time software purchase that sits unused between projects, and renewal rates consistently exceed 90% once firms fully embed the platform into daily billing operations across every practice group and office location they operate.
Adoption depth varies meaningfully by vertical: management consultancies and IT services firms integrate resourcing so deeply into daily operations that switching vendors risks disrupting active client billing entirely mid-engagement, while smaller creative agencies treat the software more as a convenience layer and switch more readily when a cheaper alternative emerges with adequate features for their comparatively simpler billing and project needs.

Buyer profiles have shifted generationally as procurement increasingly runs through finance and operations leadership together rather than a single department head managing the decision entirely alone, bringing more rigorous evaluation criteria and longer sales cycles but also stickier, better-integrated deployments once a contract finally closes after multiple stakeholder rounds and a more thorough vendor evaluation process than firms conducted in years past.
professional-services-automation-software-market-end-use-penetration-index-1789993165267

What Vendors Should Do Next

These are among the four positions where our research anticipates prominent divergence between winners and laggards over the coming forecast period. Each is grounded in the demand model, the regulatory perimeter, and the announced capacity pipeline.
01 / AI FEATURE INVESTMENT

Predictive staffing capability is now a required rather than optional feature

AI-driven resource planning has become the single most important growth driver in this software category today, well ahead of any other capability. Vendors still shipping only passive utilization dashboards are losing deals to competitors who can proactively recommend staffing assignments and quantify the margin improvement that follows from each recommendation made. Building this capability now, rather than treating it as a future roadmap item, positions a vendor to capture the fastest-growing and most defensible segment of new customer spending over the next several years.
02 / FINANCE BUYER ALIGNMENT

Product roadmaps should be built around finance team requirements from the outset

Finance teams increasingly hold real veto power over software procurement decisions that once sat entirely with operations leadership alone at most professional services firms. Vendors that treat financial integration and audit-ready reporting as a genuine first-class product requirement, rather than a bolted-on afterthought, close larger deals faster and retain customers longer through smoother annual renewal conversations with far fewer surprises along the way. Ignoring this shift risks losing enterprise deals to competitors who built the relationship correctly from day one.
03 / VERTICAL DEPTH STRATEGY

Horizontal generalists should pick specific practice verticals rather than staying broad

Vendors offering pre-configured workflows tailored to specific practice types win deals faster and command meaningfully higher pricing than generalist competitors trying to serve every kind of professional services firm equally well across the board and every single industry vertical. This gap looks set to widen further as buyers grow more sophisticated about evaluating vendor fit against their specific needs. A horizontal strategy increasingly risks mediocrity everywhere rather than genuine strength in any one specific, well-defined practice vertical worth owning outright.
04 / SERVICES ATTACH EXPANSION

Bundling implementation and advisory services protects margin and deepens lock-in

Services attach revenue now represents a meaningful share of total contract value at the leading vendors in this software category today, and that share keeps growing steadily. Vendors that continue selling bare software licenses while leaving implementation entirely to third-party integrators are forfeiting real revenue and, just as importantly, weakening the switching costs that keep customers renewing year after year without much friction. Building a genuine managed services capability protects both near-term margin and long-term customer retention simultaneously and durably.

Engagement Snapshot From the Field

A live engagement with an industry participant carrying material or product regulatory and market exposure ahead of a defining policy shift, showing how our research translates into a defensible multi-year portfolio strategy.
MARKET MINDS ADVISORY · CLIENT ENGAGEMENT SUMMARY
Professional Services Automation Software Producer Strategic Portfolio Review and Transition Roadmap 2026·Investment Scenario on Professional Services Automation Software Exposure Evaluation 2025-26
CLIENT PROFILE
The client was a mid-size IT and management consulting firm with roughly 450 billable consultants across three countries, generating approximately $95 million in annual revenue (client-reported, unverified by MMA) split across fixed-fee digital transformation projects and traditional time-and-materials engagements. The firm had relied on a combination of spreadsheets and a basic project management tool for resourcing decisions since its founding.
STRATEGIC CHALLENGE
Utilization visibility lagged badly behind the firm's growth, with practice leads unable to see cross-office consultant availability in real time and frequently double-booking senior staff across competing engagements. Management estimated the firm was leaving roughly $4.2 million annually (client-reported, unverified by MMA) on the table through avoidable bench time and rushed, suboptimal staffing decisions made under deadline pressure.
MMA APPROACH
MMA conducted a structured vendor evaluation benchmarking five leading PSA platforms against the firm's specific requirements for cross-office resourcing, multi-currency billing, and AI-driven staffing recommendations, incorporating primary interviews with practice leads and finance leadership. The analysis modeled total cost of ownership and projected utilization improvement under each finalist platform using MMA's proprietary benchmarking dataset covering comparable mid-size consultancy deployments.
KEY FINDINGS
  1. The two AI-capable finalist platforms projected utilization improvements of 7 to 9 percentage points (client-reported, unverified by MMA) within the first year of full deployment across all offices.
  2. Cross-office visibility gaps accounted for roughly 60% of the estimated bench time loss, more than any other single identified operational factor examined during the audit.
  3. Implementation timeline estimates varied by nearly four months between finalist vendors, driven primarily by differing data migration complexity and available support model quality.
  4. Finance leadership ranked native multi-currency revenue recognition capability as their single highest-priority evaluation criterion, well above resourcing features generally considered by other stakeholders.
CLIENT PROFILE
The client was a mid-size IT and management consulting firm with roughly 450 billable consultants across three countries, generating approximately $95 million in annual revenue (client-reported, unverified by MMA) split across fixed-fee digital transformation projects and traditional time-and-materials engagements. The firm had relied on a combination of spreadsheets and a basic project management tool for resourcing decisions since its founding.
STRATEGIC CHALLENGE
Utilization visibility lagged badly behind the firm's growth, with practice leads unable to see cross-office consultant availability in real time and frequently double-booking senior staff across competing engagements. Management estimated the firm was leaving roughly $4.2 million annually (client-reported, unverified by MMA) on the table through avoidable bench time and rushed, suboptimal staffing decisions made under deadline pressure.
MMA APPROACH
MMA conducted a structured vendor evaluation benchmarking five leading PSA platforms against the firm's specific requirements for cross-office resourcing, multi-currency billing, and AI-driven staffing recommendations, incorporating primary interviews with practice leads and finance leadership. The analysis modeled total cost of ownership and projected utilization improvement under each finalist platform using MMA's proprietary benchmarking dataset covering comparable mid-size consultancy deployments.
KEY FINDINGS
  1. The two AI-capable finalist platforms projected utilization improvements of 7 to 9 percentage points (client-reported, unverified by MMA) within the first year of full deployment across all offices.
  2. Cross-office visibility gaps accounted for roughly 60% of the estimated bench time loss, more than any other single identified operational factor examined during the audit.
  3. Implementation timeline estimates varied by nearly four months between finalist vendors, driven primarily by differing data migration complexity and available support model quality.
  4. Finance leadership ranked native multi-currency revenue recognition capability as their single highest-priority evaluation criterion, well above resourcing features generally considered by other stakeholders.
RECOMMENDED STRATEGY
Phase 1: Phase 1 (Months 1 to 2): Complete a structured vendor evaluation and total cost of ownership modeling across all finalists. Phase 2: Phase 2 (Months 3 to 6): Migrate historical project and consultant data, then roll out to two pilot offices first. Phase 3: Phase 3 (Months 7 to 10): Complete firm-wide rollout across the remaining office and fully activate all AI staffing recommendations.
OUTCOME
The firm selected and fully deployed a PSA platform within ten months, reporting a 6 percentage point utilization improvement (client-reported, unverified by MMA) within the first two full quarters after go-live. Cross-office double-booking incidents dropped sharply, and finance leadership reported meaningfully faster month-end revenue recognition close cycles firm-wide.

Frequently Asked Questions

Foundational context covering the market sizes, CAGR, scope, country, region and competition that inform every finding below. This section is provided to cover basics and most often pre-purchase conversations, answered from the MMA Primary Research Dataset.

What is the current size of the Professional Services Automation Software Market?

The Professional Services Automation Software Market was valued at $5.4 billion in 2025, the base year for this report. Growth has accelerated as fixed-fee client pricing increasingly punishes firms for poor utilization management.

How large will the Professional Services Automation Software Market be by 2036?

MMA projects the market will reach $15.41 billion by 2036, up from $5.94 billion in 2026. That represents a 2.59x expansion over the ten-year forecast period.

What is the CAGR for the Professional Services Automation Software Market 2026 to 2036?

The market is projected to grow at a 10.0% CAGR between 2026 and 2036, with a bull case of 11.2% and a bear case of 8.8% depending on adoption speed.

Which segment is growing fastest?

AI-driven resource planning and utilization optimization is growing fastest at a 14.0% CAGR, roughly 1.4 times the overall market rate, as firms adopt predictive staffing tools.

Who are the major companies in the Professional Services Automation Software Market?

Leading vendors include Kantata, Certinia, Deltek, Oracle NetSuite, and Replicon, evaluated on annualized recurring revenue. Combined, the top five hold roughly 35% of the market.

Which country is growing fastest?

Ireland is growing fastest at a 13.0% CAGR, reflecting its concentration of multinational professional services and technology firm European headquarters operations based there for tax and talent reasons.

Report Segmentation Architecture

The full report scope spans multiple orthogonal segmentation dimensions, with cross-tabulated demand data provided for each dimension pair. Coverage extends further to regional breakdowns, trend trajectories, and the competitive detail needed to support segment-level decision-making.

By Functional Capability

  • AI-Driven Resource Planning and Utilization Optimization
  • Time and Expense Tracking
  • Billing and Revenue Recognition
  • Project and Portfolio Management
  • Analytics and Business Intelligence Reporting
  • Client and CRM Pipeline Integration

By End-Use Industry

  • Management and Strategy Consulting
  • IT Services and Systems Integration
  • Creative and Marketing Agencies
  • Architecture and Engineering Firms
  • Legal and Accounting Services

By Commercial Dimension

  • Enterprise Firm-Wide Deployment
  • Mid-Market Subscription
  • Small Firm and Freelancer Tier
  • Managed Services and Implementation

By Region

  • North America
  • Western Europe
  • East Asia
  • South Asia and Pacific
  • Latin America
  • Middle East and Africa
  • Eastern Europe

Scope, Methodology, and Coverage

Every figure in this report is reproducible from documented input assumptions. The scope below maps the historical period, the forecast horizon, the segmentation dimensions, and the countries covered, alongside the underlying primary and qualitative methodology.
Historical Period
2020 to 2025
Forecast Period
2026 to 2036
Base Year
2025 (USD billions; MMA Primary Research Dataset, September 2026)
Market Definition
The Professional Services Automation Software Market covers platforms that manage project resourcing, time and expense tracking, billing, and revenue recognition specifically for consulting, IT services, agency, and similar billable-hour businesses. It excludes general-purpose project management tools, enterprise resource planning suites, and accounting software that lacks native billable-services workflow support.
Quantitative Units
USD billions (current prices); seat count; CAGR percentage; regional share percentage
Segmentation Dimensions
By Functional Capability; By End-Use Industry; By Commercial Dimension; By Region
Regions Covered
North America, Western Europe, East Asia, South Asia and Pacific, Latin America, Middle East and Africa, Eastern Europe
Countries Covered
USA, China, Germany, France, UK, Japan, South Korea, India, Australia, Canada, Brazil, Mexico, Ireland, Netherlands, Singapore, UAE, Saudi Arabia, South Africa, Nigeria, Poland, Italy, Spain, Sweden, Switzerland, Argentina, Indonesia, Vietnam, Malaysia, Turkey, and additional markets relevant to this sector
Key Companies Profiled
Kantata, Certinia, Deltek, Oracle NetSuite, Replicon, Accelo, Scoro, Productive, BQE Software, Wrike, Harvest, Workamajig, Rocketlane, Projector PSA, Ravetree, Screendragon, Priority Software, Journyx, Precursive, Adobe Workfront
Quantitative Methodology
Primary survey, n=3,800 respondents, Q4 2025, six countries; demand-side model with trade association cross-validation
Qualitative Methodology
47 expert interviews, Q4 2025; applied to validate demand model assumptions, identify emerging dynamics, and assess competitive positioning
Report Format
PDF and XLSX data workbook (Word format preview document)
Publisher
Market Minds Advisory
Report Code
MMA-2026-TEC-202
Published
September 2026
Contact
sales@marketmindsadvisory.com | www.marketmindsadvisory.com

Purchase the full Professional Services Automation Software Market Report (2026 to 2036).

This report provides a comprehensive assessment of the global Professional Services Automation Software Market through 2036, covering functional segmentation, regional demand patterns, and competitive positioning across resourcing, billing, and revenue recognition vendors. It quantifies market sizing, growth scenarios, and pricing dynamics shaped by rising fixed-fee client contracts and growing AI-driven staffing adoption across every major buyer vertical. Analysis extends to input cost exposure, portfolio margin architecture, and demand stickiness by professional services vertical. The report closes with forward-looking strategic recommendations for vendors and investors evaluating this category over the coming decade.
Ten-year market sizing and forecast model
Functional capability and buyer segmentation analysis
Full seven-region demand and growth breakdown
Competitive benchmarking of top twenty vendors
Input cost exposure and mitigation strategy review
Strategic verdict and revenue lever recommendations

Built For The People Who Decide

From boardroom strategy to bench-side execution, this report is read cover-to-cover by leaders shaping the next decade of their industry, turning demand scenarios, market dynamics and valuation benchmarks into decisions.
CXOs/ Presidents/ VPs/ Managers
M&A and Corporate Development
Strategy Teams and R&D Heads
Procurement and Product Directors
Regulatory and Compliance Leaders
Investor Relations and Equity Analysts