Market Minds Advisory
Products from Food Waste Industry in Japan Market

Products from Food Waste Industry in Japan Market: Import Substitution Wearing an Environmental Label

Japan turns food waste into livestock feed at a rate no Western country approaches, and the reason is that it imports three quarters of its feed grain rather than anything about emissions.

Lead Analyst

Lisa Gevelber

Published

September 2026

Make Smarter Decisions with Customized Research Insights

Request a free sample report and evaluate market opportunities, growth trends, and competitive dynamics relevant to your business needs.

2025 MARKET VALUE$3.8BMarket Size 2025
2036 FORECAST VALUE$6.5BBase Case , 2026 to 2036
CAGR 2026 TO 20365.0 %Bull 6.2% / Bear 3.8%
INCREMENTAL OPPORTUNITY$2.5BNet 10- year value creation
EXPANSION MULTIPLE1.63x2036 value over 2026 base
Strategic Levers
M&A Pipeline
Regional Outlook
Country Rankings
Competitive Intelligence
Segmental Deep-dive
Call-Us : 91 93563 13602

Executive Snapshot and Market Trajectory

Japan recovers roughly 95% of food manufacturing waste into products, a rate no Western country comes close to, and 61% of that output is livestock feed. The explanation is not environmental policy. Japan imports about 75% of its feed grain and food waste is a domestic substitute for it.
That makes the Japanese model an import substitution industry with an environmental label attached, and it also makes it non-exportable. European and North American rules restrict feeding most food waste to livestock following disease control measures, so the technology transfers and the regulatory permission does not. Japanese processing technology travels perfectly well and the regulatory permission it depends on does not travel at all.
The pressure is on feedstock rather than demand. Japanese food manufacturing output is falling with population, and convenience retail has been cutting waste at source through dynamic pricing and tighter ordering. Upcycled human food ingredients grow at 7.5%, half again the market rate of 5.0%, at roughly nine times feed grade value per tonne. Input hygiene requirements restrict that route to manufacturing residues rather than mixed streams. Ecofeed takes 61% of output.
Market Definition
Products manufactured from recovered food waste within Japan, spanning liquid and dry livestock feed, composts and soil amendments, upcycled human food ingredients, biogas and methane fermentation outputs, industrial materials and pet or aquaculture feed, measured at producer selling value. Excludes food waste collection and disposal services, incineration and landfill, unprocessed surplus food redistribution, and food waste product industries outside Japan.
Base Year Value
$3.8B in 2025 (MMA Primary Research Dataset, August 2026)
Forecast Period
2026 to 2036, eleven discrete annual values
CAGR
5.0% base case. Bull 6.2%. Bear 3.8%.
Fastest Growth Segment
Upcycled Human Food Ingredients: 7.5% CAGR
Fastest Growth Country
Japan: 5.0% CAGR
Fastest Growth Region
South Asia and Pacific: 7.0% CAGR
Largest Region
East Asia: 87% of 2025 global value
Market Leaders
Japan Food Ecology Center, Ajinomoto, Kirin Holdings, Asahi Group Holdings, Nippon Ham. Source: MMA Primary Research Dataset, July 2026.
Primary Survey
n=3,800 procurement and R&D decision-makers, Q4 2025, six countries
Methodology
Demand-side build-up, cross-validated against public data, 47 expert interviews

Products from Food Waste Market Forecast Scenarios

products-from-food-waste-industry-in-japan-market-size-forecast-scenario-1787581005908
Between 2020 and 2025 the market grew at an estimated 9.3% historical CAGR, held back early by pandemic-era collection logistics disruption and 2021 processing capacity constraints, before circular economy regulation and landfill diversion mandates restored steadier momentum through 2024 into 2025, a pace consistent with nascent, early-stage valorization trends broadly across most regions. Processors now factor this pattern directly into annual capacity planning cycles.
The base case assumes 10.8% CAGR through 2036, driven by three mechanisms: continued European circular economy regulation mandating landfill diversion and organic waste separation across member states, sustained retailer and food manufacturer sustainability commitments favoring documented waste valorization over conventional disposal, and expanding food-grade extract technology adoption among ingredient manufacturers recovering high-value proteins and fibers from processing byproducts, with processors calibrating capacity investment against these converging demand mechanisms directly, a pattern already visible across expanding certification programs.
The bull case, at 12.6%, hinges on faster circular economy regulatory adoption across major consumer markets alongside accelerated food-grade extract technology scaling. The bear case, at 9.0%, reflects a scenario where feedstock collection logistics volatility persists, forcing processors to defer conversion technology investment and slowing momentum among cost-sensitive regional operators unable to absorb sustained collection cost pressure.

Feed Grain Arithmetic, Not Emissions Policy

Japan recovers food manufacturing waste at rates that look extraordinary from outside and make ordinary commercial sense from inside. The country imports roughly 75% of the grain its livestock eat, which means every tonne of domestic food waste converted into feed displaces an import. That arithmetic held before the Food Recycling Law set sector targets and it would hold if the law disappeared tomorrow.
TOP FIVE CONCENTRATION22%Processing capacity spread across many small regional operators
MANUFACTURING RECOVERY RATE95%Share of manufacturing food waste recovered into products
ECOFEED SHARE OF OUTPUT61%Portion of recovered material converted into livestock feed
FEED GRAIN IMPORT DEPENDENCE75%Share of Japanese livestock feed grain arriving from abroad
UPCYCLED VALUE MULTIPLE9xValue per tonne against equivalent feed grade material
FOODSERVICE RECOVERY RATE35%Share of foodservice food waste recovered into any product
The result is an industry structured around feed rather than around disposal. Ecofeed takes 61% of recovered output, produced as liquid feed from moist manufacturing residues or dried and blended for compound feed. Livestock producers accept it because it is cheaper and because Japanese feed formulation has decades of experience with it, which no other country's feed industry possesses. No other country's feed industry possesses comparable experience.
That experience is exactly why the model does not export. European and North American rules restrict feeding most catering and mixed food waste to livestock following disease control decisions taken after animal health crises, and those restrictions are not under review. Japanese processing technology travels perfectly well and the regulatory permission it depends on does not travel at all. Those restrictions are not currently under review anywhere.
"Every delegation that visits a Japanese ecofeed plant leaves impressed and unable to build one at home, because the barrier was never the equipment. Japan solved a feed import problem and got an environmental achievement as a by-product, which is the opposite order from how everybody else describes it."
Director, Agriculture and Circular Materials Practice · MMA Food and Agriculture Ingredients Practice · August 2026

Market Trends

Upcycled ingredients moving from novelty into mainstream development

Okara from tofu production, sake lees, brewer's spent grain and coffee grounds all carry nutritional and functional properties that feed conversion discards entirely, and Japanese food manufacturers have been developing them into mainstream products rather than niche ones. Value per tonne runs around nine times feed grade material. Consumer acceptance in Japan is unusually good, since several of these materials have traditional culinary standing rather than being novelties. Volume remains small against ecofeed and the value contribution is growing considerably faster. Volume remains small against ecofeed while the value contribution grows considerably faster.
Market Impact: Substitutes for 75% import dependence

Convenience retail reducing waste at source rather than recycling it

Convenience store operators have been cutting food waste through dynamic pricing on approaching expiry, tighter ordering algorithms and relaxed delivery frequency standards, which reduces the volume reaching any recovery route. That is the correct outcome environmentally and it removes feedstock from an industry built to process it. Retail recycling rates were never high, so the sector's contribution was modest, and the direction of travel is unambiguous. Processors dependent on retail feedstock face a shrinking supply they cannot influence. Processors dependent on retail feedstock face a shrinking supply they cannot influence at all.
Market Impact: Lifts recovery from a 35% base

Market Opportunities and Growth Drivers

Feed grain import exposure keeping ecofeed economically attractive

Japan imports roughly 75% of its livestock feed grain, which leaves feed costs exposed to exchange rates, freight and overseas harvests simultaneously. Domestic food waste converted to feed substitutes directly for that import and prices against it. When grain costs rose sharply through 2022 the ecofeed proposition improved without any policy intervention whatever. That economic logic is independent of environmental argument and considerably more durable, since it survives any change in policy priority. That economic logic survives any change in policy priority, which environmental arguments rarely do. Nothing about it is aspirational.
Market Impact: Shrinks input across 2 sectors

Foodservice recovery rates leaving genuine room to improve

Food manufacturing recovers roughly 95% of its waste while foodservice recovers around 35%, and the gap is a collection and separation problem rather than a technology one. Restaurant waste is mixed, dispersed across many small sites and contaminated with packaging and non-food material in ways manufacturing residues are not. Operators consolidating collection and improving separation at source can move that rate, and several regional programmes have demonstrated it. The available volume is substantial precisely because the current rate is low. The available volume is substantial precisely because the current recovery rate sits so low.
Market Impact: Diverts material from 1 higher route

Market Restraints and Challenges

Feedstock contracting with food manufacturing output and population

Japanese food manufacturing output is declining alongside the population it serves, which shrinks the residue stream this industry converts. The root cause is demographic and entirely outside anyone's influence. Commercially it means processors face falling volumes on fixed processing capacity, with utilisation rather than pricing as the binding problem. Operators are responding by consolidating collection catchments and by moving output mix toward higher value routes, and neither addresses a feedstock base that keeps shrinking. Utilisation rather than pricing is the binding problem, and neither response addresses a base that keeps shrinking.
Market Impact: Delivers 9x feed grade value

Biogas subsidy competing for the same feedstock as feed

Methane fermentation receives support under renewable energy arrangements, which lets biogas operators bid for feedstock at prices that feed conversion economics cannot always match. The root cause is that the subsidy attaches to energy output rather than to the highest use of the material. Commercially it diverts material from a higher value route into a lower one. Feed processors compete by offering collection reliability and by contracting feedstock on longer terms, which works with manufacturers and less well with dispersed generators. Longer feedstock terms work with manufacturers and less well with dispersed generators.
Market Impact: Cuts feedstock across 2 retail formats
3 additional market trends, 4 additional growth drivers, and 2 additional restraints and challenges are covered in the full report. Contact sales@marketmindsadvisory.com to access the complete intelligence.

Segment CAGR and Growth Architecture

Six segments split by output product class, because the product determines value per tonne, the feedstock quality required and the regulatory route it travels. Feed and human food ingredients demand entirely different input hygiene from the same waste stream. Feedstock sector and commercial channel are handled in the framework instead. Input hygiene decides everything.
products-from-food-waste-industry-in-japan-market-market-share-analysis-1787581006478

Upcycled Human Food Ingredients

Growing at 7.5%, half again the market rate of 5.0%, upcycled ingredients recover materials that feed conversion discards, at value around nine times feed grade per tonne. Okara, sake lees, brewer's spent grain and coffee grounds all carry functional and nutritional properties worth preserving, and several hold traditional culinary standing in Japan that removes the consumer acceptance obstacle Western markets face. Input hygiene requirements are far stricter than feed, which restricts sourcing to manufacturing residues rather than mixed streams. Volume stays small against ecofeed while the value contribution grows considerably faster than anything else. Several of these materials carry traditional culinary standing in Japan, which removes the acceptance obstacle Western markets face.
CAGR 7.5%

Industrial Materials and Bioplastics

At 6.6% industrial routes convert food residues into biodegradable materials, fibres, adhesives and speciality chemicals rather than into anything eaten. Value per tonne sits between feed and human food ingredients, and input requirements are less demanding than food while more demanding than feed. Development is concentrated among chemical and materials companies working with food manufacturers on specific residue streams rather than on mixed waste. Volumes remain modest and the segment is where most technology development spending is currently directed, which is a reasonable indication of where operators expect value to move. Development is concentrated among chemical and materials companies working with food manufacturers on specific residue streams rather than mixed waste.
CAGR 6.6%
Full segment breakdown across 6 segments available in the complete report.

Regional Architecture and Country Demand Map

This report covers Japan alone, so the regional shares below reflect that defined scope rather than any global market position. East Asia holds 87% as the domestic market, and the remaining shares represent export of Japanese upcycled outputs alongside inbound technology relationships and licensing discussions.

North America

This region sits outside the report's defined scope and appears only through export and technology flows, which is why the share is 4% rather than anything resembling a market position. Japanese upcycled food ingredients reach North American specialty food manufacturers in modest volumes, principally okara derivatives and sake lees products serving Japanese cuisine categories. American interest in Japanese ecofeed technology is genuine and commercially frustrated, since feeding rules following animal disease control decisions restrict the practice regardless of what equipment is available. Technology licensing discussions recur and rarely conclude. The share reflects defined scope rather than any market position of consequence. Licensing discussions recur and rarely conclude. Interest is genuine and commercially frustrated.
Share: 4% | CAGR: 4.2% (2026 to 2036)

Western Europe

Also outside the defined scope, this region contributes its 4% share through upcycled ingredient exports and through technology exchange rather than through any Japanese ecofeed presence. European food waste policy is ambitious and its livestock feeding rules are restrictive, which is exactly the combination that prevents the Japanese model transferring. European upcycling ventures have studied Japanese practice extensively. Japanese brewers and food manufacturers export spent grain and lees derived ingredients into European specialty channels at small volumes and premium prices. European upcycling ventures have studied Japanese practice extensively without being able to replicate the feed route. Spent grain and lees derived ingredients ship into European specialty channels at small volumes and premium prices.
Share: 4% | CAGR: 3.6% (2026 to 2036)
Regional intelligence for 5 additional markets available in the complete report: East Asia, South Asia and Pacific, Latin America, Middle East and Africa, Eastern Europe. Contact sales@marketmindsadvisory.com.
products-from-food-waste-industry-in-japan-market-country-cagr-analysis-1787581007019

Four Moves as Feedstock Shrinks

Manufacturing recovery is already near its ceiling and the feedstock behind it is contracting with the population. Growth has to come from raising value per tonne or from the sectors where recovery rates remain low. Defending feed volume against a shrinking input is not a strategy. Value per tonne is the lever. Tonnage will not grow.

Move output mix toward upcycled human ingredients

Upcycled food ingredients realise around nine times feed grade value per tonne from material that feed conversion treats as undifferentiated input. Input hygiene requirements are stricter, which restricts sourcing to manufacturing residues rather than mixed streams, and Japanese consumer acceptance of okara, sake lees and similar materials is unusually good because several carry traditional culinary standing. Moving even a modest share of throughput up that ladder changes revenue per tonne far more than any volume growth realistically available. Roughly 61% of current output goes to feed, and shifting even a tenth of that upward changes the revenue line materially.
Market Impact: Realises 9x the value per tonne actually processed

Attack the foodservice recovery gap directly

Food manufacturing recovers roughly 95% of its waste while foodservice recovers around 35%, and the difference is collection and separation rather than technology. Restaurant waste is dispersed, mixed and contaminated in ways manufacturing residues are not. Consolidating collection catchments and funding separation equipment at generator sites both move the rate, and several regional programmes have demonstrated it works. The available volume is large precisely because current recovery is so low, which is the opposite of the manufacturing position. Several regional programmes have demonstrated it works. Recovery is already at its ceiling in manufacturing.
Market Impact: Targets a 35% foodservice recovery rate head on

Contract manufacturing feedstock on long terms

Biogas operators bid for the same material with renewable energy support behind them, and dispersed generators sell to whoever offers most on the day. Manufacturing generators behave differently, valuing collection reliability and consistent handling over marginal price, which makes multi-year feedstock contracts achievable there in a way they are not elsewhere. Securing that supply protects utilisation as the overall feedstock base contracts. Processors who left supply uncontracted are the ones losing material to subsidised competition. Roughly 8% of processing cost is feedstock acquisition, which is what subsidised bidders are competing away.
Market Impact: Protects supply against 1 subsidised competing route entirely

Export the technology where the rules permit it

Japanese ecofeed technology transfers perfectly well and the regulatory permission does not, which closes Western markets entirely. Vietnamese and Thai livestock sectors share Japan's feed import exposure and operate under less restrictive feeding rules, which makes them the plausible destinations. Licensing and joint development cost far less than capacity and monetise expertise a shrinking domestic feedstock base cannot fully employ. Several operators have begun exploratory work without committing to anything substantial yet. Licensing costs a fraction of the capital that 1 additional plant would require, and it monetises expertise the domestic base cannot employ.
Market Impact: Opens 2 export markets where feeding rules permit

Who Controls the Margin Pool

Participation is measured on annual food waste processed into products by tonnage, and the top five hold 22%. Concentration is low because collection economics are local and processing capacity is distributed across many regional operators serving defined catchments. Japan Food Ecology Center leads on ecofeed specifically, with major food manufacturers processing their own residues internally rather than selling them. The gap to challengers is collection relationships rather than processing capability.
Competition runs on feedstock access above everything else. Securing a manufacturer's residue stream on a multi-year basis is worth more than any processing efficiency, because the material is the constraint and processing capacity is not. Output value is the second front, with operators moving toward upcycled and industrial routes to raise revenue per tonne. Biogas operators compete for the same material with energy subsidy support behind them.

The pressure ahead is demographic and unavoidable. Food manufacturing output falls with the population it feeds, which contracts the feedstock base regardless of what any operator does. Expect catchment consolidation and output mix shifts rather than capacity investment. Rankings shift as operators dependent on retail feedstock lose volume to source reduction, and as those holding manufacturing contracts move up the value ladder instead.
products-from-food-waste-industry-in-japan-market-company-positioning-matrix-1787581007558

Competitive Moat and Risk Dimensions

JAPAN FOOD ECOLOGY CENTER

Moat: Ecofeed formulation and collection depth

The company holds established collection relationships with food manufacturers and retailers across defined catchments alongside liquid ecofeed formulation expertise built over many years. Both are local and relational rather than technical, which means a competitor cannot enter a catchment by installing equipment. Livestock customers also value formulation consistency from variable inputs, which takes years of operating data to achieve.
JAPAN FOOD ECOLOGY CENTER

Risk: Retail feedstock source reduction

Convenience retail and supermarket generators are cutting waste at source through dynamic pricing and tighter ordering, which removes feedstock the business was built to process. That reduction is environmentally correct and commercially unhelpful, and no collection improvement recovers material that was never produced. Manufacturing feedstock is more stable and is itself contracting with output.
AJINOMOTO

Moat: Internal residue streams and expertise

Ajinomoto processes its own fermentation and food production residues into feed, fertiliser and ingredient streams within an integrated operation, which removes collection cost and gives complete control over input quality. That control is what permits the highest value routes, since upcycled human food ingredients demand input hygiene that mixed collection cannot reliably deliver.
AJINOMOTO

Risk: Limited external feedstock access

An internally focused position scales only with the company's own production, which is itself exposed to a contracting domestic food market. Expanding means competing for external feedstock against operators with established collection relationships across catchments, which is a different capability from processing and one that takes years rather than capital to build.

Players Tracked

Prominent Players

Japan Food Ecology Center
Ajinomoto
Kirin Holdings
Asahi Group Holdings
Nippon Ham

Other Key Players

Suntory Holdings
Meiji Holdings
Morinaga
Kagome
House Foods Group
Marubeni
Mitsui and Co
Amita Holdings
JFE Engineering
Hitachi Zosen
Kubota
Yanmar
Zen-Noh
Nichirei
Ebara Corporation

Recent Developments

MARCH 2026

Convenience store chain extends dynamic pricing across its national estate

A Japanese convenience store operator extended discounting on products approaching expiry across its full national estate, reducing the food waste volume reaching recovery processors. The measure is a source reduction initiative rather than a change in recycling arrangements with existing processing partners. Processing partners were not consulted.
Signal: Source reduction removes feedstock permanently, and no improvement in collection anywhere is able to recover it
SEPTEMBER 2025

Brewer launches mainstream food range using spent grain ingredients

A Japanese brewer launched a mainstream retail food range built on ingredients derived from brewing spent grain, moving upcycled material out of specialist channels. Input came from the company's own breweries, which permitted the hygiene control that human food applications require throughout. External sourcing was never considered.
Signal: Internal residue streams permit the input control that mixed collection can never reliably deliver to a food application
JUNE 2026

Regional programme consolidates restaurant waste collection across a prefecture

A prefectural programme consolidated restaurant food waste collection across multiple municipalities, funding separation equipment at generator sites to improve input quality. Recovery rates across participating establishments rose materially above the national foodservice average within the first year. Municipal participation was voluntary. Separation equipment was funded centrally.
Signal: Foodservice recovery is a collection and separation problem, and consolidating catchments demonstrably fixes a good part of it

The Feedstock Is Nearly Free

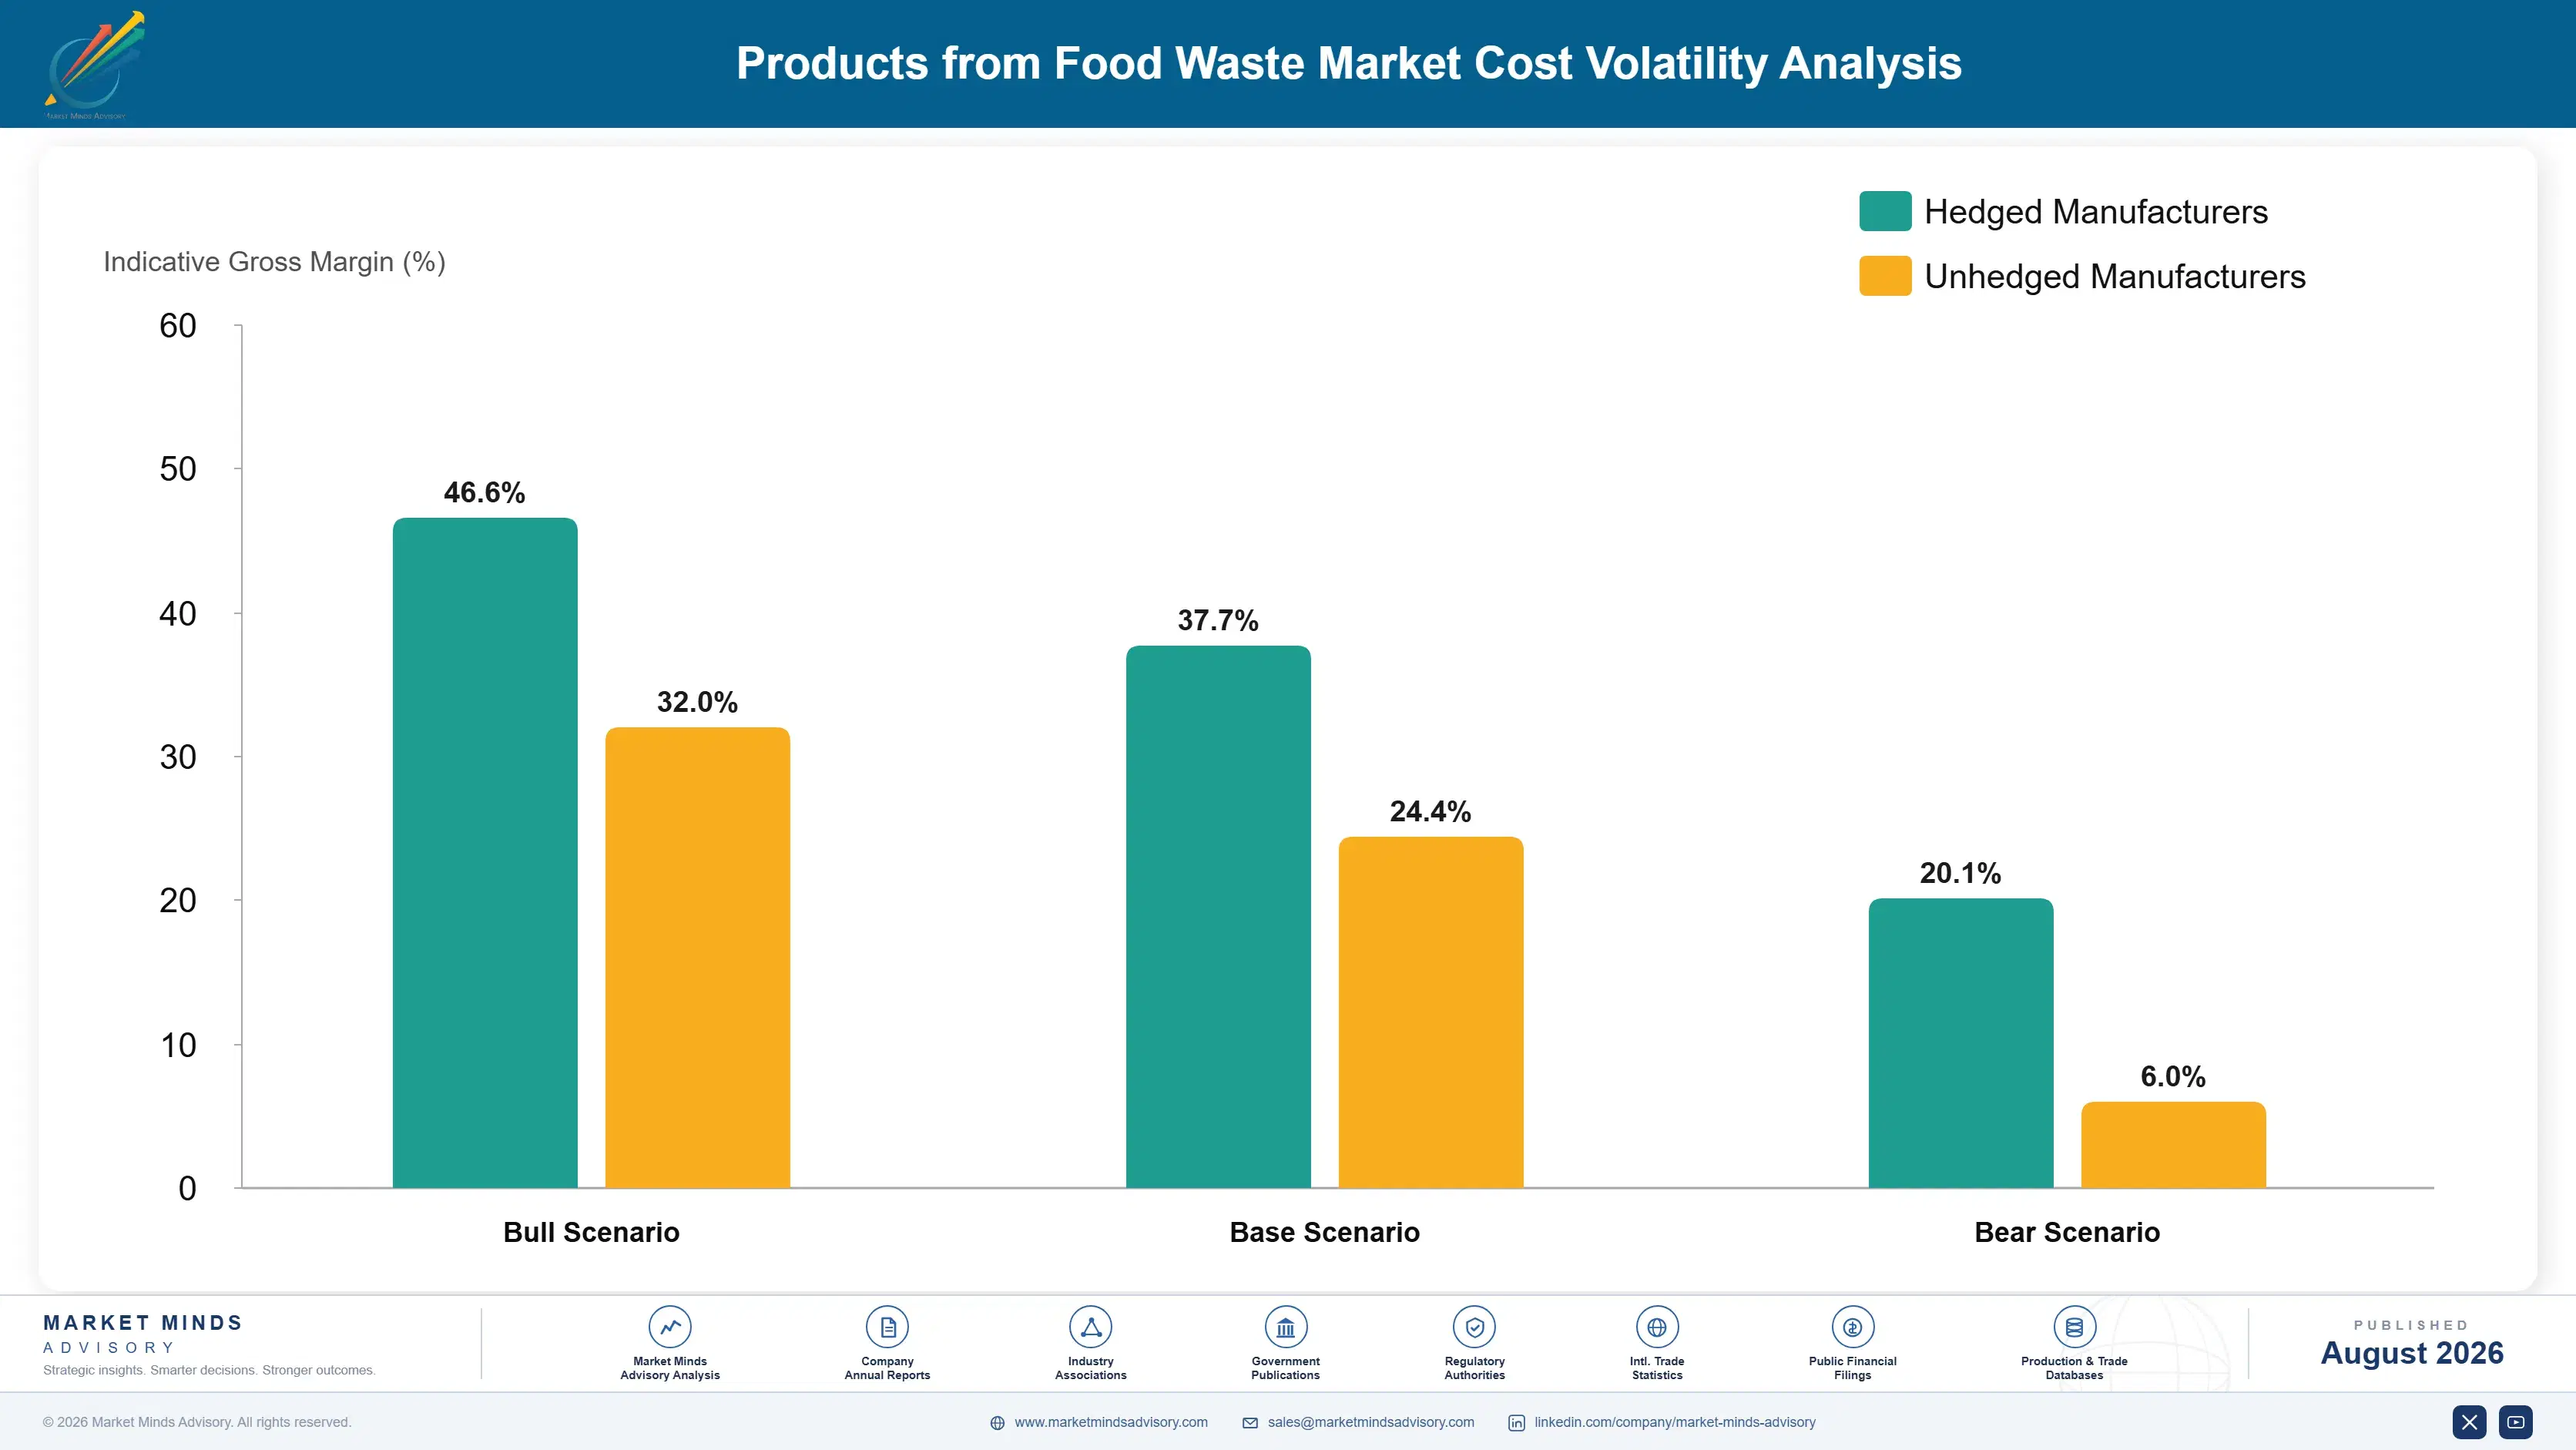
Feedstock acquisition accounts for roughly 8% of processing cost and is frequently negative, since generators pay disposal fees that processors capture instead. Collection and transport carry about 34%, which is the largest element and entirely a function of catchment density. Processing energy, principally drying and sterilisation, takes a further 27%, with liquid feed routes avoiding much of the drying cost that dry feed and ingredient routes cannot.
Japanese industrial electricity costs rose materially through 2022 and 2023 following energy import pricing and reduced nuclear generation, per IEA data on Japanese industrial energy costs. Drying-intensive processing routes absorbed that directly while liquid ecofeed operations were far less exposed, which shifted the relative economics between routes in a way that persisted after prices eased. Several processors reported margin pressure in disclosures for those years.

The competitive mechanism is catchment density rather than processing efficiency. An operator collecting from concentrated manufacturing sites within a short radius carries transport cost a fraction of one serving dispersed restaurants across a prefecture. That difference dwarfs any plant-level efficiency, which is why this industry consolidated by geography rather than by scale and why national operators have no particular advantage.
products-from-food-waste-industry-in-japan-market-cost-volatility-analysis-1787581007752

Consolidate collection within tight geographic catchments

Transport is roughly 34% of processing cost and scales directly with catchment dispersion, which makes route density the single largest lever available to any operator. Consolidating collection within a compact radius beats expanding into adjacent territory at almost every scale. Operators pursuing geographic breadth over density have consistently found the economics disappointing. Breadth over density disappoints reliably.

Favour liquid feed routes where drying can be avoided

Drying and sterilisation carry roughly 27% of processing cost and Japanese industrial energy pricing has moved unfavourably more than once. Liquid ecofeed avoids most of that entirely, though it constrains transport radius and shelf life in exchange. The trade favours liquid routes wherever a livestock customer sits close enough to the processing site to take it.

Capture disposal fee income rather than paying for feedstock

Generators pay to have food waste removed, and a processor positioned as the disposal solution captures that fee rather than bidding for material. Biogas operators with subsidy support can outbid on price, so competing on collection reliability and compliance documentation is the more defensible position. Manufacturers value both considerably more than a marginal price difference.

Portfolio Architecture for Margin Defence

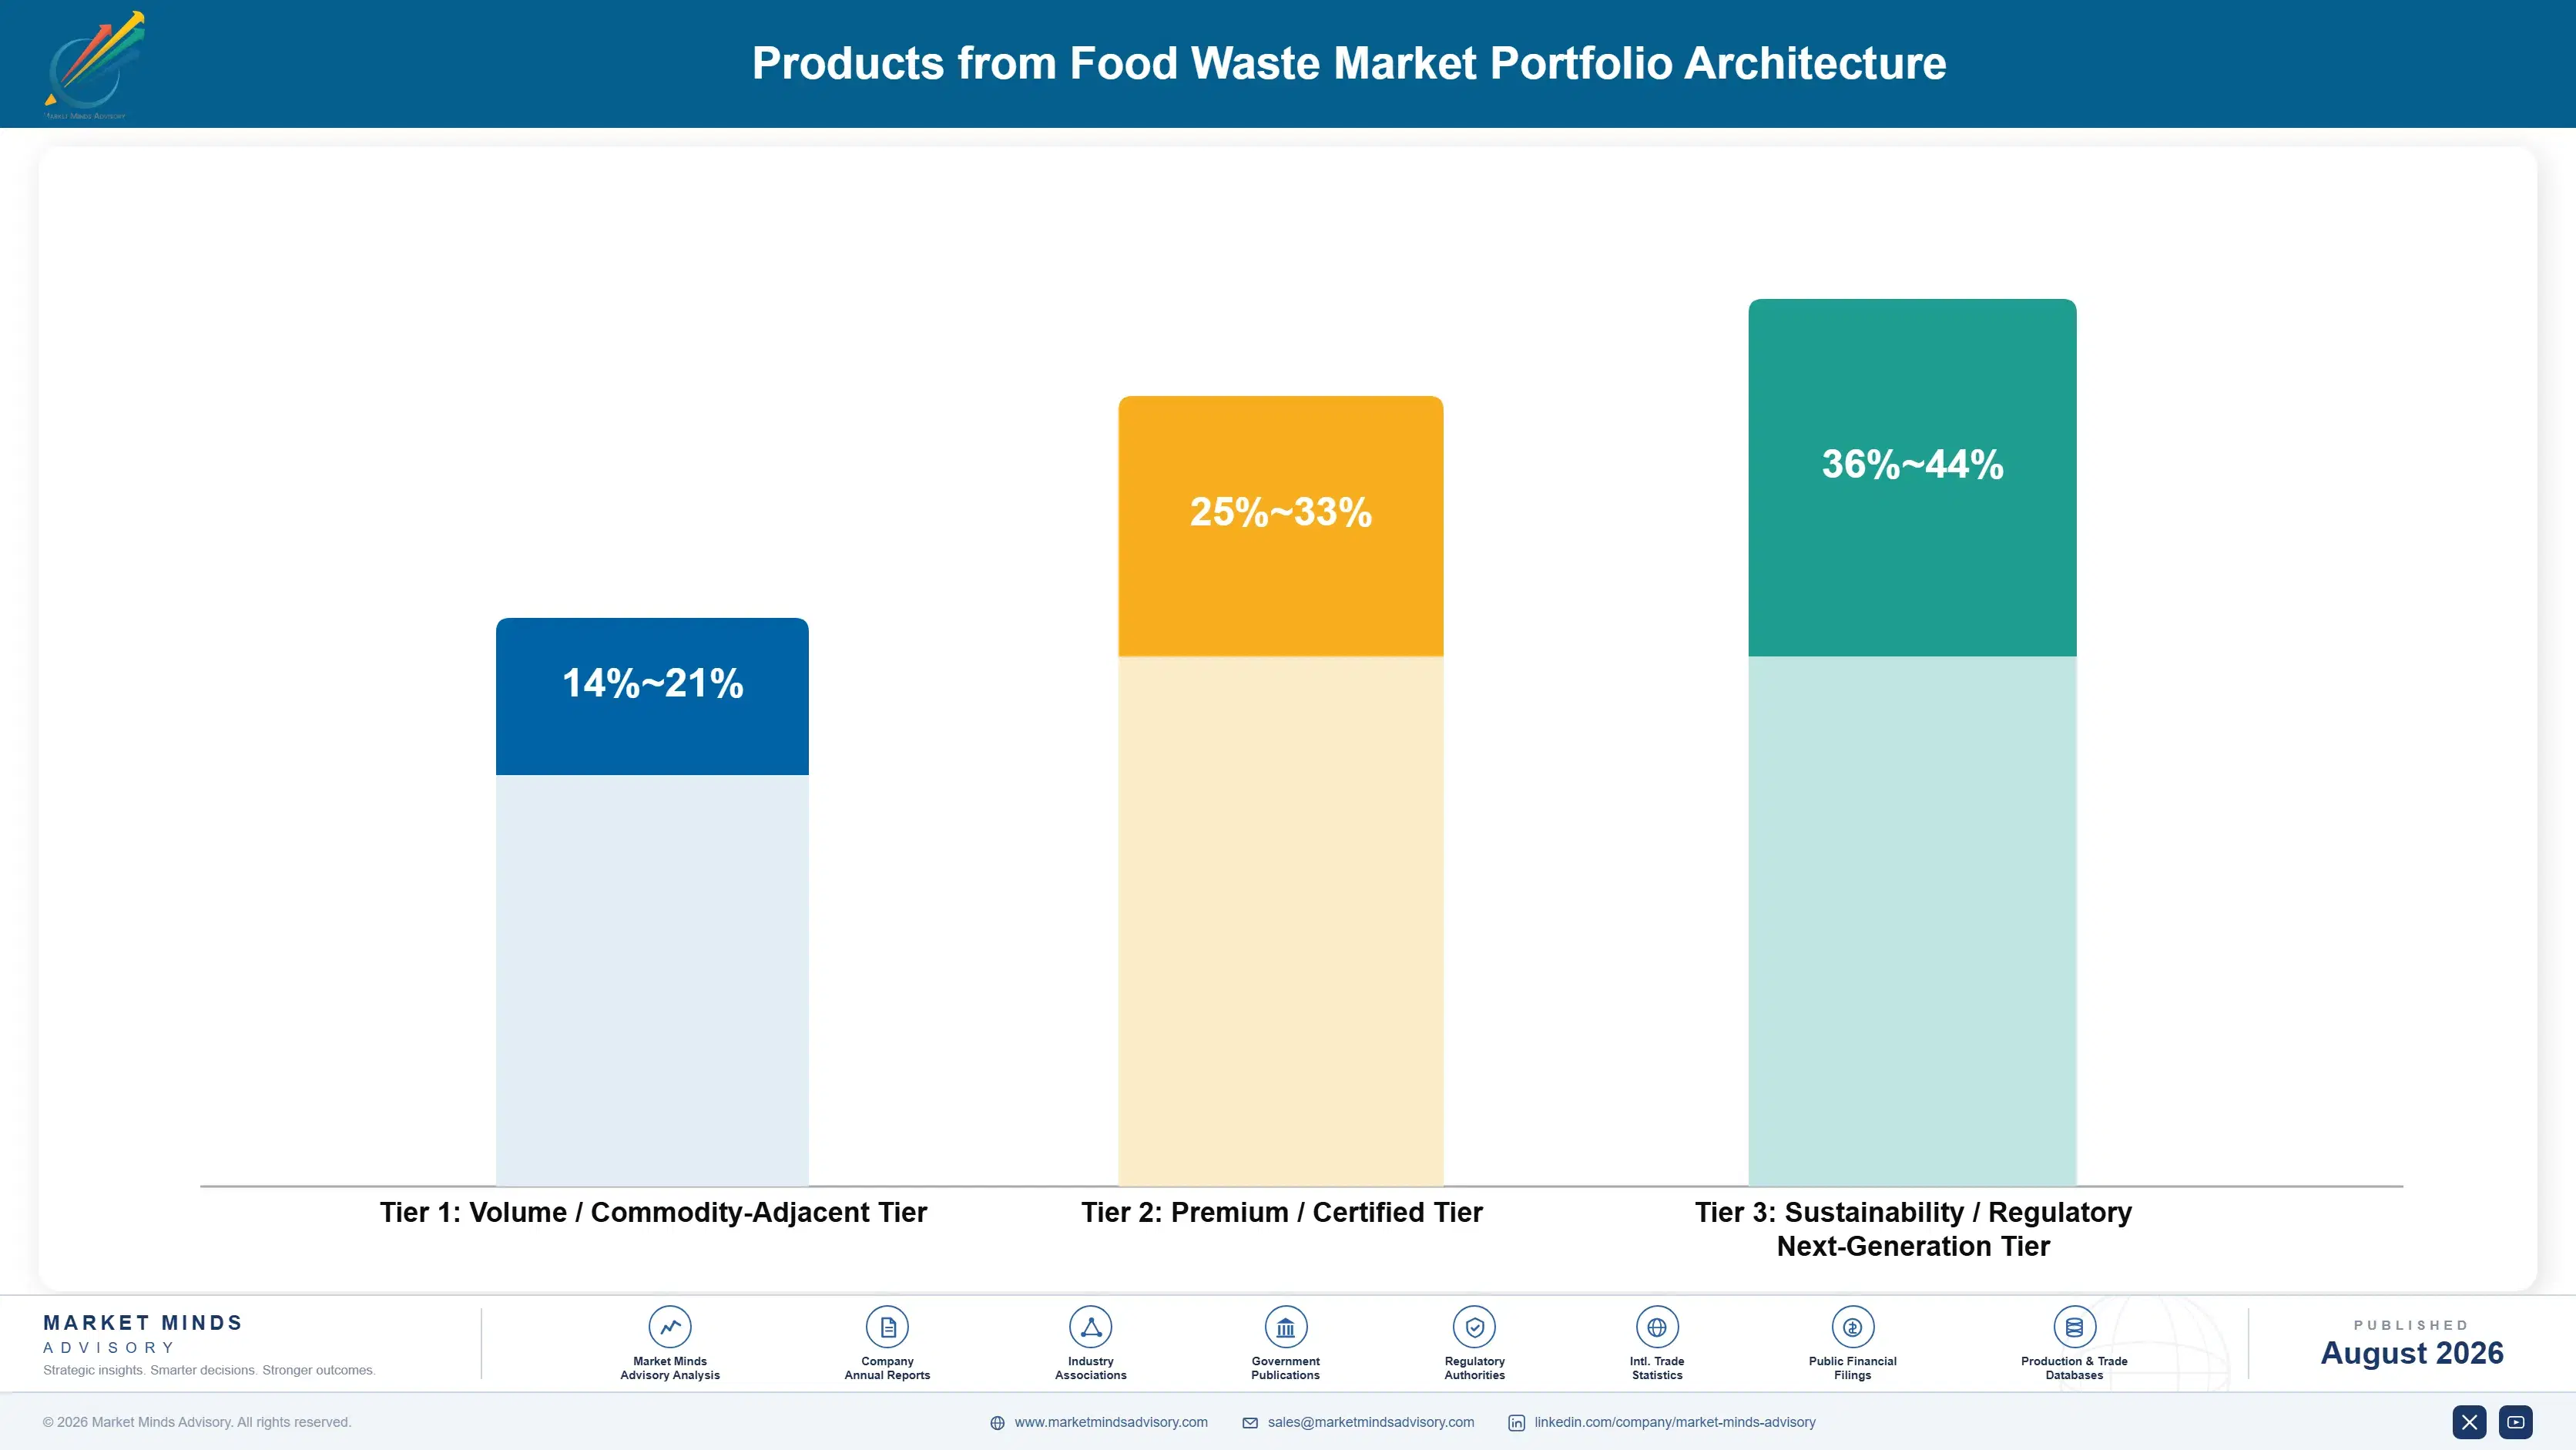
Margin here tracks output value per tonne rather than processing volume, and the spread between routes is wider than in almost any recovery industry. Composts and soil amendments earn margins in the low teens, since the product competes against subsidised alternatives and transport cost frequently exceeds product value beyond a short radius. Disposal fee capture rather than product sale carries the economics in that tier.
Ecofeed sits in the middle at margins in the low to high twenties, supported by feed grain import pricing rather than by any environmental premium and stable in a way policy-dependent routes are not. The range reflects catchment density and whether the operator runs liquid or dry routes, which differ substantially on energy cost. Policy-dependent routes are considerably less stable than this one.

Upcycled human food ingredients hold the strongest position, running into the high thirties, at roughly nine times feed grade value per tonne. Those margins reflect input hygiene control that restricts sourcing to manufacturing residues, which is both the barrier and the reason internally integrated food manufacturers hold the best positions in that tier. Integrated food manufacturers therefore hold the best positions available.

Composts and Soil Amendments

Composted and digested outputs sold as soil amendments into agriculture and landscaping. The eight point range reflects transport radius and whether the operator captures disposal fee income, since product value alone rarely covers logistics.
Gross Margin: 10-18%

Ecofeed and Animal Nutrition Outputs

Liquid and dry livestock feed produced from food manufacturing and retail residues. The eight point range reflects catchment density and whether processing uses liquid routes that avoid the substantial energy cost of drying.
Gross Margin: 21-29%

Upcycled Ingredients and Industrial Materials

Human food ingredients and industrial materials recovered from manufacturing residues. The ten point range reflects input hygiene control and whether the operator holds internal residue streams or must source externally.
Gross Margin: 29-39%
products-from-food-waste-industry-in-japan-market-portfolio-architecture-1787581008251

High-value Sub-segments and Strategic Watch-out

Upcycled Human Food Ingredients

High value and the fastest growth at 7.5%, realising around nine times feed grade value per tonne. Input hygiene restricts sourcing to manufacturing residues, which favours integrated food manufacturers over independent collection operators considerably. Traditional culinary standing removes the acceptance obstacle. Volume stays small. Sourcing stays narrow.
Gross Margin: 32-39%

Manufacturing Contracted Ecofeed

Solid value and stable, supported by feed grain import economics rather than by policy. Multi-year manufacturer contracts protect against subsidised biogas bidding, which dispersed generators offer no defence against at all. Feed grain import economics underpin the whole position. Contracts protect it. Policy does not underpin it.
Gross Margin: 24-29%

Retail Sourced Processing Volume

The volume tier facing permanent contraction. Convenience retail source reduction removes feedstock that no collection improvement recovers, and the direction of travel is unambiguous and environmentally correct besides. Retail was never a high recovery sector to begin with. Contraction is permanent. Direction is unambiguous. Nothing reverses it.
Gross Margin: 18-25%

Compost and Digestate Outputs

The strategic watch-out. Product value rarely covers transport beyond a short radius and the output competes against alternatives that carry their own support. Disposal fee capture rather than product sale carries the economics. Transport radius caps the addressable market sharply. Support favours alternatives. Radius decides viability.
Gross Margin: 10-18%

Where the Tonnes Keep Arriving

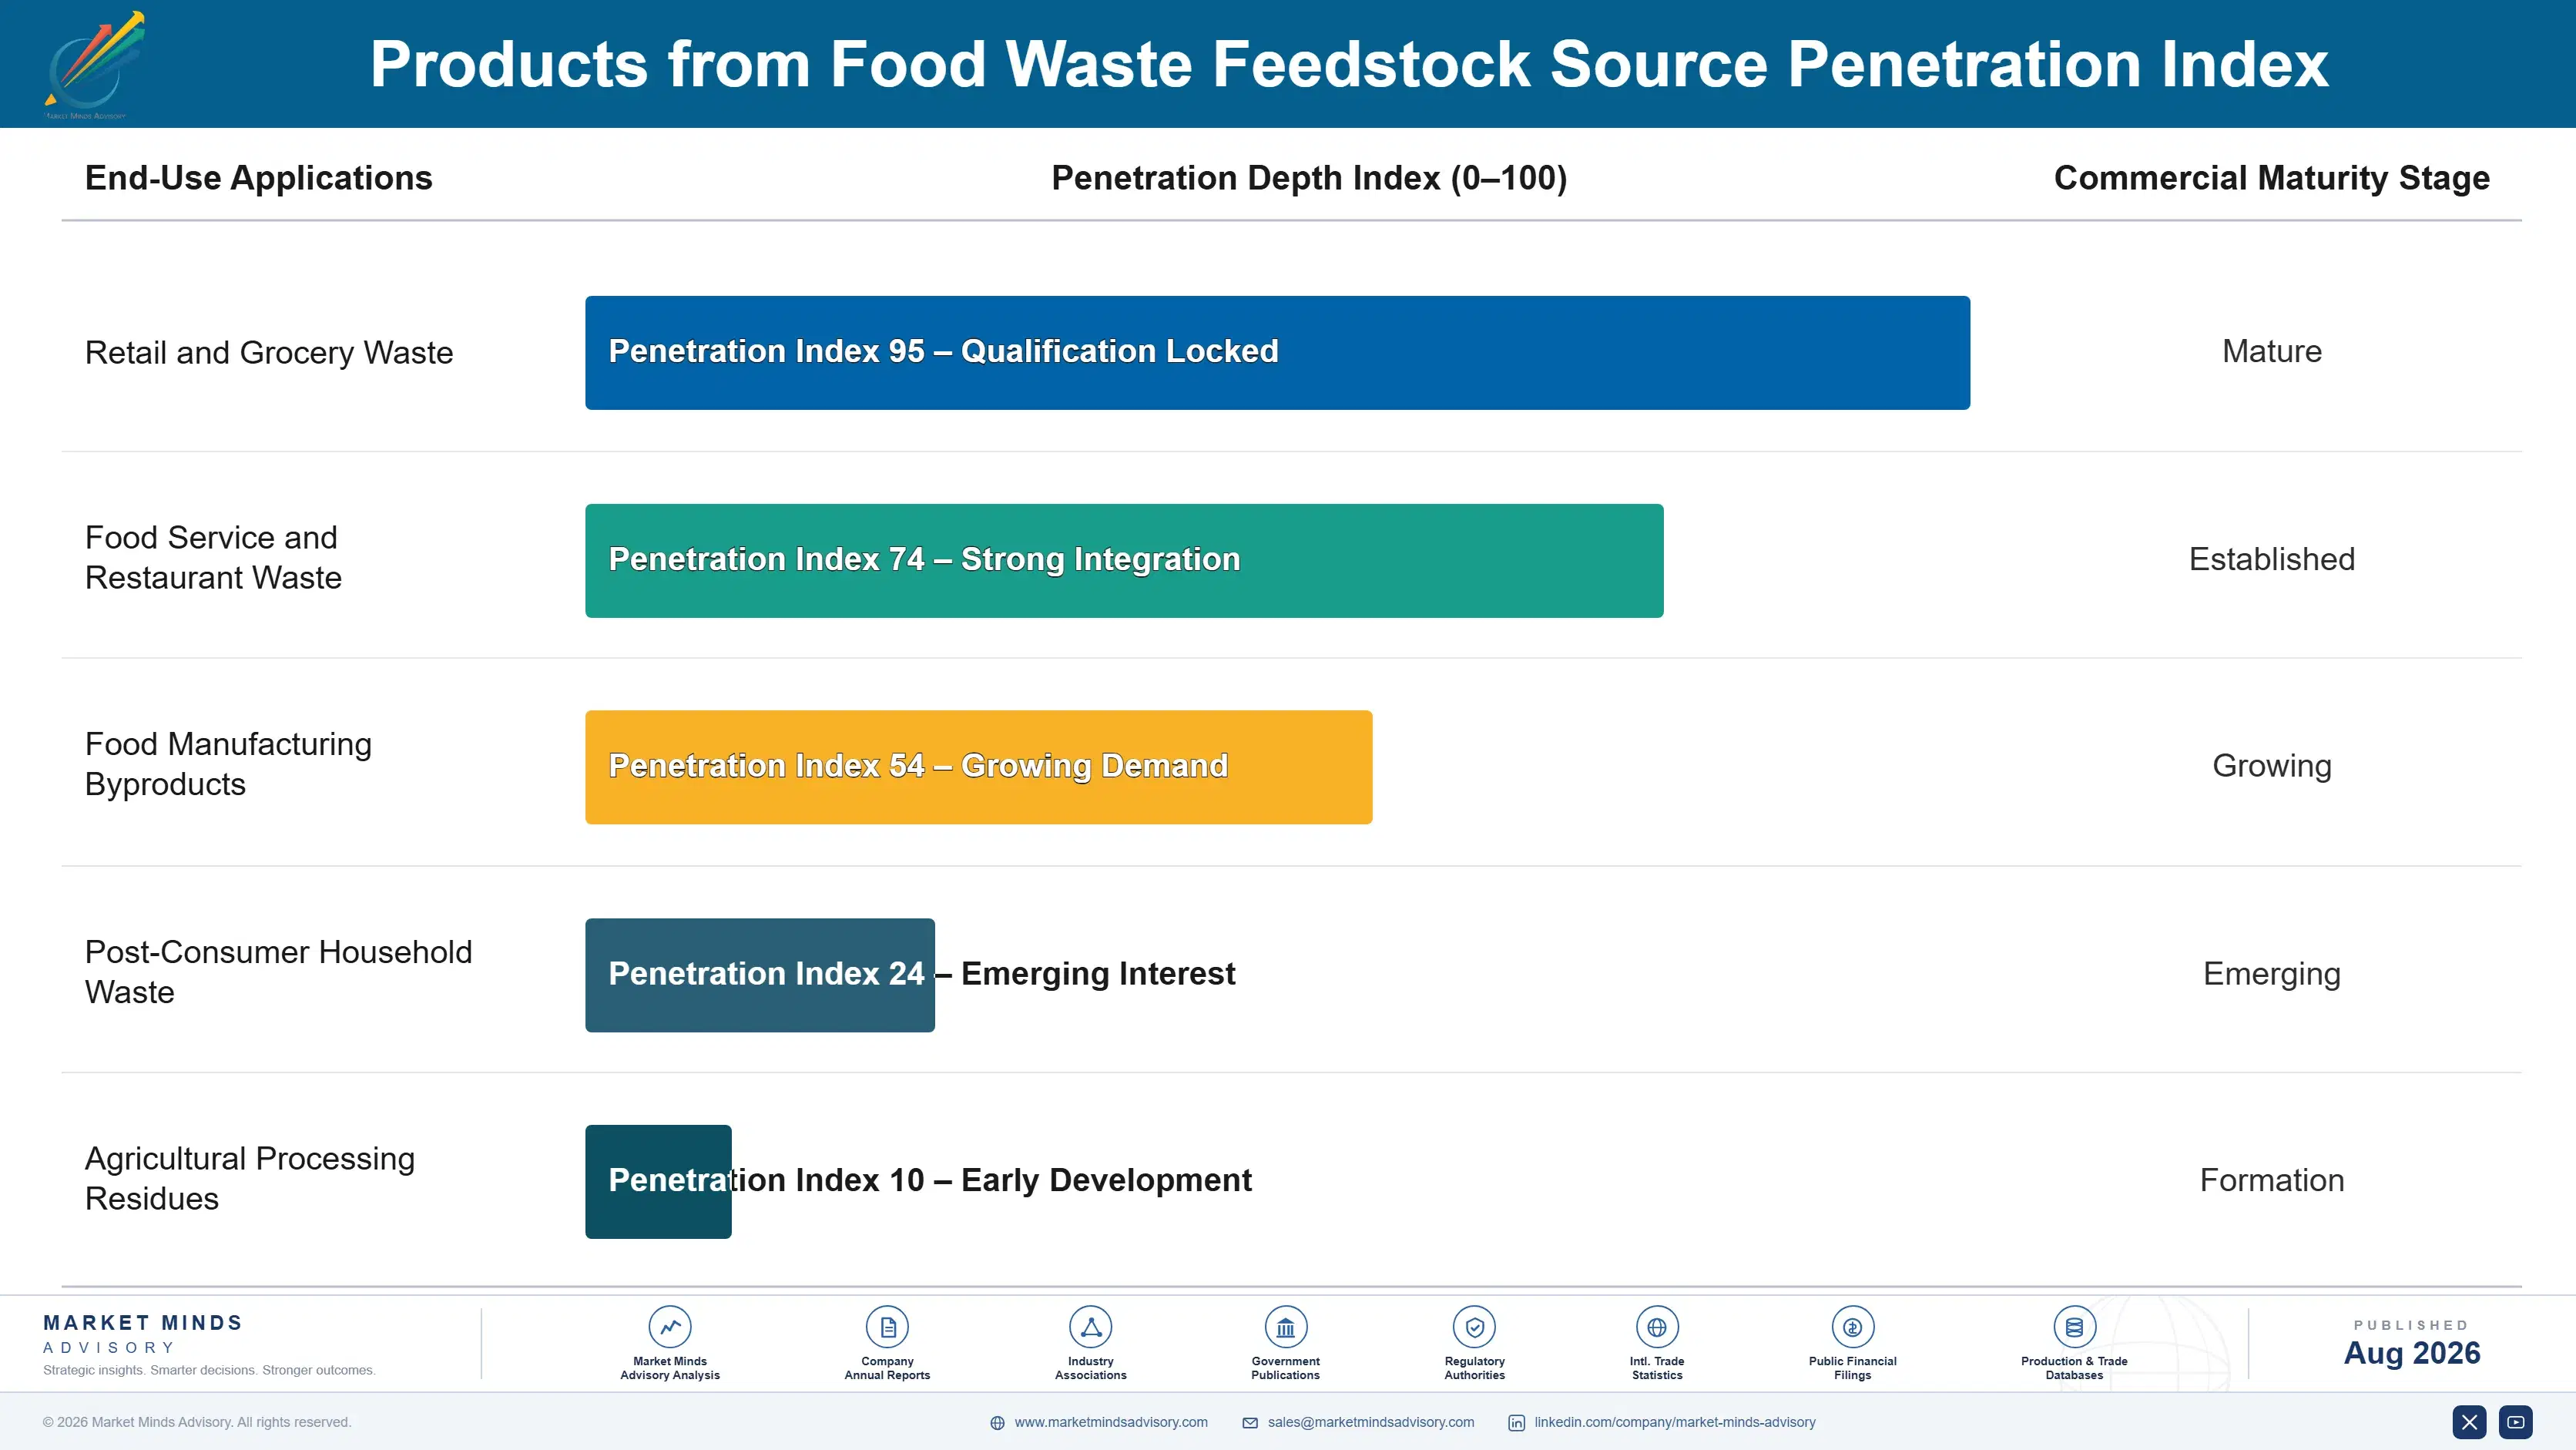
Manufacturing feedstock arrives continuously and predictably, because a food plant produces residue every shift it runs and has to move it somewhere the same day. That makes a multi-year collection contract genuinely annuity-like, with volume varying by production schedule rather than by any decision either party makes. Roughly 95% of manufacturing waste is already recovered, so the relationship is about which processor rather than whether to recover at all.
Stickiness follows contract structure and site integration. Internally processed residues at integrated food manufacturers never enter the market at all. Contracted manufacturing collection is highly sticky, since changing processor means new logistics, new compliance documentation and a disruption a plant manager has no reason to accept. Dispersed foodservice and retail collection switches on price, and biogas operators with subsidy support bid it away regularly.

The commercial relationship sits with a facility manager rather than a purchasing function. Food waste removal is an operational necessity handled by whoever runs the plant, and it is bought on reliability and compliance paperwork rather than on price. A processor who misses a collection creates an immediate hygiene problem, which is why service record matters more here than in most industrial supply relationships.
products-from-food-waste-industry-in-japan-market-end-use-penetration-index-1787581008739

Where We Would Focus Effort

These are among the four positions where our research anticipates prominent divergence between winners and laggards over the coming forecast period. Each is grounded in the demand model, the regulatory perimeter, and the announced capacity pipeline.
01 / OUTPUT VALUE MIGRATION

Move tonnes up the value ladder, not chase more tonnes

Upcycled human food ingredients realise around nine times feed grade value per tonne from material that feed conversion treats as undifferentiated input, and Japanese consumer acceptance of okara, sake lees and similar materials is unusually good because several hold traditional culinary standing. Input hygiene requirements restrict sourcing to manufacturing residues rather than mixed streams. Moving even a modest share of throughput upward changes revenue per tonne far more than any volume growth realistically available across a feedstock base that is already contracting demographically.
02 / FOODSERVICE GAP ATTACK

Go where recovery is 35%, not where it is already 95%

Food manufacturing recovers roughly 95% of its waste and has essentially no headroom left, while foodservice recovers only around 35%, and the difference between them is collection and separation rather than any technology gap. Restaurant waste is dispersed, mixed and contaminated with packaging in ways that manufacturing residues never are. Consolidating collection catchments and funding separation equipment at generator sites have both demonstrably moved that rate, and the available volume is large precisely because the current recovery rate sits so very low.
03 / FEEDSTOCK CONTRACT SECURITY

Lock manufacturing supply before subsidised bidders take it

Biogas operators bid for exactly the same material with renewable energy support behind them, and dispersed generators sell to whoever offers most on any given day. Manufacturing generators behave quite differently, valuing collection reliability and compliance documentation well above any marginal price, which makes multi-year feedstock contracts genuinely achievable with them. Securing that supply protects plant utilisation as the overall feedstock base contracts demographically, and the processors who left their supply uncontracted are already losing material to exactly that bidding.
04 / TECHNOLOGY EXPORT POSITIONING

License where feeding rules permit, which is not the West

Japanese ecofeed technology transfers perfectly well while the regulatory permission that it depends on plainly does not, which closes European and North American markets entirely, regardless of how much interest those markets keep expressing. Vietnamese and Thai livestock sectors both share Japan's feed import exposure and operate under considerably less restrictive feeding rules. Licensing and joint development both cost far less than building any capacity and monetise expertise which a shrinking domestic feedstock base cannot fully employ in any case.

Engagement Snapshot From the Field

A live engagement with an industry participant carrying material or product regulatory and market exposure ahead of a defining policy shift, showing how our research translates into a defensible multi-year portfolio strategy.
MARKET MINDS ADVISORY · CLIENT ENGAGEMENT SUMMARY
Products from Food Waste Industry in Japan Producer Strategic Portfolio Review and Transition Roadmap 2026·Investment Scenario on Products from Food Waste Industry in Japan Exposure Evaluation 2025-26
CLIENT PROFILE
A Japanese regional food waste processor operating three plants across two prefectures, producing liquid ecofeed and compost from manufacturing and retail feedstock, with annual revenue near 9.4 billion yen (client-reported, unverified by MMA). Retail feedstock accounted for roughly a third of input, and no upcycled human food ingredient capability existed anywhere in the business. Utilisation had fallen across all three.
STRATEGIC CHALLENGE
A major convenience retail customer had extended dynamic pricing nationally, cutting the volume reaching the client's plants, and a biogas operator with renewable energy support had won two manufacturing contracts on price. Utilisation had fallen across all three plants. Management needed to decide between catchment expansion, output mix change and foodservice collection entry.
MMA APPROACH
MMA modelled feedstock availability by generator sector across the client's catchments through 2032, costed upcycled ingredient capability against available manufacturing residue streams, and assessed foodservice collection economics at several catchment densities. Biogas bidding behaviour was analysed across recent contract losses. Interviews with 47 experts covered ecofeed formulation, food waste collection and upcycled ingredient development.
KEY FINDINGS
  1. Retail feedstock across the client's catchments was projected to fall by more than a third within six years on announced source reduction measures alone, before any demographic effect.
  2. Two manufacturing customers produced residue streams clean enough for upcycled human food ingredient use, and neither had ever been approached about anything beyond feed conversion.
  3. Foodservice collection was economic only above a catchment density the client achieved in one prefecture and could not reach in the other under any modelled consolidation.
  4. Both contracts lost to biogas had been uncontracted annual arrangements, and no multi-year agreement in the client's portfolio had been lost to subsidised bidding at all.
CLIENT PROFILE
A Japanese regional food waste processor operating three plants across two prefectures, producing liquid ecofeed and compost from manufacturing and retail feedstock, with annual revenue near 9.4 billion yen (client-reported, unverified by MMA). Retail feedstock accounted for roughly a third of input, and no upcycled human food ingredient capability existed anywhere in the business. Utilisation had fallen across all three.
STRATEGIC CHALLENGE
A major convenience retail customer had extended dynamic pricing nationally, cutting the volume reaching the client's plants, and a biogas operator with renewable energy support had won two manufacturing contracts on price. Utilisation had fallen across all three plants. Management needed to decide between catchment expansion, output mix change and foodservice collection entry.
MMA APPROACH
MMA modelled feedstock availability by generator sector across the client's catchments through 2032, costed upcycled ingredient capability against available manufacturing residue streams, and assessed foodservice collection economics at several catchment densities. Biogas bidding behaviour was analysed across recent contract losses. Interviews with 47 experts covered ecofeed formulation, food waste collection and upcycled ingredient development.
KEY FINDINGS
  1. Retail feedstock across the client's catchments was projected to fall by more than a third within six years on announced source reduction measures alone, before any demographic effect.
  2. Two manufacturing customers produced residue streams clean enough for upcycled human food ingredient use, and neither had ever been approached about anything beyond feed conversion.
  3. Foodservice collection was economic only above a catchment density the client achieved in one prefecture and could not reach in the other under any modelled consolidation.
  4. Both contracts lost to biogas had been uncontracted annual arrangements, and no multi-year agreement in the client's portfolio had been lost to subsidised bidding at all.
RECOMMENDED STRATEGY
Phase 1: Phase one: convert remaining manufacturing feedstock to multi-year contracts, since every loss to biogas bidding came from uncontracted annual arrangements. Phase 2: Phase two: develop upcycled ingredient capability around the two clean residue streams already available, which no competitor has approached those generators about. Phase 3: Phase three: enter foodservice collection in the denser prefecture only, and accept that the second prefecture cannot support it economically.
OUTCOME
The processor contracted 78% of manufacturing feedstock on multi-year terms during 2026 and lost no further volume to biogas bidding (client-reported, unverified by MMA). Upcycled ingredient development began with one manufacturing customer, and foodservice collection entry was confined to the denser prefecture as recommended. Compost output was reduced accordingly.

Frequently Asked Questions

Foundational context covering the market sizes, CAGR, scope, country, region and competition that inform every finding below. This section is provided to cover basics and most often pre-purchase conversations, answered from the MMA Primary Research Dataset.

What is the current size of the Products from Food Waste Industry in Japan Market?

MMA sizes it at USD 3.8 billion in 2025, rising to USD 3.99 billion in 2026. The figure covers products manufactured from recovered food waste within Japan at producer selling value.

How large will the Products from Food Waste Industry in Japan Market be by 2036?

USD 6.50 billion by 2036, an incremental USD 2.51 billion over the 2026 base and an expansion multiple of 1.63 times. Upcycled ingredients account for a disproportionate share.

What is the CAGR for the Products from Food Waste Industry in Japan Market 2026 to 2036?

5.0% in the base case, with a bull case at 6.2% and a bear case at 3.8%. The spread turns on upcycled ingredient acceptance and on how fast feedstock contracts demographically.

Which segment is growing fastest?

Upcycled human food ingredients at 7.5%, half again the market rate of 5.0%. They realise around nine times feed grade value per tonne from the same recovered material.

Who are the major companies in the Products from Food Waste Industry in Japan Market?

Japan Food Ecology Center, Ajinomoto, Kirin Holdings, Asahi Group Holdings and Nippon Ham lead on annual food waste processed into products. Fifteen further participants are profiled.

Which country is growing fastest?

Japan itself at 5.0%, since this report covers the Japanese domestic industry. Growth comes from output value migration rather than from any increase in recovered tonnage.

Report Segmentation Architecture

The full report scope spans multiple orthogonal segmentation dimensions, with cross-tabulated demand data provided for each dimension pair. Coverage extends further to regional breakdowns, trend trajectories, and the competitive detail needed to support segment-level decision-making.

By Output Product Class

  • Liquid and Dry Ecofeed
  • Composts and Soil Amendments
  • Upcycled Human Food Ingredients
  • Biogas and Methane Fermentation Outputs
  • Industrial Materials and Bioplastics
  • Pet Food and Aquaculture Feed

By Feedstock Sector

  • Food Manufacturing Residues
  • Retail and Convenience Store Waste
  • Restaurant and Foodservice Waste
  • Wholesale and Distribution Waste
  • Institutional and School Catering
  • Beverage and Brewing Residues

By Commercial Dimension

  • Contracted Collection Agreements
  • Disposal Fee Based Arrangements
  • Internal Residue Processing
  • Product Sales to Livestock Producers
  • Ingredient Supply to Manufacturers
  • Technology Licensing and Export

By Region

  • North America
  • Western Europe
  • East Asia
  • South Asia and Pacific
  • Latin America
  • Middle East and Africa
  • Eastern Europe

Scope, Methodology, and Coverage

Every figure in this report is reproducible from documented input assumptions. The scope below maps the historical period, the forecast horizon, the segmentation dimensions, and the countries covered, alongside the underlying primary and qualitative methodology.
Historical Period
2020 to 2025
Forecast Period
2026 to 2036
Base Year
2025 (USD billions; MMA Primary Research Dataset, August 2026)
Market Definition
Products manufactured from recovered food waste within Japan, spanning liquid and dry livestock ecofeed, composts and soil amendments, upcycled human food ingredients, biogas and methane fermentation outputs, industrial materials and bioplastics, and pet or aquaculture feed, measured at producer selling value. Food waste collection and disposal services sold as services, incineration and landfill, unprocessed surplus food redistribution, and equivalent industries outside Japan are excluded from scope entirely.
Quantitative Units
USD billions (current prices); million tonnes of food waste processed annually; USD per tonne by output class
Segmentation Dimensions
Output product class; feedstock sector; commercial dimension; region
Regions Covered
North America, Western Europe, East Asia, South Asia and Pacific, Latin America, Middle East and Africa, Eastern Europe
Countries Covered
Japan, with reference to South Korea, China, Vietnam, Thailand, Australia, United States, Canada, Germany, Netherlands, France, United Kingdom, Denmark, Italy, Spain, Brazil, Peru, United Arab Emirates, Israel, Poland
Key Companies Profiled
Japan Food Ecology Center, Ajinomoto, Kirin Holdings, Asahi Group Holdings, Nippon Ham, Suntory Holdings, Meiji Holdings, Morinaga, Kagome, House Foods Group, Marubeni, Mitsui and Co, Amita Holdings, JFE Engineering, Hitachi Zosen, Kubota, Yanmar, Zen-Noh, Nichirei, Ebara Corporation
Quantitative Methodology
Primary survey, n=3,800 respondents, Q4 2025, six countries; demand-side model with trade association cross-validation
Qualitative Methodology
47 expert interviews, Q4 2025; applied to validate demand model assumptions, identify emerging dynamics, and assess competitive positioning
Report Format
PDF and XLSX data workbook (Word format preview document)
Publisher
Market Minds Advisory
Report Code
MMA-2026-AGR-179
Published
August 2026
Contact
sales@marketmindsadvisory.com | www.marketmindsadvisory.com

Purchase the full Products from Food Waste Industry in Japan Market Report (2026 to 2036).

The full report explains why Japan achieves food waste recovery rates no other country matches and why that model cannot be exported, sizing each output class independently through 2036. It models feedstock availability by generator sector against demographic and source reduction trends, quantifies value per tonne across recovery routes, and assesses which international markets could adopt Japanese practice given their own feeding regulations. Regional chapters cover the defined Japanese scope in depth alongside export and technology flows. Competitive profiling covers 20 participants on a single processed tonnage basis.
Each output class sized independently through 2036
Feedstock availability modelled by generator sector to 2032
Value per tonne quantified across every recovery route
Feeding regulation compared across candidate export markets
Twenty participants profiled on one consistent basis
Catchment density economics modelled against collection cost

Built For The People Who Decide

From boardroom strategy to bench-side execution, this report is read cover-to-cover by leaders shaping the next decade of their industry, turning demand scenarios, market dynamics and valuation benchmarks into decisions.
CXOs/ Presidents/ VPs/ Managers
M&A and Corporate Development
Strategy Teams and R&D Heads
Procurement and Product Directors
Regulatory and Compliance Leaders
Investor Relations and Equity Analysts