Market Minds Advisory
Product Tour Software for SaaS Market

Product Tour Software for SaaS Market: Product Tour Software for SaaS: The Category Named Itself After the Format That Performs Worst

Multi-step walkthroughs are completed by about 24% of users while single-step contextual prompts are acted on by 61%, and the industry took its name from the first one of those two.

Lead Analyst

Published

September 2026

Make Smarter Decisions with Customized Research Insights

Request a free sample report and evaluate market opportunities, growth trends, and competitive dynamics relevant to your business needs.

2025 MARKET VALUE$1.1BMarket Size 2025
2036 FORECAST VALUE$5.3BBase Case , 2026 to 2036
CAGR 2026 TO 203615.4 %Bull 16.6% / Bear 14.2%
INCREMENTAL OPPORTUNITY$4.0BNet 10- year value creation
EXPANSION MULTIPLE4.19x2036 value over 2026 base
Strategic Levers
M&A Pipeline
Regional Outlook
Country Rankings
Competitive Intelligence
Segmental Deep-dive
Call-Us : 91 93563 13602

Executive Snapshot and Market Trajectory.

About 24% of users complete a multi-step walkthrough and roughly 61% act on a single contextual prompt triggered by what they were already doing. The category took its name from the first format, which is the one that performs worst. Nobody names a category after its weakest format on purpose.
Interactive demo and sandbox environments grow at 23.1%, half again the market rate of 15.4%, because they solve a sales problem rather than an onboarding one and remove around 9 days from a cycle. Contextual in-app guidance follows at 18.6%. North America takes 46% of value, since that is where the software companies buying this are headquartered. Enterprise adoption platforms grow at 13.4% on internal rollouts nobody chose to be part of.
Concentration sits near 34% across the top five on measured subscription and service revenue. The permanent competitive pressure is that a competent front-end team can replicate basic guidance for roughly USD 34,000 of internal effort, which is why vendors survive on targeting and analytics rather than on the overlays themselves. The overlay itself was never really the product, whatever the demonstrations suggest. Targeting is.
Market Definition
This market covers software used to guide, demonstrate and drive adoption inside and around software products, spanning interactive demo and sandbox environments, contextual in-app help and triggered guidance, onboarding checklists and activation flows, linear product tours and walkthroughs, enterprise digital adoption platforms, and in-product announcement and release messaging. Revenue is measured as subscription, usage and attributable service value at supplier level. Product analytics sold separately, customer support and ticketing software, learning management systems, marketing automation platforms, and sales engagement tooling without product demonstration capability are excluded.
Base Year Value
$1.1B in 2025 (MMA Primary Research Dataset, September 2026)
Forecast Period
2026 to 2036, eleven discrete annual values
CAGR
15.4% base case. Bull 16.6%. Bear 14.2%.
Fastest Growth Segment
Interactive Demo and Sandbox Environments: 23.1% CAGR
Fastest Growth Country
India: 19.2% CAGR
Fastest Growth Region
South Asia and Pacific: 17.6% CAGR
Largest Region
North America: 46% of 2025 global value
Market Leaders
Pendo, WalkMe, Appcues, Whatfix and Userpilot lead on measured subscription and service revenue. Source: MMA Primary Research Dataset, July 2026.
Primary Survey
n=3,800 procurement and R&D decision-makers, Q4 2025, six countries
Methodology
Demand-side build-up, cross-validated against public data, 47 expert interviews

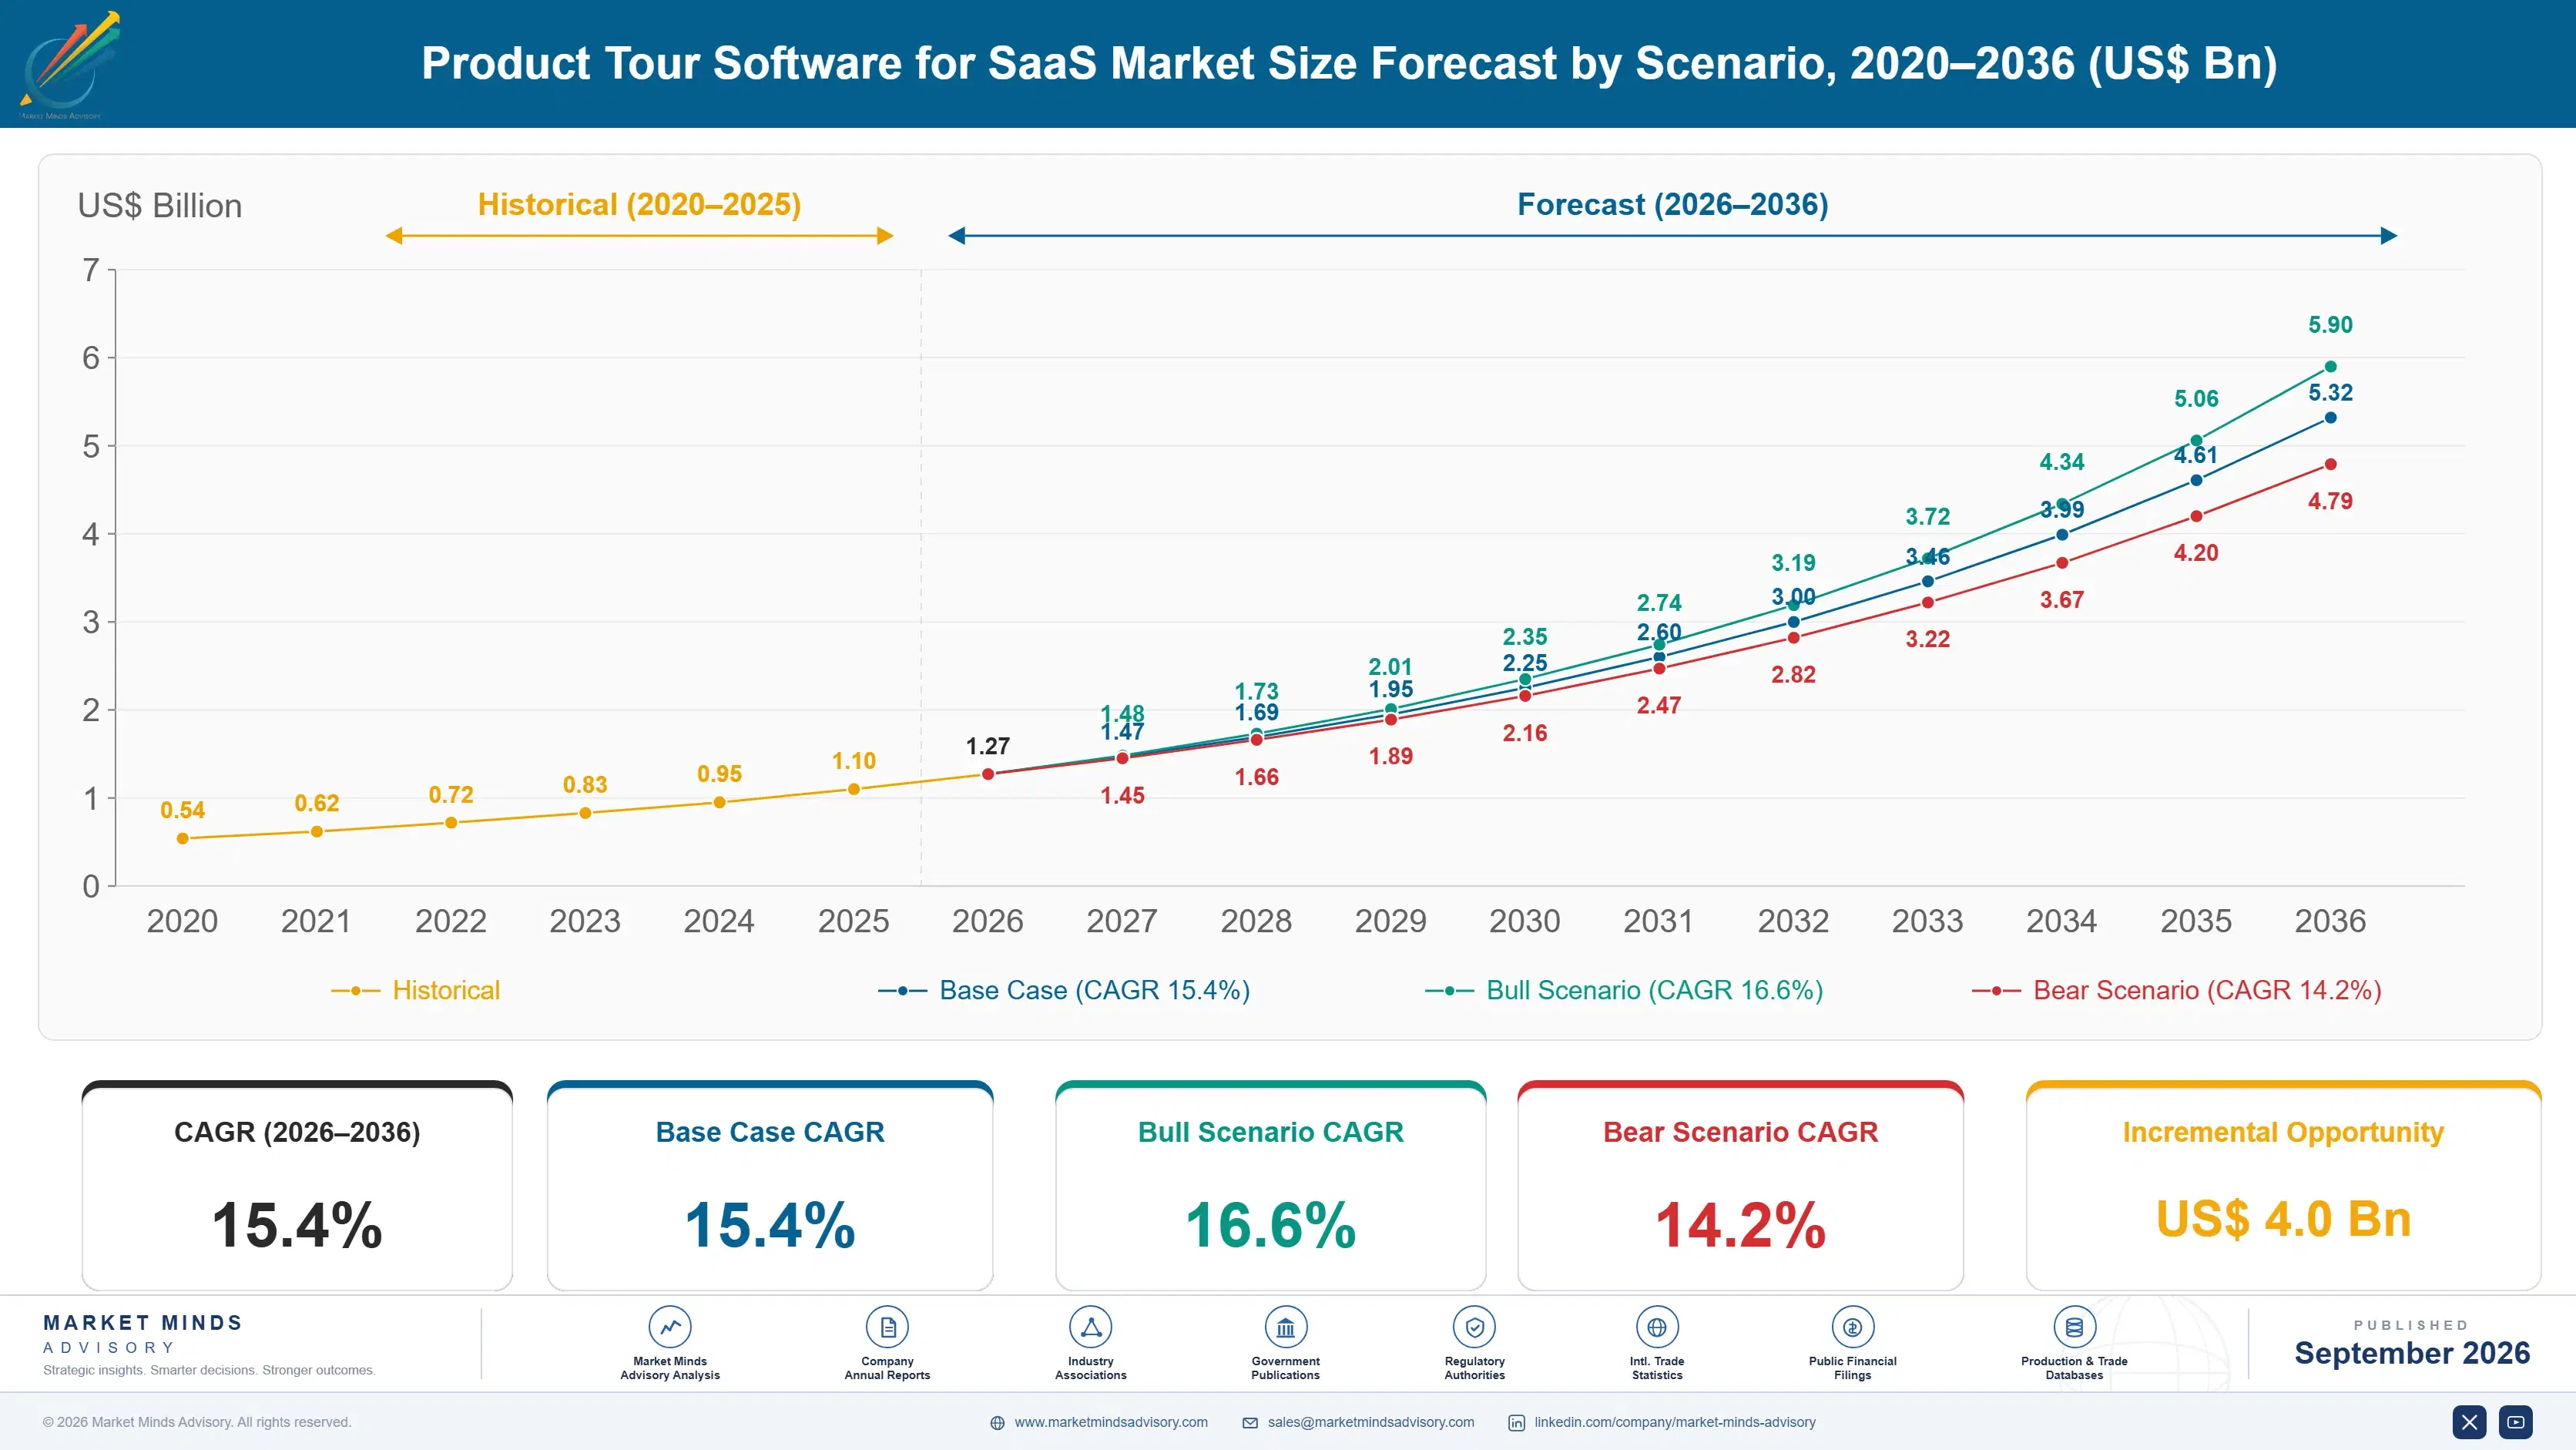
Product Tour Software for SaaS Market Forecast Scenarios

product-tour-software-for-saas-market-size-forecast-scenario-1788453122354
Growth ran at 14.0% from 2020 to 2025, and the category split in half somewhere inside that period without changing its name. In-app guidance sold to product teams matured, consolidated and began losing ground to analytics suites and to companies building their own. Interactive demo tooling emerged separately, sold to marketing and sales, and grew far faster because it addressed a commercial problem nobody had previously solved.
The base case at 15.4% rests on three mechanisms. Interactive demos remove around 9 days from a sales cycle by letting a buyer explore a working environment before any call, which is a revenue argument rather than a product one. Contextual guidance acted on by roughly 61% of users replaces linear tours completed by 24%, so spending shifts within the category rather than leaving it. Third, enterprise adoption platforms continue growing on internal software rollouts nobody enjoys.
The bull case at 16.6% assumes interactive demos become standard in software buying the way free trials did, which would move the category firmly into marketing budgets. The bear case at 14.2% is that build-versus-buy pressure intensifies as guidance capability becomes commoditised, with internal replication costing around USD 34,000 against subscriptions near USD 28,000 annually.

Nobody Wants a Tour

Two numbers describe what users actually do. A multi-step walkthrough is completed by about 24% of the people it interrupts. A single contextual prompt, triggered by something the user was already attempting, is acted on by roughly 61%. One interrupts and the other assists, and the category named itself after the interrupting format because that is what shipped a decade ago.
TOP FIVE CONCENTRATION34%Fragmented across adoption platforms and demo specialist vendors
LINEAR TOUR COMPLETION24%Users finishing a multi-step walkthrough without dismissing it
CONTEXTUAL HELP ENGAGEMENT61%Users acting on single-step guidance triggered by behaviour
BUILD VERSUS BUY COSTUSD 34,000Internal engineering spend to replicate basic guidance capability
DEMO CYCLE REDUCTION9 daysSales cycle time removed by self-serve interactive demos
ANNUAL PLATFORM PRICEUSD 28,000Typical annual subscription cost for a mid-market deployment
The market has since split into two businesses wearing one name. In-app guidance sells to product teams against activation and support deflection, and it is under pressure from analytics suites bundling overlays and from software companies building their own. Interactive demo tooling sells to marketing and sales against pipeline, removing around 9 days by letting a buyer explore before speaking to anybody. Those are different buyers entirely.
Build versus buy is a live question here in a way it is not elsewhere. A competent front-end team can produce serviceable tooltips and checklists for roughly USD 34,000 of internal effort against subscriptions near USD 28,000 a year, so the arithmetic is genuinely close. What vendors actually sell is targeting, analytics and no-code editing a product manager uses without an engineering ticket. Once engineering is involved the buy case weakens.
"The uncomfortable finding is that the product tour is the least effective thing these platforms do, and it is the thing the category is named after. Vendors selling walkthroughs are selling the format users dismiss fastest, while the contextual prompt buried in the feature list is doing the actual work."
Director, Product Experience and Software Adoption Practice · MMA Technology Practice · September 2026

Market Trends

Interactive Demos Moved the Category Into Sales

Cloned or recorded product environments that a buyer explores before any conversation remove around 9 days from a sales cycle and qualify interest before a representative spends time on it, which is a revenue argument rather than a product experience one. That moved purchasing from product management into marketing and sales, where budgets are larger and decisions faster. Interactive demo environments grow at 23.1%, faster than anything else here. Vendors built around product team selling reach these buyers through the wrong conversation entirely. Deal sizes in that motion look nothing like product team pricing.
Market Impact: Fastest segment at 23.1% growth
Contextual Prompts Displace Linear Product Walkthroughs

Users act on roughly 61% of single-step prompts triggered by what they were already doing, against about 24% completing multi-step walkthroughs that interrupt them at login. Product teams measuring both have quietly rebuilt their guidance around triggered assistance and retired the tours entirely. Spending moves within the category rather than out of it, so the shift is invisible in market totals and decisive in product roadmaps. Linear tours grow at 6.8% while contextual guidance grows at 18.6%. The category continues naming itself after precisely the format its own customers are quietly removing.
Market Impact: Grows at 13.4% each year

Market Opportunities and Growth Drivers

Software Buyers Want to Try Before Speaking to Anyone

Business software purchasing has moved toward self-directed evaluation, and a buyer who can explore a working environment unaided arrives at a first conversation already qualified and already interested. That removes around 9 days from a cycle and lets sales teams spend time on prospects who demonstrated intent rather than on those who filled in a form. Interactive demo environments grow at 23.1% on that arithmetic. The purchase sits with marketing and sales leadership rather than with product management. A form submission proves nothing; an hour spent exploring a product proves rather more. Sales teams noticed first.
Market Impact: Replicates for USD 34,000 internally

Enterprise Software Rollouts Nobody Wanted Need Help

Large organisations deploying enterprise resource planning, human resources and finance systems face user populations who did not choose the software and will not read documentation about it, which is exactly what digital adoption platforms exist to address. Guidance layered over the application reduces support tickets and shortens the period during which productivity falls. Enterprise adoption platforms grow at 13.4% on rollout programmes rather than on any product decision. The buyer is a transformation office rather than a product team. Rollout programmes arrive in cycles rather than continuously, which makes this demand distinctly lumpy.
Market Impact: Completes at 24% of users

Market Restraints and Challenges

Any Competent Front-End Team Can Build This

Serviceable tooltips, checklists and modal guidance take a front-end team a sprint or two, costing roughly USD 34,000 of internal effort against subscriptions near USD 28,000 annually, which makes the arithmetic uncomfortably close for a software purchase. The root cause is that the visible part of the product is genuinely simple. Commercially this caps pricing and forces vendors to compete on targeting, analytics and no-code editing instead. Mitigation runs through capability engineering teams would not bother replicating. The visible part is simple and the invisible part is what anybody is actually paying for. Few vendors say so.
Market Impact: Removes 9 days from cycles

Users Dismiss Guidance Faster Than Anybody Reports

Linear walkthroughs are completed by about 24% of users and dismissed within seconds by most of the rest, while vendors report impressions and reach because those figures look considerably better. The root cause is that an unrequested overlay interrupts somebody who came to do something else. Commercially this makes renewal conversations difficult once a customer measures outcomes rather than delivery. Vendors mitigate by moving customers toward contextual triggering, which works and reduces the volume they can report. Impressions and reach get reported precisely because completion and outcome figures are not flattering. Customers eventually check.
Market Impact: Engages 61% against 24%
4 additional market trends, 3 additional growth drivers, and 2 additional restraints and challenges are covered in the full report. Contact sales@marketmindsadvisory.com to access the complete intelligence.

Segment CAGR and Growth Architecture

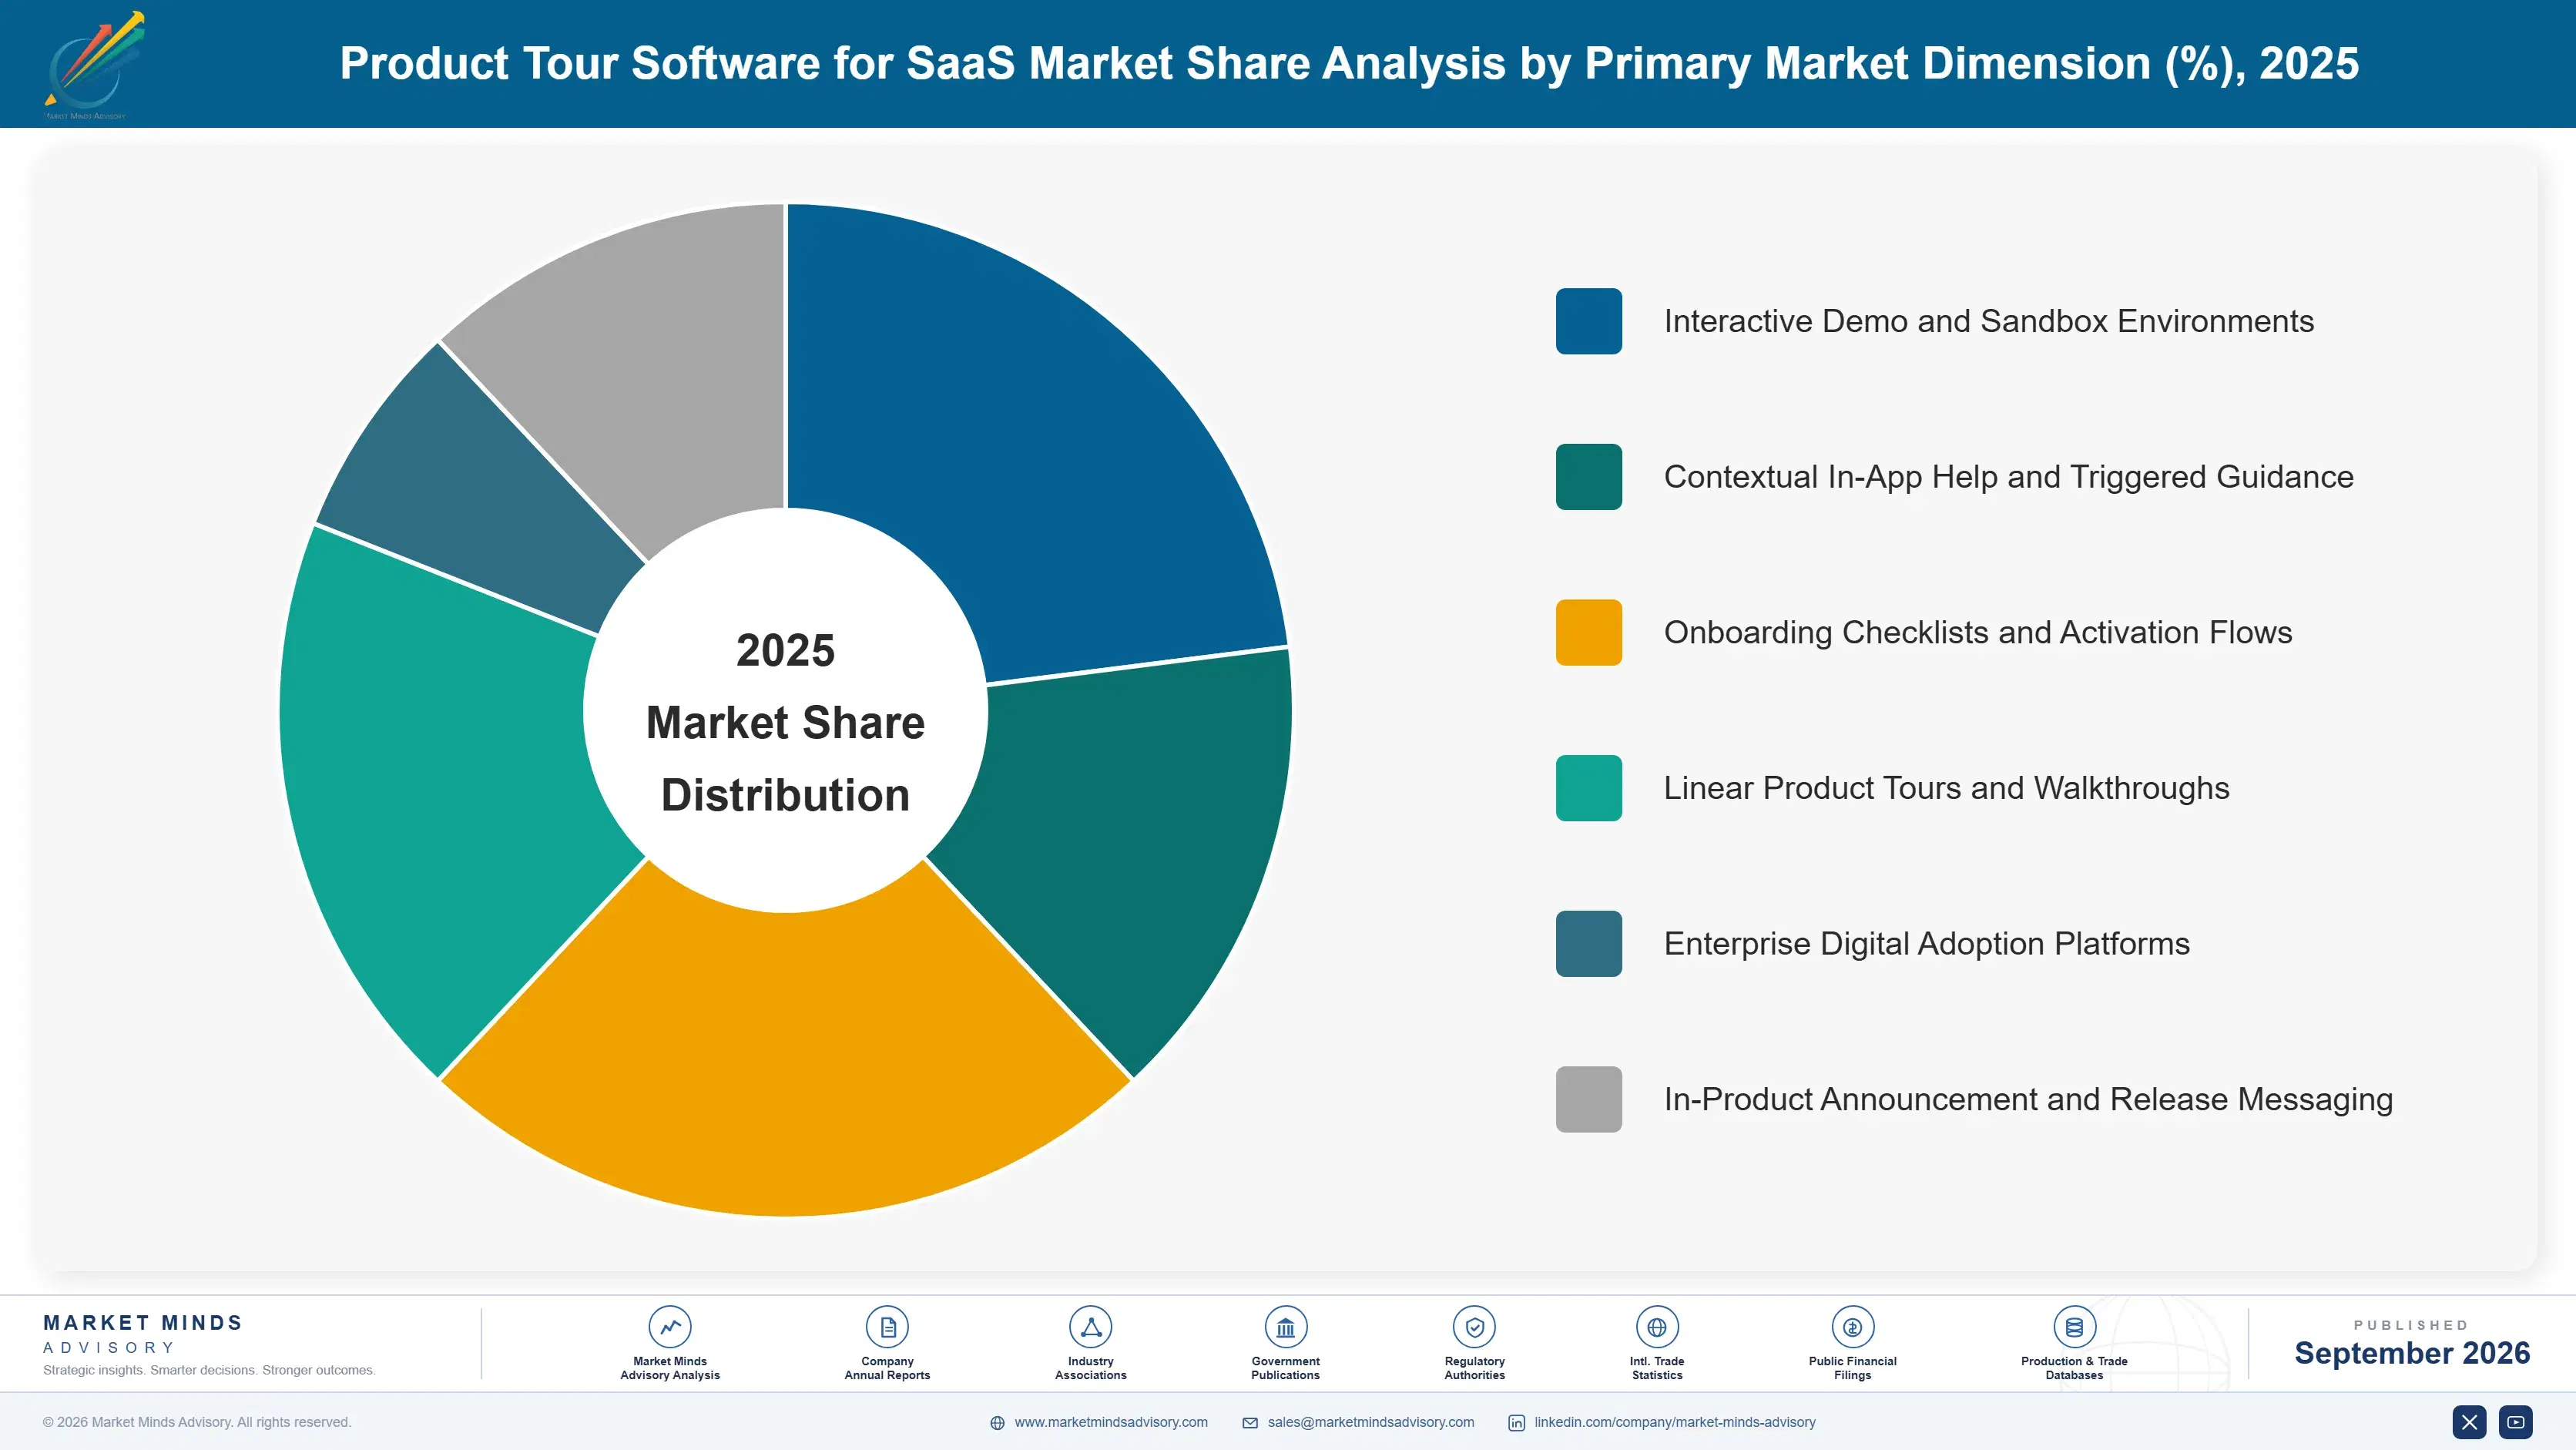
Segmentation follows who is being guided and who pays for it, because those two facts determine everything about the purchase. Guiding an existing user answers to product management against activation. Guiding a prospect who has no account answers to sales against pipeline, and the second budget is considerably larger than the first one is. That is the whole split.
product-tour-software-for-saas-market-market-share-analysis-1788453122939

Interactive Demo and Sandbox Environments

Interactive demo environments grow at 23.1%, half again the market rate of 15.4%, because they address a sales problem rather than a product experience one and are bought accordingly. A prospect exploring a working environment before any conversation arrives qualified and interested, removing around 9 days from a cycle and letting representatives spend time where intent already exists. The buyers are marketing and sales leadership with larger budgets and faster decisions than product management commands. Vendors built around product team selling reach them through entirely the wrong conversation, which several have discovered slowly and expensively. Sandbox environments also avoid the compatibility maintenance that burdens in-app guidance permanently, since a captured environment does not break.
CAGR 23.1%

Contextual In-App Help and Triggered Guidance

Contextual guidance grows at 18.6% because users act on roughly 61% of single-step prompts triggered by what they were already attempting, against 24% completing walkthroughs that interrupt them. Product teams measuring both outcomes have rebuilt around triggered assistance and quietly retired their tours. The technical difference is targeting precision rather than interface design, which is exactly the capability that resists internal replication since engineering teams will not build behavioural triggering for a side project. That resistance is what protects vendor pricing in a category otherwise exposed to build decisions. Product teams that have measured both outcomes rebuild around triggering quickly, and those that have not continue running tours that nobody ever finishes.
CAGR 18.6%
Full segment breakdown across 6 segments available in the complete report.

Regional Architecture and Country Demand Map

Value follows where software companies are headquartered rather than where their users sit, since the buyer is the software vendor rather than the end user. Enterprise adoption platforms distribute differently, following large organisation technology spending instead. Where the software is used explains almost nothing about the spending.

North America

North America holds 46%, well above the regional band, because the software companies buying this tooling are overwhelmingly headquartered here and the buyer is the vendor rather than the end user. Product-led growth practice originated in American software companies and remains most developed here, which makes activation a reported metric rather than an internal curiosity. Interactive demo adoption is furthest advanced, since self-directed software evaluation is most established among American business buyers. Build-versus-buy pressure is also sharpest here, given how readily American software teams replicate simple capability internally. Interactive demo growth is furthest advanced here, and the sales motion required to sell it is one product-led vendors headquartered in the same market have largely failed to build.
Share: 46% | CAGR: 16.4% (2026 to 2036)

Western Europe

European demand comes from a genuine software industry alongside enterprise adoption platform deployments in large organisations undertaking system rollouts. Data handling requirements shape platform selection more than in North America, particularly where guidance tooling observes user behaviour inside regulated applications. Product-led growth practice is less established, which slows activation-driven purchasing. Growth at 13.8% is the slowest anywhere, reflecting a smaller software vendor base and enterprise buying processes that move considerably more slowly than product team purchasing does. Interactive demo adoption trails American practice, since self-directed evaluation is less established among European business buyers who still expect a conversation. Build-versus-buy pressure is correspondingly weaker where engineering capacity is scarcer. Product-led growth practice remains less established than American norms.
Share: 22% | CAGR: 13.8% (2026 to 2036)
Regional intelligence for 5 additional markets available in the complete report: South Asia and Pacific, East Asia, Latin America, Middle East and Africa, Eastern Europe. Contact sales@marketmindsadvisory.com.
product-tour-software-for-saas-market-country-cagr-analysis-1788453123490

Selling What Nobody Builds Internally

The overlay is not the product and never was. Any front-end team can build one. What survives a build-versus-buy conversation is behavioural targeting, outcome analytics and the ability for a product manager to change something today without an engineering ticket, and everything worth doing protects exactly that position rather than the interface. The rest is replaceable.

Sell Into Sales Budgets, Not Product Budgets

Interactive demo environments grow at 23.1% and remove around 9 days from a sales cycle, which is a revenue argument made to marketing and sales leadership holding budgets several times larger than product management controls. Vendors positioning to sales close at roughly 3 times the contract value of equivalent product team deals. It requires a different sales motion, different proof points and different references. Most vendors extend their product team approach upward and wonder why deal sizes stay flat. References from product teams do not persuade a chief revenue officer of anything at all.
Market Impact: Closes at roughly 3 times the contract value

Compete on Targeting Rather Than on Overlays

A front-end team replicates visible guidance for roughly USD 34,000 against subscriptions near USD 28,000, so the interface itself cannot support the price. Behavioural targeting, cohort analysis and outcome measurement are what engineering teams will not build for what they regard as a side project. Vendors leading with targeting depth win build-versus-buy comparisons at around 2.5 times the rate of those demonstrating overlay design. The demonstration is less impressive and the argument is considerably stronger. Engineering teams will build overlays willingly and behavioural triggering almost never, which is the entire defence. Lead with the second.
Market Impact: Wins at around 2.5 times the usual rate

Move Customers Off Linear Tours Deliberately

Walkthroughs complete at about 24% while contextual prompts are acted on at 61%, and a customer measuring outcomes will eventually find that gap themselves. Vendors migrating customers to triggered guidance before that happens retain accounts through the discovery, at the cost of reporting far smaller delivery volumes. Retention differs by roughly 22 percentage points on this alone. It means telling a customer that the format they bought is the one that works least well, which vendors find difficult and profitable. Customers discover that gap themselves within a quarter of asking for any outcome data.
Market Impact: Shifts account retention by 22 percentage points overall

Hold the No-Code Editing Position Absolutely

The purchase survives only while a product manager can change guidance without filing an engineering ticket, because the moment engineering is involved the internal build becomes comparable at roughly USD 34,000. Any feature requiring developer implementation weakens the commercial case for the whole platform. Vendors maintaining genuine no-code coverage across their capability retain roughly 35% better than those where advanced features need engineering. It constrains the roadmap deliberately, which product organisations dislike and commercial reality requires. Every advanced feature gated behind a developer is an argument for building the whole thing internally. Roadmaps ignore this.
Market Impact: Retains roughly 35% better than gated competitors do

Who Controls the Margin Pool

Concentration sits near 34% across the top five on measured subscription and service revenue, and the category contains three groups that increasingly do not compete with one another. Digital adoption platforms sell to transformation offices for enterprise rollouts. Product-led guidance vendors sell to product teams against activation. Interactive demo specialists sell to marketing and sales against pipeline, and that third group is growing fastest while sharing almost no buyers with the others.
Competition runs on three dimensions. Behavioural targeting depth is first, since it is what survives a build-versus-buy comparison that visible overlays cannot. Second is no-code coverage, because any capability requiring engineering weakens the case for buying at all. Third is buyer alignment, where vendors selling to product managers and vendors selling to sales leaders are running fundamentally different businesses under one category name.

Two pressures will move positions. Product analytics platforms continue absorbing basic guidance capability into suites customers already hold, which compresses the standalone guidance market from above. Meanwhile interactive demo growth at 23.1% rewards vendors with sales-motion capability, and product-led vendors attempting to reach those buyers with a product-led approach have mostly discovered it does not transfer.
product-tour-software-for-saas-market-company-positioning-matrix-1788453124048

Competitive Moat and Risk Dimensions

PENDO

Moat: Analytics and guidance combination

Pendo combines product analytics with in-app guidance, which means the targeting and outcome measurement that survive a build-versus-buy comparison come from the same platform delivering the overlays. Product teams get behavioural data they would otherwise buy separately. That combination is genuinely difficult for a front-end team to replicate internally, which is the only defence that matters in this category.
PENDO

Risk: Sales motion absence

Interactive demo environments grow at 23.1% and sell to marketing and sales leadership through a motion that product-led vendors have consistently failed to build successfully. The buyers, proof points and references are all different. Analytics suites from larger vendors are also absorbing basic guidance capability, which compresses the product team segment from above while the fastest growth sits elsewhere.
WALKME

Moat: Enterprise rollout depth

WalkMe holds strong positions in digital adoption for large enterprise system rollouts, where user populations did not choose the software and transformation offices hold substantial budgets for making deployments work. That buyer is insulated from the build-versus-buy pressure affecting software vendors entirely. Integration across complex enterprise application estates is genuinely difficult and takes years to establish properly.
WALKME

Risk: Product-led segment distance

Enterprise adoption grows at 13.4% while interactive demos grow at 23.1% and contextual guidance at 18.6%, both selling to buyers who evaluate quickly and expect self-service. Enterprise deployment capability does not transfer to those motions at all. Transformation office demand also follows rollout programmes, which arrive in cycles rather than continuously and can pause without warning.

Players Tracked

Prominent Players

Pendo
WalkMe
Appcues
Whatfix
Userpilot

Other Key Players

Chameleon
Userflow
Navattic
Reprise
Storylane
Walnut
Intercom
Amplitude
Gainsight
UserGuiding
Usetiful
Shepherd
Product Fruits
Inline Manual
Toonimo

Recent Developments

FEBRUARY 2025

Software vendors adopt interactive demos as standard evaluation entry

Business software companies began offering self-serve interactive environments before any sales conversation, letting buyers explore functionality unaided and arrive at first calls already qualified. Sales teams reported shorter cycles and better use of representative time on prospects who had demonstrated genuine intent. Form submissions had proven a poor qualification signal.
Signal: Interactive demonstration is becoming a standard evaluation step in software buying much as free trials did.
JUNE 2025

Product teams retire linear walkthroughs after measuring completion

Software organisations comparing multi-step walkthrough completion against contextual prompt engagement removed tours from onboarding flows entirely, replacing them with triggered assistance. Delivery volumes reported by vendors fell substantially while measured outcomes improved across the same customers. Vendor reporting of impressions had concealed that difference for several years.
Signal: The format the category is named after is being retired by the customers who bought it.
NOVEMBER 2025

Analytics platforms bundle basic guidance into existing subscriptions

Product analytics vendors added tooltip and checklist capability into suites customers already held, competing with standalone guidance platforms at effectively no incremental cost. The bundled capability lacked targeting depth but met the requirement for straightforward onboarding prompts. Customers already holding those suites adopted the bundled capability immediately.
Signal: Bundling compresses the standalone guidance market from above while internal build pressure compresses it from below.

What Delivering Guidance Costs

Cost structure is dominated by engineering rather than delivery. Platform development, browser and application compatibility maintenance, and behavioural targeting infrastructure together account for roughly 44% of revenue, and compatibility work is heavy because overlays sit on applications the vendor neither controls nor can test exhaustively. Hosting and data storage are modest. Customer success is the second block and scales with account count.
Engineering labour has been the sharpest pressure. People who can build reliable overlay injection across arbitrary applications are scarce, and compatibility maintenance never ends because every customer application changes independently. SAP and Amplitude both referenced platform engineering and personnel cost conditions in recent annual reporting. Vendors absorbed most of it, since subscription pricing near USD 28,000 is compared against an internal build costing roughly USD 34,000 and cannot rise far.

Exposure varies by product breadth rather than by scale. Vendors covering many application types carry compatibility maintenance across all of them, which grows with the customer base rather than with revenue. Interactive demo vendors avoid that entirely, since a recorded or cloned environment does not need to work inside a live application. That difference is part of why demo tooling scales more comfortably than in-app guidance has.
product-tour-software-for-saas-market-cost-volatility-analysis-1788453124261

Automate compatibility testing across customer applications

Overlay injection breaks whenever a customer application changes, and every customer changes independently, so maintenance grows with the account base rather than revenue. Automated detection and regression testing cuts that effort by roughly 50% and catches breakage before customers report it. The investment is engineering that produces no visible feature, which is why it competes badly for roadmap priority.

Keep advanced capability inside the no-code boundary

Any feature requiring developer implementation invites the internal build comparison at roughly USD 34,000, since engineering involvement removes the main reason to buy at all. Holding advanced targeting and analytics inside no-code configuration constrains the roadmap deliberately and protects the commercial position. Product organisations resist the constraint, and vendors who accepted it retain considerably better through build-versus-buy reviews.

Build demo tooling on cloned rather than live environments

Guidance overlays inside live applications carry compatibility maintenance that never ends, while demo environments are captured once and do not break when the underlying product changes. That difference in cost structure is why demo tooling scales more comfortably at the same revenue. Vendors extending into demonstration should build separately rather than reusing overlay infrastructure carrying that burden.

Portfolio Architecture for Margin Defence

Margin architecture separates on whether the buyer has an internal alternative. Basic in-app guidance competes against a front-end team building the same thing for roughly USD 34,000, which caps pricing regardless of quality. Interactive demo tooling faces no internal alternative because building a sandbox environment is genuinely hard, and it sells to sales budgets rather than product ones. Enterprise adoption platforms face neither pressure, since transformation offices do not build.
The tension runs between the product-led and sales-led motions. Product team accounts are numerous, small and exposed to bundling and build decisions. Sales and marketing accounts are fewer, considerably larger and growing fastest. The motions require different selling, different references and different pricing, and vendors attempting both with one organisation generally under-serve the second while protecting the first, which is the wrong way round entirely.

High-value revenue concentrates in interactive demo tooling and in enterprise adoption deployments. Demo tooling is defended by the difficulty of building sandbox environments and by sitting in sales budgets. Enterprise adoption is defended by integration depth across complex application estates. Basic guidance is the volume base, contested from above by analytics bundling and from below by internal builds costing about the same.

Volume / Commodity-Adjacent

Basic in-app guidance, tooltips and checklists competing against internal builds and bundled analytics capability. The range reflects compatibility maintenance efficiency across customer applications. Pricing is capped by what a front-end team could produce in a sprint or two.
Gross Margin: 56-71%

Premium / Certified

Contextual targeting, behavioural triggering and outcome analytics that engineering teams will not build for a side project. Margin depends on targeting depth rather than interface quality. This is the capability that survives a build-versus-buy comparison at all.
Gross Margin: 66-79%

Sustainability / Regulatory / Next-Generation

Interactive demo environments sold into sales budgets, and enterprise adoption platforms sold to transformation offices. The widest range in the portfolio, reflecting deal size and integration content. Highest margin and furthest from any internal build comparison.
Gross Margin: 72-88%
product-tour-software-for-saas-market-portfolio-architecture-1788453124776

High-value Sub-segments and Strategic Watch-out

Interactive Demo Environments

High value with the fastest growth at 23.1%, sold into sales budgets several times larger than product ones and facing no realistic internal alternative. The range reflects deal size and account maturity. Cloned environments also avoid the compatibility maintenance burdening in-app guidance permanently and expensively.
Gross Margin: 74-88%

Enterprise Adoption Deployments

High value with steady growth at 13.4%, bought by transformation offices for rollouts of software users did not choose and will not learn unaided. The range reflects application estate complexity. Buyers here never consider building internally, which removes the pressure defining the rest of this market.
Gross Margin: 70-85%

Contextual Guidance Subscriptions

The defensible core, protected by behavioural targeting engineering teams will not replicate for a side project. The range reflects targeting depth and analytics quality. It grows at 18.6% while the tours it replaces grow at 6.8%, which is a substitution invisible in category totals and decisive in roadmaps.
Gross Margin: 65-78%

Linear Walkthrough Delivery

The strategic watch-out, completed by about 24% of users and increasingly retired by customers who measured it against contextual alternatives. The category is named after it, which makes the retreat awkward to narrate. Several vendors still lead their demonstrations with the format performing worst of all.
Gross Margin: 0-28%

What Keeps Subscriptions Alive

Recurrence works through embedded configuration rather than through contract terms. A product team with hundreds of targeted guidance flows built over two years cannot rebuild them quickly elsewhere, and the behavioural data behind the targeting does not transfer at all. Interactive demo libraries carry similar weight once a sales organisation has built environments for several products. Basic tooltip deployments carry almost none and can be replaced over a weekend by an internal build.
Adoption depth varies with how much configuration accumulated and how much is measured. Organisations running targeted flows against measured activation outcomes have dependencies in reporting somebody senior relies upon. Those running a welcome tour nobody examines can cancel without anybody noticing, and periodically do. The dividing line is measurement rather than deployment size, which is why account value correlates poorly with retention in this category.

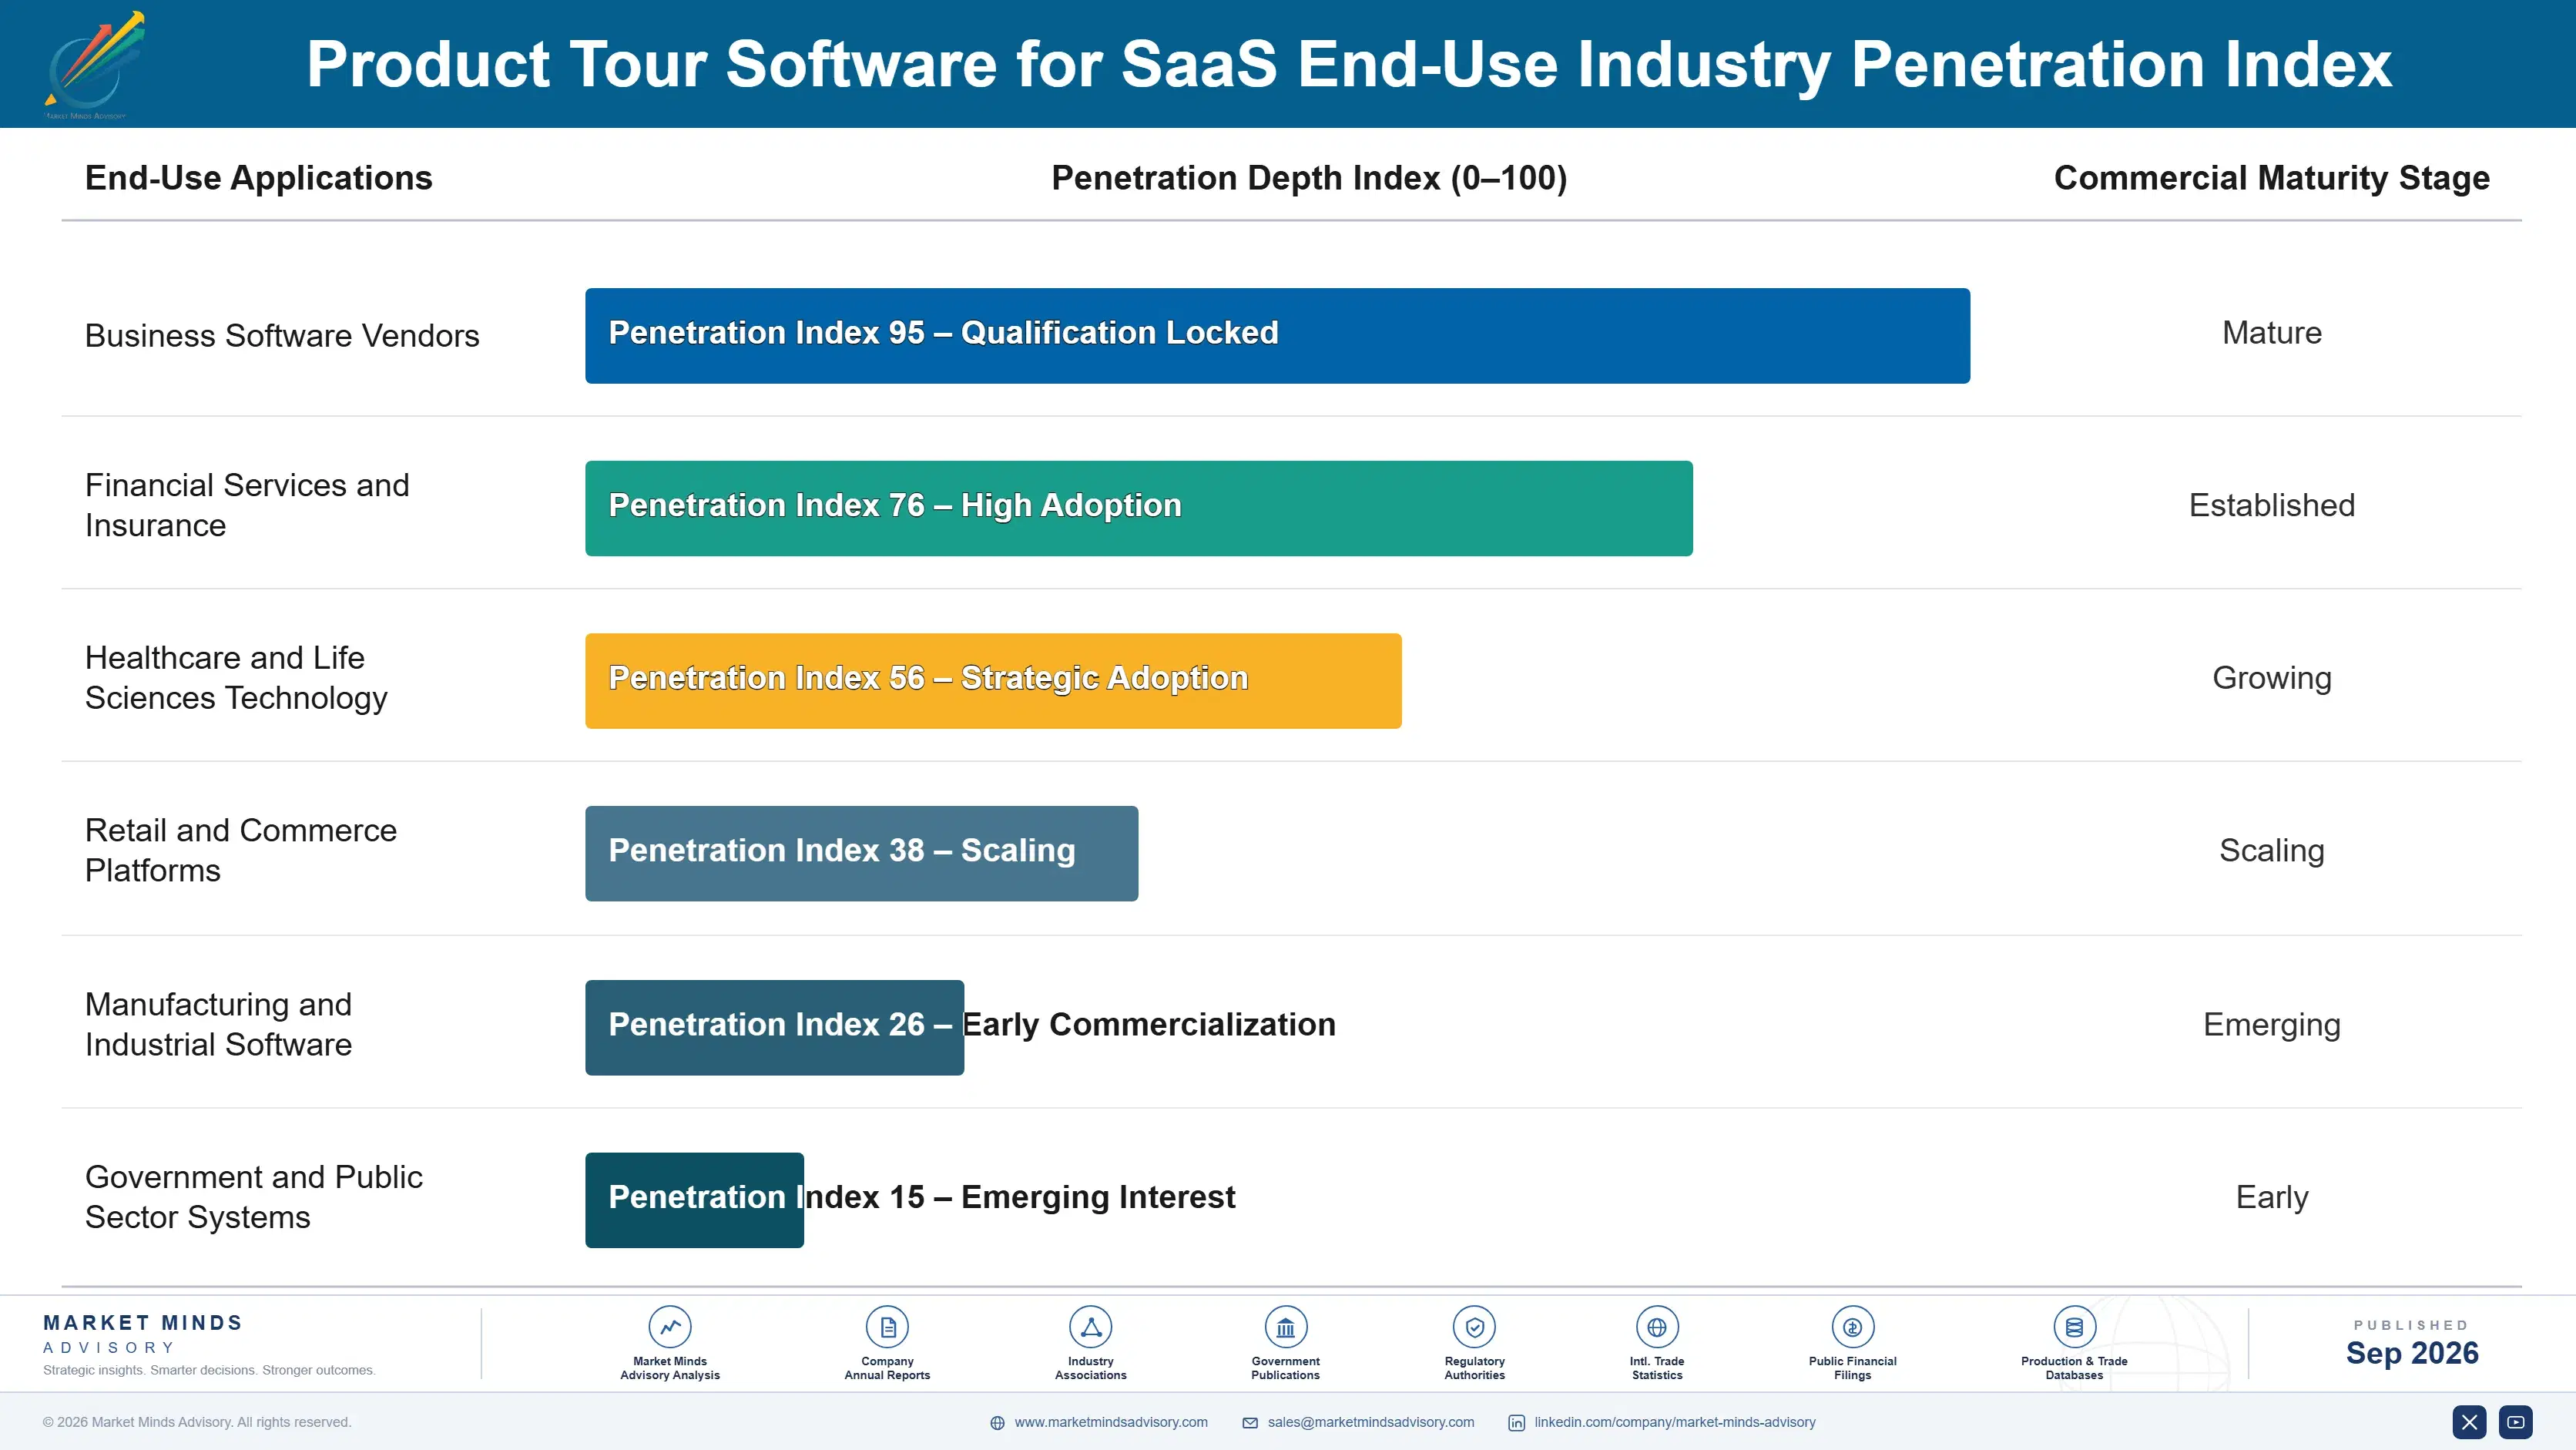
The buyer has been splitting rather than shifting. Product managers buy in-app guidance against activation metrics. Transformation offices buy adoption platforms against rollout success. Marketing and sales leaders buy interactive demos against pipeline and cycle time, and that third buyer holds the largest budget and is growing fastest. Vendors organised around one of the three address a shrinking share of the category.
product-tour-software-for-saas-market-end-use-penetration-index-1788453125291

Where the Category Actually Earns

These are among the four positions where our research anticipates prominent divergence between winners and laggards over the coming forecast period. Each is grounded in the demand model, the regulatory perimeter, and the announced capacity pipeline.
01 / SALES BUDGET POSITIONING

Sell demos to sales, not tours to product teams

Interactive demo environments grow at 23.1% and remove around 9 days from a sales cycle, which is a revenue argument presented to marketing and sales leaders holding budgets several times larger than any product manager controls. Vendors positioning into that motion close at roughly 3 times the contract value of equivalent product team deals, though it demands different proof points, different references and a genuinely different sales approach. Most vendors extend the product-led motion upward and then wonder why deal sizes stay stubbornly flat.
02 / TARGETING DEPTH DEFENCE

Compete on the part engineering will not build

A competent front-end team replicates visible guidance for roughly USD 34,000 against subscriptions near USD 28,000 annually, which means the interface itself simply cannot support the price being asked for it. Behavioural targeting, cohort analysis and outcome measurement are the capabilities engineering teams decline to build for what they regard as a side project. Vendors leading with that depth win build-versus-buy comparisons at around 2.5 times the rate of overlay demonstrations, and the argument is far stronger for being less impressive.
03 / FORMAT MIGRATION HONESTY

Move customers off tours before they measure them

Multi-step walkthroughs complete at about 24% while contextual prompts triggered by user behaviour are acted on at roughly 61%, and any customer measuring outcomes rather than impressions will eventually find that gap without any help. Vendors migrating customers to triggered guidance before that discovery retain accounts through it, and retention differs by roughly 22 percentage points on this alone. It means telling a customer the format they purchased is the one that works least well, which is uncomfortable and profitable.
04 / NO-CODE BOUNDARY DISCIPLINE

Never ship a feature that needs an engineer

The commercial case survives only for as long as a product manager can change guidance without filing an engineering ticket, because the moment engineering is involved an internal build at roughly USD 34,000 becomes directly comparable to the subscription price. Any capability requiring developer implementation weakens the argument for the entire platform rather than only for that particular feature. Vendors maintaining genuine no-code coverage across their whole capability retain roughly 35% better, which constrains the roadmap in ways product organisations reliably dislike intensely.

Engagement Snapshot From the Field

A live engagement with an industry participant carrying material or product regulatory and market exposure ahead of a defining policy shift, showing how our research translates into a defensible multi-year portfolio strategy.
MARKET MINDS ADVISORY · CLIENT ENGAGEMENT SUMMARY
Product Tour Software for SaaS Producer Strategic Portfolio Review and Transition Roadmap 2026·Investment Scenario on Product Tour Software for SaaS Exposure Evaluation 2025-26
CLIENT PROFILE
A business software vendor with approximately 41,000 customer accounts running onboarding tours, checklists and in-app messaging through a purchased platform (client-reported, unverified by MMA). Annual subscription cost approached USD 190,000, and the guidance had been configured once at implementation three years earlier and barely revised since. Nobody had ever reviewed what any of it actually achieved.
STRATEGIC CHALLENGE
Engineering had proposed building equivalent capability internally at an estimated USD 120,000 of effort (client-reported, unverified by MMA), arguing the platform delivered little the team could not replicate. Product management disagreed and could not demonstrate why. Nobody had measured what the deployed guidance actually achieved for users or for activation.
MMA APPROACH
MMA measured completion, dismissal and downstream activation by guidance type rather than comparing platform features, which both sides had already argued about extensively. We analysed eighteen months of interaction data, interviewed 16 product, engineering and customer success staff, and tested what the proposed internal build would and would not cover.
KEY FINDINGS
  1. Linear onboarding tours were completed by about 21% of new users, while contextual prompts triggered on behaviour were acted on by around 58%.
  2. Roughly 78% of configured guidance was linear tours built at implementation, and almost none of it used the behavioural targeting the platform already provided.
  3. The proposed internal build covered overlay display but not behavioural targeting, cohort analysis or outcome measurement at any point in the proposal.
  4. Product managers had made four guidance changes in three years, because nobody had learned the editor after the original implementation consultant left.
CLIENT PROFILE
A business software vendor with approximately 41,000 customer accounts running onboarding tours, checklists and in-app messaging through a purchased platform (client-reported, unverified by MMA). Annual subscription cost approached USD 190,000, and the guidance had been configured once at implementation three years earlier and barely revised since. Nobody had ever reviewed what any of it actually achieved.
STRATEGIC CHALLENGE
Engineering had proposed building equivalent capability internally at an estimated USD 120,000 of effort (client-reported, unverified by MMA), arguing the platform delivered little the team could not replicate. Product management disagreed and could not demonstrate why. Nobody had measured what the deployed guidance actually achieved for users or for activation.
MMA APPROACH
MMA measured completion, dismissal and downstream activation by guidance type rather than comparing platform features, which both sides had already argued about extensively. We analysed eighteen months of interaction data, interviewed 16 product, engineering and customer success staff, and tested what the proposed internal build would and would not cover.
KEY FINDINGS
  1. Linear onboarding tours were completed by about 21% of new users, while contextual prompts triggered on behaviour were acted on by around 58%.
  2. Roughly 78% of configured guidance was linear tours built at implementation, and almost none of it used the behavioural targeting the platform already provided.
  3. The proposed internal build covered overlay display but not behavioural targeting, cohort analysis or outcome measurement at any point in the proposal.
  4. Product managers had made four guidance changes in three years, because nobody had learned the editor after the original implementation consultant left.
RECOMMENDED STRATEGY
Phase 1: Rebuild guidance around behavioural triggering rather than linear tours, since the measured engagement difference is roughly threefold on identical content. Phase 2: Retain the platform but train product managers on the editor properly, since unused targeting capability was the actual reason value looked thin. Phase 3: Reject the internal build, which replicates the least valuable capability and none of the targeting that justifies the subscription at all.
OUTCOME
Activation among new accounts improved by roughly 19% within two quarters after guidance was rebuilt around behavioural triggers (client-reported, unverified by MMA). The internal build was cancelled, and guidance changes rose from four in three years to fourteen in the following six months once product managers could use the editor.

Frequently Asked Questions

Foundational context covering the market sizes, CAGR, scope, country, region and competition that inform every finding below. This section is provided to cover basics and most often pre-purchase conversations, answered from the MMA Primary Research Dataset.

What is the current size of the Product Tour Software for SaaS Market?

The market was worth USD 1.1 billion in 2025 and reaches USD 1.27 billion in 2026. Mid-market platform subscriptions typically cost around USD 28,000 annually.

How large will the Product Tour Software for SaaS Market be by 2036?

MMA forecasts USD 5.32 billion by 2036, an expansion of 4.19 times over the forecast period. That represents USD 4.05 billion of incremental annual revenue against 2026.

What is the CAGR for the Product Tour Software for SaaS Market 2026 to 2036?

The base case is 15.4% compound annual growth, with a bull case at 16.6% and a bear case at 14.2%. Build-versus-buy pressure separates the scenarios most clearly.

Which segment is growing fastest?

Interactive demo and sandbox environments grow at 23.1%, half again the market rate of 15.4%. They remove around 9 days from a sales cycle and sell into sales budgets.

Who are the major companies in the Product Tour Software for SaaS Market?

Pendo, WalkMe, Appcues, Whatfix and Userpilot lead on measured subscription and service revenue. Together they hold roughly 34% across three groups that barely compete with each other.

Which country is growing fastest?

India grows fastest at 19.2%, on a large software industry selling into North American markets and adopting the product-led practices those buyers now expect to see.

Report Segmentation Architecture

The full report scope spans multiple orthogonal segmentation dimensions, with cross-tabulated demand data provided for each dimension pair. Coverage extends further to regional breakdowns, trend trajectories, and the competitive detail needed to support segment-level decision-making.

By Primary Market Dimension

  • Interactive Demo and Sandbox Environments
  • Contextual In-App Help and Triggered Guidance
  • Onboarding Checklists and Activation Flows
  • Linear Product Tours and Walkthroughs
  • Enterprise Digital Adoption Platforms
  • In-Product Announcement and Release Messaging

By End-Use Industry

  • Business Software Vendors
  • Financial Services and Insurance
  • Healthcare and Life Sciences Technology
  • Retail and Commerce Platforms
  • Manufacturing and Industrial Software
  • Government and Public Sector Systems

By Commercial Dimension

  • Product Team Subscriptions
  • Sales and Marketing Purchases
  • Transformation Office Programmes
  • Self-Service Tier Adoption
  • Agency and Partner Implementations
  • Analytics Suite Bundling

By Region

  • North America
  • Western Europe
  • South Asia and Pacific
  • East Asia
  • Latin America
  • Middle East and Africa
  • Eastern Europe

Scope, Methodology, and Coverage

Every figure in this report is reproducible from documented input assumptions. The scope below maps the historical period, the forecast horizon, the segmentation dimensions, and the countries covered, alongside the underlying primary and qualitative methodology.
Historical Period
2020 to 2025
Forecast Period
2026 to 2036
Base Year
2025 (USD billions; MMA Primary Research Dataset, September 2026)
Market Definition
This market covers software used to guide, demonstrate and drive adoption inside and around software products, spanning interactive demo and sandbox environments, contextual in-app help and triggered guidance, onboarding checklists and activation flows, linear product tours and walkthroughs, enterprise digital adoption platforms, and in-product announcement and release messaging. Revenue is measured as subscription, usage and attributable implementation and service value at supplier level. Product analytics platforms sold separately, customer support and ticketing software, learning management and training systems, marketing automation platforms, sales engagement tooling without product demonstration capability, and internal engineering effort to build equivalent capability are excluded from scope.
Quantitative Units
USD billions, subscription, usage and attributable service revenue at supplier level
Segmentation Dimensions
Guidance function, end-use industry, commercial model, region
Regions Covered
North America, Western Europe, South Asia and Pacific, East Asia, Latin America, Middle East and Africa, Eastern Europe
Countries Covered
United States, Canada, Mexico, Brazil, Argentina, Colombia, Chile, United Kingdom, Germany, France, Netherlands, Ireland, Sweden, Denmark, Spain, Italy, Poland, Czechia, Romania, Ukraine, India, Australia, Singapore, New Zealand, Japan, South Korea, China, Israel, United Arab Emirates, Saudi Arabia, South Africa, Nigeria
Key Companies Profiled
Pendo, WalkMe, Appcues, Whatfix, Userpilot, Chameleon, Userflow, Navattic, Reprise, Storylane, Walnut, Intercom, Amplitude, Gainsight, UserGuiding, Usetiful, Shepherd, Product Fruits, Inline Manual, Toonimo
Quantitative Methodology
Primary survey, n=3,800 respondents, Q4 2025, six countries; demand-side model with trade association cross-validation
Qualitative Methodology
47 expert interviews, Q4 2025; applied to validate demand model assumptions, identify emerging dynamics, and assess competitive positioning
Report Format
PDF and XLSX data workbook (Word format preview document)
Publisher
Market Minds Advisory
Report Code
MMA-2026-TEC-191
Published
September 2026
Contact
sales@marketmindsadvisory.com | www.marketmindsadvisory.com

Purchase the full Product Tour Software for SaaS Market Report (2026 to 2036).

The full MMA report shows why the format this category is named after performs worst, and how the market split into a product business and a sales business sharing one label. It sizes the market to 2036 across six guidance functions, seven regions and 32 countries, with segment growth rates and regional demand mechanisms detailed. Competitive analysis covers 20 vendors assessed on measured subscription and service revenue, with moat and risk assessment for the two leaders. The report quantifies engineering cost structure, build-versus-buy economics and margin architecture across three portfolio tiers. It closes with four verdicts and an anonymised software vendor engagement.
Six guidance functions sized through 2036
Seven regions with demand mechanism analysis
Twenty vendors on consistent revenue basis
Completion, engagement and build cost benchmarks
Margin architecture across three portfolio tiers
Anonymised software vendor adoption tooling engagement

Built For The People Who Decide

From boardroom strategy to bench-side execution, this report is read cover-to-cover by leaders shaping the next decade of their industry, turning demand scenarios, market dynamics and valuation benchmarks into decisions.
CXOs/ Presidents/ VPs/ Managers
M&A and Corporate Development
Strategy Teams and R&D Heads
Procurement and Product Directors
Regulatory and Compliance Leaders
Investor Relations and Equity Analysts