Market Minds Advisory
Processed Superfruit Market

Processed Superfruit Market: Functional Nutrition Demand Redefines Ingredient Formats

Functional beverage and supplement formulators are pulling shelf-stable superfruit powder demand ahead of conventional juice volume, rewarding processors with standardized bioactive documentation over undifferentiated fruit sourcing across this expanding ingredient category.

Lead Analyst

Lisa Gevelber

Published

September 2026

Make Smarter Decisions with Customized Research Insights

Request a free sample report and evaluate market opportunities, growth trends, and competitive dynamics relevant to your business needs.

2025 MARKET VALUE$4.1BMarket Size 2025
2036 FORECAST VALUE$9.4BBase Case , 2026 to 2036
CAGR 2026 TO 20367.9 %Bull 9.2% / Bear 6.6%
INCREMENTAL OPPORTUNITY$5.0BNet 10- year value creation
EXPANSION MULTIPLE2.14x2036 value over 2026 base
Strategic Levers
M&A Pipeline
Regional Outlook
Country Rankings
Competitive Intelligence
Segmental Deep-dive
Call-Us : 91 93563 13602

Executive Snapshot and Market Trajectory

Processed superfruit demand is accelerating fastest in shelf-stable powder formats, as functional beverage and supplement formulators pull freeze-dried goji, acai, and pomegranate powder toward easy-formulation applications faster than conventional juice volume is growing. Retailers and formulation teams nationwide are driving this shift faster than producers alone would choose.
Demand concentrates in three areas: juice and concentrate supplying mainstream beverage manufacturing, powder extract supplying functional and supplement formulation, and whole freeze-dried pieces supplying clean-label snacking demand. North America anchors global demand given its established supplement industry and deep functional beverage manufacturing base, well ahead of every other market by a wide margin. This scale advantage reflects genuine manufacturing depth, not a default regional assumption. North America's supplement industry scale has no equivalent elsewhere.
Competition remains fragmented among regional processors, led by Naturex and Artemis International, both of which maintain deep extraction and standardization expertise built over decades of botanical ingredient supply. Bioactive compound documentation and standardization consistency, not fruit sourcing alone, increasingly decide which processors win long-term manufacturer contracts against smaller regional competitors. This gap is widening as documentation and standardization barriers compound over successive cycles.
Market Definition
This market covers processed superfruit ingredients, including juice concentrate, puree, powder extract, dried pieces, and standardized bioactive extracts derived from fruits such as acai, goji, pomegranate, elderberry, and camu camu, sold to food, beverage, and supplement manufacturers. It excludes fresh superfruit sold for direct consumption, finished consumer products containing superfruit ingredients, and mainstream commodity fruits not marketed under functional superfruit positioning.
Base Year Value
$4.1B in 2025 (MMA Primary Research Dataset, August 2026)
Forecast Period
2026 to 2036, eleven discrete annual values
CAGR
7.9% base case. Bull 9.2%. Bear 6.6%.
Fastest Growth Segment
Superfruit Powders: 10.6% CAGR
Fastest Growth Country
China: 9.8% CAGR
Fastest Growth Region
South Asia and Pacific: 9.9% CAGR
Largest Region
North America: 28% of 2025 global value
Market Leaders
Naturex S.A., Artemis International Inc., Ocean Spray Cranberries Inc., Sunfood Corporation, POM Wonderful LLC. Source: MMA Analysis based on company disclosures.
Primary Survey
n=3,800 procurement and R&D decision-makers, Q4 2025, six countries
Methodology
Demand-side build-up, cross-validated against public data, 47 expert interviews

Processed Superfruit Market Forecast Scenarios

processed-superfruit-market-trends-size-forecast-scenario-1787313036157
Processed superfruit demand grew steadily through 2020 to 2025 as consumer interest in functional nutrition accelerated alongside broader immune health awareness following the pandemic period. The market grew at an estimated 7.0% historical CAGR across the period, with powder extract volume consistently outpacing conventional juice demand from 2022 onward as shelf-stable formulation needs intensified across supplement and beverage categories.
The base case assumes 7.9% CAGR through 2036, driven by three mechanisms operating together. First, supplement manufacturers are increasingly specifying standardized bioactive extracts with documented antioxidant content over undifferentiated fruit powder blends. Second, functional beverage brands are expanding superfruit flavor differentiation strategies that favor exotic profiles over more common fruit flavors. Third, Chinese and South American processors are expanding export-oriented processing capacity, improving global supply reliability for manufacturers previously constrained by fragmented regional sourcing.
The bull case (9.2% CAGR) assumes faster-than-expected functional nutrition category growth pulls powder extract demand forward ahead of current manufacturer planning assumptions. The bear case (6.6% CAGR) reflects the risk that adverse weather events across major growing regions disrupt harvest volume, tempering the supply growth that has supported above-average expansion across this still-developing ingredient category overall.

Bioactive Documentation Separates Premium From Commodity Extract

Processed superfruit economics increasingly separate along documented bioactive compound content rather than fruit sourcing alone, since supplement manufacturers pay premium pricing for standardized extracts with verified antioxidant profiles that undocumented commodity powders cannot credibly claim across increasingly sophisticated formulation requirements. This gap has widened noticeably since 2022 as major supplement brands tightened supplier qualification requirements. This gap has widened s
CR5 CONCENTRATION26%share held by the top five superfruit processors globally
AVERAGE SELLING PRICE$7-42/kgrange spanning commodity juice to premium standardized extract
TOP PRODUCING COUNTRY SHAREChina, 26%share of global processed superfruit production volume currently
CAPACITY UTILIZATION62%average operating rate across qualified extract processing facilities
TRADE INTENSITY48%of finished ingredient volume crossing borders before end use
FEEDSTOCK COST SHARE37% of COGSraw fruit and cold-chain logistics inputs combined together currently
Small regional food producers and large supplement manufacturers behave very differently as buyers. Small producers negotiate primarily on price and minimum order flexibility given limited formulation budgets, while large manufacturers require extensive bioactive documentation and batch-to-batch standardization consistency that few smaller processors can support without dedicated analytical investment spanning multiple product generations and testing cycles. Producers unable to meet these documentation demands increasingly lose consideration for large-scale supply programs.
Over the next decade, two forces will determine winners. Continued functional nutrition category expansion will keep growing addressable powder extract demand, while standardized bioactive extract adoption adds a second, documentation-driven growth vector rewarding processors with strong analytical support ahead of commodity-only competitors selling undifferentiated fruit powder without verified compound content. Processors straddling both categories risk diluting focus relative to committed sourcing specialists.
"Anyone can freeze-dry goji berries and call it a superfruit powder. The processor winning the national supplement contract is the one that can guarantee consistent polysaccharide content batch after batch, not just a marketing claim on a spec sheet."
Director, Functional Ingredient and Botanical Extract Practice · MMA Agriculture

Market Trends

Standardized Bioactive Extracts Displace Commodity Powder

Supplement manufacturers are increasingly specifying standardized bioactive extracts with documented antioxidant and polysaccharide content over undifferentiated commodity fruit powder blends, since verified compound content allows manufacturers to make defensible functional claims that undocumented alternatives cannot support. This demand has grown fastest among immune health and healthy aging supplement brands, where verified bioactive dosing directly affects product efficacy claims manufacturers can legally make to consumers. Several major processors have expanded dedicated analytical testing capacity specifically to serve this growing demand, recognizing that once a manufacturer qualifies a standardized extract supplier, switching costs remain meaningful given the reformulation validation work involved.
Market Impact: Adds 5 percent export capacity grow

Clean-Label Snacking Drives Whole Dried Piece Demand

Consumers seeking clean-label snacking alternatives are increasingly driving demand for whole freeze-dried superfruit pieces positioned as a minimally processed alternative to conventional dried fruit snacks laden with added sugar. This demand has grown steadily as snack manufacturers increasingly treat freeze-dried superfruit as a premium ingredient commanding shelf space distinct from standard dried fruit categories. Producers serving this segment typically maintain close formulation collaboration with snack brand innovation teams from early concept through commercial launch. This premium positioning often commands retail pricing well above standard commodity dried fruit product lines overall.
Market Impact: Adds 4 percent antioxidant demand g

Market Opportunities and Growth Drivers

Export Capacity Expansion Improves Supply Reliability

Chinese and South American processors are expanding export-oriented extraction and cold-chain logistics capacity, improving global supply reliability for manufacturers previously constrained by fragmented regional sourcing and inconsistent harvest-season availability. This capacity expansion has grown as processors increasingly target export markets directly rather than relying solely on domestic consumption and third-party trading intermediaries. Producers serving this demand typically maintain long-standing relationships with contracted grower networks built over years of consistent harvest coordination. Some processors are also investing in direct grower financing programs to accelerate cultivation capacity ahead of demand and secure preferred harvest access across multiple growing regions.
Market Impact: Adds 15 percent harvest cost volati

Immune Health Awareness Sustains Antioxidant Demand

Continued consumer awareness of immune health and antioxidant nutrition, accelerated during the pandemic period, sustains demand for superfruit ingredients marketed around documented antioxidant content rather than generic fruit nutrition claims. This demand has grown steadily as supplement and beverage manufacturers increasingly treat antioxidant positioning as a required formulation input rather than an optional premium claim. Producers serving this demand typically maintain close technical relationships with manufacturer formulation teams built over years of joint product development. This technical relationship often begins several years before a reformulated product reaches commercial retail launch.
Market Impact: Adds 18 month testing buildout dela

Market Restraints and Challenges

Global Superfruit Harvest Volatility Compresses Margins

Superfruit harvest yields have shown meaningful volatility tied to weather patterns and disease pressure affecting cultivation regions across Asia and Latin America, creating margin pressure for processors unable to pass through cost increases quickly given multi-year fixed-price manufacturer agreements common with large supplement customers. This volatility disproportionately affects smaller processors with limited grower network diversification, since raw fruit represents a substantial share of total production cost that cannot easily be offset through extraction efficiency improvements alone. Processors are addressing this through multi-region grower contracts and, where feasible, direct cultivation investment that reduces dependence on spot-market fruit purchases.
Market Impact: Adds 13% standardized extract volum

Standardization Testing Costs Limit Smaller Processor Access

Achieving consistent bioactive compound standardization across harvest batches requires substantial analytical testing infrastructure investment that many smaller regional processors lack the capital to establish without external laboratory partnership or dedicated financing. This restraint has kept the standardized extract segment of this market more concentrated than commodity juice and powder supply, where testing requirements remain considerably less demanding. Processors are addressing this through shared laboratory partnerships with contract testing organizations, though this approach typically limits the margin smaller processors can capture relative to fully integrated competitors. Smaller processors remain dependent on shared laboratory access rather than owned testing infrastructure.
Market Impact: Adds 8% snacking segment demand
3 additional market trends, 4 additional growth drivers, and 3 additional restraints and challenges are covered in the full report. Contact sales@marketmindsadvisory.com to access the complete intelligence.

Segment CAGR and Growth Architecture

MMA segments this market by extract format type, the classification processors and manufacturers use when specifying superfruit ingredients for a given formulation requirement. This lens separates juice, powder, and standardized extract formats by underlying processing method rather than fruit species alone across their production portfolio. since a single processor often produces multiple formats simultaneously
processed-superfruit-market-trends-market-share-analysis-1787313036693

Superfruit Powders

Superfruit powders is the fastest-growing segment by a wide margin, expanding directly alongside functional beverage and supplement category growth as manufacturers seek shelf-stable formats compatible with dry-blend manufacturing lines that liquid juice cannot support. This segment commands the highest pricing in the entire market, reflecting the freeze-drying and standardization investment required to preserve bioactive compound integrity through the drying and testing process. Naturex and Artemis International hold strong positions in this segment given established freeze-drying expertise and analytical testing support built over years of product development. Growth here concentrates disproportionately in immune health and healthy aging supplement categories where documented compound content matters most to manufacturers. This concentration is expected to deepen as immune health category expansion accelerates worldwide.
CAGR 10.6%

Whole Dried Superfruit Pieces

Whole dried superfruit piece demand is expanding faster than the broader juice base, driven by clean-label snack brands seeking minimally processed alternatives to conventional dried fruit snacks laden with added sugar and preservatives. This segment requires close collaboration between processors and snack brand innovation teams during formulation, since preserving texture and flavor without added sugar demands additional technical investment beyond standard juice or powder supply. Ocean Spray and Sunfood maintain meaningful positions in this segment given established freeze-drying expertise. Growth here tracks broader clean-label snacking trends rather than short-term commodity price swings affecting standard juice competitors. Manufacturers increasingly favor this approach as clean-label snacking strategies expand across multiple product categories.
CAGR 9.5%
Full segment breakdown across 6 segments available in the complete report.

Regional Architecture and Country Demand Map

North America dominates processed superfruit demand given its established supplement industry and functional beverage manufacturing base, with East Asia following closely through China's dominant cultivation and processing scale across its own expanding wellness markets. across their major metropolitan retail channels and expanding online distribution networks

North America

United States supplement industry scale, concentrated across the country's largest functional nutrition manufacturers, makes North America the genuine global leader in processed superfruit demand rather than a default assignment, since the region hosts Ocean Spray and Sunfood alongside the deepest functional beverage and supplement manufacturing base worldwide. Naturex and Artemis International maintain extensive domestic production and formulation support capacity serving manufacturers directly from established regional facilities. Canada contributes smaller but steady demand tied to its own functional food category growth mirroring United States trends. This demand-side leadership reflects the region's mature supplement manufacturing base, and continued functional nutrition category expansion sustains this leading position through the forecast period. Growing consumer familiarity with exotic superfruit species supports incremental category expansion.
Share: 28% | CAGR: 9.0% (2026 to 2036)

East Asia

China's dominant goji berry cultivation and processing base, combined with rapidly growing domestic functional food consumption, anchors East Asian processed superfruit demand alongside centuries of traditional medicine familiarity with functional fruit ingredients across the population. Chinese producers have scaled domestic extraction and standardization capacity aggressively to serve growing wellness demand alongside substantial export supply to ingredient buyers elsewhere. Japan and South Korea contribute substantial demand and formulation expertise through established functional food suppliers serving sophisticated domestic wellness markets. Continued Chinese cultivation investment and functional food consumption growth keep this region's growth rate among the fastest globally through the forecast period. Taiwan contributes meaningful specialty ingredient manufacturing demand tied to export-oriented functional food investment.
Share: 27% | CAGR: 9.0% (2026 to 2036)
Regional intelligence for 5 additional markets available in the complete report: Western Europe, South Asia and Pacific, Latin America, Middle East and Africa, Eastern Europe. Contact sales@marketmindsadvisory.com.
processed-superfruit-market-trends-country-cagr-analysis-1787313037215

Where Superfruit Processors Can Expand Margins

Processors create outsized value not from standard juice volume alone but from bioactive documentation, standardization consistency, and long-term manufacturer contracts built over years of analytical investment. The levers below identify where margin expands fastest, moving beyond commodity juice sales toward validated extract, format innovation, and contract security. Successful processors combine all three into a durable, repeatable growth model.

Bioactive Compound Certification Commands Strong Premium

Processors that achieve and document verified bioactive compound content capture meaningfully higher realized pricing than standard commodity powder, often 2 to 4 times the price per kilogram for equivalent volume, because supplement manufacturers pay for the documented antioxidant and polysaccharide content this certification provides over conventional undocumented alternatives. This documentation requires sustained analytical testing investment spanning multiple harvest batches, but processors that achieve it gain access to the highest-margin segment of the entire market well ahead of competitors selling undocumented fruit powder. Processors that skip certification remain confined to the lower-margin commodity tier indefinitely.
Market Impact: Adds 430 to 590 basis points gross

Deep Standardization Capability Deepens Manufacturer Ties

Processors that develop deep batch standardization and analytical testing capability capture design-in advantages that undocumented juice-only competitors cannot easily replicate once a manufacturer standardizes formulation on a specific processor's verified extract platform. This capability requires sustained testing technology investment across multiple product generations, but processors achieving strong standardization capability typically retain 83% or more of qualified manufacturer accounts through successive reformulation cycles, converting technology investment into recurring, low-churn revenue. Competitors without comparable analytical depth struggle to match this retention performance across cycles. This gap widens as manufacturers standardize sourcing around fewer, deeper technical relationships.
Market Impact: Retains over 83 percent of qualifie

Securing Long-Term Manufacturer Supply Agreement Commitments

Processors that secure multi-year supply agreements tied to specific manufacturer product lines gain revenue visibility spanning multiple harvest cycles, typically 3 to 5 years, since manufacturers rarely switch extract suppliers mid-cycle given the reformulation and dosage validation risk involved in changing sourcing partners. This contract security requires proven supply consistency and delivery reliability across sustained performance periods, but processors achieving line-level qualification convert commodity volume into durable, multi-year revenue relationships smaller transactional sellers cannot match. This advantage compounds as manufacturers expand product lines rather than reopening supplier selection. Smaller processors rarely secure comparable line-level qualification without dedicated documentation investment.
Market Impact: Secures 3 to 5 years of contract re

Building Direct Grower Partnership Network Access

Processors that develop direct sourcing partnerships with contracted grower networks capture cost and traceability advantages that trader-dependent competitors cannot easily replicate once a processor secures preferred access to limited high-quality harvest volume across multiple growing regions. This partnership model requires sustained relationship investment across multiple growing seasons, but processors achieving strong grower integration typically secure 4 to 6 year supply relationships spanning successive harvest cycles that transactional buyers cannot access without comparable investment. This gap widens as growers prioritize allocation toward buyers offering multi-season purchase commitments. Smaller processors rarely negotiate comparable multi-season terms without dedicated relationship investment.
Market Impact: Secures 4 to 6 years of supply acce

Who Controls the Margin Pool

CR5 stands at 26%, reflecting a fragmented market shaped by the regional grower relationship dependencies that favor established processors over any single dominant global supplier. The gap between the top five and smaller processors is widest in bioactive compound documentation, where supplement manufacturer qualification barriers protect leaders far more than in standard commodity juice supply. This gap is widening as certification and standardization barriers compound over successive harvest
Competition currently plays out across three dimensions: bioactive documentation races among leaders serving supplement manufacturers, standardization capability investment among processors building powder extract platforms, and grower network expansion among a broader group of regional Chinese and Latin American processors. Smaller regional processors compete primarily on price and proximity to domestic consumption rather than documentation depth or global distribution scale.

Emerging pressure comes from two directions. South American processors are investing in analytical testing capacity to reduce reliance on Asian extract concentration, offering manufacturers geographic diversification that established suppliers cannot match alone. Continued functional nutrition growth could also reorder competitive rankings if standardized extract demand accelerates faster than currently expected, favoring processors with early testing investment over commodity-only competitors.
processed-superfruit-market-trends-company-positioning-matrix-1787313037737

Competitive Moat and Risk Dimensions

NATUREX S.A.

Moat: Broadest Global Extraction Network

Naturex operates the most extensive multi-region botanical extraction network among superfruit processors, spanning Asia, Latin America, and Africa, giving it supply continuity that single-origin competitors cannot match, built over decades of established grower relationships. Few specialist rivals can match this combined geographic and grower relationship scale.
NATUREX S.A.

Risk: Diversified Portfolio Limits Focus

Naturex's broad botanical ingredient portfolio means superfruit extract competes internally for processing capacity and research investment against larger, more established product lines within the company's overall business strategy and priorities. A sustained shift toward narrower regional specialists could gradually erode this broad positioning advantage. Growth could slow.
ARTEMIS INTERNATIONAL INC.

Moat: Deepest Analytical Testing Infrastructure

Artemis International operates extensive bioactive compound analytical testing infrastructure built over years of sustained laboratory investment, giving it preferred supplier status across supplement manufacturers requiring the deepest standardization documentation available anywhere in the category today. Competitors without comparable laboratory depth typically cannot match this qualification speed.
ARTEMIS INTERNATIONAL INC.

Risk: Limited Direct Grower Ownership

Artemis International's sourcing relies more heavily on trading intermediaries than processors with direct grower ownership, leaving it more exposed than vertically integrated competitors to price volatility during periods of tight harvest supply. Vertically integrated rivals can better absorb harvest shocks that pressure trading-dependent margins and could compress overall profitability.

Players Tracked

Prominent Players

Naturex S.A.
Artemis International Inc.
Ocean Spray Cranberries Inc.
Sunfood Corporation
POM Wonderful LLC

Other Key Players

Milne Fruit Products Inc.
Van Drunen Farms
FutureCeuticals Inc.
Nutrafur S.A.
Sambazon Inc.
Kanegrade Ltd
Döhler Group
SVZ International B.V.
Symrise AG
Frutarom Industries Ltd.
AVT Natural Products Limited
DSM-Firmenich
Ingredion Incorporated
Sensient Technologies Corporation
Cargill Incorporated

Recent Developments

JANUARY 2025

Naturex Expands Chinese Extraction and Standardization Capacity

Naturex announced completion of a dedicated extraction and standardization capacity expansion at its Chinese processing facility, adding qualified capacity to serve growing supplement manufacturer demand. The expansion follows several years of analytical testing investment supporting bioactive documentation. The added capacity supports faster order fulfillment across expanding regional manufacturer accounts.
Signal: Confirms leading processors are dedicating
MAY 2025

Artemis International Signs Peruvian Sourcing Partnership

Artemis International announced a new sourcing partnership with Peruvian camu camu growers, diversifying its supply base beyond traditional Asian origins. The partnership follows several years of geographic diversification planning tracking growing manufacturer demand for supply redundancy. The partnership includes joint investment in local extraction infrastructure and grower support programs.
Signal: Signals established processors are activel
SEPTEMBER 2025

Ocean Spray and a Major Supplement Brand Sign Extract Supply Agreement

Ocean Spray signed a multi-year extract supply agreement with a major supplement brand covering cranberry extract supply for expanding immune health product lines. The agreement secures forward volume for Ocean Spray at negotiated pricing tied to the brand's long-term product launch schedule. Terms were not fully disclosed publicly.
Signal: Signals supplement brands are increasingly

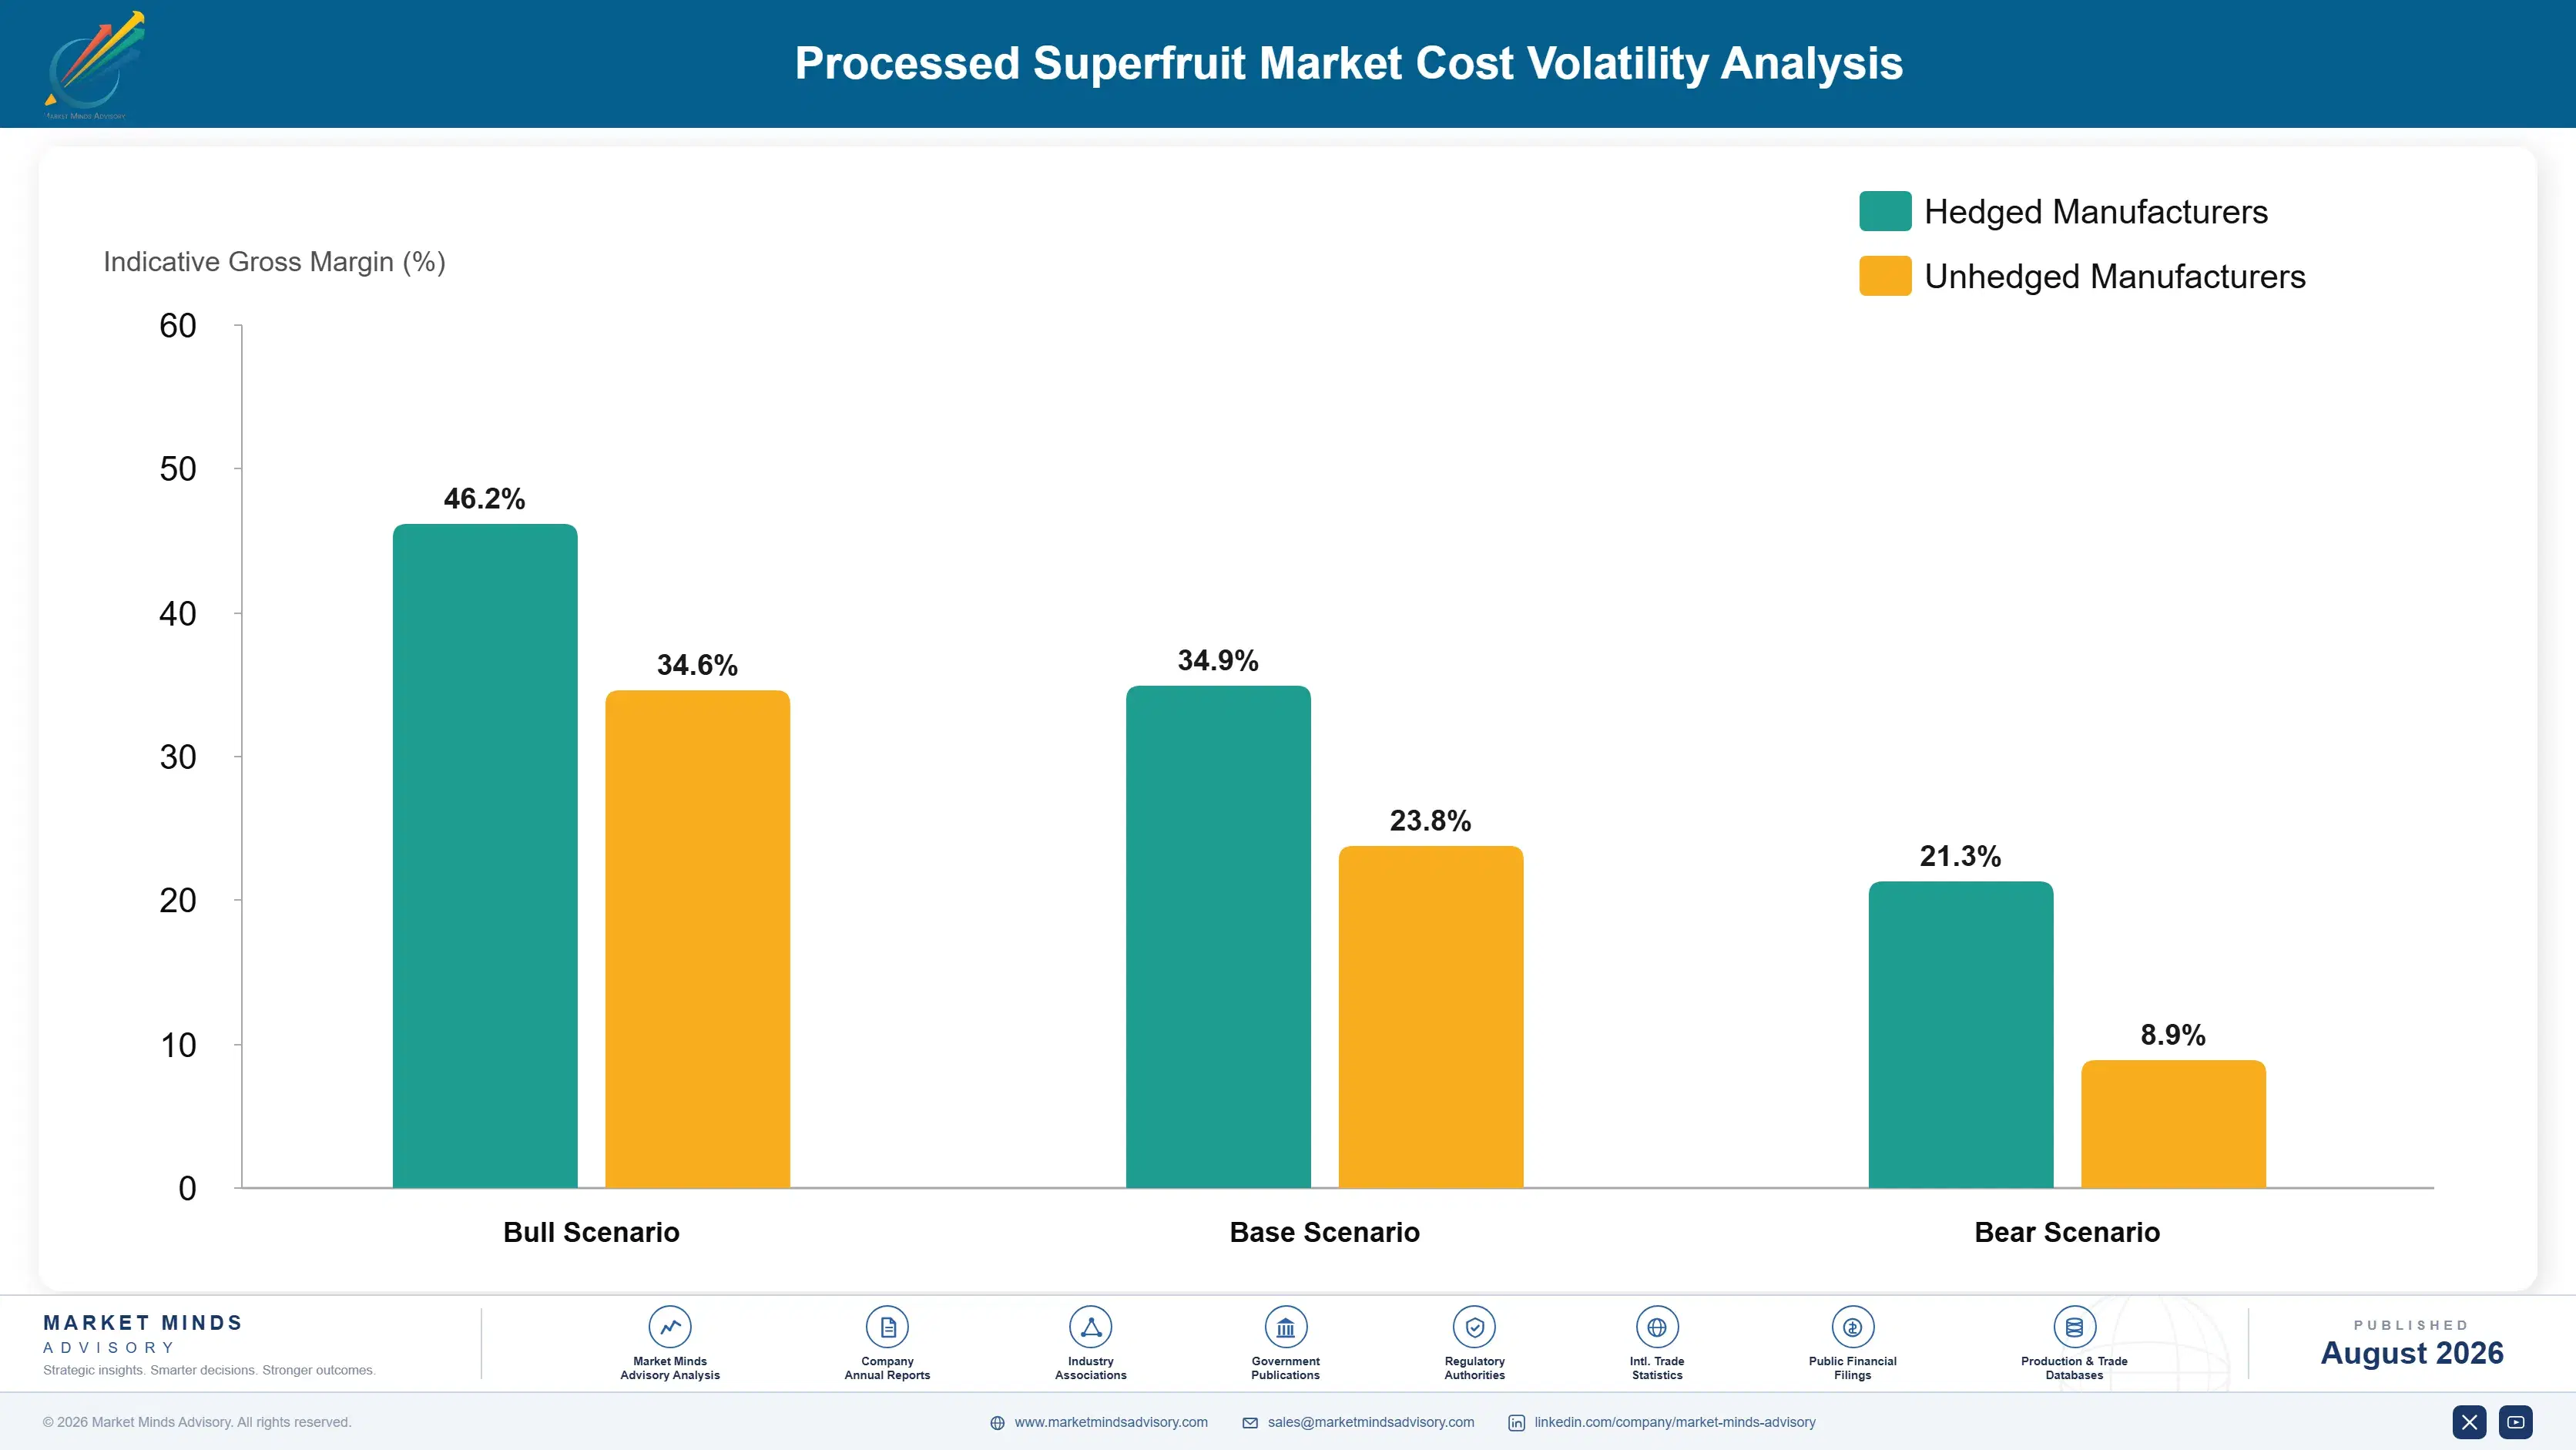
Raw Fruit and Cold-Chain Logistics Exposure

Raw fruit and cold-chain logistics inputs together account for roughly 37% of cost of goods sold across processed superfruit production, with pricing tied to harvest yield variability and export logistics capacity rather than manufacturer-specific dynamics alone. Processors relying on spot-market fruit purchases face greater price exposure than those with long-term grower agreements. Multi-year fixed agreements help maintain predictable margins across successive supply cycles.
Superfruit prices rose sharply during 2021 and 2022, documented in company disclosures across the botanical ingredient sector, as disease pressure and adverse weather simultaneously reduced harvest yields across major growing regions in China and Latin America. Several processors reported compressed margins during this period, since manufacturer pricing on established contracts could not be renegotiated quickly enough to reflect rising raw fruit cost. Processors relying on spot-market purchasing absorbed the largest share of this cost pressure.

This exposure disadvantages smaller processors without long-term grower agreements relative to larger, better-capitalized competitors who hedge exposure through diversified multi-region sourcing and, in some cases, direct cultivation partnerships. Processors without secured supply face meaningfully greater difficulty maintaining consistent margins during periods of raw material volatility, particularly smaller regional processors lacking comparable purchasing scale. Smaller regional processors lack comparable multi-region purchasing scale.
processed-superfruit-market-trends-cost-volatility-analysis-1787313037933

Long-Term Grower Supply Contracts

Processors are locking in multi-year superfruit supply contracts at fixed or formula-based pricing, trading some upside flexibility for predictable production costs. This approach has become more common since 2022 as processors sought greater cost predictability across volatile harvest cycles. Several processors have extended existing agreements following favorable initial harvest cost outcomes since 2022. Terms typically last multiple years.

Multi-Region Sourcing Diversification

Several larger processors are investing in multi-region sourcing diversification across China, Peru, and Brazil, directly reducing exposure to any single growing region's weather or disease disruption. This approach requires sustained relationship investment but delivers durable supply resilience once diversification matures. Full diversification maturity typically takes several harvest cycles to reach across new growing regions.

Direct Cultivation Partnership Investment

Processors are investing in direct cultivation partnerships with contracted growers, reducing exposure to merchant fruit market pricing volatility. This diversification has become standard practice among the largest processors pursuing consistent year-round supply availability. This diversification also reduces exposure to any single region's weather or trade policy disruption. Smaller processors typically lack the purchasing scale to negotiate comparable multi-region terms.

Portfolio Architecture for Margin Defence

MMA organizes this market into three tiers by documentation depth and margin profile. The volume tier covers standard commodity juice sold into conventional beverage manufacturing applications, competing primarily on price. The premium tier covers documented standardized powder and extract systems commanding higher margins through bioactive certification and formulation partnership barriers. The sustainability tier captures next-generation regenerative cultivation and traceable blockchain-verifi
Volume tier processors compete on price and delivery consistency with moderate margins, while premium tier suppliers protect pricing power through bioactive documentation and formulation partnership barriers that keep new entrants out for years at a time. This creates real tension inside diversified processors, since capital allocated to sustaining standard juice capacity competes directly with capital needed to fund analytical testing and standardization infrastructure, and most large processors now favor the latter given superior long-term returns.

The highest-value pools concentrate in documented standardized extract for supplement manufacturers and long-term supply agreements, where certification barriers and contract security combine to support the strongest pricing power in the entire market. Whole dried piece systems are emerging as a further high-value position as clean-label snacking accelerates industry-wide.

Volume / Commodity-Adjacent Tier

Standard commodity juice sold into conventional beverage manufacturing applications, competing primarily on price and delivery consistency across established relationships. Processors in this tier typically hold thin margins and compete on volume and geographic proximity to buyers.
Gross Margin: 16-24%

Premium / Certified Tier

Documented standardized powder and extract systems commanding higher margins through bioactive certification and durable manufacturer formulation partnerships. Processors holding this position typically defend pricing power for years once manufacturer qualification is secured.
Gross Margin: 32-42%

Sustainability / Regulatory / Next-Generation Tier

Regenerative cultivation and blockchain-verified sourcing systems positioned ahead of rising sustainability and transparency requirements among manufacturers. Adoption remains early but is expected to accelerate as procurement teams weigh traceability criteria more heavily.
Gross Margin: 24-34%
processed-superfruit-market-trends-portfolio-architecture-1787313038430

High-value Sub-segments and Strategic Watch-out

Documented Standardized Extract for Supplements

This segment combines the strongest bioactive documentation barriers in the market with steady growth tied to continued functional nutrition adoption. Processors with established testing data hold a durable advantage new entrants rarely overcome quickly. New entrants rarely replicate this quickly without comparable years of analytical investment.

Long-Term Manufacturer Supply Agreements

Manufacturer reformulation programs support steady demand growth largely independent of broader commodity juice cycles, with established qualification providing meaningful competitive protection against new entrants seeking entry. Switching costs remain high once reformulation qualification is secured through documented performance. Suppliers holding multi-year qualifications enjoy unusually stable, predictable revenue visibility.

Standard Commodity Juice and Concentrate Supply

The largest volume base by unit count, this segment covers standard-grade juice sold into conventional beverage manufacturing applications, where competition is driven mostly by price and delivery consistency. Margins here remain thin but the volume base is dependable. Processors rarely differentiate meaningfully on sourcing depth within this segment currently.

South American Sourcing Diversification Expansion

Processors are expanding South American sourcing capability to serve growing supply diversification demand, a trajectory worth monitoring closely by processors still dependent primarily on Asian supply alone. Early movers here may secure durable manufacturer relationships ahead of slower-moving competitors. Joint sourcing investment typically precedes visible revenue contribution here.

Manufacturer Qualification Durability by Category

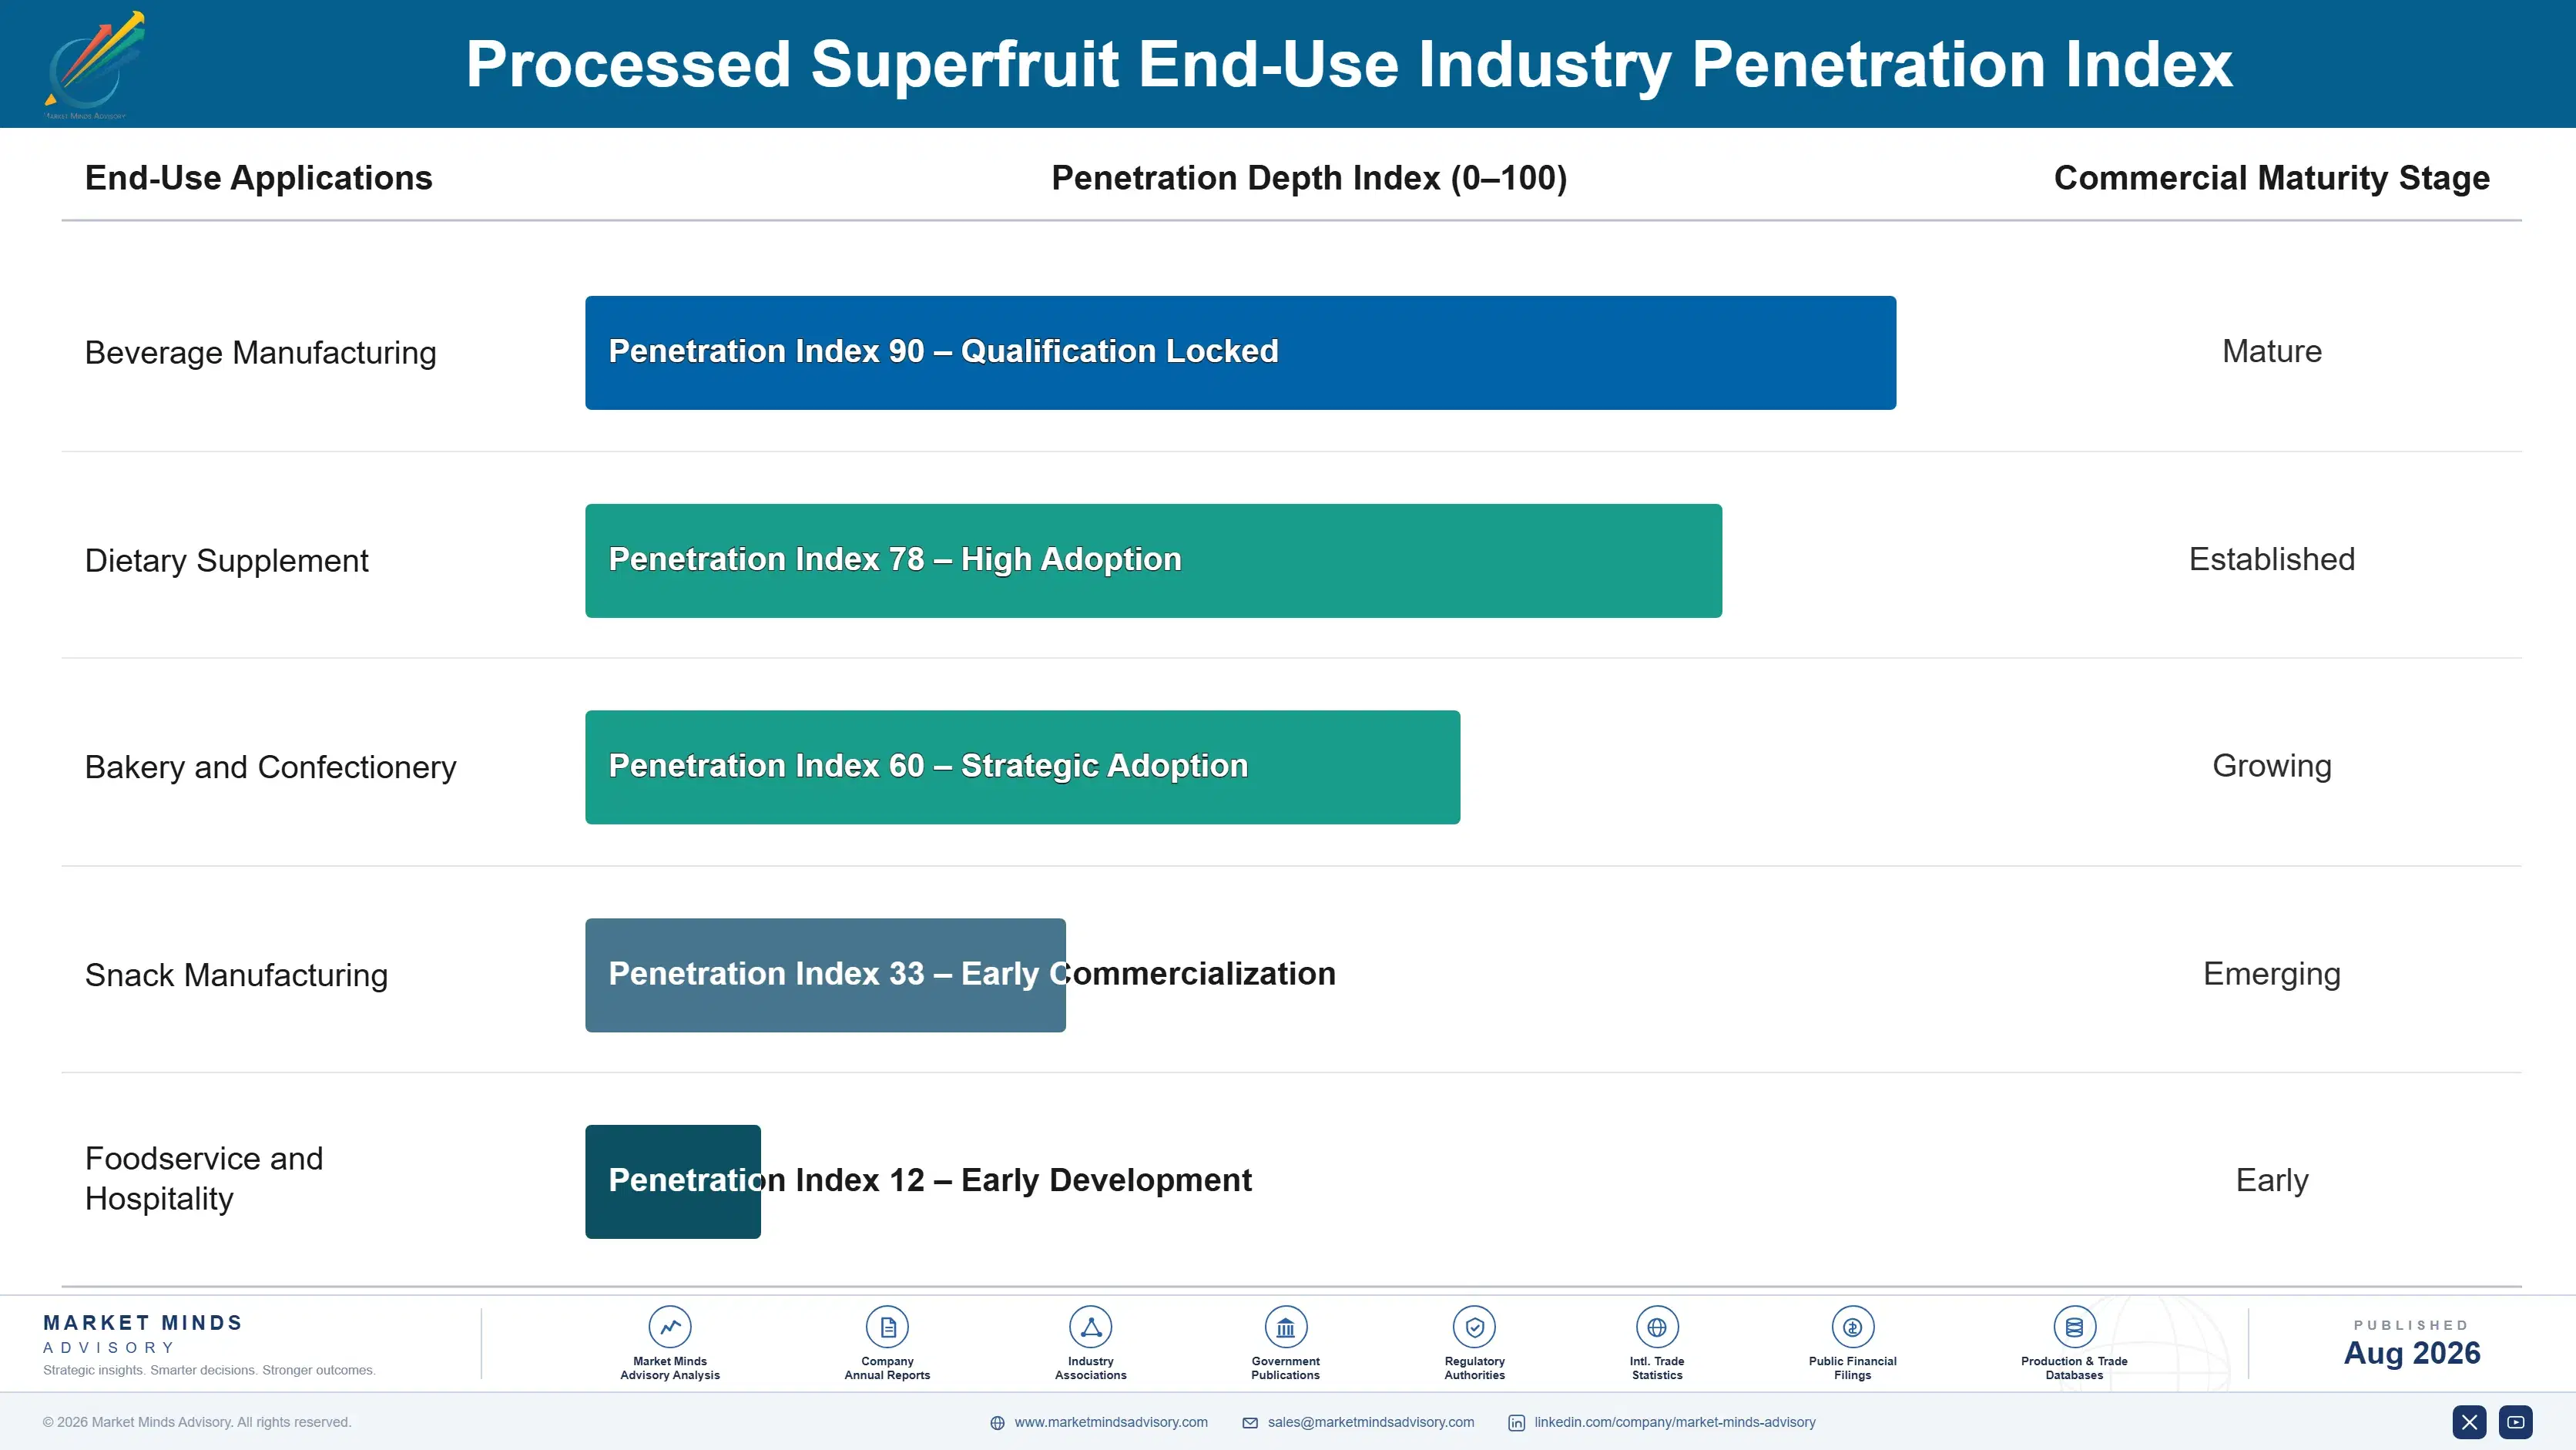
Once a processor secures qualification within a manufacturer's product line reformulation, that relationship typically persists for the full product life, since switching extract suppliers requires dosage and bioactive requalification that most manufacturers avoid absorbing without strong cause given supplement efficacy claim risk. This creates durable, low-churn revenue characteristics for manufacturer-qualified supply, distinct from the more transactional nature of standard commodity juice dem
Adoption depth varies sharply by end use. Supplement manufacturers show the deepest stickiness, since switching extract suppliers requires extensive reformulation and dosage requalification that most avoid absorbing without strong cause given efficacy claim consistency risk. Clean-label snack brands show similarly strong stickiness tied to flavor and texture identity requirements across product lines. Mainstream juice and beverage manufacturers show the least stickiness of the three, since these purchases occur more transactionally on standard commodity specifications.

Buyer profiles are shifting as procurement teams increasingly weigh bioactive documentation and supply continuity guarantees, not just price, as explicit criteria following recent periods of harvest-driven supply disruption across the category. Younger supplement brand teams increasingly favor processors with credible multi-region sourcing over single-origin purchasing, a consideration that has grown more prominent following recent supply disruption episodes across the botanical ingredient sector.
processed-superfruit-market-trends-end-use-penetration-index-1787313038922

Where MMA Sees the Opportunity

These are among the four positions where our research anticipates prominent divergence between winners and laggards over the coming forecast period. Each is grounded in the demand model, the regulatory perimeter, and the announced capacity pipeline.
01 / BIOACTIVE DOCUMENTATION INVESTMENT

Build Bioactive Documentation Ahead of Demand Growth

Documented standardized extract commands the strongest pricing power in the entire market, and processors that invest in bioactive compound testing now position themselves well ahead of continued functional nutrition category growth through 2036. This capability requires sustained analytical investment across multiple harvest batches spanning several growing regions. Waiting until standardized demand is obviously dominant risks ceding this documentation advantage to processors who invested earlier and already hold manufacturer relationships spanning multiple reformulation cycles and years of accumulated testing trust built through performance.
02 / STANDARDIZATION CAPABILITY INVESTMENT

Build Standardization Capability to Deepen Manufacturer Ties

Deep standardization capability provides the most direct path to winning long-term manufacturer relationships in a market where supplement formulators increasingly value documented dosing over conventional undifferentiated juice or powder. Processors that invest in analytical technology now position themselves well ahead of competitors still selling purely as transactional commodity juice vendors. This capability requires substantial technology investment, but processors that achieve deep standardization capability convert investment into recurring, low-churn revenue that smaller competitors cannot easily replicate without comparable years behind them.
03 / MANUFACTURER CONTRACT DEVELOPMENT

Secure Long-Term Manufacturer Contracts Early

Manufacturers rarely switch extract suppliers mid-cycle, and processors that secure supply positions with reformulation programs currently expanding gain revenue visibility spanning years of future production cycles across multiple facilities. This positioning requires proven supply consistency and delivery reliability relative to competing processors over sustained periods. Processors that achieve it convert commodity volume into the most durable revenue relationships available in this market, and waiting until programs are already committed risks missing this opportunity entirely, ceding it to better-prepared competitors that moved earlier.
04 / GROWER PARTNERSHIP DEVELOPMENT

Build Grower Partnerships for Durable Supply Access

Direct grower partnership development represents an underappreciated growth opportunity in a market where most processors still compete primarily on trader-sourced fruit rather than direct cultivation relationships. Processors that build early partnerships with contracted growers capture value beyond standard fruit pricing through recurring, multi-season supply relationships spanning successive harvest cycles. This collaboration requires sustained relationship investment, but processors achieving strong grower integration secure more stable access that pure spot-market buyers cannot match without comparable years of sustained relationship investment behind it.

Engagement Snapshot From the Field

A live engagement with an industry participant carrying material or product regulatory and market exposure ahead of a defining policy shift, showing how our research translates into a defensible multi-year portfolio strategy.
MARKET MINDS ADVISORY · CLIENT ENGAGEMENT SUMMARY
Processed Superfruit Producer Strategic Portfolio Review and Transition Roadmap 2026·Investment Scenario on Processed Superfruit Exposure Evaluation 2025-26
CLIENT PROFILE
The client is a national dietary supplement brand generating steady annual revenue from a portfolio of immune health and healthy aging products distributed across major retail and e-commerce channels throughout the country. The company faced growing scrutiny from regulators and retailers over unsubstantiated antioxidant claims across its product line. Its quality and regulatory affairs team reports directly to executive leadership given the program's scale.
STRATEGIC CHALLENGE
The client needed to decide whether to invest approximately $1.1 million (client-reported, unverified by MMA) in transitioning its formulations to standardized bioactive extract suppliers with documented compound content, or risk continued regulatory scrutiny and potential retail delisting given tightening claim substantiation requirements. The decision carried real reformulation timeline implications given existing retail commitments.
MMA APPROACH
MMA's advisory team conducted primary interviews with standardized extract suppliers about documentation capability and testing turnaround, and analyzed comparable supplement brand reformulation timelines to assess realistic project scope and cost. The analysis weighed reformulation investment against projected regulatory and retail delisting risk. Findings were validated against comparable supplement brand reformulation experiences.
KEY FINDINGS
  1. Interview data indicated that three major suppliers had documented bioactive testing capability specifically validated for the client's target antioxidant claims, narrowing realistic supplier options considerably.
  2. Comparable supplement brand reformulations typically required 7 to 11 months from supplier selection to full commercial rollout across a national product line.
  3. Retailers confirmed that delisting risk for non-compliant products would begin within 12 months, giving the client a defined but workable reformulation window overall.
  4. Brands that reformulated proactively ahead of regulatory deadlines reported smoother rollout execution than peers who waited until enforcement deadlines were imminent. This gap supported the case for proactive reformulation investment.
CLIENT PROFILE
The client is a national dietary supplement brand generating steady annual revenue from a portfolio of immune health and healthy aging products distributed across major retail and e-commerce channels throughout the country. The company faced growing scrutiny from regulators and retailers over unsubstantiated antioxidant claims across its product line. Its quality and regulatory affairs team reports directly to executive leadership given the program's scale.
STRATEGIC CHALLENGE
The client needed to decide whether to invest approximately $1.1 million (client-reported, unverified by MMA) in transitioning its formulations to standardized bioactive extract suppliers with documented compound content, or risk continued regulatory scrutiny and potential retail delisting given tightening claim substantiation requirements. The decision carried real reformulation timeline implications given existing retail commitments.
MMA APPROACH
MMA's advisory team conducted primary interviews with standardized extract suppliers about documentation capability and testing turnaround, and analyzed comparable supplement brand reformulation timelines to assess realistic project scope and cost. The analysis weighed reformulation investment against projected regulatory and retail delisting risk. Findings were validated against comparable supplement brand reformulation experiences.
KEY FINDINGS
  1. Interview data indicated that three major suppliers had documented bioactive testing capability specifically validated for the client's target antioxidant claims, narrowing realistic supplier options considerably.
  2. Comparable supplement brand reformulations typically required 7 to 11 months from supplier selection to full commercial rollout across a national product line.
  3. Retailers confirmed that delisting risk for non-compliant products would begin within 12 months, giving the client a defined but workable reformulation window overall.
  4. Brands that reformulated proactively ahead of regulatory deadlines reported smoother rollout execution than peers who waited until enforcement deadlines were imminent. This gap supported the case for proactive reformulation investment.
RECOMMENDED STRATEGY
Phase 1: Phase 1 (Months 1-4): Select a qualified standardized extract supplier and begin claim-specific documentation review across target product lines. Documentation reviewed included analytical testing certificates and manufacturer specification records. Phase 2: Phase 2 (Months 5-8): Complete reformulation and finalize updated product labeling with legal and regulatory compliance sign-off obtained. Sign-off required documented compound testing data across multiple product formulations. Phase 3: Phase 3 (Months 9-10): Execute full commercial rollout across the national product line, monitoring consumer response and compliance performance closely.
OUTCOME
The client completed its reformulation within nine months, ahead of the retailer delisting deadline, and retained full shelf placement across its largest retail accounts without disruption. The client reported that proactive reformulation strengthened its retailer relationships relative to slower-moving category competitors. The reformulation also opened conversations about expanding the relationship into additional product lines.

Frequently Asked Questions

Foundational context covering the market sizes, CAGR, scope, country, region and competition that inform every finding below. This section is provided to cover basics and most often pre-purchase conversations, answered from the MMA Primary Research Dataset.

What is the current size of the Processed Superfruit Market?

The Processed Superfruit Market was valued at $4.1 billion in 2025. MMA projects it will reach $4.42 billion in 2026 as functional nutrition demand continues accelerating.

How large will the Processed Superfruit Market be by 2036?

MMA forecasts the market will reach $9.45 billion by 2036, up from $4.42 billion in 2026. That represents a 2.14 times expansion over the ten-year forecast window.

What is the CAGR for the Processed Superfruit Market 2026 to 2036?

The market is projected to grow at a 7.9% CAGR between 2026 and 2036. MMA's bull and bear scenarios range from 9.2% to 6.6% depending on harvest reliability and category adoption pace.

Which segment is growing fastest?

Superfruit Powders is the fastest-growing segment, expanding at a 10.6% CAGR, roughly 1.34 times the overall market rate as functional beverage demand accelerates. This growth outpaces every other segment in the market currently.

Who are the major companies in the Processed Superfruit Market?

Naturex, Artemis International, Ocean Spray, Sunfood, and POM Wonderful lead the market, together holding an estimated 26% of global production. Concentration remains moderate given regional grower relationship dependencies across the industry.

Which country is growing fastest?

China is the fastest-growing country market, expanding at an estimated 9.8% CAGR as its cultivation base and functional food consumption both continue rapid expansion. Cultivation base and functional food consumption both continue rapid expansion nationwide.

Report Segmentation Architecture

The full report scope spans multiple orthogonal segmentation dimensions, with cross-tabulated demand data provided for each dimension pair. Coverage extends further to regional breakdowns, trend trajectories, and the competitive detail needed to support segment-level decision-making.

By Primary Market Dimension

  • Juice and Concentrate
  • Puree
  • Powder Extract
  • Whole Dried Pieces
  • Standardized Bioactive Extracts

By End-Use Industry

  • Beverage Manufacturing
  • Dietary Supplement
  • Bakery and Confectionery
  • Snack Manufacturing
  • Foodservice and Hospitality

By Commercial Dimension

  • Direct Manufacturer Supply
  • Distributor and Trading Supply
  • Private Label Formulation Supply

By Region

  • North America
  • East Asia
  • Western Europe
  • South Asia and Pacific
  • Latin America
  • Middle East and Africa
  • Eastern Europe

Scope, Methodology, and Coverage

Every figure in this report is reproducible from documented input assumptions. The scope below maps the historical period, the forecast horizon, the segmentation dimensions, and the countries covered, alongside the underlying primary and qualitative methodology.
Historical Period
2020 to 2025
Forecast Period
2026 to 2036
Base Year
2025 (USD billions; MMA Primary Research Dataset, August 2026)
Market Definition
This report covers processed superfruit ingredients, including juice concentrate, puree, powder extract, dried pieces, and standardized bioactive extracts derived from fruits such as acai, goji, pomegranate, elderberry, and camu camu, sold to food, beverage, and supplement manufacturers. It excludes fresh superfruit sold for direct consumption, finished consumer products containing superfruit ingredients, and mainstream commodity fruits not marketed under functional superfruit positioning.
Quantitative Units
USD billions (current prices); metric tons shipped where applicable
Segmentation Dimensions
By Extract Format Type; By End-Use Industry; By Commercial Dimension; By Region
Regions Covered
North America, East Asia, Western Europe, South Asia and Pacific, Latin America, Middle East and Africa, Eastern Europe
Countries Covered
China, USA, Canada, Peru, Brazil, Ecuador, Colombia, Germany, France, Netherlands, UK, Japan, South Korea, India, Vietnam, Thailand, Australia, Israel, Egypt, South Africa, UAE, Poland, Czech Republic, and additional markets relevant to this sector
Key Companies Profiled
Naturex S.A., Artemis International Inc., Ocean Spray Cranberries Inc., Sunfood Corporation, POM Wonderful LLC, Milne Fruit Products Inc., Van Drunen Farms, FutureCeuticals Inc., Nutrafur S.A., Sambazon Inc., Kanegrade Ltd, Döhler Group, SVZ International B.V., Symrise AG, Frutarom Industries Ltd., AVT Natural Products Limited, DSM-Firmenich, Ingredion Incorporated, Sensient Technologies Corporation, Cargill Incorporated
Quantitative Methodology
Primary survey, n=3,800 respondents, Q4 2025, six countries; demand-side model with trade association cross-validation
Qualitative Methodology
47 expert interviews, Q4 2025; applied to validate demand model assumptions, identify emerging dynamics, and assess competitive positioning
Report Format
PDF and XLSX data workbook (Word format preview document)
Publisher
Market Minds Advisory
Report Code
MMA-2026-AGR-141
Published
August 2026
Contact
sales@marketmindsadvisory.com | www.marketmindsadvisory.com

Purchase the full Processed Superfruit Market Report (2026 to 2036).

The full Processed Superfruit Market report delivers ten-year forecasts across all seven regions, six extract format segments, and the full competitive landscape of twenty profiled processors. It includes detailed analysis of bioactive documentation economics, standardization capability strategies, and demand drivers spanning supplement, functional beverage, and clean-label snacking applications. Buyers receive segment-level margin benchmarking across the volume, premium, and sustainability tiers identified in this summary. The report also includes primary survey data from 3,800 respondents and 47 expert interviews conducted in the fourth quarter of 2025, supporting every demand and pricing assumption in the forecast.
Ten-year regional and segment-level forecast models
Competitive profiles covering twenty superfruit processors
Bioactive documentation economics and pricing analysis
Standardization capability and formulation partnership mapping
Portfolio margin benchmarking across three commercial tiers
Primary survey and expert interview data appendix

Built For The People Who Decide

From boardroom strategy to bench-side execution, this report is read cover-to-cover by leaders shaping the next decade of their industry, turning demand scenarios, market dynamics and valuation benchmarks into decisions.
CXOs/ Presidents/ VPs/ Managers
M&A and Corporate Development
Strategy Teams and R&D Heads
Procurement and Product Directors
Regulatory and Compliance Leaders
Investor Relations and Equity Analysts