Market Minds Advisory
Private Jet Charter Services Market

Private Jet Charter Services Market: Private Jet Charter Services Market. Digital Booking Platforms Redraw Charter Economics.

Digital booking platforms are pulling charter demand away from traditional brokered arrangements toward on-demand app-based scheduling, forcing established charter operators to defend customer relationships against faster-moving platform-first entrants across the industry.

Lead Analyst

Published

September 2026

Make Smarter Decisions with Customized Research Insights

Request a free sample report and evaluate market opportunities, growth trends, and competitive dynamics relevant to your business needs.

2025 MARKET VALUE$24.0BMarket Size 2025
2036 FORECAST VALUE$53.2BBase Case , 2026 to 2036
CAGR 2026 TO 20367.5 %Bull 8.7% / Bear 6.3%
INCREMENTAL OPPORTUNITY$27.4BNet 10- year value creation
EXPANSION MULTIPLE2.06x2036 value over 2026 base
Strategic Levers
M&A Pipeline
Regional Outlook
Country Rankings
Competitive Intelligence
Segmental Deep-dive
Call-Us : 91 93563 13602

Executive Snapshot and Market Trajectory.

Digital booking platforms are steadily pulling charter demand away from traditional brokered arrangements toward on-demand app-based scheduling, forcing established charter operators to defend long-standing customer relationships against faster-moving platform-first entrants across multiple current booking cycles. Few operators priced this shift into existing revenue assumptions across the industry.
Charter brokerage platforms and on-demand ad hoc services are expanding fastest as customers pursue flexible booking capability across growing charter budgets. Fractional ownership programs remain a steady revenue base given their dominant installed position across the customer fleet. North America concentrates the largest share of this market's revenue, anchored by dense operator fleet concentration and a mature charter customer base nationwide. Operators with strong existing manufacturing relationships are capturing disproportionate share of new booking demand.
Competitive intensity is rising as legacy charter operators, emerging digital booking platforms, and integrated fractional ownership providers all compete for the same expanding customer base, while booking flexibility pressure and rising empty-leg demand are simultaneously reshaping which operators capture the most durable long-term customer revenue. Operators slow to adapt digital booking strategy risk losing ground across nearly every major customer segment currently active in the wider industry.
Market Definition
This report covers charter flight services, fractional ownership programs, jet card memberships, and brokerage platform revenue for private business jet operations globally. It excludes commercial airline charter operations and aircraft manufacturing sales, which fall outside the defined scope.
Base Year Value
$24.0B in 2025 (MMA Primary Research Dataset, August 2026)
Forecast Period
2026 to 2036, eleven discrete annual values
CAGR
7.5% base case. Bull 8.7%. Bear 6.3%.
Fastest Growth Segment
Charter Brokerage and Booking Platform Services: 12.0% CAGR
Fastest Growth Country
China: 9.5% CAGR
Fastest Growth Region
South Asia and Pacific: 9.5% CAGR
Largest Region
North America: 32% of 2025 global value
Market Leaders
NetJets, Flexjet, VistaJet, Wheels Up, Jet Linx. Source: MMA Primary Research Dataset, July 2026.
Primary Survey
n=3,800 procurement and R&D decision-makers, Q4 2025, six countries
Methodology
Demand-side build-up, cross-validated against public data, 47 expert interviews

Private Jet Charter Services Market Forecast Scenarios

private-jet-charter-services-market-size-forecast-scenario-1788024908757
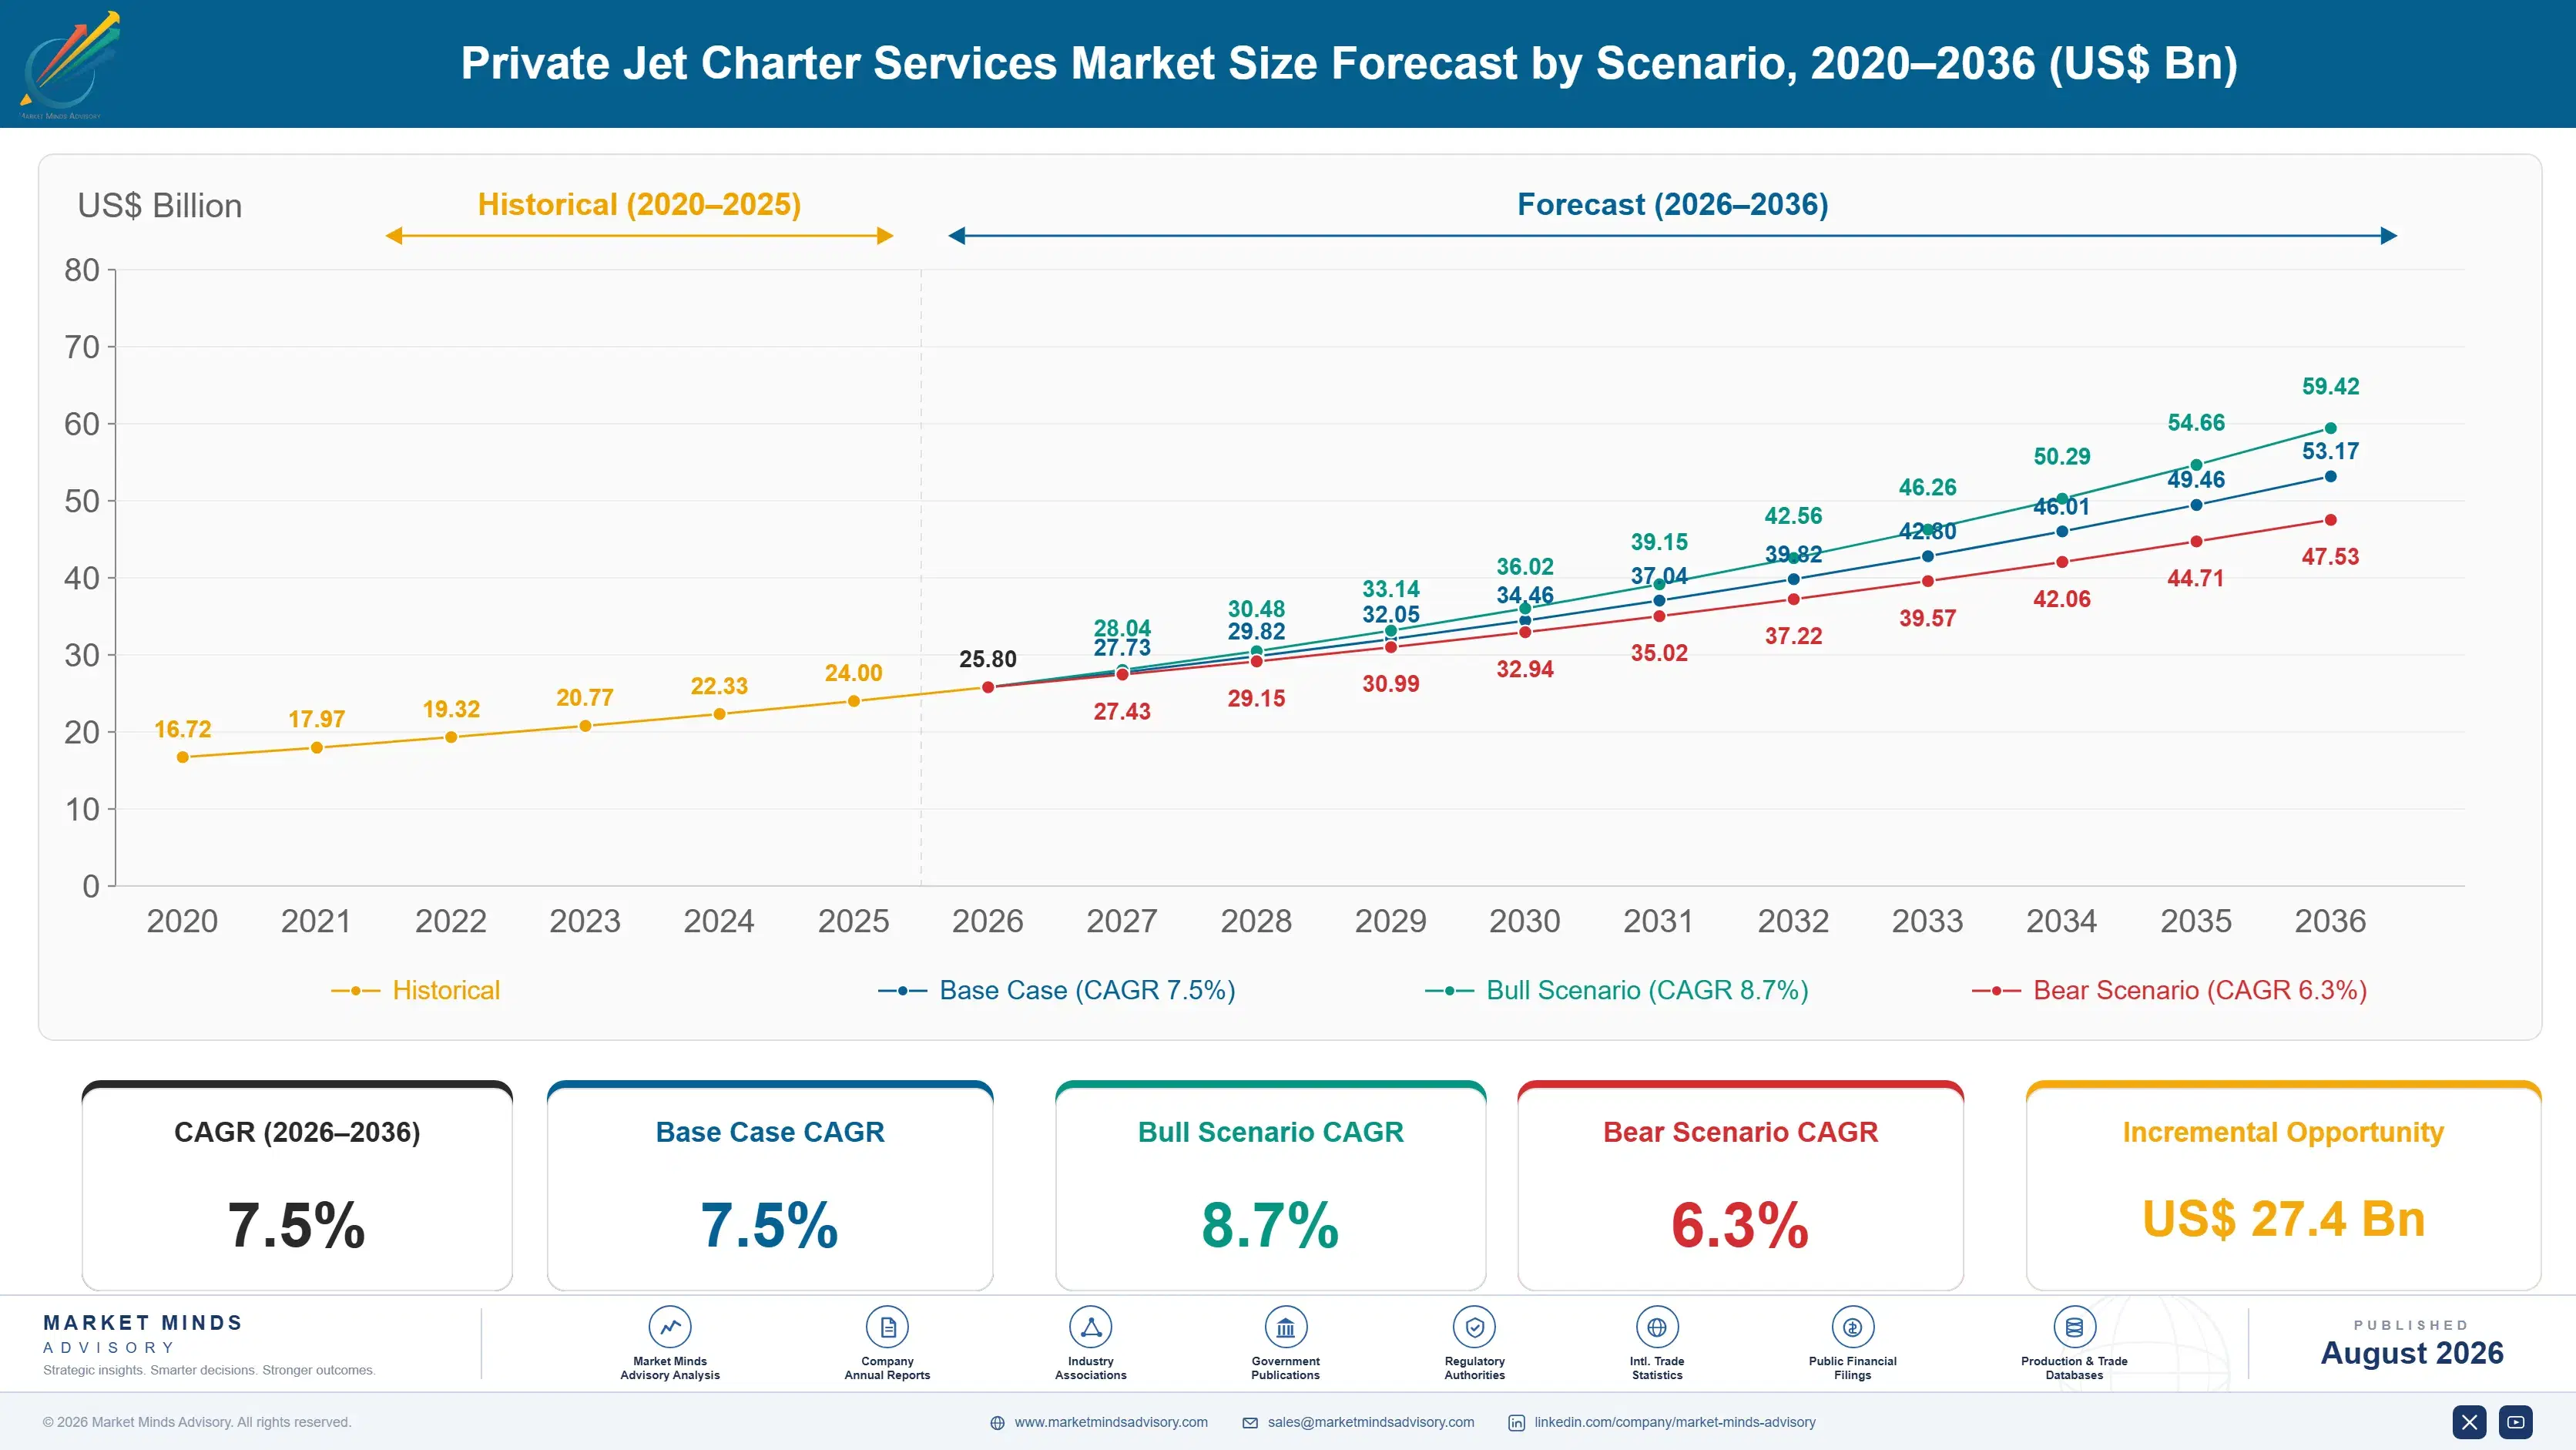
Private jet charter revenue grew at an estimated 6.2 percent historical pace between 2020 and 2025, propelled by durable post-pandemic demand for private travel across major business aviation markets. Momentum has since broadened beyond simple demand recovery toward genuine digital platform adoption, as customers increasingly book charter flights through on-demand mobile applications. Several operators also expanded digital booking platform investment.
The base case assumes 7.5 percent annual growth through 2036, driven by three commercial mechanisms. First, charter brokerage platforms are attracting substantial new investment as customers pursue flexible, transparent booking capability across expanding charter budgets. Second, on-demand ad hoc services are scaling rapidly as customers pursue pay-per-flight arrangements over traditional fractional ownership commitments. Third, a growing global business jet fleet requires steady empty-leg repositioning capacity, adding a durable baseline of discounted charter revenue that persists regardless of new booking technology adoption pace.
The bull case centers on faster-than-expected digital platform adoption pulling forward booking volume growth across multiple customer segments. The bear case centers on prolonged economic uncertainty limiting discretionary charter spending, which could meaningfully slow revenue growth across the newest customer acquisition channels specifically. Either scenario depends on how quickly customers commit to digital booking platform adoption industrywide.

Digital Booking Platforms Redraw Charter Economics

The private jet charter industry sits at an unusual point where booking flexibility pressure and fleet utilization economics are colliding directly with a genuine digital platform transition. Digital booking platforms displacing traditional brokered charter arrangements is the single largest determinant of how customer acquisition budgets are being reallocated across nearly every major operator today, reshaping long-held customer relationships. Operators that misjudge this reallocation risk building strategies around outdated acquisition assumptions.
MARKET CONCENTRATION (CR5)32%Top five operators hold under a third combined
AVERAGE BOOKING LEAD TIME48 hoursTypical duration required between booking request and departure
DIGITAL PLATFORM BOOKING SHARE34%Total flights booked through app-based platforms this year
EMPTY LEG REVENUE SHARE18%Total operator revenue derived from discounted repositioning flights
TOP PRODUCING COUNTRY SHARE41%United States share of global charter fleet operating capacity
FEEDSTOCK COST SHARE38%Fuel and crew labor input cost portion of operating expense
Beneath the digital platform story, the industry is absorbing genuine empty-leg optimization demand. Operators increasingly demand systems that match repositioning flights with price-sensitive customers, letting fleet managers plan utilization around predictable booking windows rather than reactive scheduling. Operators slower to offer comparable empty-leg matching capability risk losing booking competitions to rivals already demonstrating proven fleet utilization performance.
Distribution economics are shifting too. Independent brokerage platforms are steadily capturing booking volume that traditional operator sales teams once claimed by default, particularly on price-sensitive segments nearing the end of exclusive customer loyalty agreements. Operators offering more competitive long-term membership agreements are converting this competitive pressure into genuine multi-year customer relationship wins across multiple charter segments. This favors operators who invested early in digital booking capability.
"Every operator talks about digital booking now, but the ones actually winning customer loyalty are the ones who can also guarantee fleet availability, not just the ones with a slicker app."
Director, Business Aviation Services Practice · MMA Construction and Industrial Equipment Practice · August 2026

Market Trends

Digital Booking Platforms Displace Traditional Brokerage

Customers are increasingly booking charter flights through app-based digital platforms rather than exclusively relying on traditional phone-based brokerage arrangements, reflecting genuine transparency and speed gains that legacy brokerage cannot easily match given manual pricing negotiation and limited real-time availability visibility. VistaJet and Wheels Up have both expanded dedicated digital platform programs specifically to compete for this growing booking category, recognizing that ceding this segment entirely to specialist entrants risks losing meaningful future customer revenue as travelers increasingly favor instant, transparent booking capability across new charter arrangements. This shift is already reshaping the largest customer acquisition budgets across the industry.
Market Impact: Adds 11% booking demand growth
Empty Leg Matching Gains Price-Sensitive Adoption

Operators are increasingly demanding empty-leg matching systems that pair repositioning flights with price-sensitive customers, since matched utilization meaningfully improves fleet economics relative to traditional dead-leg repositioning flown without paying passengers. NetJets has used its fleet optimization data to expand empty-leg revenue meaningfully, while operators without comparable matching capability risk losing booking competitions to better-positioned rivals. Customers increasingly build empty-leg alert requirements directly into new membership program specifications and app preferences. This documented advantage increasingly determines which operators win the most competitive fleet utilization outcomes across the sector overall. This trend continues accelerating industrywide.
Market Impact: Adds 8% reliability-driven booking demand

Market Opportunities and Growth Drivers

Expanding High-Net-Worth Customer Base Drives Demand

The expanding global high-net-worth customer base continues driving steady charter booking demand, directly increasing available revenue for both new membership sign-ups and expanded fleet capacity investment. This booking demand is particularly pronounced among Asian customers rapidly expanding discretionary travel spending, creating durable new demand that extends well beyond typical replacement-cycle patterns these customers historically followed. Operators with strong existing customer relationships in this fast-expanding market are capturing this durable demand more efficiently than competitors entering later in the cycle. This durable demand base gives operators meaningful revenue planning confidence. Operators favor customers offering both new membership and expanded fleet capability.
Market Impact: Delays booking fulfillment by 4 weeks

Rising Commercial Airline Friction Accelerates Charter Investment

Rising commercial airline delay and cancellation frequency is pushing travelers to favor private charter alternatives, directly increasing demand for charter services that deliver meaningfully better schedule reliability than legacy commercial airline booking. This preference represents genuine incremental demand beyond typical replacement-cycle procurement patterns, since customers are actively specifying reliability-optimized travel arrangements rather than simply tolerating commercial airline disruptions at prior tolerance levels. Operators with strong scheduling reliability capability are capturing this durable preference more efficiently than competitors focused purely on legacy sales channels. This capability increasingly determines which operators win future customer loyalty competitions across multiple segments.
Market Impact: Cuts margins by 5 points

Market Restraints and Challenges

Constrained Pilot Supply Extends Fleet Scheduling Delays

Major charter operators continue struggling to secure sufficient qualified pilot staffing fast enough to meet surging booking demand, creating genuine scheduling bottlenecks that extend customer wait times considerably beyond original targets. The root cause is genuine labor market complexity in scaling qualified pilot certification pipelines across a concentrated aviation training base facing simultaneous demand surges from commercial and charter operators alike. The commercial impact delays revenue recognition for operators and complicates fleet planning for customers. Operators are mitigating this through expanded pilot training partnerships and qualified staffing agency development programs currently underway.
Market Impact: Grows digital booking share to 34%

Rising Fuel Cost Volatility Strains Operator Margins

Jet fuel price volatility continues commanding meaningfully higher unit costs as demand surges across the industry, creating margin strain for operators attempting to maintain competitive pricing at scale while preserving fiscal discipline across broader operating cost priorities. The root cause is genuine competition for constrained refining capacity amid simultaneously rising commercial aviation fuel demand. The commercial impact pressures operators to fund fuel hedging programs alongside traditional fixed-price membership offerings. Operators are mitigating this through dynamic pricing models specifically targeting this cost pressure across multiple charter categories. Some operators are also exploring hedging partnerships to manage this volatility.
Market Impact: Cuts unmatched repositioning by 21%
3 additional market trends, 4 additional growth drivers, and 3 additional restraints and challenges are covered in the full report. Contact sales@marketmindsadvisory.com to access the complete intelligence.

Segment CAGR and Growth Architecture

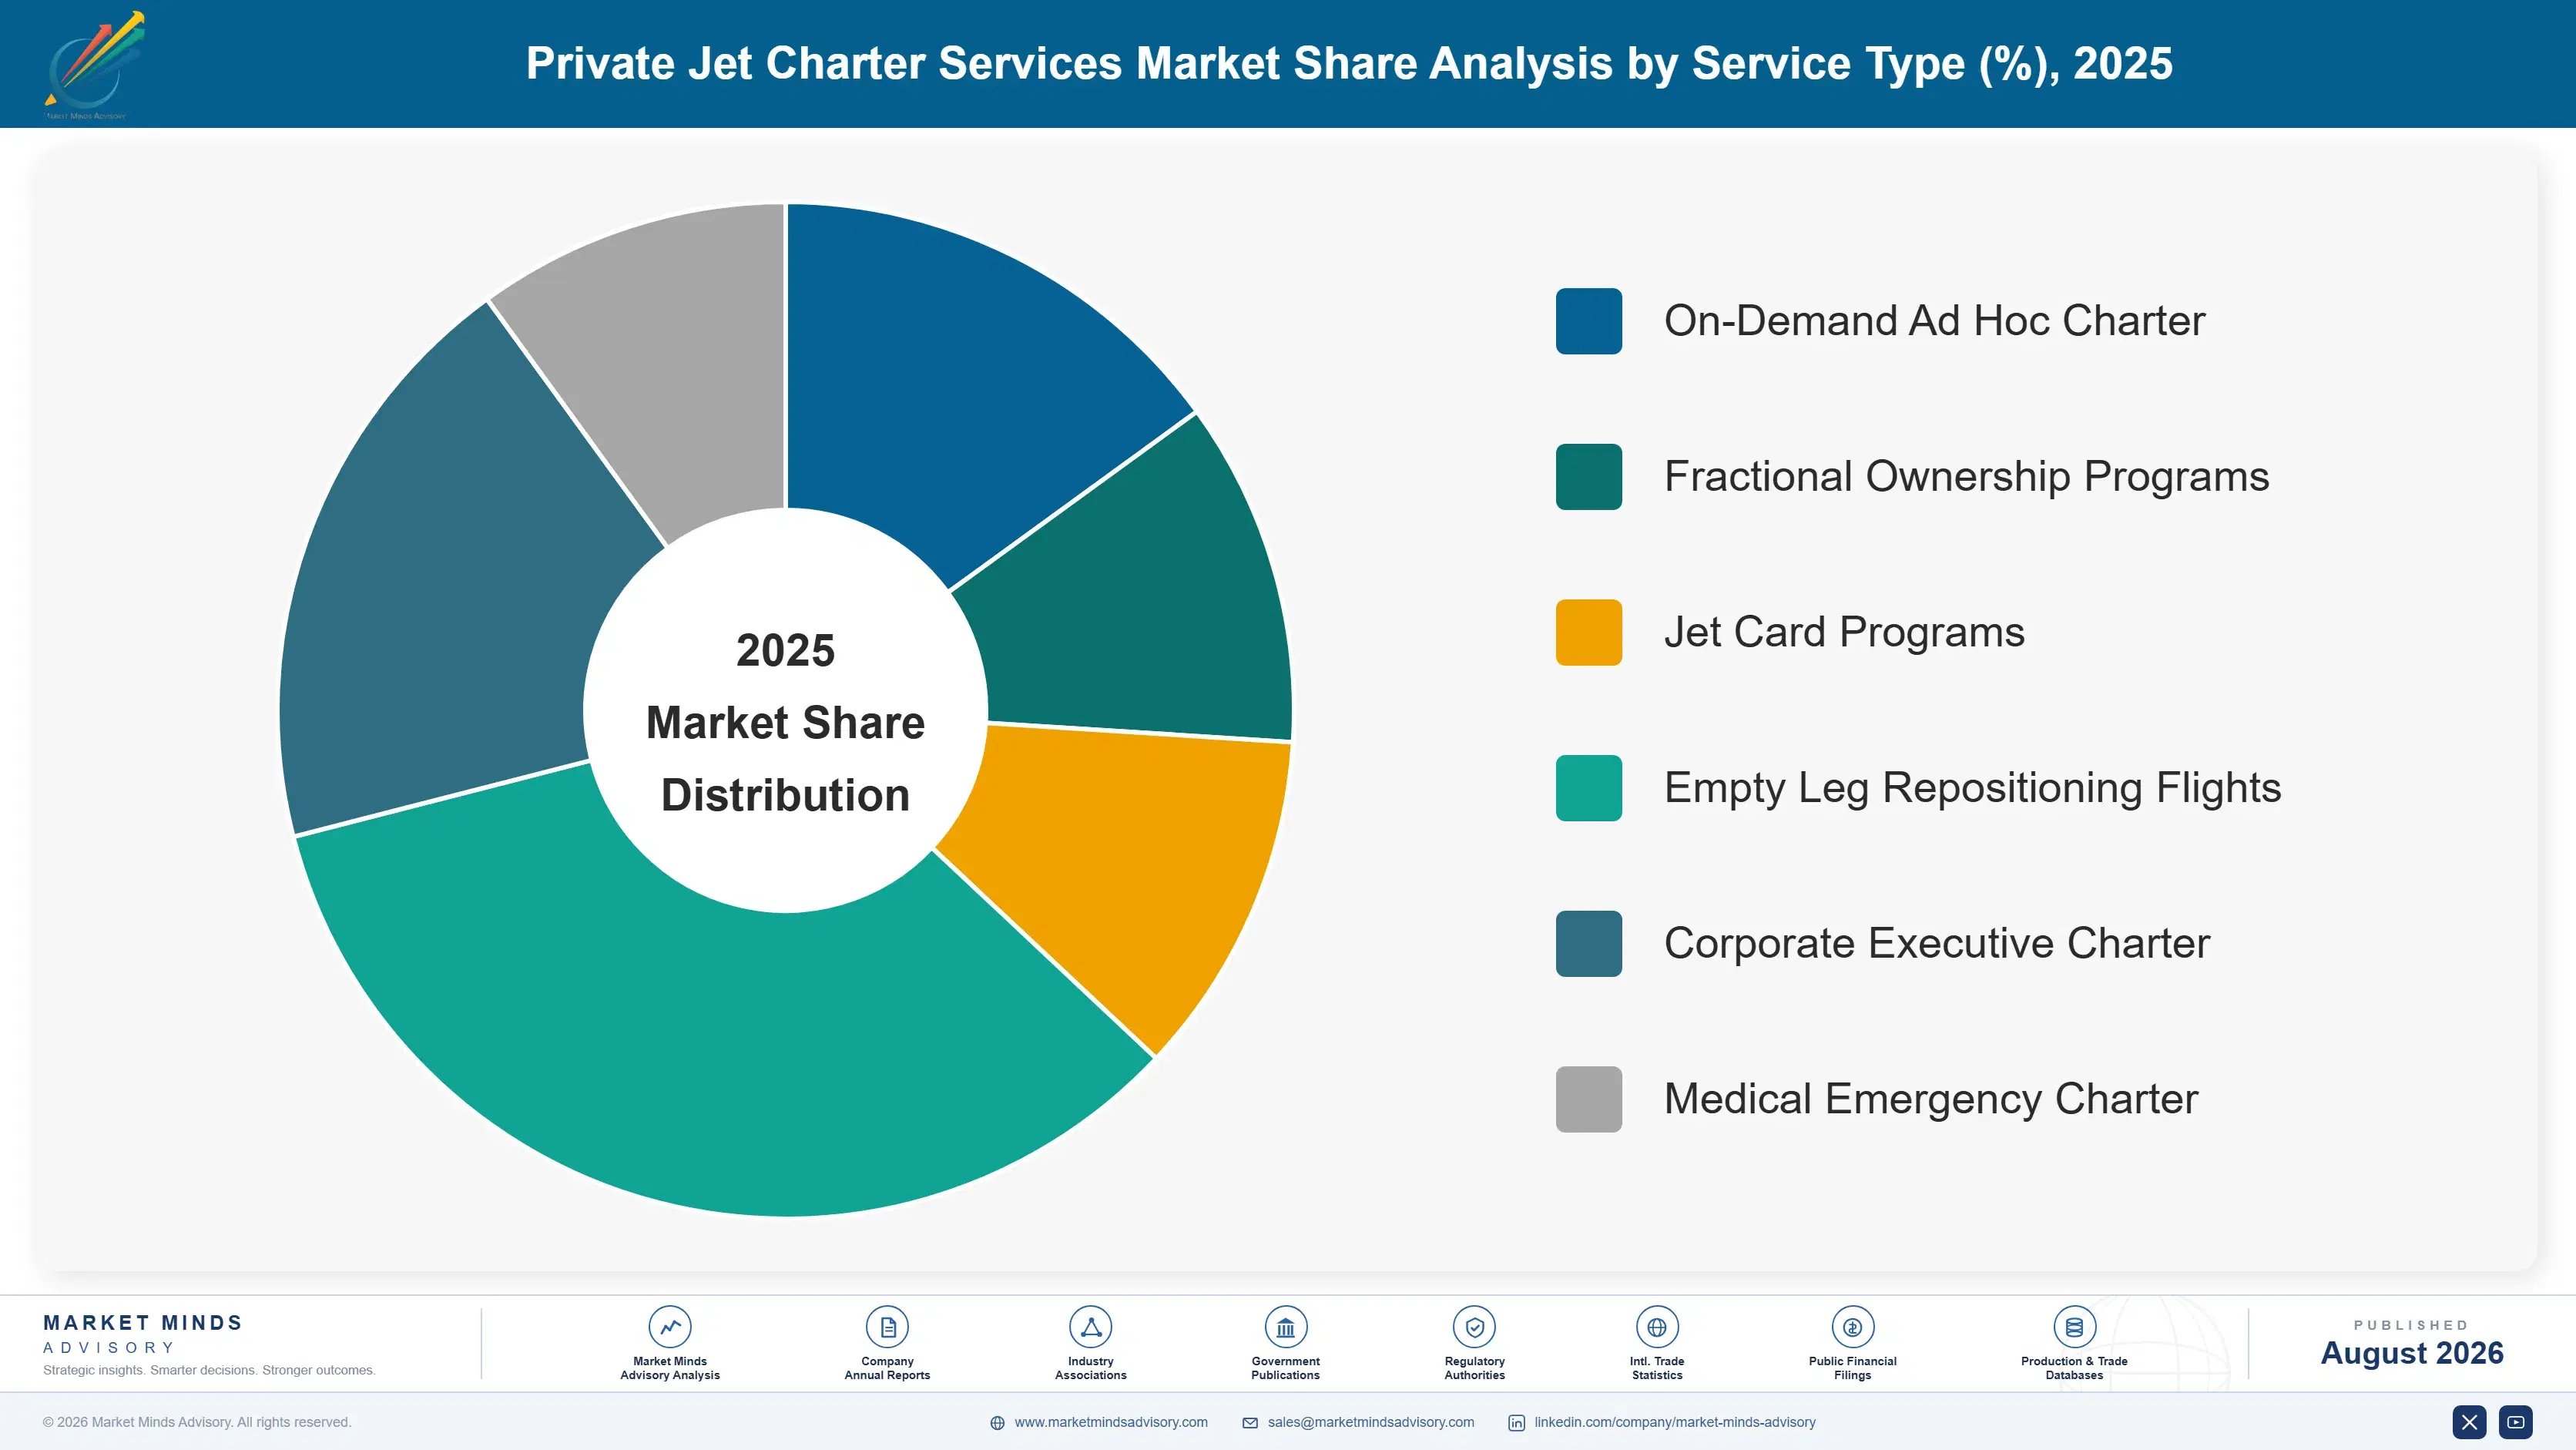
The private jet charter market segments most usefully by service type and function, spanning on-demand, fractional, empty leg, corporate, medical, and brokerage service categories, rather than by aircraft platform or customer nationality alone. This lens keeps upstream fleet operation distinct from downstream booking and brokerage service functions consistently across every category. This shapes booking decisions across customers and operators alike.
private-jet-charter-services-market-market-share-analysis-1788024909292

Charter Brokerage and Booking Platform Services

Charter brokerage and booking platform services are growing fastest, expanding at roughly 1.60 times the market's overall pace as customers increasingly specify app-based digital booking on new charter arrangements to improve transparency and speed relative to legacy phone-based brokerage. VistaJet and Wheels Up have both expanded dedicated digital platform programs specifically to compete for this growing booking category, recognizing that ceding this segment entirely to specialist entrants risks losing meaningful future customer revenue. This segment particularly benefits operators with strong software and real-time inventory engineering capability, since traditional phone-based brokerage carries an increasingly unfavorable transparency profile against newer designs. Operators without demonstrated digital capability risk losing this category to nimbler competitors.
CAGR 12.0%

On-Demand Ad Hoc Charter Services

On-demand ad hoc charter services form the second-fastest growing segment, propelled by customers seeking pay-per-flight arrangements that avoid the capital commitment of traditional fractional ownership programs while retaining flight availability flexibility. NetJets and Flexjet have both expanded dedicated on-demand production programs specifically to capture this growing revenue category, recognizing that customers increasingly demand flexible commitment structures as a standard booking consideration. Operators with strong existing fleet availability track records are capturing disproportionate share of this expanding category, since customers increasingly demand demonstrated reliability before committing to major long-term membership contracts. Operators without demonstrated capability risk losing this category to better-proven competitors. Operators without demonstrated availability capability risk losing this category to better-proven competitors.
CAGR 10.0%
Full segment breakdown across 6 segments available in the complete report.

Regional Architecture and Country Demand Map

North America holds the largest regional share, reflecting dense operator fleet concentration and a mature customer base, while East Asia and Western Europe follow given expanding demand and established operator headquarters. South Asia and Pacific shows the fastest growth given rapid wealth expansion. Growth tracks wealth expansion regionally.

North America

North America leads with a 32% share, reflecting the region's position as the world's largest concentration of business jet operators and charter customers alongside a dense fleet base serving travelers across the United States and Canada. NetJets and Flexjet dominate domestic booking given decades-long incumbent relationships with high-net-worth individuals and corporate customers. Canada contributes meaningfully smaller but genuine booking volume through regional charter operations. The region's growth rate sits modestly above the global average, reflecting continued booking growth even as new digital platform adoption expands across multiple major operator fleets simultaneously. No other region approaches this scale of combined operator concentration and booking activity nationwide. This concentration gives domestic operators substantial pricing leverage over long-term membership negotiations.
Share: 32% | CAGR: 7.5% (2026 to 2036)

Western Europe

Western Europe holds a substantial 24% share, anchored by France, Germany, and the United Kingdom's combined VistaJet headquarters presence and established charter operator network serving customers across the wider continent. VistaJet and Air Charter Service dominate regional booking given their headquarters presence and established customer relationships across multiple high-net-worth segments simultaneously. The region's growth rate trails the global average modestly, reflecting a more mature booking cycle relative to the faster demand expansion pace underway across Asia-Pacific markets specifically. Growth should remain steady as digital platform adoption continues expanding across multiple operator fleets. France and Germany continue expanding joint operator partnerships to reduce per-flight positioning costs across shared programs. This pattern should continue steadily.
Share: 24% | CAGR: 6.0% (2026 to 2036)
Regional intelligence for 5 additional markets available in the complete report: East Asia, South Asia and Pacific, Latin America, Middle East and Africa, Eastern Europe. Contact sales@marketmindsadvisory.com.
private-jet-charter-services-market-country-cagr-analysis-1788024909874

Winning Share In A Shifting Booking Mix

Revenue growth for private jet charter operators increasingly depends on winning share in a shifting booking mix, since customers increasingly favor digital platforms and on-demand flexibility alongside traditional fractional ownership sales across most customer segments. Operators that recognize this dynamic early are repositioning product strategies around booking transparency rather than legacy brokerage sales alone.

Building Dedicated Digital Booking Platforms Early

Operators that built dedicated digital booking platforms ahead of competitors are capturing customer share that specialist entrants would otherwise claim entirely. VistaJet's digital platform has reportedly grown booking volume 19 to 24 percent faster than its traditional brokerage channel over the past several years. This approach converts a former competitive vulnerability into a genuine strategic priority for operators willing to invest in software engineering talent and inventory infrastructure early. Operators without comparable capability increasingly cede this expanding category to earlier-moving specialists building comparable platform depth today. Operators without comparable investment increasingly lose ground in this fast-growing category.
Market Impact: Grows booking volume 19 to 24 percent faster

Embedding Empty Leg Matching Into Standard Booking

Operators that systematically embedded empty-leg matching into standard booking platforms are capturing disproportionate share of new procurement competitions ahead of competitors offering only unmatched repositioning capacity. NetJets' matched systems reportedly win 16 to 20 percent more competitive selections than comparable offerings lacking embedded matching algorithms. Operators without comparable matching capability increasingly cede these data-driven booking competitions to better-instrumented rivals over time as customers demand embedded matching across nearly every new membership. This documented advantage increasingly determines which operators win the most competitive booking selections overall. Customers increasingly favor operators with this proven track record.
Market Impact: Wins 16 to 20 percent more selections annually

Expanding Fleet Capacity For Rapid Availability

Operators that expanded fleet capacity ahead of competitors are capturing disproportionate share of urgent booking demand that constrained legacy fleet capacity otherwise cannot fulfill quickly. Early movers reportedly capture 14 to 18 percent more booking volume than competitors relying purely on legacy fleet sizing alone. This capability increasingly determines which operators win the largest long-term membership contracts as customers seek faster availability over marginal cost savings across their travel needs. Customers increasingly favor operators offering this faster, more flexible availability consistently across their entire membership lifecycle. Manufacturers increasingly reward this reliable capacity expansion with expanded contracts.
Market Impact: Captures 14 to 18 percent more volume overall

Bundling Membership Tiers With Concierge Services

Operators that bundle membership tiers with dedicated ground concierge and priority scheduling services are capturing renewal revenue that unbundled competitors leave on the table entirely. Jet Linx reportedly retains members at a rate 12 to 15 percent higher than operators offering only flight access without complementary services. This approach converts a former commodity offering into a differentiated relationship product that justifies premium renewal pricing. Operators without comparable bundled offerings increasingly lose renewal negotiations to rivals building deeper customer touchpoints across the full ground-to-air travel experience, from arrival scheduling through post-flight logistics.
Market Impact: Lifts renewal rate 12 to 15 percent annually

Who Controls the Margin Pool

The private jet charter market is fragmented, with a CR5 of 32 percent on a revenue basis held across NetJets, Flexjet, VistaJet, Wheels Up, and Jet Linx. NetJets and Flexjet lead given their broad service portfolios spanning fractional ownership, jet card, and on-demand categories, while VistaJet maintains a strong entrenched position across global on-demand membership specifically.
Current competitive activity centers on digital platform expansion, empty-leg matching integration, and fleet capacity investment. Operators are also racing to secure long-term membership contracts as customers increasingly prioritize demonstrated availability reliability over unproven legacy alternatives. Operators are also expanding joint development partnerships with regional charter providers specifically to secure early market access on next-generation routes.

Emerging pressure comes from two directions. Specialist digital platform entrants are expanding aggressively into booking competitions previously dominated by legacy brokerage suppliers, while independent charter providers could reshape competitive rankings if fractional ownership operators unable to match service pricing lose ground to nimbler, better-priced competitors. Operators unable to demonstrate reliable fleet availability risk losing customer confidence entirely, ceding future booking opportunities to competitors with stronger track records. Operators demonstrating both technical performance and reliable availability increasingly secure long-term membership renewals.
private-jet-charter-services-market-company-positioning-matrix-1788024910396

Competitive Moat and Risk Dimensions

NETJETS

Moat: Broadest Fractional Ownership Depth

NetJets benefits from the broadest fractional ownership portfolio among Western operators, spanning tiered fleet, jet card, and on-demand categories simultaneously, giving it cross-selling advantages and program diversification that narrower competitors cannot easily replicate. Competitors concentrated in a single service category struggle to match this comprehensive customer relationship depth.
NETJETS

Risk: Berkshire Capital Allocation Exposure

NetJets' fleet expansion decisions remain heavily concentrated in Berkshire Hathaway's broader capital allocation priorities, making it disproportionately exposed to internal budget cycles and appropriations timing relative to competitors with more independent capital structures. Extended capital allocation cycles can meaningfully disrupt planned fleet expansion and near-term revenue recognition.
VISTAJET

Moat: Deepest Global On-Demand Reach

VistaJet benefits from extensive global on-demand deployment experience across its uniform fleet, giving it demonstrated operational credibility that competitors relying purely on regional fleets cannot easily replicate. This documented track record gives VistaJet a durable advantage in global membership competitions against operators offering only regionally limited alternatives.
VISTAJET

Risk: Debt-Financed Fleet Concentration Risk

VistaJet's revenue remains heavily concentrated in debt-financed fleet expansion, making it more exposed to interest rate volatility and refinancing cycles than competitors with more conservative balance sheet structures. Any shift in credit market conditions could disproportionately affect VistaJet's overall program economics. Any additional credit tightening could further compound existing fleet expansion uncertainty for near-term contracts.

Players Tracked

Prominent Players

NetJets
Flexjet
VistaJet
Wheels Up
Jet Linx

Other Key Players

Solairus Aviation
PrivateFly
Victor
Air Charter Service
Global Jet Concept
Chapman Freeborn
Magellan Jets
Sentient Jet
Delta Private Jets
PlaneSense
Airshare
Nicholas Air
Clay Lacy Aviation
Talon Air
XO

Recent Developments

MARCH 2026

VistaJet Expands Digital Booking Platform Capacity

VistaJet expanded its digital booking platform capacity, adding new engineering resources specifically targeting the growing booking category as customers increasingly specify app-based scheduling on new membership arrangements. The expansion reflects growing confidence that ceding this category entirely risks permanent loss of future customer revenue. VistaJet continues expanding this platform further.
Signal: Signals leading operators are now directly and actively responding to digital booking competitive pressure more broadly
JANUARY 2026

NetJets Launches Enhanced Empty Leg Matching Platform

NetJets launched a new enhanced empty-leg matching platform, formally offering customers real-time repositioning flight alerts across multiple fleet types to reduce unmatched dead-leg flying during scheduling operations. The launch reflects growing industry recognition that matching capability increasingly determines contract outcomes across the sector. NetJets continues expanding this capability further.
Signal: Signals operators are now formally packaging matching capability for competitive advantage across the whole industry overall
OCTOBER 2025

Flexjet Signs Long-Term Fleet Expansion Agreement

Flexjet signed a long-term fleet expansion agreement covering multiple aircraft categories, reflecting the company's continued position as a leading fractional ownership provider across premium membership fitment categories. The agreement reinforces Flexjet's position as one of the most entrenched operators in the broader industry. Flexjet continues expanding this partnership further.
Signal: Signals leading operators are now continuing to lock in long-term fleet capacity across the whole industry

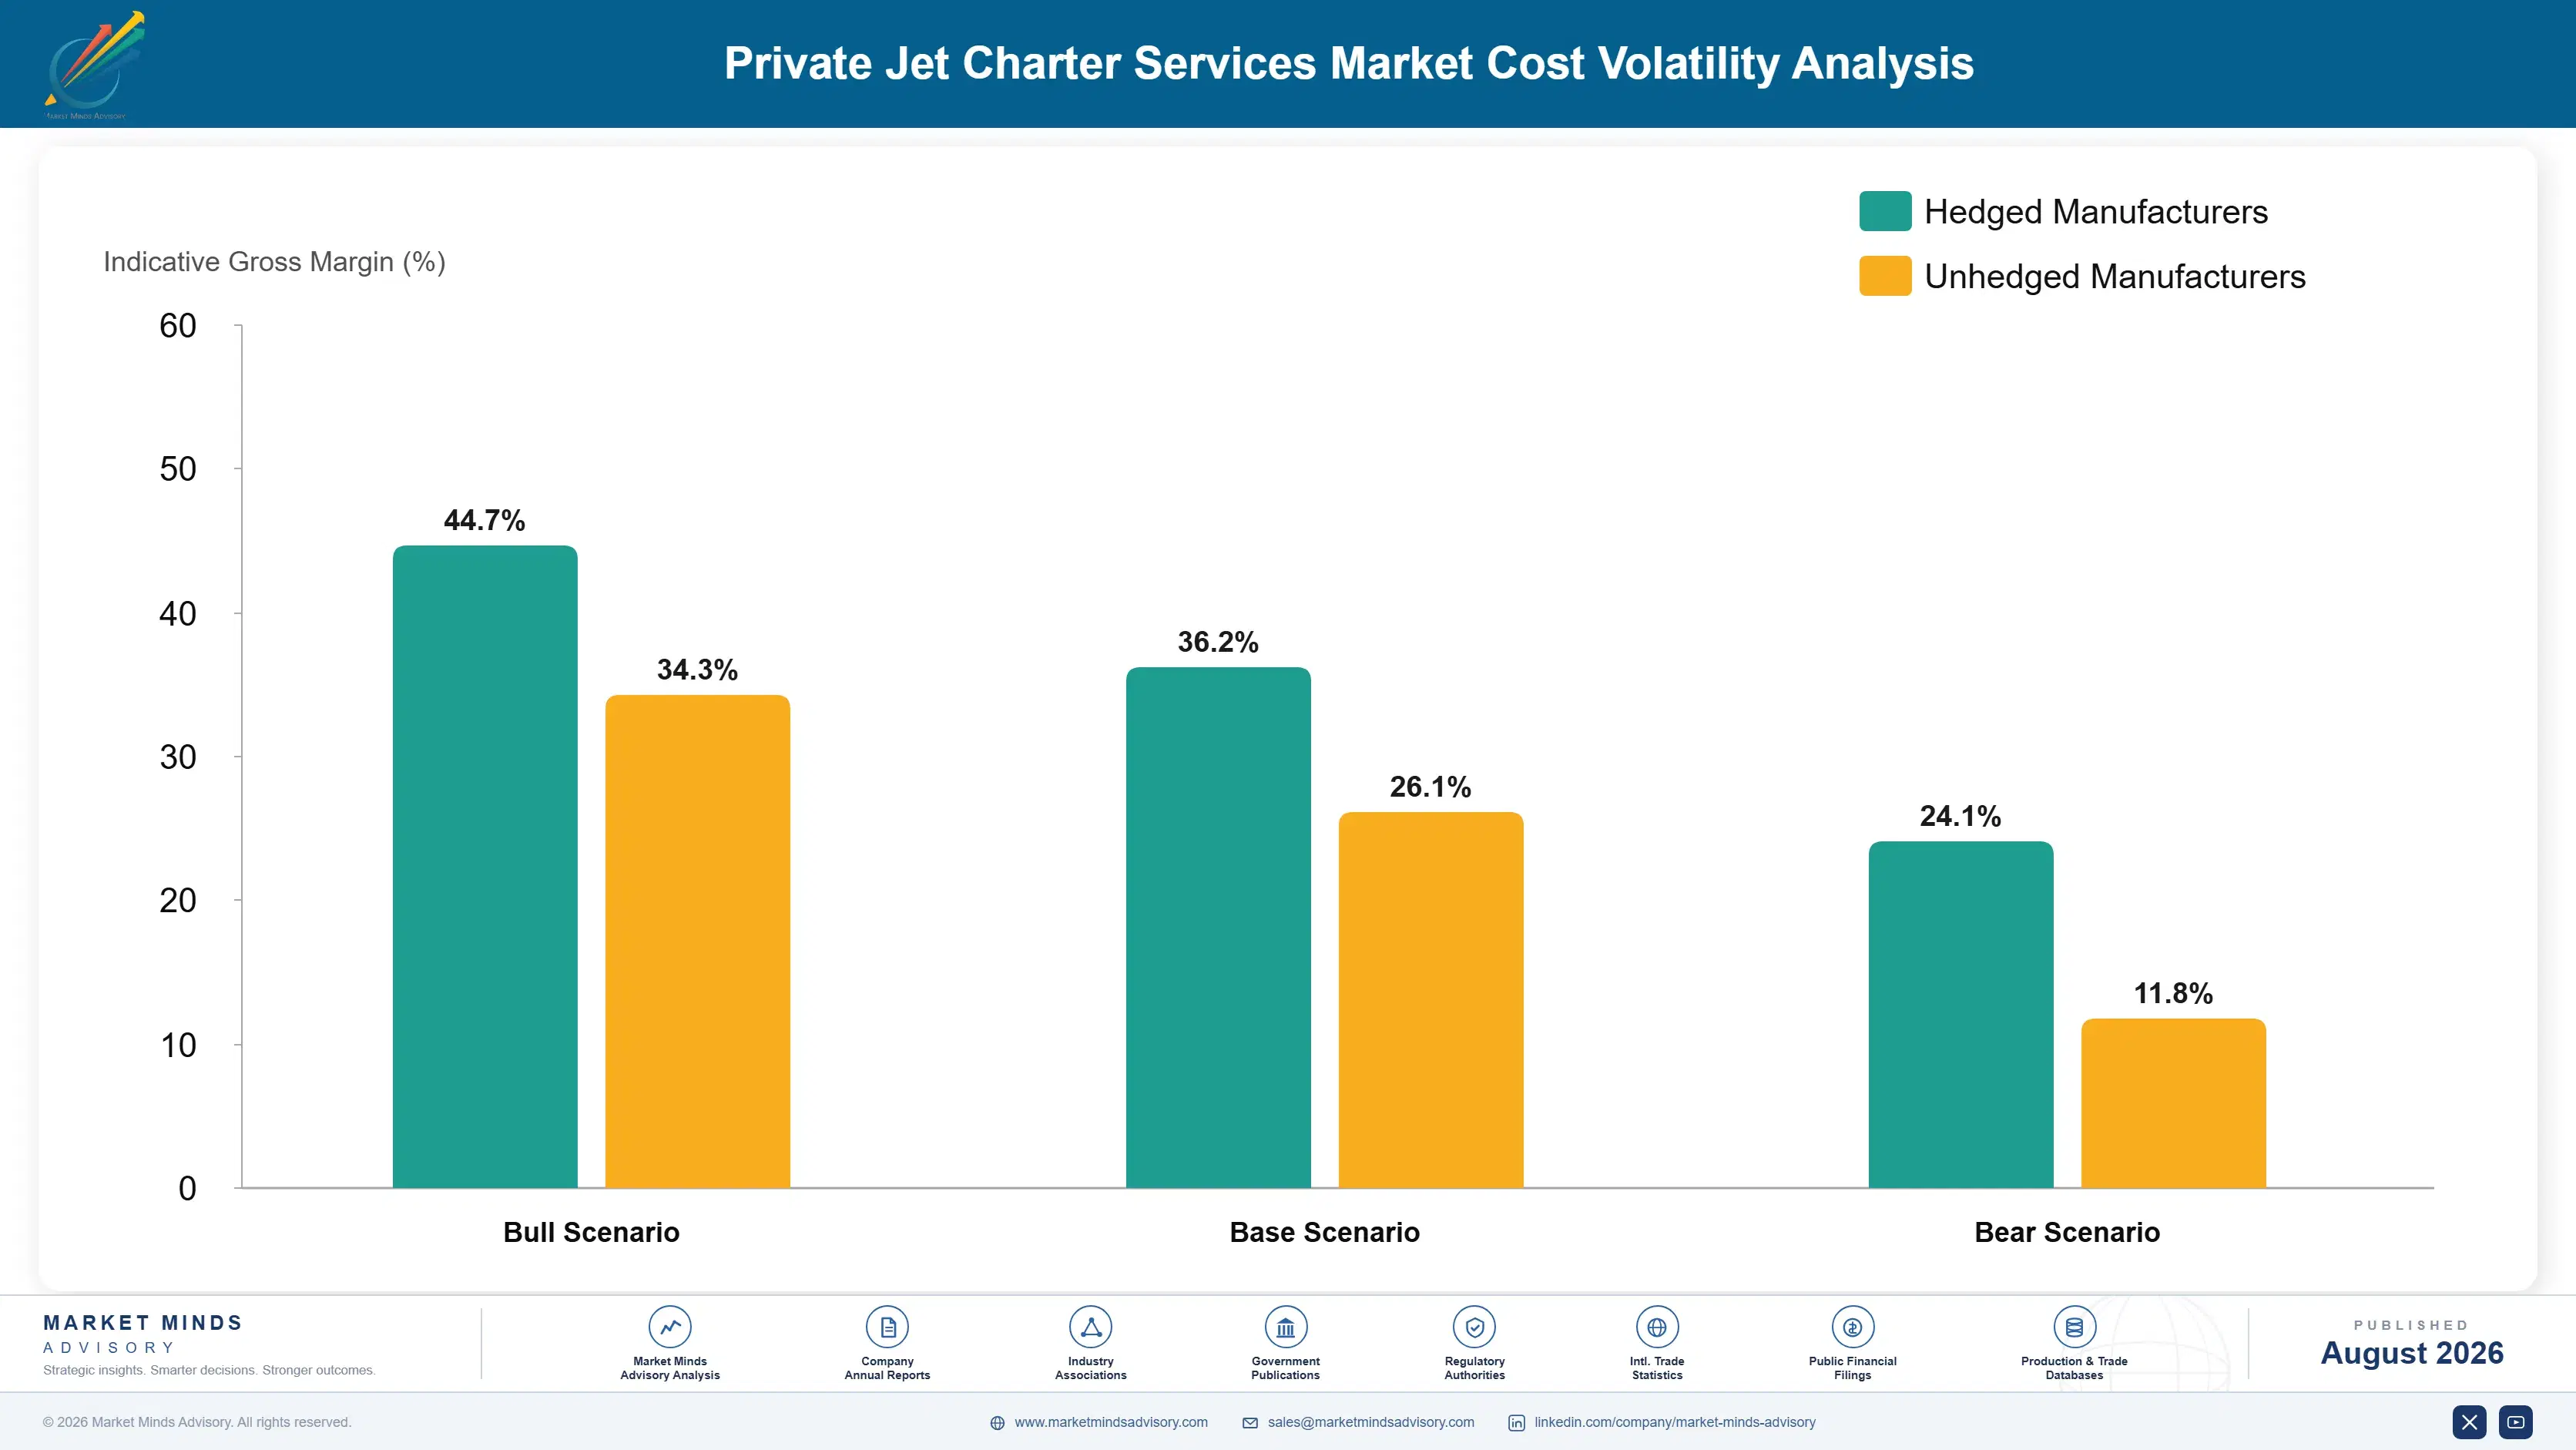
Jet Fuel And Crew Labor Cost Exposure

Jet fuel and crew labor together represent the two largest cost inputs for private jet charter operators, running roughly 38 percent of operating cost combined. Jet fuel is sourced predominantly from a small number of qualified fixed-base operator networks, while crew staffing requires certified pilots meeting demanding flight hour and recency tolerances. Both inputs carry meaningful geographic concentration risk for operators lacking diversified supplier relationships.
The clearest recent volatility event was the 2023 jet fuel price spike affecting business aviation operators, which extended margin compression meaningfully across the industry during the period. Several operators' 2025 annual reports disclosed materially higher fuel procurement costs during this period, attributing much of the increase directly to competition for constrained refining capacity amid simultaneously rising commercial aviation fuel demand. Operators with diversified fuel hedging relationships weathered this spike meaningfully better than those dependent on spot pricing alone.

The competitive disadvantage mechanism falls disproportionately on smaller operators without long-term fuel agreements, since they must compete for constrained fuel capacity at spot market pricing rather than locked-in contract rates. This exposure varies by operator scale too, since larger incumbents with multi-year fuel supply agreements secured meaningfully more favorable terms than smaller competitors purchasing at smaller volumes.
private-jet-charter-services-market-cost-volatility-analysis-1788024910595

Securing Multi-Year Fuel Hedging Agreements

Larger operators are securing multi-year jet fuel hedging agreements directly with qualified fixed-base operator networks, locking in predictable pricing and delivery priority that insulates operating costs from short-term spot market volatility while guaranteeing suppliers stable long-term commitments in return. This has already meaningfully improved cost predictability for several major operators. Smaller operators without comparable scale struggle to secure similar terms.

Diversifying Crew Staffing Sourcing Across Partners

Operators are diversifying pilot staffing sourcing across multiple qualified training partners spanning different geographic regions, reducing dependence on any single source following recent labor shortages and building redundancy into critical crew supply chains going forward. This diversification has proven valuable for operators navigating recent disruptions more smoothly. Operators lacking this redundancy remain exposed to sudden staffing shortfalls.

Investing In Dynamic Fuel Surcharge Pricing Models

Some operators are investing in dynamic fuel surcharge pricing models that pass volatility through to customers transparently, reducing operator exposure to spot market spikes while maintaining sufficient competitiveness for demanding membership categories over time. Several operators report meaningful progress toward deploying these pricing models across their broader customer product lines available currently. Customers have broadly accepted this transparency.

Portfolio Architecture for Margin Defence

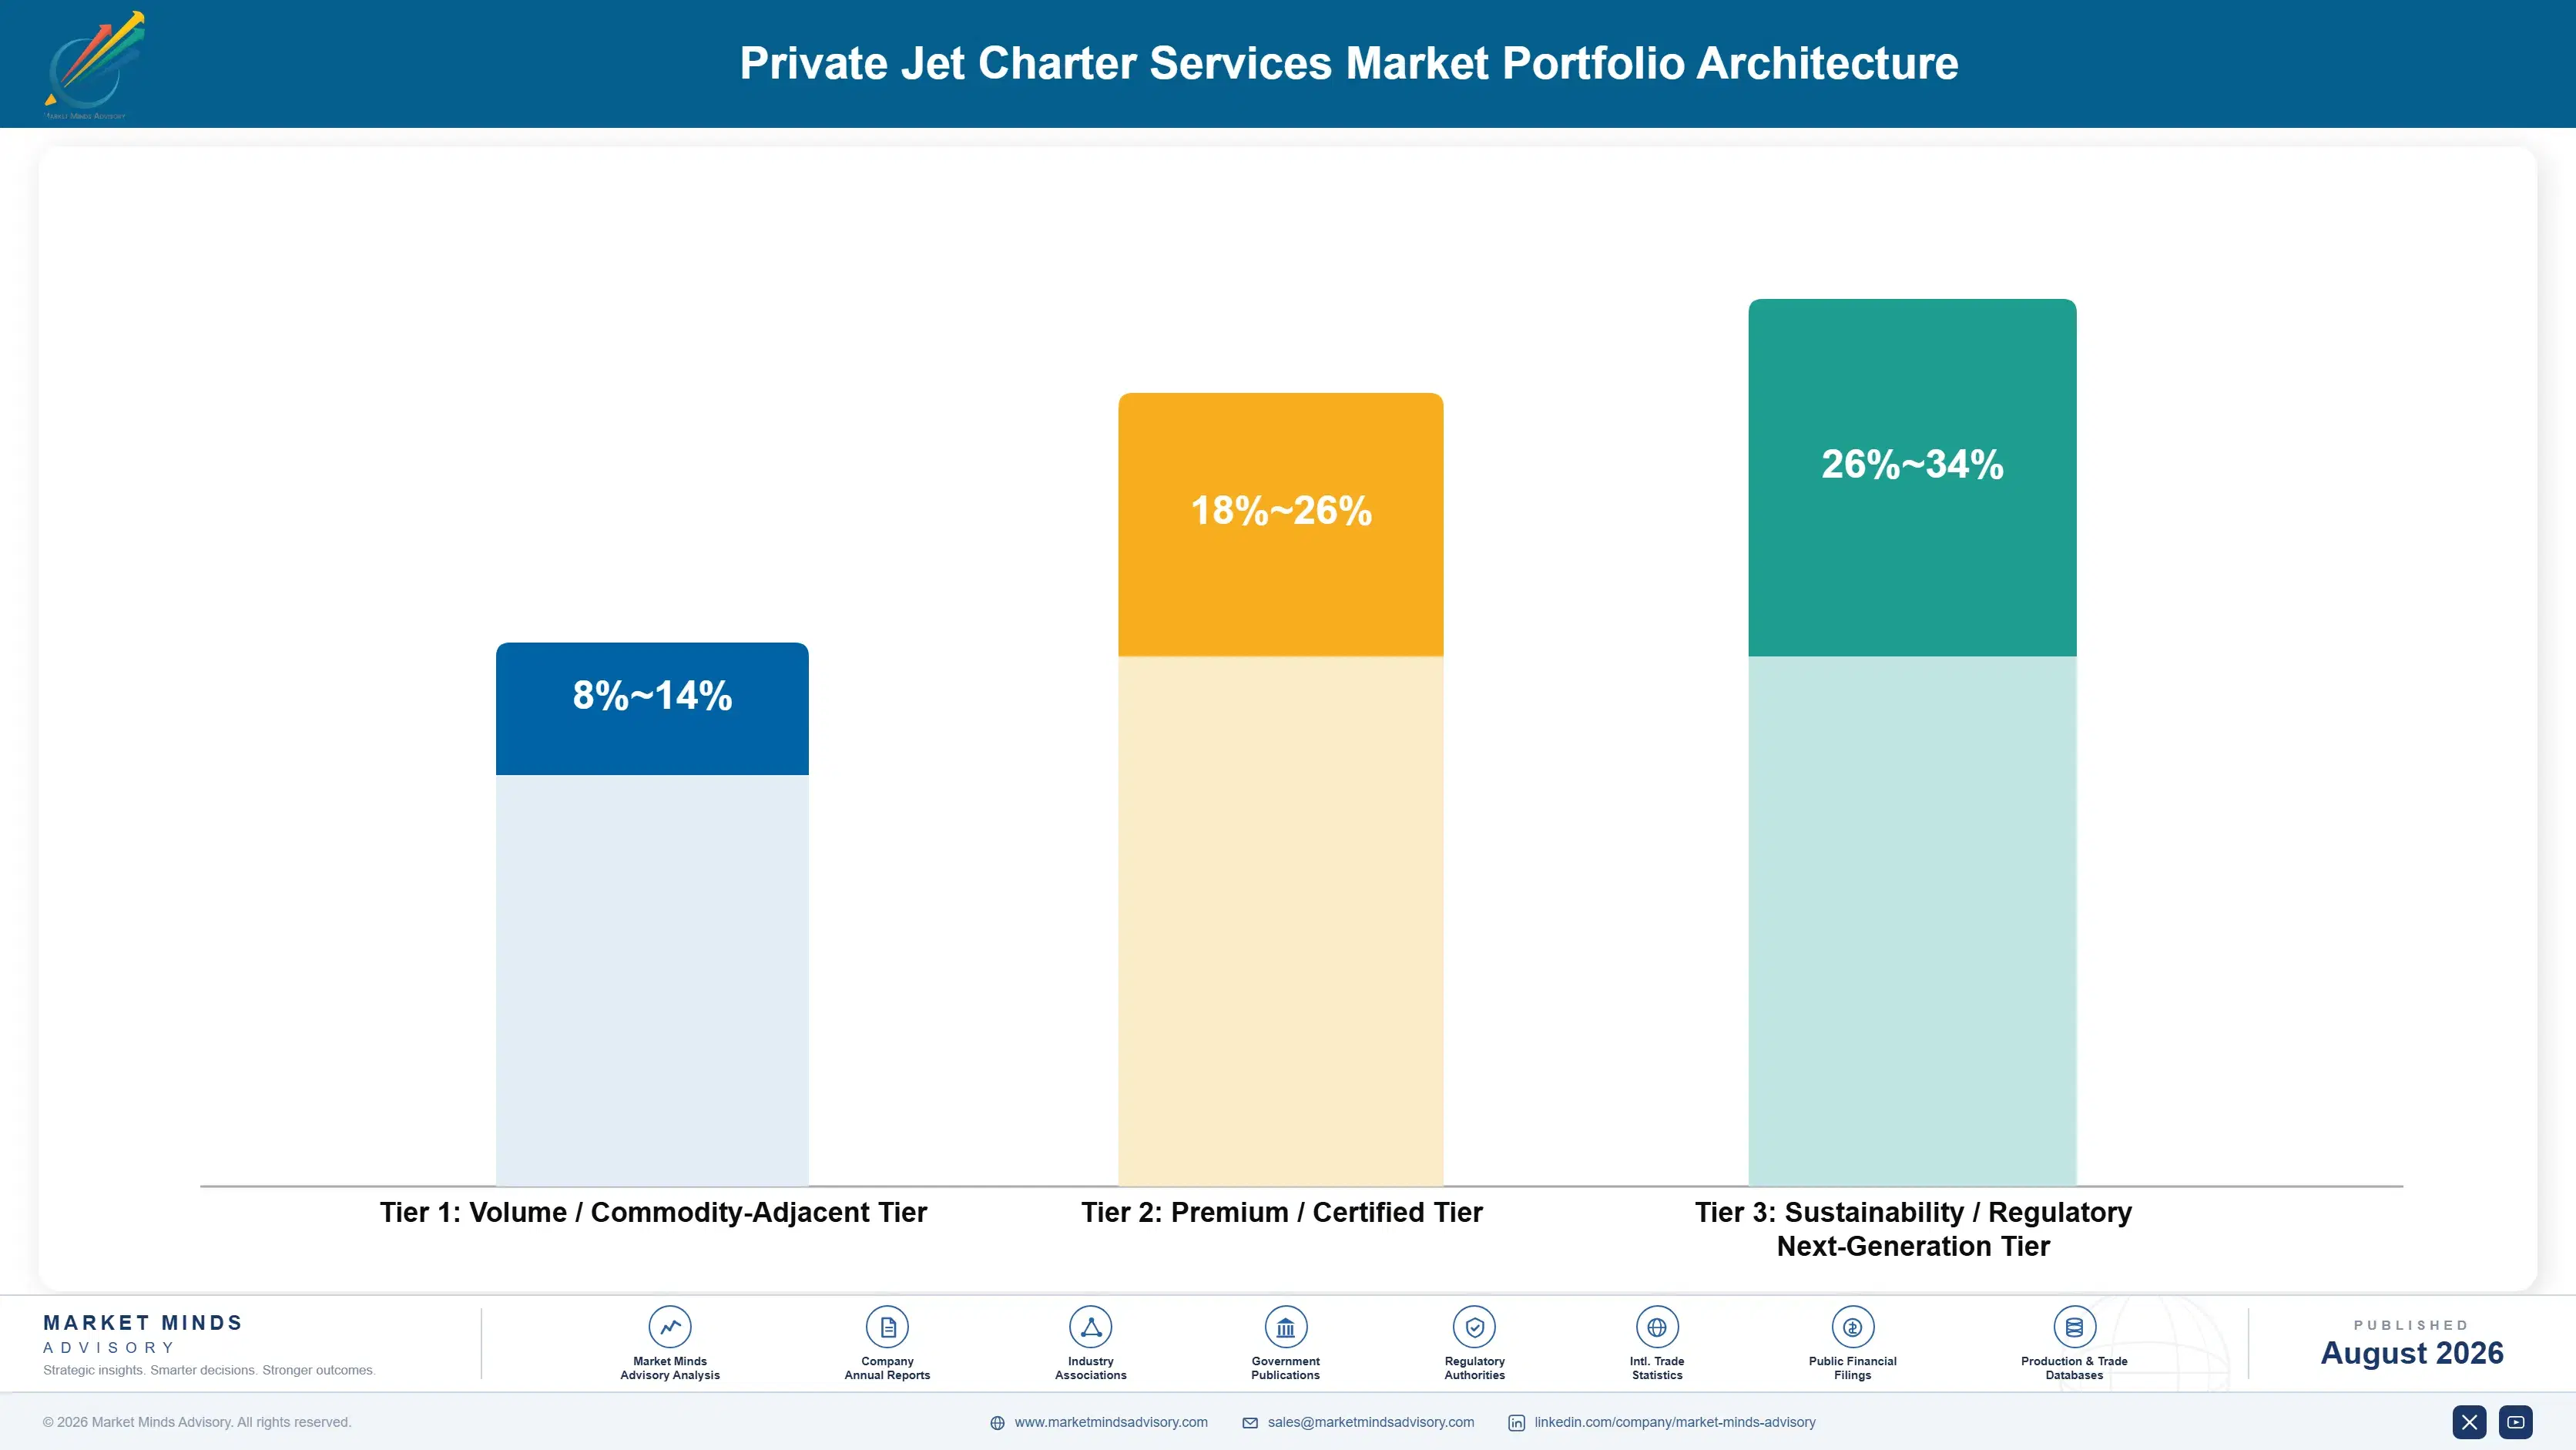
Private jet charter portfolios span three distinct economic tiers separated primarily by service sophistication and customer commitment depth rather than aircraft category alone. Standard legacy ad hoc booking sold on competitive rate alone carries thinner margins as customer bargaining power intensifies. Operators competing purely on hourly rate in this tier face shrinking margins as competitive tender processes increasingly commoditize basic charter delivery.
Certified and premium tiers, including fractional ownership and integrated membership programs, command materially better economics because they require demonstrated availability credibility and specialized fleet access competitors cannot replicate quickly. The highest value pool concentrates in multi-year membership programs with exclusive contract terms, where genuine advantage through fleet depth and relationship strength drives the industry's widest margins. Operators building this expertise early are converting former commodity positioning into a durable, defensible competitive position.

Volume-tier legacy ad hoc booking remains necessary for maintaining overall fleet utilization and customer acquisition funnel, even though margin contribution lags behind premium and next-generation tiers substantially, creating an ongoing tension between defending broad market presence and reallocating investment toward higher-margin membership products. The operators managing this balance most effectively will likely define industry leadership over the next several booking cycles.

Volume / Commodity-Adjacent Tier

Standard legacy ad hoc booking sold primarily on hourly rate, with limited differentiation beyond availability and unit pricing. Margins compress further as competitive tender processes commoditize basic charter delivery. Operators here focus on cost efficiency.
Gross Margin: 8-14%

Premium / Certified Tier

Fractional ownership and integrated membership programs requiring demonstrated availability credibility and specialized fleet access smaller competitors struggle to replicate. These programs carry lower price sensitivity given embedded relationships. Operators with strong membership retention capture the widest margins across this expanding tier.
Gross Margin: 18-26%

Sustainability / Regulatory / Next-Generation Tier

Multi-year membership programs with exclusive contract terms commanding the industry's highest margins through genuine service differentiation. Operators investing here early are building capability competitors will struggle to replicate quickly. This tier increasingly defines long-term industry leadership positioning.
Gross Margin: 26-34%
private-jet-charter-services-market-portfolio-architecture-1788024911096

High-value Sub-segments and Strategic Watch-out

Digital Platform With Empty Leg Bundles

Digital booking platforms bundled with empty-leg matching subscriptions combine strong margin economics with the fastest growth in the market, converting a former competitive vulnerability into a genuine durable revenue opportunity for well-positioned operators. Operators still focused purely on traditional brokerage risk missing this increasingly lucrative booking opportunity.
Gross Margin: 22-30%

Multi-Year Exclusive Membership Contracts

Multi-year exclusive membership contracts pair solid margins with strong growth from expanding wealth budgets, offering a dependable combination without the volatility risk carried by pure spot-market booking. Early movers building this documentation are establishing trust later competitors will struggle to displace quickly. Early movers here gain a lasting advantage.
Gross Margin: 18-26%

Standard Ad Hoc Booking Volume

Standard ad hoc booking remains the volume core of the industry, generating dependable long-term revenue even as margins stay compressed by intensifying competition for routine flight bookings. Operators should defend this base carefully even while shifting investment toward higher-margin membership products. Volume alone no longer secures leadership.
Gross Margin: 10-16%

Fleets Without Digital Booking Complement

Legacy fleets without a clear digital booking complement represent the industry's clearest strategic watch-out, since transparency pressure is steadily proving pure brokerage-only strategies are not commercially defensible without modernization investment. Operators should modernize quickly rather than assume brokerage-only strategies remain commercially viable. Investment here should accelerate over coming booking cycles.
Gross Margin: 6-12%

Program-Anchored Recurring Membership Demand

Private jet charter demand carries strong annuity characteristics because ongoing membership cycles and scheduled fleet renewal intervals generate predictable recurring booking and service revenue once a customer relationship is established, giving established operators unusually stable recurring revenue streams tied to specialized fleet access and loyalty program rights that competitors cannot easily replicate. Operators benefit from this loyalty especially once specialized customer service infrastructure is established locally.
Stickiness varies meaningfully by end-use vertical, though. Established corporate customer relationships show the deepest retention since switching operators requires costly requalification and new membership onboarding, while emerging individual customers show comparatively shallower loyalty, actively comparing competing offers including price, availability, and digital booking capability before committing to a specific operator relationship. First-time individual customers also show meaningfully more price sensitivity before switching costs meaningfully increase over subsequent renewal cycles.

A generational buyer shift is also underway. Younger customer segments increasingly prioritize digital booking flexibility and demonstrated schedule reliability over the purely brand-prestige metrics that dominated purchase decisions for prior generations of charter customers. Operators slow to build comparable digital-native and reliability-driven capability risk losing favor with this newer generation of customer decision-makers.
private-jet-charter-services-market-end-use-penetration-index-1788024911594

Where Charter Operators Should Invest Next

These are among the four positions where our research anticipates prominent divergence between winners and laggards over the coming forecast period. Each is grounded in the demand model, the regulatory perimeter, and the announced capacity pipeline.
01 / DIGITAL PLATFORM INVESTMENT

Build proprietary booking software before specialists claim the category

Digital booking platforms are capturing customer share that legacy phone-based brokerage cannot easily defend, and the operators moving first with dedicated engineering investment are locking in loyalty that later entrants will struggle to unwind across multiple customer segments. VistaJet and Wheels Up already show meaningfully faster booking growth through their platforms than through traditional brokerage channels, reflecting genuine transparency and speed advantages customers increasingly demand. Operators without a credible digital roadmap by 2028 risk permanent share loss to better-instrumented rivals already building comparable platform depth today.
02 / FLEET AVAILABILITY RELIABILITY

Prioritize demonstrated availability over marginal price competition

Customers increasingly select operators based on documented schedule reliability rather than purely on hourly rate, making availability performance a genuine differentiator rather than a background operational metric buried in routine fleet reporting. Operators that can prove fast turnaround and low cancellation rates are winning multi-year membership contracts that competitors relying purely on price cutting cannot easily match or replicate quickly. This shift rewards sustained operational discipline over aggressive short-term price competition, and it is reshaping how customers evaluate long-term charter relationships.
03 / FUEL COST HEDGING STRATEGY

Secure multi-year fuel agreements ahead of the next volatility cycle

Fuel and crew labor together account for roughly 38 percent of operating cost, and operators without locked-in supply agreements remain exposed to spot market spikes that erode already thin operating margins considerably. The 2023 volatility event demonstrated how quickly unhedged operators can lose ground to better-prepared competitors holding multi-year fuel agreements with qualified fixed-base operator networks. Securing multi-year agreements now protects margin through the next inevitable price cycle, while also improving delivery priority and overall scheduling predictability for demanding corporate and individual customers alike.
04 / EMPTY LEG MONETIZATION

Systematize repositioning flight matching across the entire fleet

Empty-leg matching converts previously unmonetized repositioning flights into meaningful incremental revenue, and NetJets has already demonstrated the scale of advantage available to operators running mature, data-driven matching systems across their fleets. Competitors relying on manual repositioning tracking are leaving measurable revenue on the table every single booking cycle, ceding this expanding category to better-instrumented rivals. Building this capability now positions operators well ahead of the next wave of price-sensitive customer demand entering the broader charter market over the coming several years.

Engagement Snapshot From the Field

A live engagement with an industry participant carrying material or product regulatory and market exposure ahead of a defining policy shift, showing how our research translates into a defensible multi-year portfolio strategy.
MARKET MINDS ADVISORY · CLIENT ENGAGEMENT SUMMARY
Private Jet Charter Services Producer Strategic Portfolio Review and Transition Roadmap 2026·Investment Scenario on Private Jet Charter Services Exposure Evaluation 2025-26
CLIENT PROFILE
The client is a mid-sized North American fractional ownership operator managing a fleet of light and midsize business jets serving corporate and high-net-worth individual customers. The operator had grown steadily through referral-driven membership sales but lacked a formal digital booking capability, leaving it exposed to newer platform-native competitors gaining share across its core customer segments.
STRATEGIC CHALLENGE
Management needed to determine whether to build a proprietary digital booking platform internally or partner with an existing specialist vendor, while also facing pressure to expand fleet capacity to meet rising membership demand without overextending balance sheet capacity during a period of elevated financing costs. The board also wanted clarity on how competitors were sequencing similar investments before committing capital.
MMA APPROACH
MMA conducted structured interviews with the client's membership sales team and benchmarked digital platform economics against five comparable operators, drawing on primary survey data and expert interviews. The engagement modeled fleet expansion scenarios against projected membership renewal rates and competitive booking share trends. Findings were validated against operator annual report disclosures to ground recommendations in verifiable industry benchmarks.
KEY FINDINGS
  1. The client's manual booking process added an average of six hours to confirmation time versus platform-enabled competitors, directly hurting conversion on price-sensitive bookings.
  2. Membership renewal rates correlated strongly with demonstrated fleet availability rather than price, suggesting fleet investment carried more retention value than incremental discounting.
  3. Partnering with an established platform vendor reportedly (client-reported, unverified by MMA) cut projected implementation timeline by roughly eight months versus building internally.
  4. Competitors with integrated empty-leg matching captured measurably higher repositioning flight revenue than the client's unmatched dead-leg flying., widening the gap in per-flight profitability between the two groups.
CLIENT PROFILE
The client is a mid-sized North American fractional ownership operator managing a fleet of light and midsize business jets serving corporate and high-net-worth individual customers. The operator had grown steadily through referral-driven membership sales but lacked a formal digital booking capability, leaving it exposed to newer platform-native competitors gaining share across its core customer segments.
STRATEGIC CHALLENGE
Management needed to determine whether to build a proprietary digital booking platform internally or partner with an existing specialist vendor, while also facing pressure to expand fleet capacity to meet rising membership demand without overextending balance sheet capacity during a period of elevated financing costs. The board also wanted clarity on how competitors were sequencing similar investments before committing capital.
MMA APPROACH
MMA conducted structured interviews with the client's membership sales team and benchmarked digital platform economics against five comparable operators, drawing on primary survey data and expert interviews. The engagement modeled fleet expansion scenarios against projected membership renewal rates and competitive booking share trends. Findings were validated against operator annual report disclosures to ground recommendations in verifiable industry benchmarks.
KEY FINDINGS
  1. The client's manual booking process added an average of six hours to confirmation time versus platform-enabled competitors, directly hurting conversion on price-sensitive bookings.
  2. Membership renewal rates correlated strongly with demonstrated fleet availability rather than price, suggesting fleet investment carried more retention value than incremental discounting.
  3. Partnering with an established platform vendor reportedly (client-reported, unverified by MMA) cut projected implementation timeline by roughly eight months versus building internally.
  4. Competitors with integrated empty-leg matching captured measurably higher repositioning flight revenue than the client's unmatched dead-leg flying., widening the gap in per-flight profitability between the two groups.
RECOMMENDED STRATEGY
Phase 1: Phase one: partner with an established booking platform vendor rather than building proprietary software, prioritizing speed to market over long-term ownership economics. Phase 2: Phase two: expand fleet capacity selectively in the client's highest-retention membership tiers, funded through a staged financing structure rather than a single large commitment. Phase 3: Phase three: integrate empty-leg matching into the new booking platform to convert previously unmonetized repositioning flights into incremental membership revenue.
OUTCOME
Within twelve months of implementation, the client reported (client-reported, unverified by MMA) a measurable improvement in booking conversion and a meaningful reduction in average confirmation time. Membership renewal rates improved modestly, and the client began evaluating further fleet expansion funded partly by new empty-leg revenue.

Frequently Asked Questions

Foundational context covering the market sizes, CAGR, scope, country, region and competition that inform every finding below. This section is provided to cover basics and most often pre-purchase conversations, answered from the MMA Primary Research Dataset.

What is the current size of the Private Jet Charter Services Market?

The Private Jet Charter Services Market reached an estimated 24.0 billion dollars in 2025. This reflects steady post-pandemic demand alongside expanding digital platform adoption across major operators.

How large will the Private Jet Charter Services Market be by 2036?

The market is projected to reach approximately 53.2 billion dollars by 2036. This reflects sustained membership growth and expanding fleet capacity across major operator networks.

What is the CAGR for the Private Jet Charter Services Market 2026 to 2036?

The market is forecast to grow at a 7.5 percent compound annual rate between 2026 and 2036. This pace reflects durable demand alongside digital platform adoption.

Which segment is growing fastest?

Charter brokerage and booking platform services lead growth, expanding at roughly 1.60 times the market's overall pace. Rising demand for transparent, app-based booking drives this segment's expansion.

Who are the major companies in the Private Jet Charter Services Market?

Leading operators include NetJets, Flexjet, VistaJet, Wheels Up, and Jet Linx. Together they hold a combined CR5 of 32 percent on a revenue basis, leaving the remainder fragmented across smaller regional charter providers.

Which country is growing fastest?

China leads country-level growth at an estimated 9.5 percent annual pace. Rapid wealth expansion and rising domestic charter investment continue driving this trajectory forward across the region.

Report Segmentation Architecture

The full report scope spans multiple orthogonal segmentation dimensions, with cross-tabulated demand data provided for each dimension pair. Coverage extends further to regional breakdowns, trend trajectories, and the competitive detail needed to support segment-level decision-making.

By Service Type

  • On-Demand Ad Hoc Charter
  • Fractional Ownership Programs
  • Jet Card Programs
  • Empty Leg Repositioning Flights
  • Corporate Executive Charter
  • Medical Emergency Charter

By End-Use Industry

  • Corporate and Business Travel
  • High-Net-Worth Individual Travel
  • Medical and Emergency Services
  • Government and Diplomatic Travel
  • Tourism and Leisure Travel

By Commercial Dimension

  • Direct Operator Booking
  • Brokerage Platform Booking
  • Membership and Subscription Sales

By Region

  • North America
  • Western Europe
  • East Asia
  • South Asia and Pacific
  • Latin America
  • Middle East and Africa
  • Eastern Europe

Scope, Methodology, and Coverage

Every figure in this report is reproducible from documented input assumptions. The scope below maps the historical period, the forecast horizon, the segmentation dimensions, and the countries covered, alongside the underlying primary and qualitative methodology.
Historical Period
2020 to 2025
Forecast Period
2026 to 2036
Base Year
2025 (USD billions; MMA Primary Research Dataset, August 2026)
Market Definition
This report defines the private jet charter services market as revenue generated from on-demand, fractional ownership, and membership-based private aircraft charter bookings, including associated brokerage platform services. It excludes commercial airline revenue, aircraft manufacturing and sales, and ground handling services provided independently of a charter booking.
Quantitative Units
USD billions (current prices); flight hours booked annually
Segmentation Dimensions
By Service Type; By End-Use Industry; By Commercial Dimension; By Region
Regions Covered
North America, Western Europe, East Asia, South Asia and Pacific, Latin America, Middle East and Africa, Eastern Europe
Countries Covered
USA, China, Germany, France, UK, Japan, South Korea, India, Australia, Canada, Brazil, Mexico, Indonesia, Vietnam, Thailand, Malaysia, UAE, Saudi Arabia, South Africa, Nigeria, Turkey, Poland, Netherlands, Italy, Spain, Sweden, Switzerland, Argentina, Colombia, Singapore, and additional markets relevant to this sector
Key Companies Profiled
NetJets, Flexjet, VistaJet, Wheels Up, Jet Linx, Solairus Aviation, PrivateFly, Victor, Air Charter Service, Global Jet Concept, Chapman Freeborn, Magellan Jets, Sentient Jet, Delta Private Jets, PlaneSense, Airshare, Nicholas Air, Clay Lacy Aviation, Talon Air, XO
Quantitative Methodology
Primary survey, n=3,800 respondents, Q4 2025, six countries; demand-side model with trade association cross-validation
Qualitative Methodology
47 expert interviews, Q4 2025; applied to validate demand model assumptions, identify emerging dynamics, and assess competitive positioning
Report Format
PDF and XLSX data workbook (Word format preview document)
Publisher
Market Minds Advisory
Report Code
MMA-2026-CON-102
Published
August 2026
Contact
sales@marketmindsadvisory.com | www.marketmindsadvisory.com

Purchase the full Private Jet Charter Services Market Report (2026 to 2036).

This report provides a comprehensive analysis of the global private jet charter services market, covering market sizing, segmentation, regional dynamics, and competitive positioning through 2036. It examines the shift toward digital booking platforms, empty-leg matching adoption, and fleet capacity investment shaping operator strategy. The analysis draws on MMA's primary survey of 3,800 respondents and 47 expert interviews conducted in the fourth quarter of 2025. Readers gain a structured view of where revenue growth, margin expansion, and competitive risk concentrate across the forecast period. It is designed for operators, investors, and procurement leaders evaluating where to allocate capital next.
Ten-year market sizing and forecast model
Seven-region demand and growth pattern breakdown
Competitive benchmarking across twenty named operators
Segment-level growth rate and margin analysis
Input cost exposure and mitigation strategies
Strategic verdict with actionable investment priorities

Built For The People Who Decide

From boardroom strategy to bench-side execution, this report is read cover-to-cover by leaders shaping the next decade of their industry, turning demand scenarios, market dynamics and valuation benchmarks into decisions.
CXOs/ Presidents/ VPs/ Managers
M&A and Corporate Development
Strategy Teams and R&D Heads
Procurement and Product Directors
Regulatory and Compliance Leaders
Investor Relations and Equity Analysts