Market Minds Advisory
Private Credit Market

Private Credit Market: Bank Retreat and the Institutional Capital Shift

Insurance capital is flooding into private credit through asset manager tie-ups just as banks keep retreating from leveraged lending under tighter capital rules, leaving middle-market borrowers increasingly dependent on lenders operating outside traditional banking oversight.

Lead Analyst

Published

September 2026

Make Smarter Decisions with Customized Research Insights

Request a free sample report and evaluate market opportunities, growth trends, and competitive dynamics relevant to your business needs.

2025 MARKET VALUE$1720MMarket Size 2025
2036 FORECAST VALUE$5107MBase Case , 2026 to 2036
CAGR 2026 TO 203610.4 %Bull 11.7% / Bear 9.1%
INCREMENTAL OPPORTUNITY$3208MNet 10- year value creation
EXPANSION MULTIPLE2.69x2036 value over 2026 base
Strategic Levers
M&A Pipeline
Regional Outlook
Country Rankings
Competitive Intelligence
Segmental Deep-dive
Call-Us : 91 93563 13602

Executive Snapshot and Market Trajectory

Private credit is absorbing lending activity banks no longer want to hold on their balance sheets. Insurance capital keeps flowing into the asset class through asset manager acquisitions, banks keep retreating from leveraged lending under tighter capital rules, and middle-market borrowers depend on lenders operating outside traditional banking oversight.
Asset-based and specialty finance leads growth at 14.2% annually, nearly 1.4 times the market average, as private lenders expand beyond corporate direct lending into consumer and asset-backed structures banks are exiting. Direct lending follows closely on continued middle-market demand. North America holds the largest regional share at 38%, reflecting the concentration of the largest alternative asset managers and the deepest institutional capital pools anywhere in the world.
Competitive intensity concentrates around origination relationships and underwriting discipline rather than fund size alone, since sourcing proprietary deal flow and managing credit risk through a full cycle separate disciplined lenders from capital deployment machines. Blackstone and Apollo command scale and permanent capital advantages, but specialist lenders like Golub Capital and Antares hold middle-market relationship depth that diversified giants have not matched, keeping the fastest-growing specialty segments contested despite consolidation pressure across the asset management industry.
Market Definition
The private credit market covers non-bank lending to companies and asset owners structured and held outside public debt markets, including direct lending, mezzanine and subordinated debt, distressed debt, venture debt, asset-based and specialty finance, and real estate private credit, measured by assets under management deployed globally. It excludes publicly traded and syndicated bank loans, public high-yield bonds, traditional bank balance sheet lending, and private equity investment that does not take the form of debt.
Base Year Value
$1720M in 2025 (MMA Primary Research Dataset, August 2026)
Forecast Period
2026 to 2036, eleven discrete annual values
CAGR
10.4% base case. Bull 11.7%. Bear 9.1%.
Fastest Growth Segment
Asset-Based and Specialty Finance: 14.2% CAGR
Fastest Growth Country
India: 15.8% CAGR
Fastest Growth Region
South Asia and Pacific: 12.5% CAGR
Largest Region
North America: 38% of 2025 global value
Market Leaders
Blackstone Inc., Apollo Global Management Inc., Ares Management Corporation, Blue Owl Capital Inc., KKR & Co. Inc. Source: MMA Analysis based on company annual reports.
Primary Survey
n=3,800 procurement and R&D decision-makers, Q4 2025, six countries
Methodology
Demand-side build-up, cross-validated against public data, 47 expert interviews

Private Credit Market Forecast Scenarios

private-credit-market-size-forecast-scenario-1787914040011
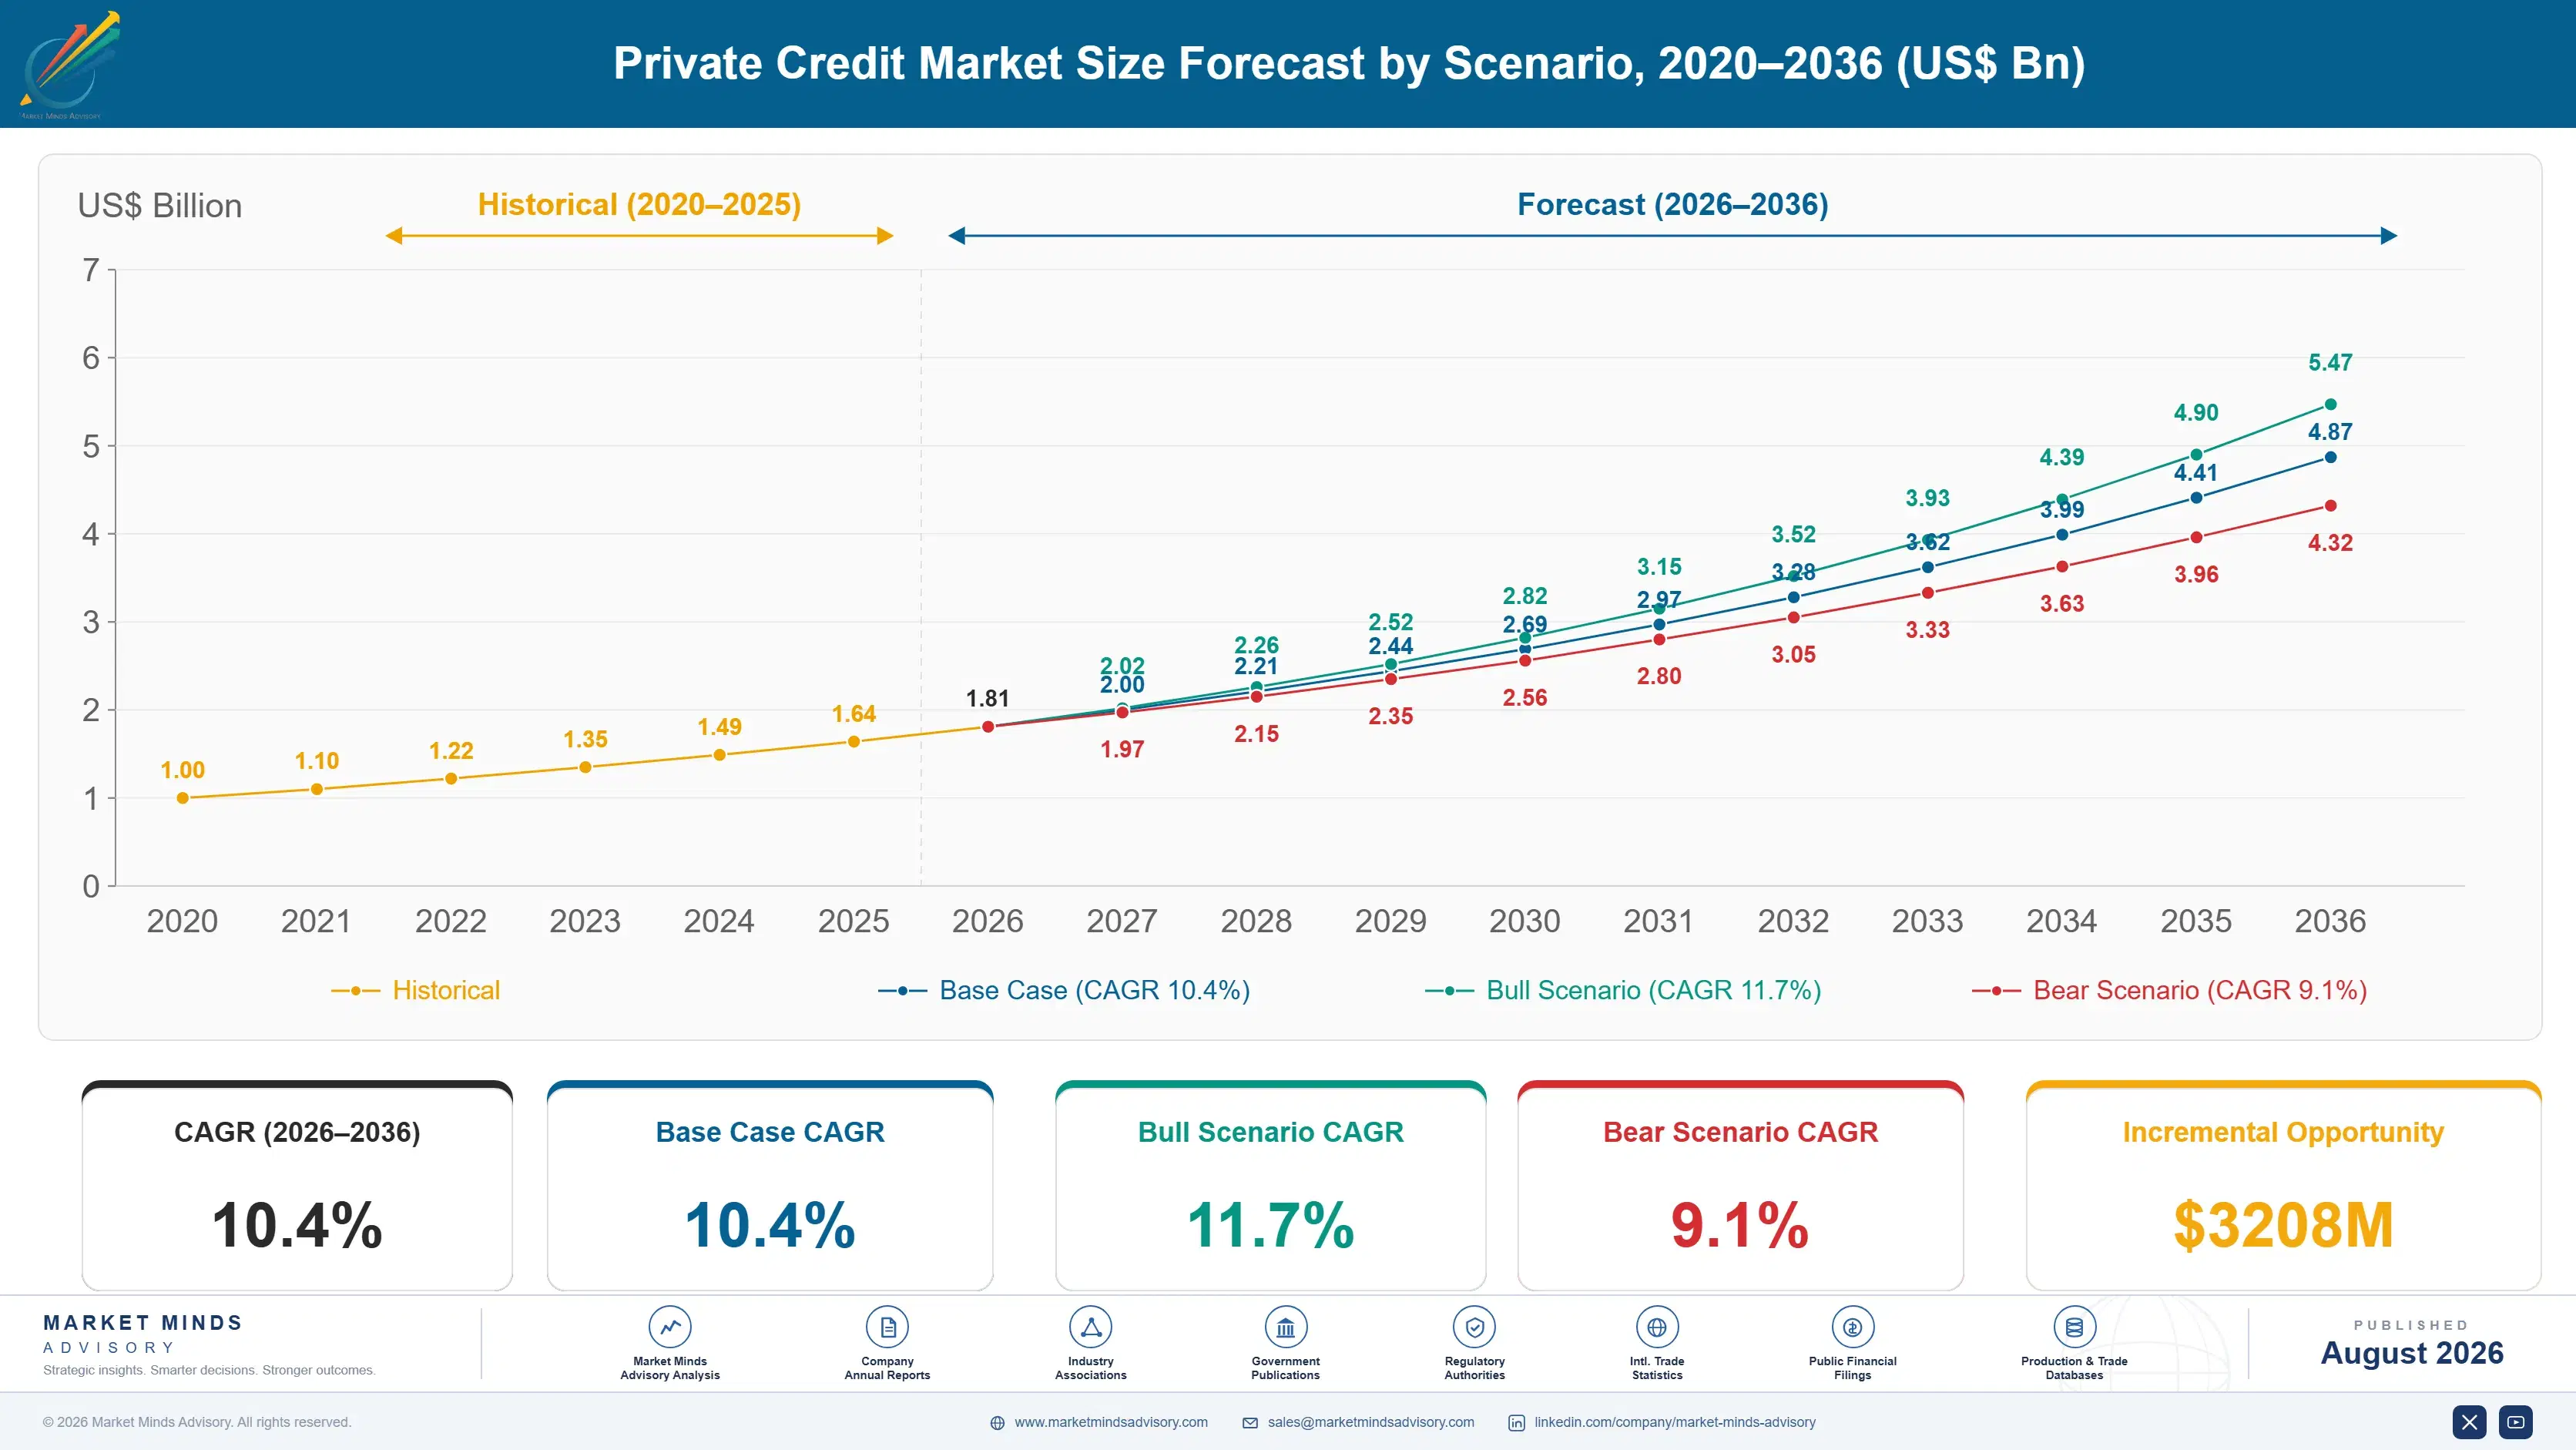
Between 2020 and 2025 the market grew at an estimated 9.4% annually, accelerated by pandemic-era bank retrenchment that pushed borrowers toward private lenders for certainty of execution, sustained from 2022 onward as rising rates made private credit's floating-rate structure attractive to yield-seeking institutional investors independently of bank behavior. Growth stayed concentrated in direct lending through most of the period, with distressed debt growing more slowly given limited default activity.
The base case carries the market to 10.4% CAGR through 2036 on three mechanisms. Insurance capital flows into private credit through asset manager acquisitions of insurance balance sheets, converting long-duration liabilities into a permanent funding source for private lending. Banks retreat from leveraged and specialty lending under tighter capital rules, ceding origination volume that private lenders are positioned to absorb. Middle-market borrowers prefer private credit's speed and certainty of execution over syndicated loan timing risk.
The bull case reaches 11.7% if bank capital rules tighten further than currently proposed, accelerating the volume shift toward private lenders. The bear case falls to 9.1% if rising defaults across floating-rate portfolios force underwriting discipline that slows new fund formation, a pattern already visible in several 2024 and 2025 vintage funds facing credit quality scrutiny.

Bank Retreat Is Redrawing Who Funds The Middle Market

Three forces converge on this category. Bank retreat keeps expanding which borrowers depend on private lenders rather than syndicated markets, insurance capital keeps flowing into the asset class at a pace few predicted five years ago, and rising defaults keep testing which managers underwrote responsibly during the growth years. Managers that treat these as three separate problems are already behind the ones treating them as one connected challenge.
MARKET CONCENTRATIONCR5: 42%Top five managers hold over two-fifths of assets
AVERAGE YIELD SPREAD550 bpsBlended spread over base rate across direct lending funds
TOP CAPITAL SOURCEUSA: 44%Single country supplies nearly half of committed capital
DRY POWDER RATIO28%Share of committed capital not yet deployed into loans
INSURANCE-LINKED CAPITAL SHARE31%Assets sourced through insurance balance sheet relationships directly
DEFAULT RATE3.2% of loansShare of outstanding loans in default across the industry
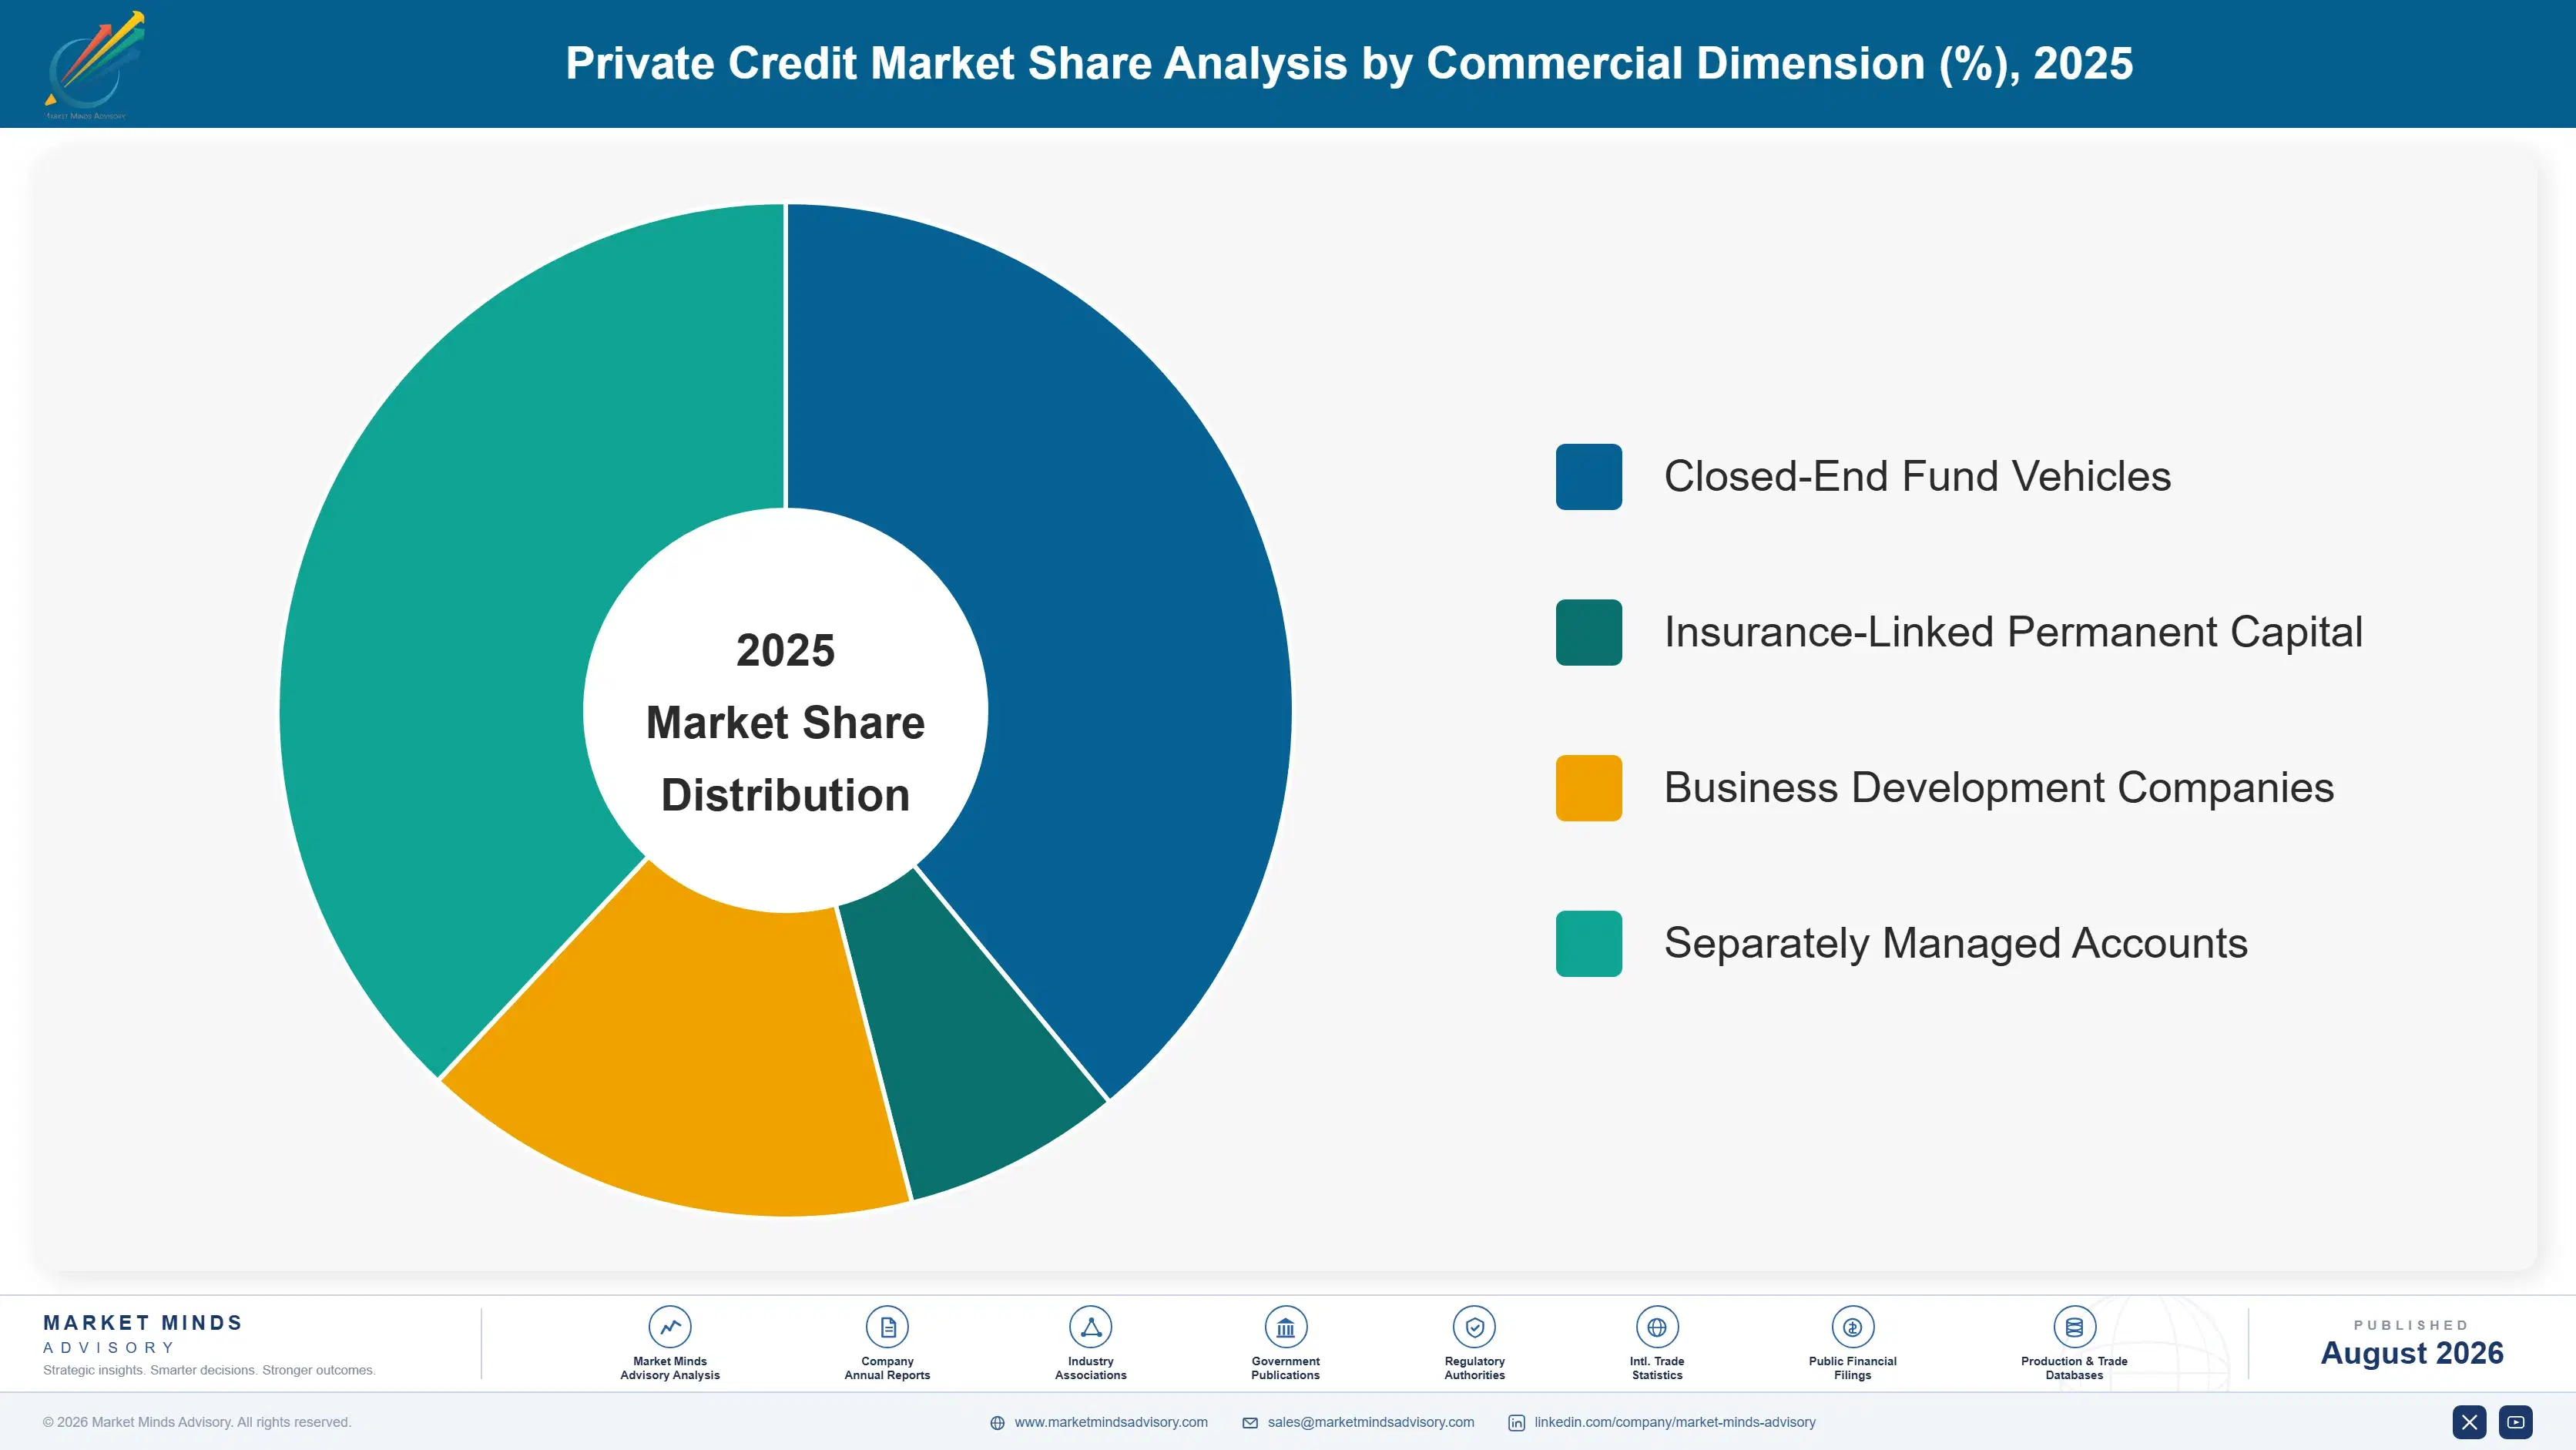
Commercial character splits sharply between permanent capital vehicles and traditional closed-end funds. Insurance-linked permanent capital lets managers like Apollo and KKR deploy patient, long-duration funding without redemption pressure, while traditional closed-end funds must return capital on a defined schedule regardless of market conditions. The permanent capital tier offers underwriting patience, but the closed-end tier commands materially clearer performance benchmarking that institutional allocators still prefer for manager selection.
Looking to 2036, three shifts matter most. Bank retreat will keep expanding the addressable borrower base regardless of who wins mandates today, rising defaults will increasingly separate disciplined underwriters from capital deployment machines that grew too fast, and specialty and asset-based lending will become a genuine competitive battleground as managers compete on origination breadth rather than fund size alone.
"Everyone still measures this market by assets raised. The number that actually matters is loss-given-default, because the managers who scaled fastest during the good years are about to find out whether their underwriting was ever tested by a real credit cycle."
Director, Alternative Credit and Asset Management Practice · MMA Financial Services and Insurance Practice · August 2026

Market Trends

Insurance Capital Floods Into Private Credit Platforms

Major asset managers have acquired or built insurance balance sheets to source permanent, long-duration capital for private credit deployment, converting policyholder liabilities into a funding source that does not face the redemption risk traditional fund structures carry. Apollo's ownership of Athene and KKR's ownership of Global Atlantic both demonstrate this model at scale, letting these managers deploy insurance float into private credit loans with a patience closed-end fund structures cannot match. This insurance-linked capital represents a substantial and growing share of total private credit assets under management, changing the investor base the industry depends on for continued fundraising growth.
Market Impact: Raises pension targets 5% to 10%
Bank Retreat From Leveraged Lending Continues

Proposed Basel III Endgame capital rules would require banks to hold significantly more capital against leveraged lending exposures, accelerating a retreat from this business line that began well before the rules were formally proposed. Regional and mid-sized banks in particular have pulled back from middle-market lending following the 2023 regional banking stress, ceding origination volume to private credit managers who face no comparable regulatory capital requirement. This retreat is not cyclical: banks are permanently exiting a business line regulators increasingly view as better suited to entities outside the traditional banking safety net entirely.
Market Impact: Funds over 70% of middle-market buyouts

Market Opportunities and Growth Drivers

Institutional Investors Chase Yield In Private Credit

Pension funds, insurance companies, and sovereign wealth funds have all increased target allocations to private credit as the asset class delivers yield premiums over comparable public fixed income that institutional investors find increasingly difficult to source elsewhere in a portfolio context. Floating-rate loan structures common across direct lending provided genuine protection during the 2022 rate-hiking cycle, validating the asset class's diversification value to allocators who had previously treated it as a niche allocation. Major pension funds including CalPERS and comparable global institutions have publicly disclosed increased private credit allocation targets, reinforcing the capital flow institutional demand continues to generate.
Market Impact: Pushes defaults to 3.2% of loans

Middle-Market Borrowers Prefer Certainty Over Price

Middle-market companies increasingly choose private credit over syndicated bank loans because private lenders can commit capital and close transactions with certainty that syndicated markets, dependent on multiple bank participants agreeing to terms, cannot always guarantee within a comparable timeframe. A single private credit fund can underwrite and fund an entire loan independently, eliminating the syndication risk that can delay or derail a transaction when market conditions shift during the marketing process. Private equity sponsors value this certainty when financing acquisitions on tight deal timelines, making private credit the default financing choice for a large majority of middle-market buyout transactions.
Market Impact: Prompts oversight proposals in 3 jurisdictions

Market Restraints and Challenges

Rising Rates Increase Default Risk In Floating Portfolios

Floating-rate loan structures that protected private credit lenders during the rate-hiking cycle now expose borrowers to higher debt service costs than the fixed-rate environment many companies borrowed under, increasing default risk across portfolios underwritten before rates rose. The root cause is duration mismatch: borrowers took on floating-rate debt during a low-rate environment without modeling how a higher-rate period would affect their debt service coverage ratios. This has pushed default rates higher across 2021 and 2022 vintage direct lending portfolios, forcing managers to spend more time on workouts and restructuring. Lenders are responding with tighter covenant structures and conservative leverage multiples.
Market Impact: Represents over 30% of committed capital

Regulatory Scrutiny Of Systemic Risk Intensifies

Central banks and financial regulators have raised concerns that private credit's rapid growth outside traditional banking oversight could create systemic risk that disclosure and reporting frameworks are not designed to capture or monitor effectively. The root cause is a regulatory gap: private credit funds report to investors under fund disclosure rules, not the prudential banking frameworks that would flag systemic risk to supervisors. This has prompted regulators to propose private credit reporting and stress-testing requirements that raise compliance cost across the industry. Managers are responding by enhancing transparency and participating in industry stress-testing initiatives ahead of regulatory mandates.
Market Impact: Shifts $100B+ volume to private funds
3 additional market trends, 3 additional growth drivers, and 3 additional restraints and challenges are covered in the full report. Contact sales@marketmindsadvisory.com to access the complete intelligence.

Segment CAGR and Growth Architecture

Segmentation follows strategy type, a single risk-return logic spanning direct lending, mezzanine and subordinated debt, distressed debt, venture debt, asset-based and specialty finance, and real estate private credit. Each strategy carries distinct risk profile, return target, and underwriting model, so commercial position tracks what type of credit risk the manager underwrites and how it is structured and priced.
private-credit-market-market-share-analysis-1787914040547

Asset-Based and Specialty Finance

Asset-based and specialty finance grows fastest at 14.2% annually, nearly 1.4 times the overall market rate, as private lenders expand beyond corporate direct lending into consumer receivables, equipment leasing, and other asset-backed structures that banks are exiting alongside leveraged lending. These strategies lend against collateral pools, from consumer loan portfolios to aircraft leases, rather than against general corporate creditworthiness, requiring specialized underwriting expertise most generalist direct lenders have not built. Blue Owl and Blackstone have both expanded dedicated asset-based finance platforms to capture this growth, recognizing that banks retreating from balance sheet-intensive lending are ceding entire asset classes rather than corporate loans. The segment's growth reflects a lasting change in bank risk appetite rather than a credit cycle phenomenon.
CAGR 14.2%

Direct Lending

Direct lending grows second-fastest at 11.8%, remaining the largest single strategy within private credit as middle-market companies continue preferring private lenders over syndicated bank loans for speed and certainty of execution. These senior secured loans, typically extended directly to private equity-backed middle-market companies, carry floating-rate structures and covenant protections that differ meaningfully from the covenant-light terms common in syndicated leveraged loan markets. Ares Management and Golub Capital both lead this category through decades of middle-market origination relationships that newer entrants cannot replicate quickly. Rising defaults across some 2021 and 2022 vintage direct lending portfolios are testing underwriting discipline built during a period when credit losses remained historically low. Newer entrants without comparable relationships continue struggling to match this scale.
CAGR 11.8%
Full segment breakdown across 6 segments available in the complete report.

Regional Architecture and Country Demand Map

North America leads on the concentration of the largest alternative asset managers and deepest institutional capital pools, ahead of Western Europe's growing smaller private credit market. East Asia follows on emerging regional capacity, while South Asia and Pacific posts the fastest regional growth as institutional capital expands into markets.

North America

The United States accounts for the overwhelming majority of North America's 38% global share, a concentration that breaches the standard 22 to 32% regional band because no other market approaches the combined scale of American institutional capital pools and the world's largest alternative asset managers headquartered there. Blackstone, Apollo, Ares, and Blue Owl all originated and built their dominant scale from American middle-market lending before expanding internationally, giving the country a scale advantage no other region can replicate quickly. Canada contributes a smaller, more conservatively regulated private credit market with steadier growth. Growth of 10.0% reflects continued bank retreat and institutional capital inflows even from an already massive, mature base.
Share: 38% | CAGR: 10.0% (2026 to 2036)

Western Europe

The UK anchors much of Western Europe's 19% share as the region's leading private credit hub, home to significant fund manager operations serving continental European middle-market borrowers. Germany and France follow with growing direct lending activity as European banks face comparable capital pressure to their American counterparts under evolving regulatory frameworks. The EU's regulatory approach to private credit remains less developed than the United States, creating both opportunity and uncertainty for managers operating across the bloc. Nordic countries show disproportionately active private credit markets relative to their population size, reflecting sophisticated institutional investor bases. Growth of 8.8% trails the global rate, consistent with a market still building the scale American managers achieved over a longer period.
Share: 19% | CAGR: 8.8% (2026 to 2036)
Regional intelligence for 5 additional markets available in the complete report: East Asia, South Asia and Pacific, Latin America, Middle East and Africa, Eastern Europe. Contact sales@marketmindsadvisory.com.
private-credit-market-country-cagr-analysis-1787914041059

Where Private Credit Margin Now Concentrates

Managers face a familiar tension: commodity direct lending competes purely on spread and leverage terms, while specialty underwriting expertise and permanent capital access increasingly carry the margin. The four moves below shift revenue toward defensible, harder-to-replicate positions instead of undifferentiated capital deployment, drawing on how leading managers already separate commodity lending economics from specialty and insurance-linked strategies.

Build Insurance Balance Sheet Capital Relationships

Managers that secure permanent, insurance-linked capital through balance sheet acquisitions or strategic partnerships capture funding stability that traditional closed-end fund structures cannot match, since insurance float does not face redemption pressure during market stress. Apollo and KKR reportedly deploy insurance-linked capital at fee structures running 30% to 50% more favorably than comparable third-party fund capital, since the captive relationship removes fundraising cost and timing uncertainty entirely. Managers without insurance balance sheet access are ceding this durable capital advantage to competitors willing to build or acquire the insurance relationships this model requires.
Market Impact: Captures 30% to 50% better fee economics overall

Expand Into Asset-Based And Specialty Finance

Corporate direct lending faces intensifying competition as more capital chases the same middle-market borrower pool, while asset-based and specialty finance strategies, lending against specific collateral pools banks are exiting, face meaningfully less competitive pressure and command wider spreads. Managers building dedicated asset-based finance capability now capture origination volume in categories running 100 to 200 basis points wider than comparable corporate direct lending spreads, since specialized collateral underwriting expertise remains genuinely scarce. This category remains underpenetrated relative to the bank retreat already underway, since many managers still treat corporate direct lending as the default strategy rather than the increasingly commoditized one.
Market Impact: Commands 100 to 200 bps wider spreads overall

Secure Middle-Market Sponsor Relationships Ahead Of Rivals

Private equity sponsors that repeatedly work with the same direct lender across multiple portfolio company financings generate recurring deal flow that eliminates competitive bidding on each individual transaction, since sponsors value relationship continuity and execution certainty over marginal pricing differences. Managers with the deepest sponsor relationships reportedly source 60% to 80% of their deal flow through repeat sponsor relationships rather than competitive auction processes, capturing meaningfully better risk-adjusted terms than managers competing purely on price for each transaction. Building these relationships requires years of consistent execution that newer entrants cannot compress into a shorter timeframe.
Market Impact: Sources 60% to 80% of deals through relationships

License Underwriting Analytics To Smaller Managers

Managers that developed proprietary credit underwriting and portfolio monitoring analytics ahead of competitors hold capability that smaller regional managers now need but cannot develop independently within a reasonable timeframe. Licensing that analytics capability to non-competing regional managers, rather than only lending directly, can generate technology licensing revenue running 1% to 3% of the licensee's assets under management at minimal marginal cost. This model is still emerging in private credit but mirrors licensing approaches already established in adjacent asset management categories, and rising demand for sophisticated risk monitoring is creating exactly the concentrated need that makes licensing commercially attractive right now.
Market Impact: Generates 1% to 3% ongoing licensing revenue stream

Who Controls the Margin Pool

Concentration sits at a moderate 42% for the top five, evaluated on global assets under management deployed across all private credit strategies. Blackstone's scale gives it the largest single share, but the gap to specialist managers is narrower than CR5 implies, since Golub Capital, Antares, and Blue Owl each hold origination and underwriting depth diversified managers have not matched.
Competitive activity runs along three fronts. Insurance capital access drives permanent funding advantage, where Apollo and KKR compete to deploy insurance-linked capital at fee economics closed-end fund managers cannot match. Sponsor relationship depth drives deal flow, where managers with decades of middle-market relationships source proprietary transactions competitors must compete for through auction. Specialty underwriting drives spread advantage, where asset-based finance specialists capture wider spreads than commoditized corporate direct lending increasingly commands.

Pressure is building from banks re-entering select private credit strategies through partnership structures, narrowing a market position pure-play managers had claimed almost entirely during the bank retreat years. Sovereign wealth funds are also pushing further into direct lending themselves, compressing the space specialist managers once occupied alone. Rankings will likely shift toward managers that combine permanent capital access with specialty underwriting depth, since neither advantage alone secures the fastest-growing segments.
private-credit-market-company-positioning-matrix-1787914041577

Competitive Moat and Risk Dimensions

BLACKSTONE INC.

Moat: Massive Scale And Capital Access

Blackstone's position as the world's largest alternative asset manager gives it capital-raising scale and institutional investor relationships that smaller managers cannot match, letting it deploy capital across nearly every private credit strategy simultaneously. Its brand recognition among institutional allocators provides fundraising advantages that newer, more narrowly focused managers lack entirely.
BLACKSTONE INC.

Risk: Diversification Limits Specialty Focus

Blackstone's breadth across strategies means it competes less intensely in any single specialty niche than a dedicated specialist manager, potentially ceding the highest-spread opportunities to more narrowly focused competitors. Its sheer scale can also make sourcing genuinely differentiated, smaller transactions less economically attractive than pursuing larger, more commoditized deals instead.
APOLLO GLOBAL MANAGEMENT INC.

Moat: Insurance-Linked Permanent Capital

Apollo's ownership of Athene gives it permanent, insurance-linked capital that traditional closed-end fund managers cannot access, letting it deploy patient capital without the redemption pressure or fundraising cycle timing that constrains competitors. This funding advantage compounds over time as Athene's policyholder liabilities keep growing alongside Apollo's private credit deployment capacity.
APOLLO GLOBAL MANAGEMENT INC.

Risk: Insurance Regulatory Exposure

Apollo's insurance ownership creates regulatory exposure to insurance capital rules that pure asset managers do not face, and any tightening of insurance investment regulations could constrain how Athene's capital gets deployed into private credit strategies. This dual regulatory exposure, spanning both asset management and insurance oversight, creates complexity competitors without an insurance arm avoid entirely.

Players Tracked

Prominent Players

Blackstone Inc.
Apollo Global Management Inc.
Ares Management Corporation
Blue Owl Capital Inc.
KKR & Co. Inc.

Other Key Players

Golub Capital
Antares Capital
Oaktree Capital Management
Sixth Street Partners
Carlyle Group
Fortress Investment Group
PGIM Private Capital
Barings LLC
Churchill Asset Management
Monroe Capital
Bain Capital Credit
TPG Angelo Gordon
Crescent Capital Group
Varde Partners
Hayfin Capital Management

Recent Developments

APRIL 2025

Blackstone Expands Asset-Based Finance Platform

Blackstone announced expanded asset-based finance capability specifically targeting consumer and specialty lending categories that banks continue exiting under tightening capital requirements. The expansion was an organic platform build-out, not an acquisition or joint venture with an external company, partner, or investment group of any kind.
Signal: Signals major managers are treating asset-based finance as a genuine growth priority beyond corporate direct lending.
JANUARY 2025

KKR Expands Global Atlantic Insurance Capital Deployment

KKR announced expanded deployment of Global Atlantic insurance capital into private credit strategies, increasing the permanent capital base available for direct lending and specialty finance investment. The expansion was an internal capital allocation decision, not an acquisition or new corporate transaction of any kind or structure.
Signal: Signals insurance-linked capital is becoming a central funding pillar for the largest private credit managers industrywide.
AUGUST 2024

Regional Bank Signs Origination Partnership With Private Credit Fund

A regional bank signed an origination partnership agreement with a major private credit fund, referring middle-market lending opportunities the bank could no longer hold on its own balance sheet under capital constraints. The agreement was a commercial referral partnership, not a joint venture or equity investment.
Signal: Signals banks are adapting to capital constraints by partnering with private credit rather than competing directly.

Cost Of Capital And Credit Loss Exposure

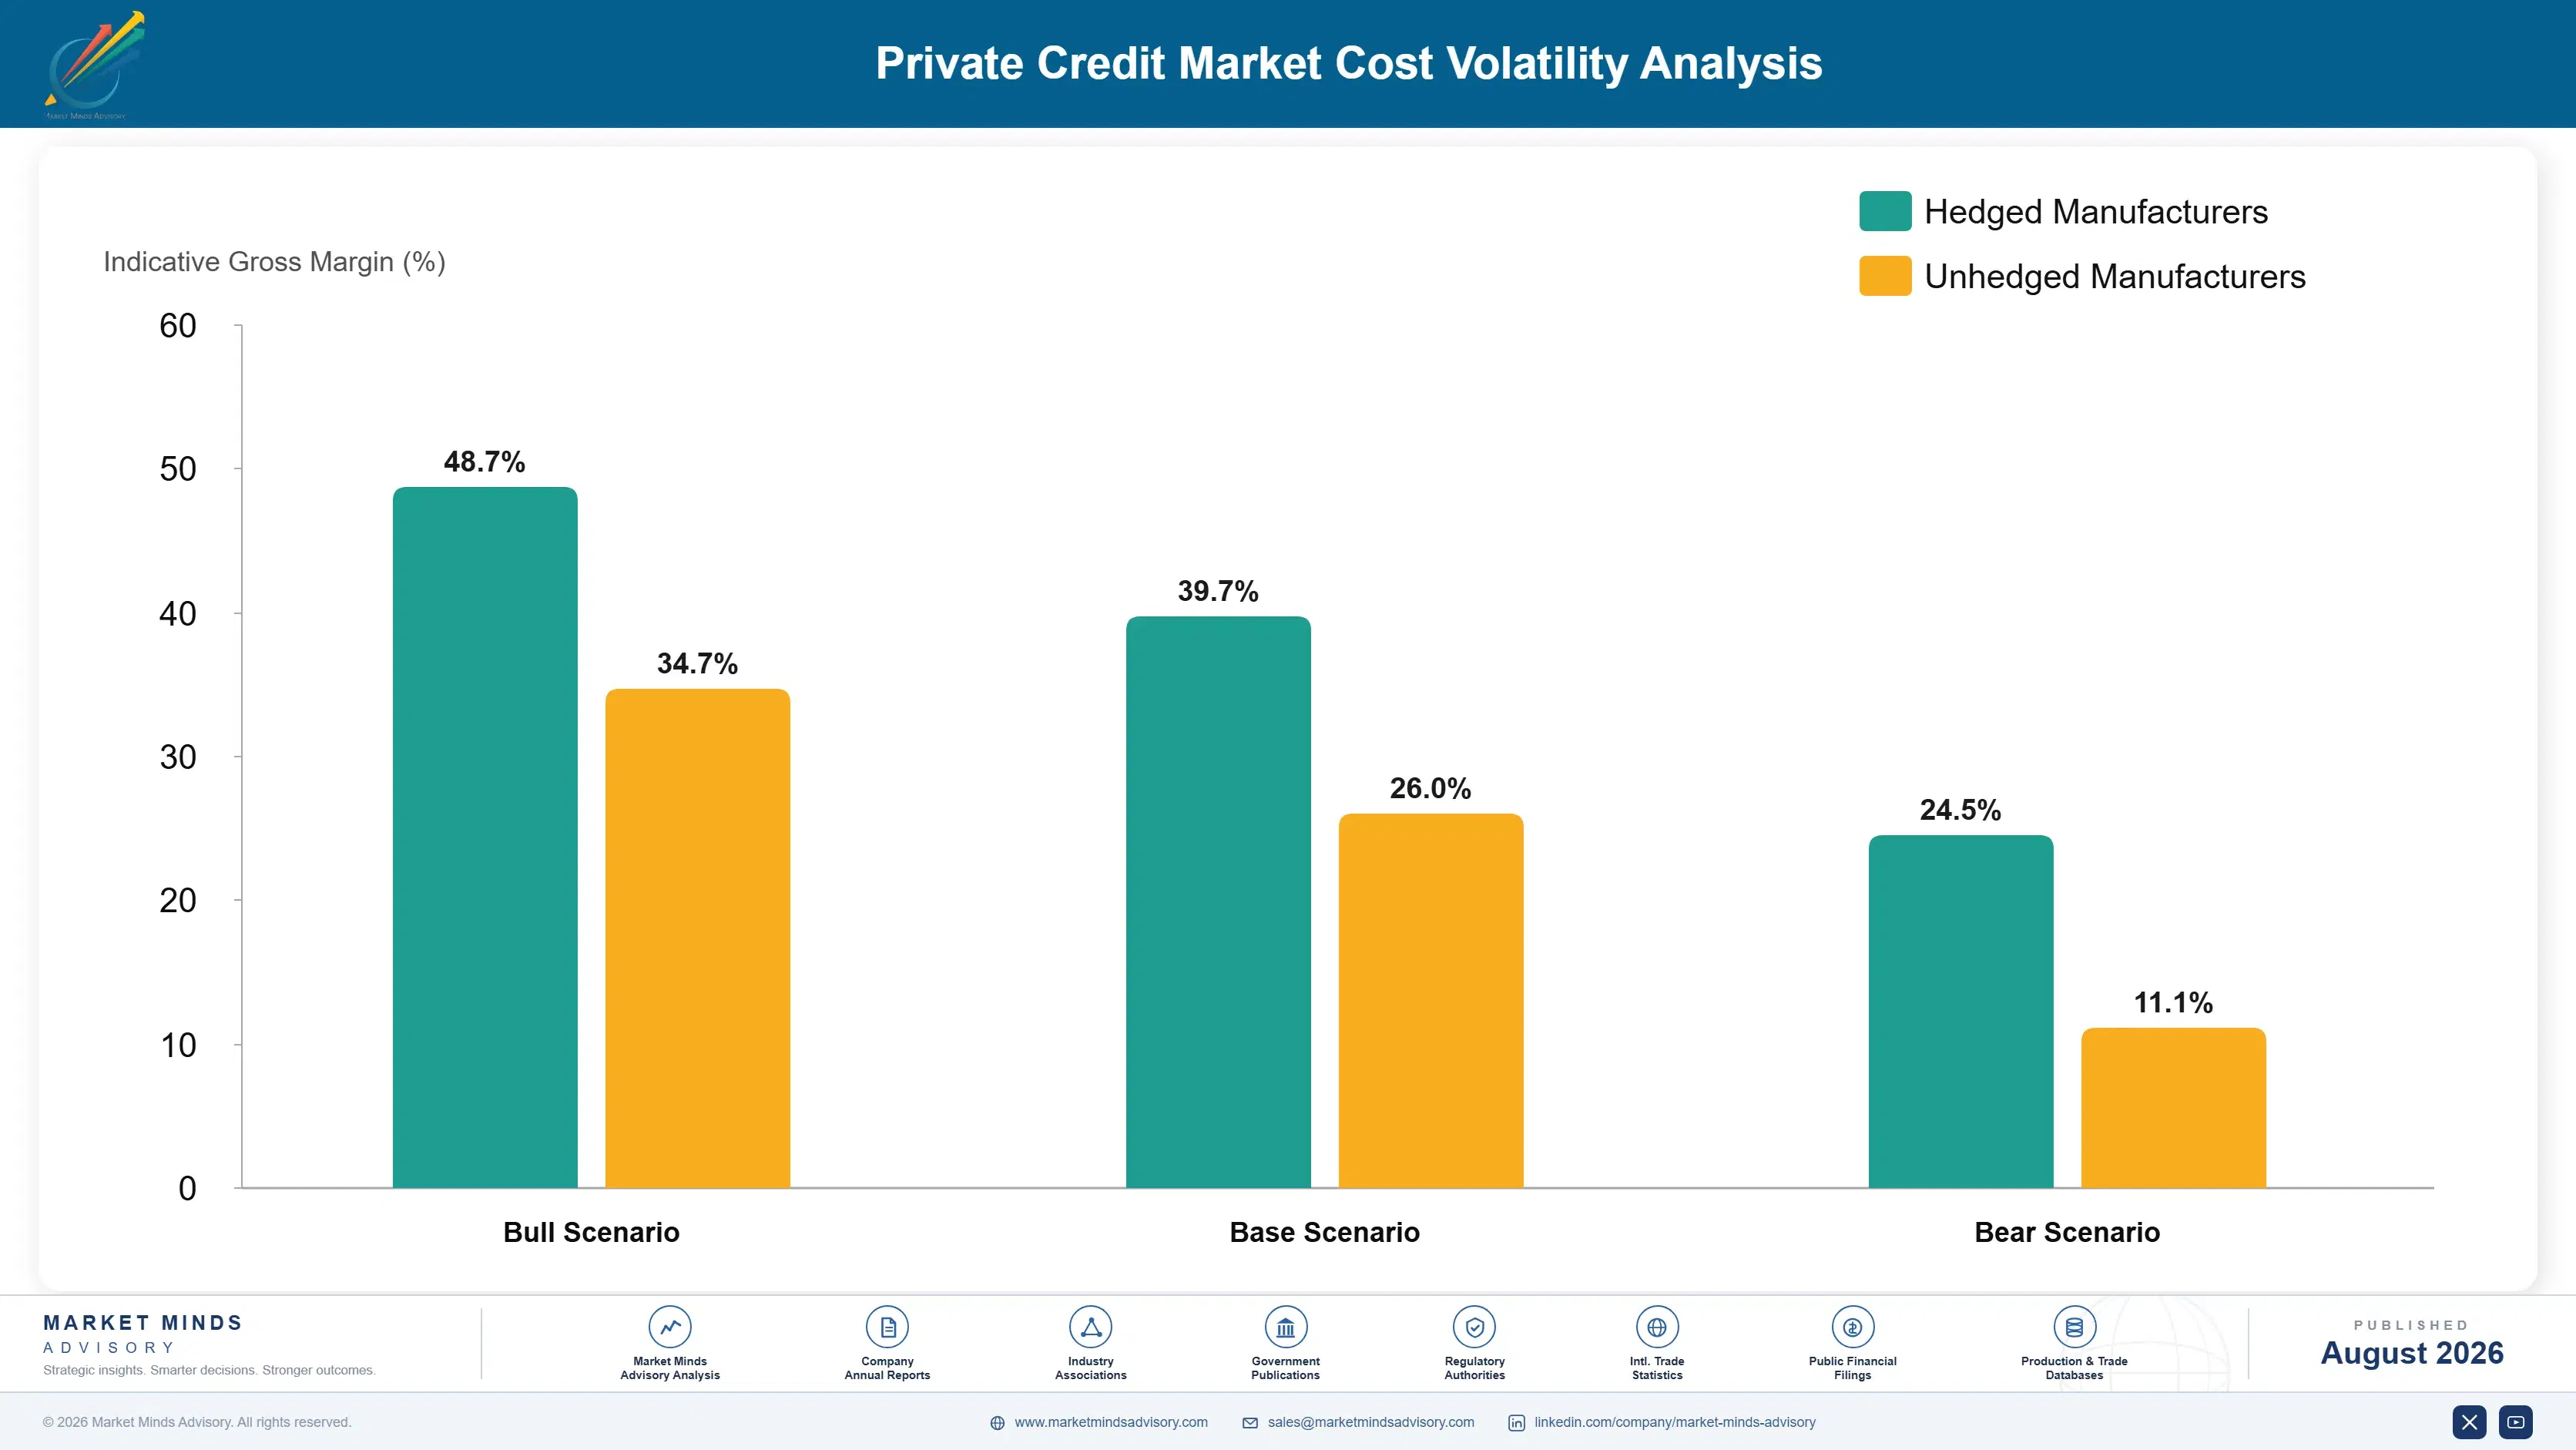
Cost of capital and credit loss provisioning together account for roughly 48% of gross investment income, with credit loss provisioning alone running 18% to 28% of revenue depending on default trends within a given credit cycle. Cost of capital, tied to fund investor return requirements and leverage facility pricing, adds another 15% to 22%, while portfolio monitoring and origination overhead account for the remaining share.
Rising defaults across 2021 and 2022 direct lending portfolios have pushed credit loss provisioning higher across the industry since 2023, testing underwriting discipline built during years when defaults remained historically low. Blackstone's 2023 annual report disclosed elevated credit monitoring activity across its private credit segments. Leverage facility pricing has hardened since 2022, pushing fund-level financing costs higher as managers pass cost through to portfolio company borrowers.

Managers without diversified strategy exposure absorb credit cycle volatility directly, while Blackstone and Apollo negotiate insurance-linked and permanent capital sources that smooth funding cost volatility across larger, diversified platforms. Managers concentrated in single-strategy direct lending carry additional exposure since strategy concentration limits the diversification benefit that spreads risk across uncorrelated credit types. Managers without strong institutional relationships face higher effective cost of capital during fundraising downturns.
private-credit-market-cost-volatility-analysis-1787914041771

Diversify Strategy And Sector Exposure

Concentrating capital in a single strategy or sector creates exposure that a single credit cycle downturn can turn into a fund-threatening event. Building a diversified platform across multiple strategies and sectors, even at the cost of foregoing some concentrated return opportunity, preserves capital and investor confidence if any single sector or strategy underperforms unexpectedly.

Secure Permanent Capital Sources Beyond Closed-End Funds

Securing insurance-linked or other permanent capital sources ahead of a fundraising downturn, rather than relying purely on periodic closed-end fund cycles, is what let larger managers limit the worst of recent fundraising volatility while smaller competitors struggled to raise successor funds. The flexibility given up through captive capital structures is real, but far cheaper than a stalled fundraising cycle.

Invest In Credit Monitoring And Workout Capability

Rising defaults require dedicated workout and restructuring capability that pure origination-focused teams often lack, and managers investing in this capability now capture better recovery outcomes than competitors scrambling to build it during an active credit cycle. Early investment in monitoring infrastructure compounds into a durable underwriting advantage over the cycle that competitors struggle to close.

Portfolio Architecture for Margin Defence

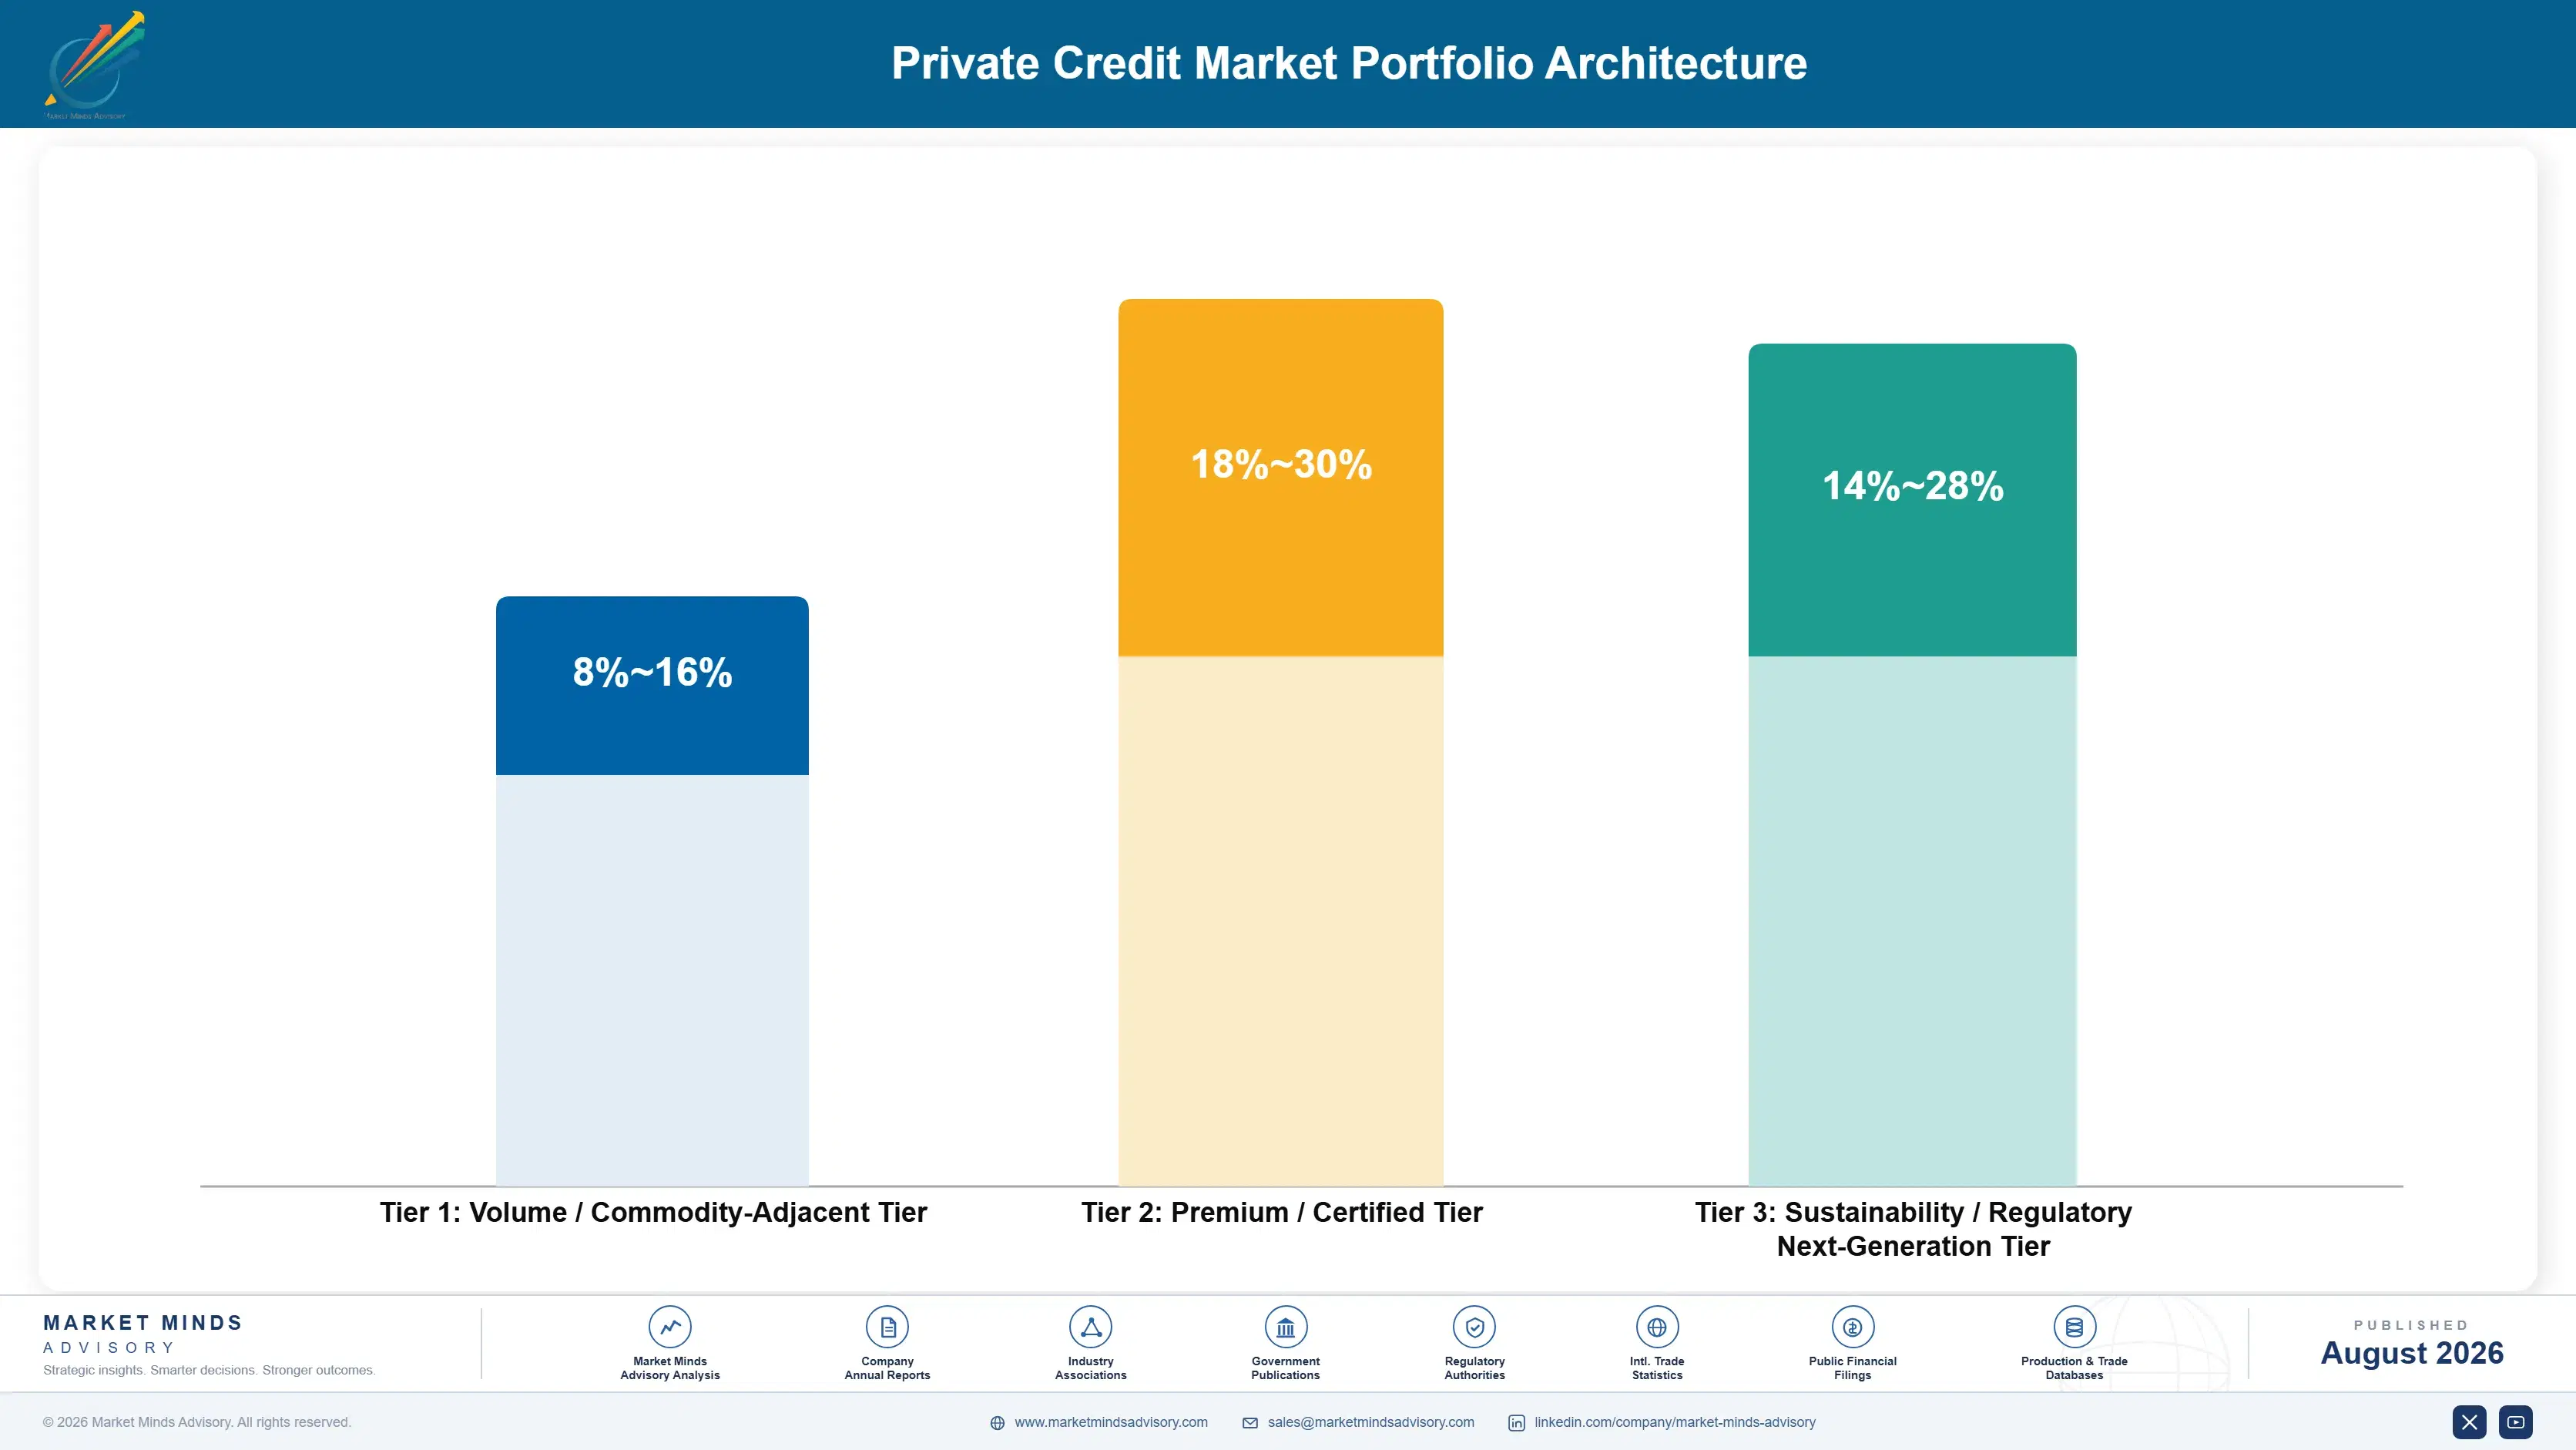
The portfolio splits into three tiers with meaningfully different margin economics. Volume commodity direct lending to mainstream middle-market borrowers competes on spread and leverage terms against a crowded field of managers, earning modestly. Premium specialty and asset-based finance strategies earn substantially more because collateral underwriting expertise and deal structuring complexity insulate pricing from direct commodity comparison. Insurance-linked permanent capital deployment sits in a third tier carrying strong margins as funding stability advantage drives durable competitive positioning.
The tension runs between volume and specialty depth. Commodity direct lending generates the assets under management that keep platforms scaled efficiently, but margin stays thin since sponsors compare spreads relentlessly across largely interchangeable lenders. Specialty and asset-based strategies carry the opposite constraint: strong margins but a narrower addressable opportunity set defined by collateral expertise rather than broad market access.

High-value margin pools concentrate wherever specialty underwriting expertise and permanent capital combine, which is precisely why insurance-linked and asset-based specialists have historically outearned commodity direct lenders despite deploying into a smaller addressable opportunity set. Insurance-linked capital carries the most immediate funding advantage right now, driven by funding permanence rather than organic demand growth alone.

Volume / Commodity-Adjacent Tier

Standard direct lending to mainstream middle-market borrowers, sold at scale through sponsor relationships, competing primarily on spread and leverage terms against a crowded field of managers with largely interchangeable fund structures.
Gross Margin: 8-16%

Premium / Certified Tier

Asset-based finance and specialty lending requiring collateral underwriting expertise and deal structuring complexity, sold through direct originator relationships where technical sophistication insulates pricing from commodity comparison across most institutional channels.
Gross Margin: 18-30%

Sustainability / Regulatory / Next-Generation Tier

Insurance-linked permanent capital strategies and emerging market private credit still working through market development and regulatory maturation before commercial-scale returns become fully predictable across most institutional allocator relationships broadly across markets.
Gross Margin: 14-28%
private-credit-market-portfolio-architecture-1787914042272

High-value Sub-segments and Strategic Watch-out

Insurance-Linked Permanent Capital Strategies

The fastest-growing and most strategically urgent segment, driven directly by asset managers acquiring insurance balance sheets for permanent funding. Apollo and KKR both draw early advantage from existing insurance ownership, and margin expansion continues as funding cost advantages compound across growing deployed capital industrywide each year.
Gross Margin: 18-30%

Asset-Based And Specialty Finance

Strong margins on collateral underwriting expertise, growing steadily as banks exit specialty lending categories globally. Growth trails insurance-linked capital because specialty underwriting talent builds more gradually than the acute bank retreat currently forcing faster movement elsewhere in the portfolio right now across most markets today.
Gross Margin: 14-28%

Standard Corporate Direct Lending

The volume core of the category, generating the bulk of deployed capital at stable, moderate margins. Ares, Golub Capital, and Blue Owl compete intensely here on sponsor relationships and execution speed, and while volume growth stays healthy, margin expansion is limited by established competitive dynamics.
Gross Margin: 8-16%

Distressed Vintage Portfolio Exposure

The strategic watch-out. Rising defaults across 2021 and 2022 direct lending portfolios threaten returns for managers who underwrote during looser credit conditions, and funds without workout capability face margin compression as defaults outpace underwriting assumptions built during recent years. The margin range reflects credit-cycle volatility rather than an underwriting issue.
Gross Margin: 0-22%

Fund Cycles Lock In Capital

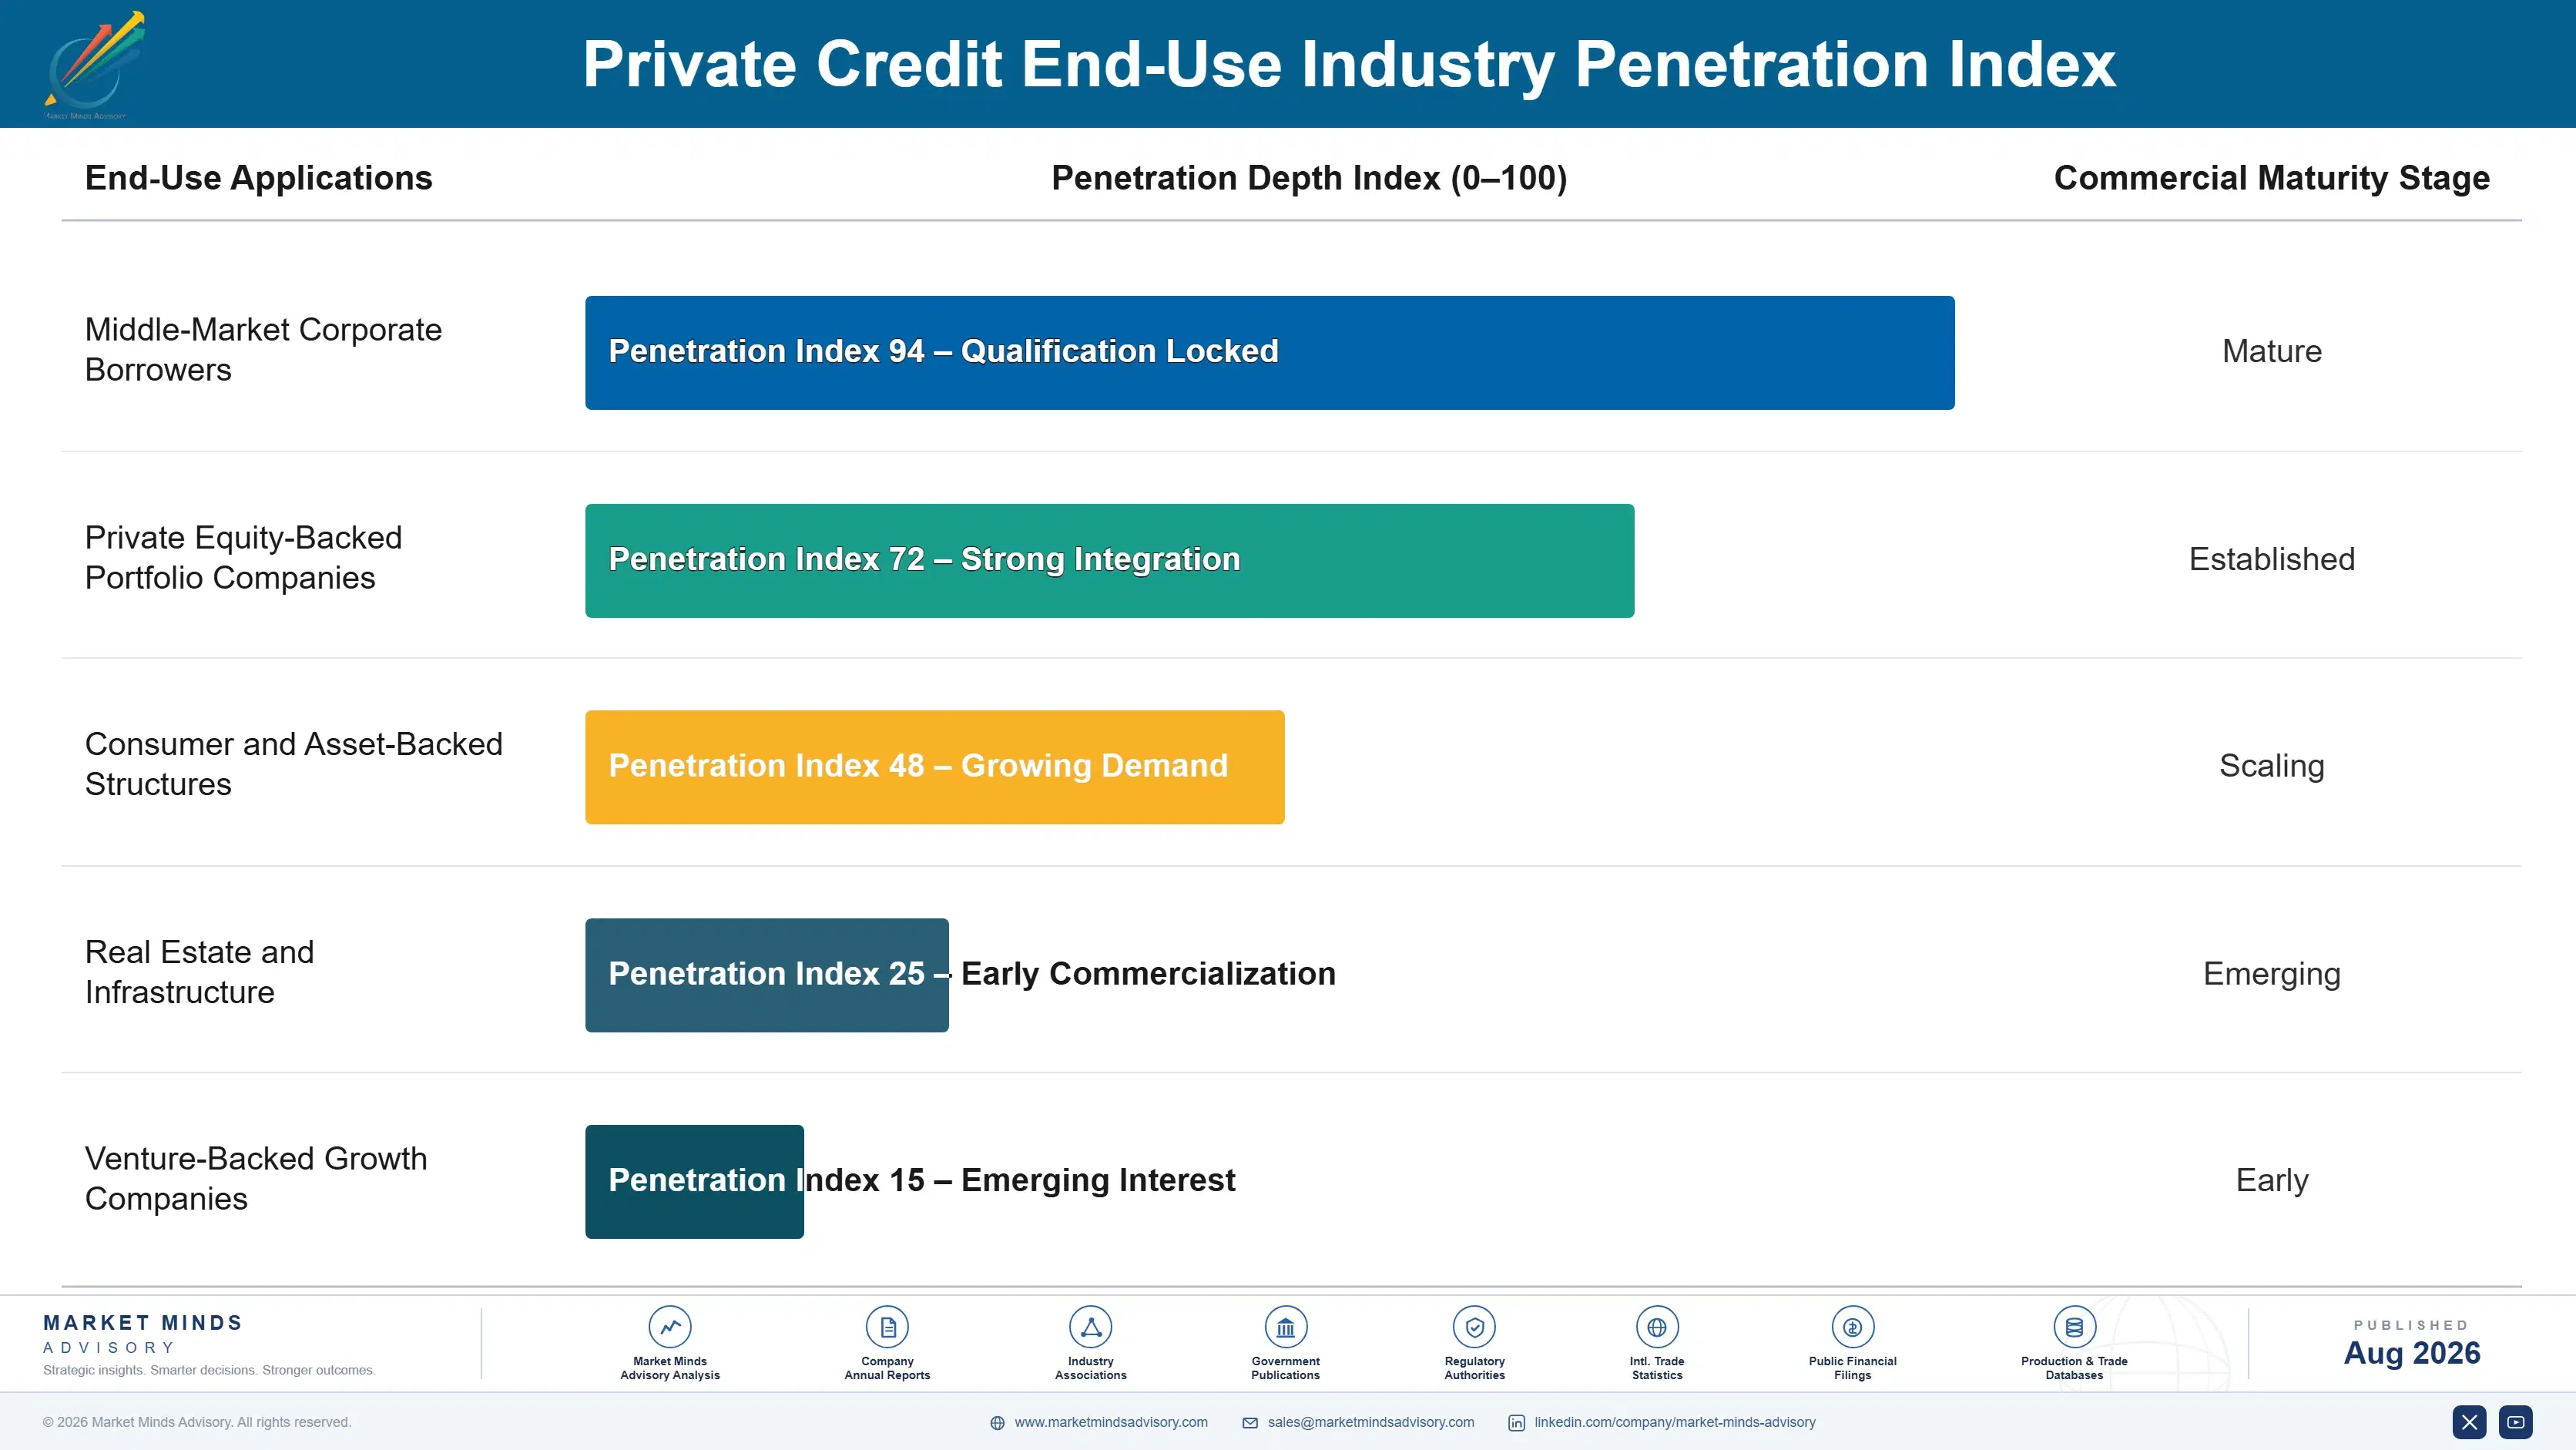
Private credit funds behave like annuities across the fund lifecycle, since committed capital generates recurring management and performance fees across a multi-year deployment and harvest period without any new fundraising cost. Insurance-linked permanent capital carries even longer effective relationships, since policyholder liabilities generate funding indefinitely rather than terminating on a fund's defined closing date.
Adoption depth varies by capital source. Insurance-linked and permanent capital allocators show the highest stickiness, since the funding relationship persists across multiple fund vintages without requiring separate fundraising each cycle. Pension fund and institutional allocators show moderate stickiness, balancing manager relationship continuity against periodic re-evaluation during each fund's fundraising period. Retail and semi-liquid vehicle investors show the weakest stickiness, switching managers based on performance, since no comparable barrier protects the incumbent manager.

Younger institutional allocators treat private credit as a core portfolio allocation rather than a satellite position, a shift return-seeking mandates and diversification research have accelerated beyond where traditional fixed income allocation would have permitted. Established pension funds weight manager track record and relationship continuity heavily. That generational split is reshaping manager selection criteria, pulling specialty underwriting depth toward an allocation requirement across an increasing share of institutional portfolios.
private-credit-market-end-use-penetration-index-1787914042756

Where MMA Sees Divergence Ahead

These are among the four positions where our research anticipates prominent divergence between winners and laggards over the coming forecast period. Each is grounded in the demand model, the regulatory perimeter, and the announced capacity pipeline.
01 / INSURANCE CAPITAL PRIORITY

Build permanent capital access before rivals lock it up

Insurance-linked capital is not a passing fundraising trend, and the balance sheet relationships it requires do not move for anyone, since managers that secure permanent capital access early capture funding stability before the industry catches up and competition compresses that advantage. Companies relying on closed-end fund cycles while deferring permanent capital investment are solving the wrong problem for this window, since funding stability, not fund size, is what will separate winners from laggards over the years ahead. The advantage goes to whoever secures capital first, not whoever raises the most.
02 / CREDIT DISCIPLINE PRIORITY

Tighten underwriting before the credit cycle turns further

Defaults are not falling on their own, and the underwriting discipline this demands does not move for anyone, which means managers that tighten standards proactively will absorb far less credit loss than competitors still deploying capital on growth-era assumptions. Companies still chasing origination volume while deferring credit discipline are solving the wrong problem for this window, since loss-given-default, not assets raised, is what will separate winners from laggards over the next several years. The advantage goes to whoever prices risk accurately, not whoever grows fastest.
03 / SPECIALTY FINANCE INVESTMENT

Build asset-based finance capability before it commoditizes

Corporate direct lending is becoming commoditized as more capital chases the same borrower pool, and managers that build genuine asset-based and specialty finance capability now, while spreads remain wide and competition remains limited, capture pricing power that becomes far harder to establish once mainstream managers eventually build comparable capability at scale. Waiting until specialty finance becomes standard practice means competing for spread that early movers have already claimed. The managers solving this first will define the reference standards everyone else has to match.
04 / EMERGING MARKET POSITIONING

Enter underdeveloped private credit markets before rivals do

Bank retreat is not confined to developed markets, and emerging market private credit represents a genuine addressable opportunity that most global managers have not yet prioritized building dedicated capability to serve. Managers that build local underwriting expertise in markets like India now capture relationship and track record advantages years before competitors without comparable relationships can replicate the structure. The managers solving local underwriting first will define the reference model everyone else has to match, in a market that will reward first movers disproportionately.

Engagement Snapshot From the Field

A live engagement with an industry participant carrying material or product regulatory and market exposure ahead of a defining policy shift, showing how our research translates into a defensible multi-year portfolio strategy.
MARKET MINDS ADVISORY · CLIENT ENGAGEMENT SUMMARY
Private Credit Producer Strategic Portfolio Review and Transition Roadmap 2026·Investment Scenario on Private Credit Exposure Evaluation 2025-26
CLIENT PROFILE
A middle-market private equity sponsor managing several portfolio companies approached MMA while evaluating whether to consolidate financing relationships with fewer private credit lenders to secure better terms and faster execution on future transactions. The client reported managing roughly USD 2.8 billion in assets across a dozen portfolio companies, with financing relationships spread across eight different private credit managers (client-reported, unverified by MMA).
STRATEGIC CHALLENGE
Leadership recognized that spreading relationships across many lenders diluted the sponsor's negotiating leverage and slowed execution on time-sensitive transactions, but had no internal framework for evaluating which lenders to consolidate around or how much better pricing a concentrated relationship might actually secure in practice across the full portfolio going forward.
MMA APPROACH
MMA benchmarked comparable sponsor consolidation strategies across the private credit industry, modeled the pricing and execution speed improvements a concentrated lender relationship could realistically deliver, and assessed which of the client's existing eight lenders offered the strategy breadth and balance sheet capacity to support a consolidated relationship long-term across market cycles.
KEY FINDINGS
  1. Sponsors with concentrated lender relationships across three or fewer managers secured pricing terms running 40 to 60 basis points tighter than comparable sponsors with fragmented relationships.
  2. Two of the client's existing eight lenders had the balance sheet capacity and strategy breadth to support the full portfolio company financing need going forward.
  3. Consolidation would reduce average deal execution time by an estimated 3 to 4 weeks per transaction, based on comparable sponsor benchmarking data.
  4. Maintaining a secondary relationship alongside the primary lender preserved competitive tension and backup capacity without fully sacrificing consolidation benefits achieved across the broader relationship.
CLIENT PROFILE
A middle-market private equity sponsor managing several portfolio companies approached MMA while evaluating whether to consolidate financing relationships with fewer private credit lenders to secure better terms and faster execution on future transactions. The client reported managing roughly USD 2.8 billion in assets across a dozen portfolio companies, with financing relationships spread across eight different private credit managers (client-reported, unverified by MMA).
STRATEGIC CHALLENGE
Leadership recognized that spreading relationships across many lenders diluted the sponsor's negotiating leverage and slowed execution on time-sensitive transactions, but had no internal framework for evaluating which lenders to consolidate around or how much better pricing a concentrated relationship might actually secure in practice across the full portfolio going forward.
MMA APPROACH
MMA benchmarked comparable sponsor consolidation strategies across the private credit industry, modeled the pricing and execution speed improvements a concentrated lender relationship could realistically deliver, and assessed which of the client's existing eight lenders offered the strategy breadth and balance sheet capacity to support a consolidated relationship long-term across market cycles.
KEY FINDINGS
  1. Sponsors with concentrated lender relationships across three or fewer managers secured pricing terms running 40 to 60 basis points tighter than comparable sponsors with fragmented relationships.
  2. Two of the client's existing eight lenders had the balance sheet capacity and strategy breadth to support the full portfolio company financing need going forward.
  3. Consolidation would reduce average deal execution time by an estimated 3 to 4 weeks per transaction, based on comparable sponsor benchmarking data.
  4. Maintaining a secondary relationship alongside the primary lender preserved competitive tension and backup capacity without fully sacrificing consolidation benefits achieved across the broader relationship.
RECOMMENDED STRATEGY
Phase 1: Phase 1 (0 to 6 months): Consolidate the majority of new financing volume with the two lenders offering the broadest strategy and balance sheet capacity. Phase 2: Phase 2 (6 to 18 months): Negotiate improved pricing and execution terms across the consolidated relationships based on committed forward volume. Phase 3: Phase 3 (18 to 36 months): Maintain one additional secondary lender relationship for competitive tension while directing most volume to primary partners.
OUTCOME
The client completed its lender consolidation within five months, ahead of the original eight-month estimate, and secured pricing terms averaging 45 basis points tighter than its previous fragmented relationships. Deal execution time on subsequent transactions fell by a reported 3.5 weeks on average (client-reported, unverified by MMA).

Frequently Asked Questions

Foundational context covering the market sizes, CAGR, scope, country, region and competition that inform every finding below. This section is provided to cover basics and most often pre-purchase conversations, answered from the MMA Primary Research Dataset.

What is the current size of the Private Credit Market?

The market reached USD 1,720 billion in assets under management in 2025 on a global basis, with North America holding the largest single regional share at 38%. It spans direct lending, mezzanine debt, distressed debt, and asset-based finance.

How large will the Private Credit Market be by 2036?

MMA forecasts the market will reach USD 5,107 billion by 2036, expanding roughly 2.69 times its 2026 base value. Asset-based finance and direct lending drive most of that incremental growth.

What is the CAGR for the Private Credit Market 2026 to 2036?

The base case CAGR runs at 10.4% annually through 2036. Bull scenarios reach 11.7% on faster bank retreat, while bear scenarios fall to 9.1% if rising defaults slow new fund formation.

Which segment is growing fastest?

Asset-based and specialty finance grows fastest at 14.2% annually, nearly 1.4 times the overall market rate. Bank retreat from consumer and asset-backed lending drives most of that acceleration.

Who are the major companies in the Private Credit Market?

Blackstone, Apollo, Ares, Blue Owl, and KKR lead the market on a consistent global assets under management basis. Together they hold roughly 42% of category assets.

Which country is growing fastest?

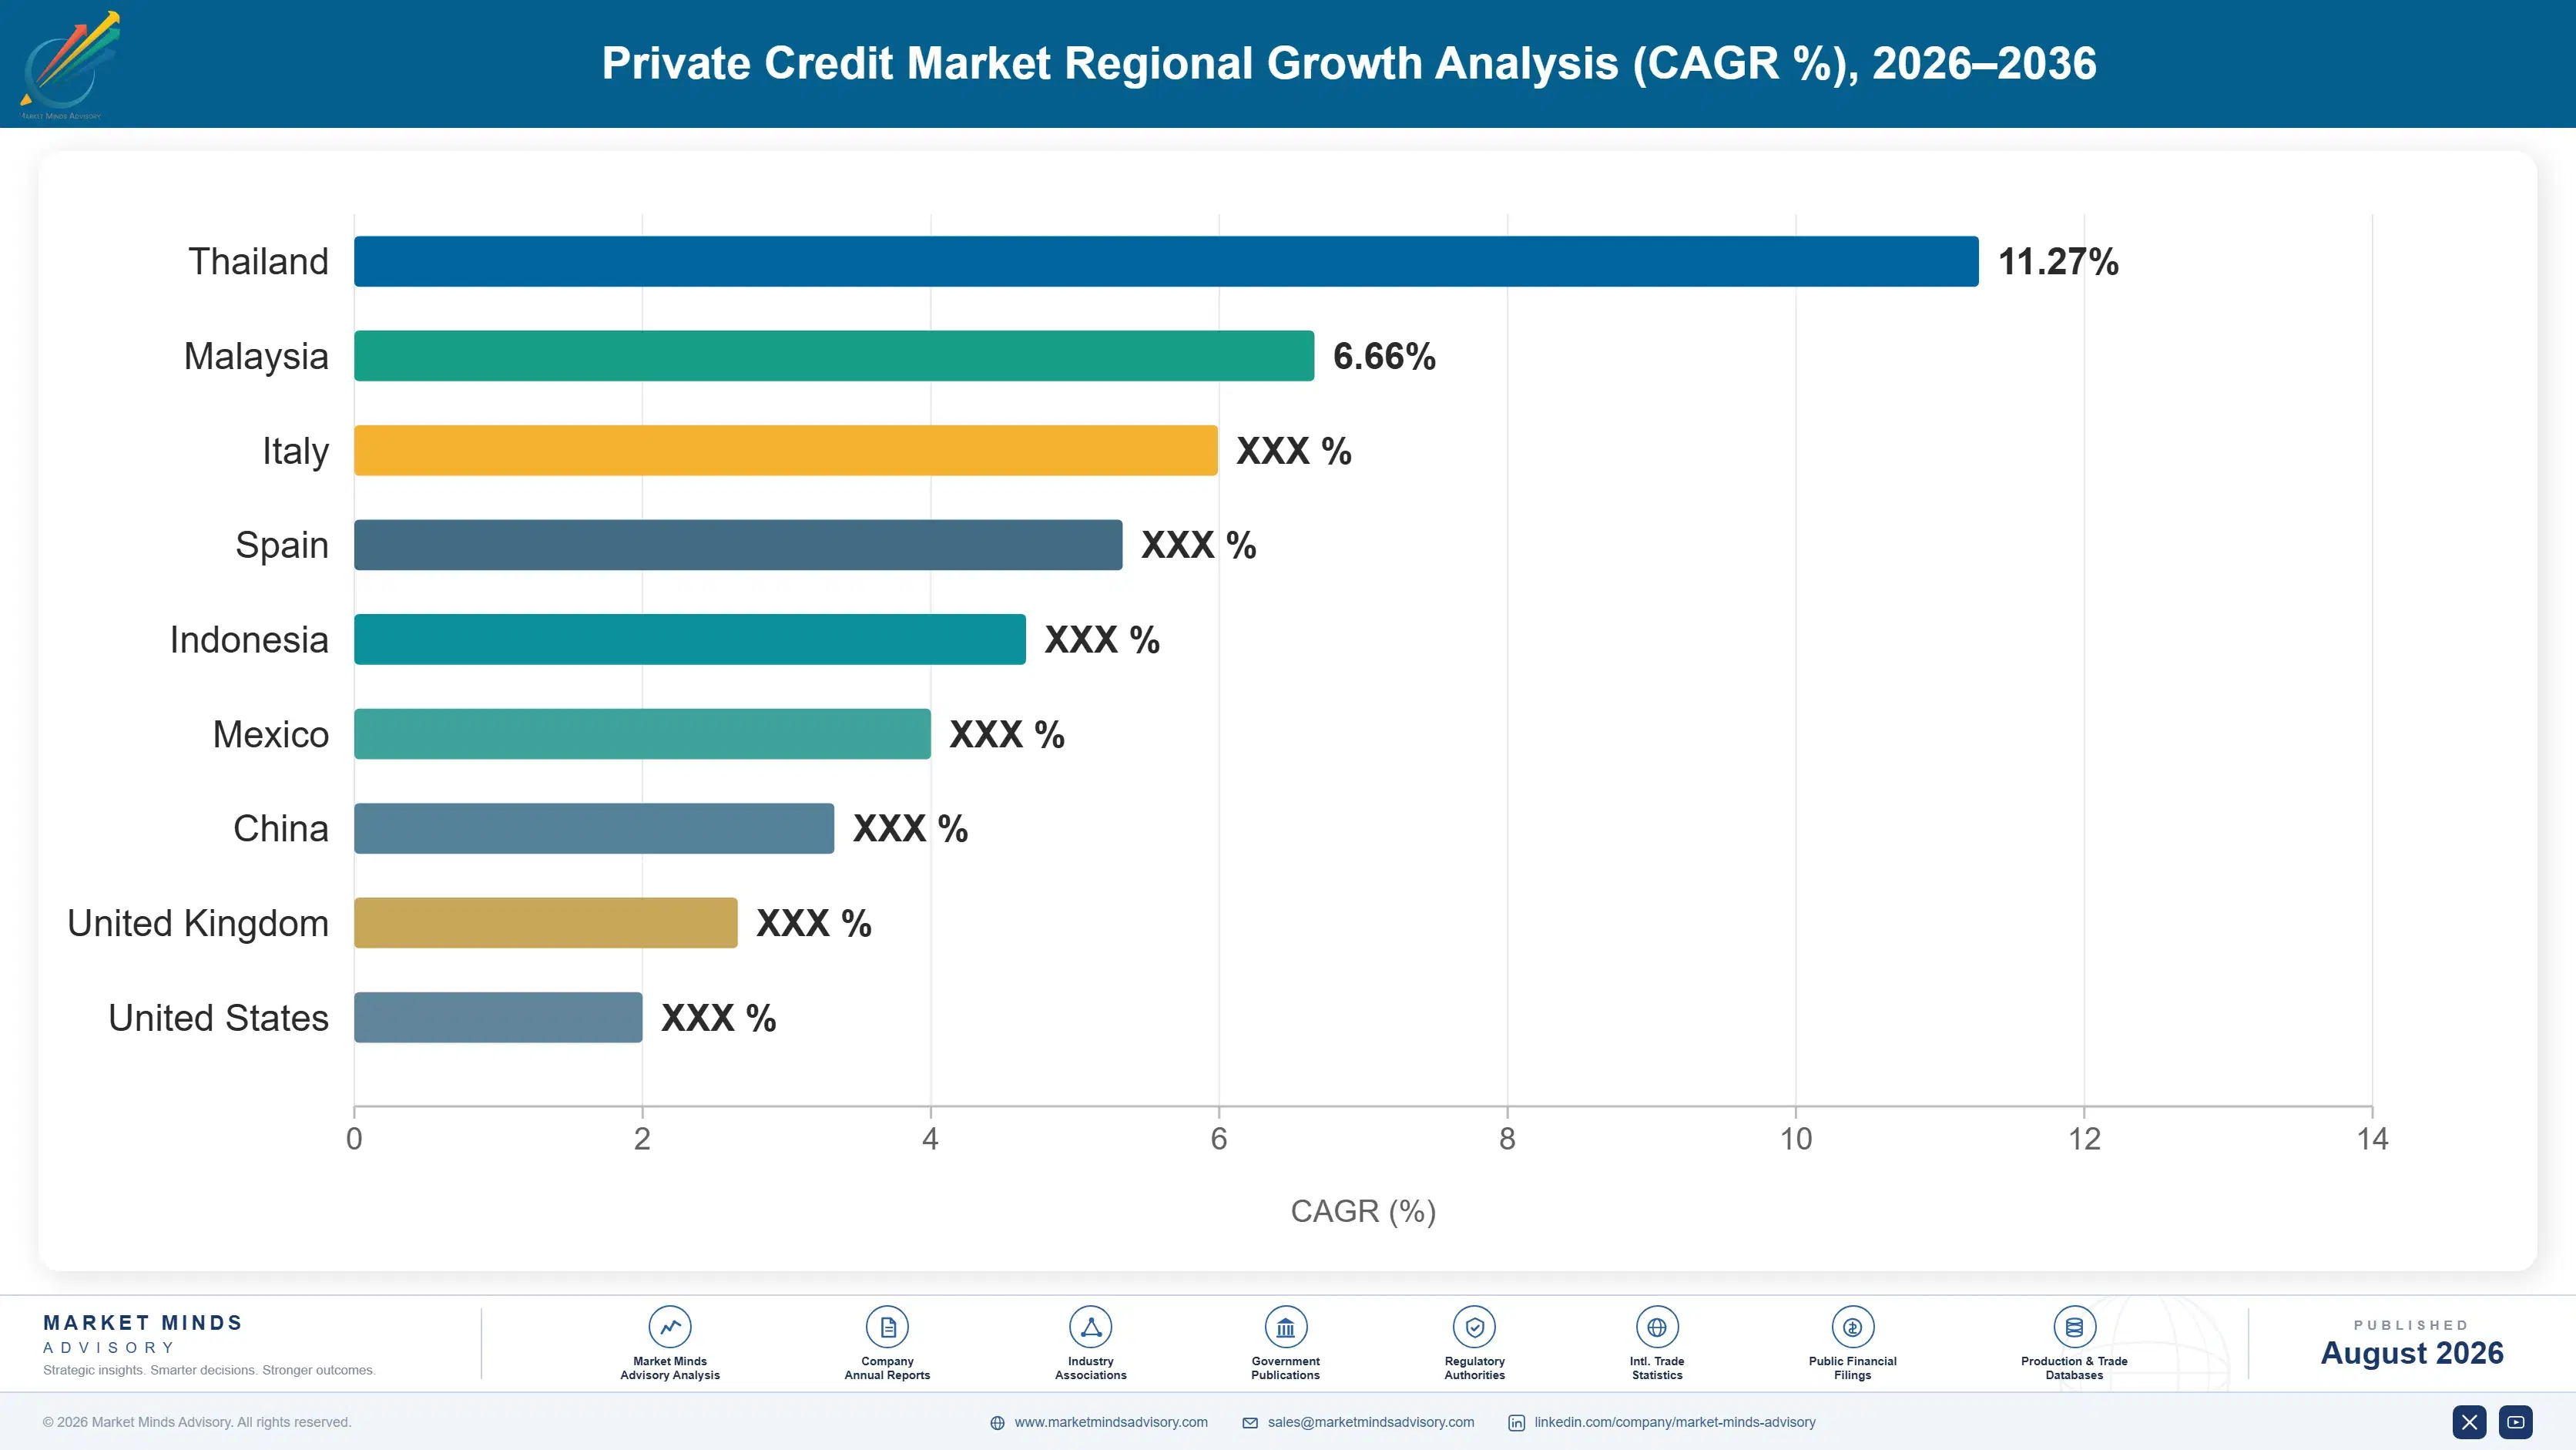
India posts the fastest national growth at roughly 15.8% annually, driven by non-bank lenders filling gaps traditional banks leave unaddressed. Growth concentrates in mid-market corporate lending rather than specialty finance.

Report Segmentation Architecture

The full report scope spans multiple orthogonal segmentation dimensions, with cross-tabulated demand data provided for each dimension pair. Coverage extends further to regional breakdowns, trend trajectories, and the competitive detail needed to support segment-level decision-making.

By Strategy Type

  • Direct Lending
  • Mezzanine and Subordinated Debt
  • Distressed Debt and Special Situations
  • Venture Debt
  • Asset-Based and Specialty Finance
  • Real Estate Private Credit

By End-Use Industry

  • Middle-Market Corporate Borrowers
  • Private Equity-Backed Portfolio Companies
  • Consumer and Asset-Backed Structures
  • Real Estate and Infrastructure
  • Venture-Backed Growth Companies

By Commercial Dimension

  • Closed-End Fund Vehicles
  • Insurance-Linked Permanent Capital
  • Business Development Companies
  • Separately Managed Accounts

By Region

  • North America
  • Western Europe
  • East Asia
  • South Asia and Pacific
  • Latin America
  • Middle East and Africa
  • Eastern Europe

Scope, Methodology, and Coverage

Every figure in this report is reproducible from documented input assumptions. The scope below maps the historical period, the forecast horizon, the segmentation dimensions, and the countries covered, alongside the underlying primary and qualitative methodology.
Historical Period
2020 to 2025
Forecast Period
2026 to 2036
Base Year
2025 (USD billions; MMA Primary Research Dataset, August 2026)
Market Definition
The private credit market covers non-bank lending to companies and asset owners structured and held outside public debt markets. It spans direct lending, mezzanine and subordinated debt, distressed debt, venture debt, asset-based and specialty finance, and real estate private credit, measured by assets under management deployed globally. It excludes publicly traded and syndicated bank loans, public high-yield bonds, traditional bank balance sheet lending, and private equity investment that does not take the form of debt.
Quantitative Units
USD billions (current prices); assets under management in billions where applicable
Segmentation Dimensions
By Strategy Type; By End-Use Industry; By Commercial Dimension; By Region
Regions Covered
North America, Western Europe, East Asia, South Asia and Pacific, Latin America, Middle East and Africa, Eastern Europe
Countries Covered
USA, China, Germany, France, UK, Japan, South Korea, India, Australia, Canada, Brazil, Mexico, Indonesia, Vietnam, Thailand, Malaysia, UAE, Saudi Arabia, South Africa, Nigeria, Turkey, Poland, Netherlands, Italy, Spain, Sweden, Switzerland, Argentina, Colombia, Singapore, and additional markets relevant to this sector
Key Companies Profiled
Blackstone Inc., Apollo Global Management Inc., Ares Management Corporation, Blue Owl Capital Inc., KKR & Co. Inc., Golub Capital, Antares Capital, Oaktree Capital Management, Sixth Street Partners, Carlyle Group, Fortress Investment Group, PGIM Private Capital, Barings LLC, Churchill Asset Management, Monroe Capital, Bain Capital Credit, TPG Angelo Gordon, Crescent Capital Group, Varde Partners, Hayfin Capital Management
Quantitative Methodology
Primary survey, n=3,800 respondents, Q4 2025, six countries; demand-side model with trade association cross-validation
Qualitative Methodology
47 expert interviews, Q4 2025; applied to validate demand model assumptions, identify emerging dynamics, and assess competitive positioning
Report Format
PDF and XLSX data workbook (Word format preview document)
Publisher
Market Minds Advisory
Report Code
MMA-2026-TEC-315
Published
August 2026
Contact
sales@marketmindsadvisory.com | www.marketmindsadvisory.com

Purchase the full Private Credit Market Report (2026 to 2036).

The full MMA Private Credit report sizes the market across six strategy types, five end-use categories, four commercial vehicle structures, and seven regions through 2036. It profiles 20 participants on a consistent global assets under management basis, scoring leaders on permanent capital access, underwriting discipline, and specialty strategy depth. Scenario models quantify how insurance capital inflows, bank retreat, and credit cycle dynamics move both demand and default performance across commodity and specialty tiers. The report also includes delivered-cost modeling by strategy type, a regulatory and systemic risk tracker, and a competitive positioning assessment built for allocation, underwriting, and origination teams.
Six-way strategy type segmentation with growth forecasts
Twenty-company competitive profiles on consistent AUM basis
Seven-region market sizing with country-level detail
Regulatory and systemic risk tracking module
Cost of capital and credit loss modeling by strategy
Bull, base, and bear demand scenario forecasts

Built For The People Who Decide

From boardroom strategy to bench-side execution, this report is read cover-to-cover by leaders shaping the next decade of their industry, turning demand scenarios, market dynamics and valuation benchmarks into decisions.
CXOs/ Presidents/ VPs/ Managers
M&A and Corporate Development
Strategy Teams and R&D Heads
Procurement and Product Directors
Regulatory and Compliance Leaders
Investor Relations and Equity Analysts