

Market Minds Advisory
Printed Electronics Devices Market

Printed Electronics Devices Market: Printed Electronics Devices Market. Flexible Sensors, Printed Batteries, and RFID Devices, 2026 to 2036

Wearable device makers demanding thinner, conformable sensors are pushing printed electronics manufacturers to prove production yield and long-term durability rather than laboratory-scale prototype performance alone at real commercial manufacturing volume.

Lead Analyst

Published

September 2026

Make Smarter Decisions with Customized Research Insights

Request a free sample report and evaluate market opportunities, growth trends, and competitive dynamics relevant to your business needs.

2025 MARKET VALUE$12.8BMarket Size 2025
2036 FORECAST VALUE$40.4BBase Case , 2026 to 2036
CAGR 2026 TO 203611.0 %Bull 12.3% / Bear 9.7%
INCREMENTAL OPPORTUNITY$26.1BNet 10- year value creation
EXPANSION MULTIPLE2.84x2036 value over 2026 base
Strategic Levers
M&A Pipeline
Regional Outlook
Country Rankings
Competitive Intelligence
Segmental Deep-dive
Call-Us : 91 93563 13602

Executive Snapshot and Market Trajectory.

Printed electronics have moved decisively from research laboratory demonstrations into commercial-scale manufacturing across wearable health sensors, flexible displays, and printed batteries deployed at genuine production volume today, reshaping how compact electronic devices get designed and manufactured entirely across the entire global consumer electronics industry worldwide.
Printed and flexible sensors are growing fastest as wearable health monitoring devices increasingly demand thin, conformable sensing elements that rigid silicon components simply cannot replicate against skin or fabric surfaces comfortably at any meaningful scale. East Asia leads regional demand given its concentration of consumer electronics manufacturing and flexible display production capacity across South Korea, Japan, Taiwan, and increasingly mainland China's rapidly expanding domestic supply chain and manufacturing base nationwide and beyond.
Competitive character increasingly centers on manufacturing yield and production scalability rather than laboratory-scale prototype performance, since translating impressive demonstration results into commercially viable, high-volume production remains the single largest barrier facing most printed electronics developers today across the entire global industry. Vendors offering proven roll-to-roll manufacturing capability win disproportionate share of new design wins across consumer electronics and medical device customers evaluating multiple suppliers each fiscal product cycle.
Market Definition
The Printed Electronics Devices Market covers electronic components and devices manufactured using printing techniques including inkjet, screen, and gravure printing to deposit conductive, semiconductive, or dielectric materials onto flexible or rigid substrates. It excludes traditional silicon-based semiconductor manufacturing, conventional rigid printed circuit board assembly, and non-electronic printed materials.
Base Year Value
$12.8B in 2025 (MMA Primary Research Dataset, September 2026)
Forecast Period
2026 to 2036, eleven discrete annual values
CAGR
11.0% base case. Bull 12.3%. Bear 9.7%.
Fastest Growth Segment
Printed and Flexible Sensors: 16.0% CAGR
Fastest Growth Country
South Korea: 13.5% CAGR
Fastest Growth Region
South Asia and Pacific: 13.0% CAGR
Largest Region
East Asia: 37% of 2025 global value
Market Leaders
Leading vendors: DuPont, Molex, Samsung Electronics, LG Display, E Ink Holdings. Source: MMA Primary Research Dataset, July 2026.
Primary Survey
n=3,800 procurement and R&D decision-makers, Q4 2025, six countries
Methodology
Demand-side build-up, cross-validated against public data, 47 expert interviews

Printed Electronics Devices Market Forecast Scenarios

printed-electronics-devices-market-size-forecast-scenario-1789998169122
Growth through 2020 to 2025 accelerated steadily as roll-to-roll manufacturing techniques matured enough to move printed sensors and batteries from pilot production lines into genuine commercial-scale output, a transition that took considerably longer than early industry projections had originally anticipated across most application categories tracked in this entire study over the full historical five-year period.
Base case growth through 2036 rests on three commercial mechanisms: continued wearable health monitoring device adoption requiring thin, conformable sensors that rigid silicon components cannot replicate against skin surfaces comfortably, expanding printed battery adoption in disposable and semi-disposable smart packaging and medical patch applications requiring genuinely ultra-thin power sources across every application category, and growing flexible display adoption across foldable consumer electronics and automotive interior applications requiring curved form factors.
A bull scenario turns on faster manufacturing yield improvements that make printed electronics cost-competitive with traditional rigid alternatives across a broader range of mainstream consumer applications currently priced out of adoption. The bear risk is that manufacturing yield challenges persist longer than expected, keeping printed electronics confined to premium, niche applications rather than achieving the mainstream cost parity needed for broader market penetration.

The Yield Economics Behind Every Printed Sensor

Vendors no longer compete primarily on laboratory-scale sensitivity or demonstration performance alone, since impressive prototype results have become common across nearly every credible developer in the category and industry today, but rather on manufacturing yield and production scalability that determine whether a design ever reaches commercial volume at an economically viable unit cost worth pursuing at all.
MARKET CONCENTRATIONCR5: 32%Top five vendors hold under a third of total spending
AVERAGE SENSOR UNIT COST$0.38Typical wholesale cost for a standard printed sensor unit
TOP PRODUCING COUNTRY SHARESouth Korea: 24%Reflects concentration of flexible display and sensor manufacturing capacity
TYPICAL MANUFACTURING YIELD RATE78%Share of printed units passing quality control at production
ROLL-TO-ROLL PRODUCTION ADOPTION46%Share of manufacturers using continuous roll-to-roll production processes
WEARABLE DESIGN WIN RATE34%Share of new wearable device designs specifying printed sensors
Pricing has shifted from simple per-unit component sales toward design-win relationships that lock in multi-year supply agreements tied to a specific end product's production lifecycle, since consumer electronics and medical device manufacturers value supply continuity and consistent manufacturing yield over marginal unit price differences between qualified suppliers competing for the same design slot and contract opportunity across the entire broader industry.
Roll-to-roll manufacturing capability has become the single largest differentiator behind commercial success in this category, since it lets manufacturers achieve the continuous, high-volume production that batch-based laboratory processes simply cannot match at comparable cost or production speed across the board. Vendors offering mature roll-to-roll production report meaningfully higher yield rates and design win success than those still relying primarily on batch manufacturing techniques across their entire operations.
"A sensor that works beautifully on a lab bench and fails at scale is worth nothing commercially. The vendors winning contracts are the ones who solved yield, not the ones with the flashiest demo."
Practice Lead, Flexible and Printed Electronics Research · MMA Technology Practice · September 2026

Market Trends

Wearable Health Sensors Drive Volume Adoption Rapidly

Consumer and medical wearable device manufacturers have shifted decisively from rigid, discrete sensor components toward printed, flexible sensing elements that conform comfortably to skin and fabric surfaces without the bulk and discomfort traditional rigid components introduce during extended daily wear over long periods across many working hours. Roughly 46 percent of new wearable health monitoring devices launched in 2025 now incorporate at least one printed or flexible sensor component, up sharply from under 20 percent just three years earlier as manufacturing yield and cost both improved considerably across the industry.
Market Impact: 68 million foldable units shipped

Smart Packaging Adoption Accelerates Printed Battery Demand

Consumer packaged goods companies increasingly embed ultra-thin printed batteries into smart packaging that displays freshness indicators, authentication features, or interactive marketing content directly on the product packaging itself rather than requiring a separate battery component assembled during traditional manufacturing processes across the entire global supply chain and logistics network worldwide. Roughly 3,200 new smart packaging product launches incorporating printed battery technology were tracked globally during 2025 according to industry product launch tracking, up substantially from under 900 launches just two years earlier as printed battery cost and reliability both improved.
Market Impact: 42 million patches deployed globally

Market Opportunities and Growth Drivers

Foldable Device Adoption Requires Flexible Display Components

Smartphone and tablet manufacturers launching foldable form factor devices require flexible display and circuit components that traditional rigid printed circuit boards and displays simply cannot provide, since a foldable device must withstand hundreds of thousands of fold cycles without component failure or visible degradation of any kind whatsoever throughout its lifetime. Roughly 68 million foldable consumer electronics units shipped globally during 2025 according to industry shipment tracking, each requiring specialized flexible printed circuitry engineered specifically to survive repeated mechanical flexing without cracking or delaminating over the product's expected service life.
Market Impact: Yield below 60% for new products

Remote Patient Monitoring Expansion Drives Sensor Demand

Healthcare systems expanding remote patient monitoring programs increasingly deploy disposable and semi-disposable printed biosensor patches that track vital signs continuously without requiring patients to visit a clinical facility for routine measurement, reducing both healthcare system cost and overall patient inconvenience considerably across the entire continuum of ongoing chronic disease care management for everyone. Roughly 42 million remote patient monitoring biosensor patches incorporating printed electronics were deployed globally during 2025 according to healthcare technology deployment tracking, reflecting sustained growth in home-based chronic disease management programs across most developed healthcare systems worldwide.
Market Impact: Gap excludes uses beyond 3 years

Market Restraints and Challenges

Manufacturing Yield Challenges Limit Commercial Scalability

Many printed electronics developers struggle to translate impressive laboratory-scale demonstration results into consistent, high-volume commercial production, since manufacturing defects that a laboratory setting can tolerate become economically unacceptable at commercial scale where even modest yield losses compound into meaningful cost across millions of units produced. The root cause is that printing processes remain more sensitive to environmental variables like humidity and temperature than traditional silicon fabrication techniques refined over decades. Some manufacturers report yield rates below 60 percent for newer product categories still working through process optimization. Vendors increasingly invest in real-time process monitoring to catch defects early.
Market Impact: 46% of wearables use printed sensors

Durability Concerns Limit Adoption in Harsh Environments

Printed electronic components generally demonstrate lower durability than traditional rigid silicon alternatives when exposed to mechanical stress, moisture, or extreme temperature variation, limiting adoption in industrial and outdoor applications where component reliability under harsh conditions matters more than the flexibility advantage printed electronics otherwise offers. The underlying cause is that the thin conductive layers used in printing processes are inherently more vulnerable to physical damage than bulk silicon materials. This durability gap routinely excludes printed electronics from industrial applications requiring multi-year field reliability. Several manufacturers now offer protective coatings engineered to improve environmental resistance.
Market Impact: 3,200 launches used printed batteries
3 additional market trends, 4 additional growth drivers, and 3 additional restraints and challenges are covered in the full report. Contact sales@marketmindsadvisory.com to access the complete intelligence.

Segment CAGR and Growth Architecture

The market splits by device function rather than by printing process or substrate material used in production, since design cycles, manufacturing requirements, and pricing structures vary sharply across each specific category and target buyer type served. Six categories cover the field: printed sensors, printed batteries, RFID tags, flexible displays, printed circuits, and conductive inks.
printed-electronics-devices-market-market-share-analysis-1789998169681

Printed and Flexible Sensors

Printed and flexible sensors are the fastest-growing category by a wide margin, driven by wearable health monitoring devices increasingly demanding thin, conformable sensing elements that rigid silicon components simply cannot replicate comfortably against skin and fabric surfaces during extended daily wear over long periods. Adoption started among premium wearable device manufacturers but has spread rapidly into medical patch applications and industrial condition monitoring as manufacturing yield and cost both improved considerably. Pricing has shifted from simple per-unit component sales toward design-win relationships that lock in multi-year supply agreements, and vendors increasingly bundle custom sensor calibration services directly into the component sale rather than leaving customers to handle calibration independently on their own.
CAGR 16.0%

Printed Batteries and Energy Storage

Printed batteries address a genuinely distinct commercial need, since disposable and semi-disposable applications like smart packaging and medical patches require ultra-thin, lightweight power sources that traditional coin cell or lithium battery formats simply cannot provide within the required form factor constraints of the underlying product design itself. Adoption has concentrated among consumer packaged goods companies embedding interactive features into product packaging and medical device manufacturers building single-use diagnostic and monitoring patches for short-term patient use. This category commands premium engineering costs relative to conventional battery manufacturing given the specialized printing and encapsulation processes required, and vendors report that reliability and shelf life increasingly determine which suppliers win recurring supply contracts.
CAGR 14.0%
Full segment breakdown across 6 segments available in the complete report.

Regional Architecture and Country Demand Map

East Asia leads on flexible display and sensor manufacturing scale, South Korea leads on the fastest growth rate through consumer electronics and wearable device production, and North America contributes strong demand tied to medical device innovation and steadily expanding wearable technology adoption nationwide and beyond.

North America

US medical device manufacturers and wearable technology companies drive substantial regional demand as continuous health monitoring devices increasingly integrate printed sensors directly into consumer and clinical products. The region's strong intellectual property protection and venture capital investment in flexible electronics startups have supported meaningful early-stage innovation, even though manufacturing scale-up frequently shifts to East Asian contract manufacturers once a design reaches commercial volume. Canada contributes modest volume through its own medical device manufacturing presence. The region's demand reflects genuine buyer sophistication around design and clinical validation rather than any unique manufacturing advantage held only by vendors based here specifically. Federal research funding programs have separately supported early-stage flexible electronics innovation at several major universities.
Share: 24% | CAGR: 10.0% (2026 to 2036)

Western Europe

Germany and the United Kingdom lead regional adoption through automotive interior electronics and medical device applications requiring flexible, conformable components that traditional rigid alternatives cannot easily replicate within tight design constraints. The region's strong automotive manufacturing base has driven meaningful demand for printed circuit and sensor components integrated into vehicle interiors and driver monitoring systems. Growth trails East Asia meaningfully since the region's consumer electronics manufacturing base is considerably smaller than the high-volume assembly operations concentrated in South Korea, Japan, Taiwan, and mainland China serving global device brands. Nordic countries have moved fastest within the region on medical patch sensor adoption specifically. Italian and Spanish automotive suppliers are following the German pattern from a somewhat smaller installed base.
Share: 18% | CAGR: 9.5% (2026 to 2036)
Regional intelligence for 5 additional markets available in the complete report: East Asia, South Asia and Pacific, Latin America, Middle East and Africa, Eastern Europe. Contact sales@marketmindsadvisory.com.
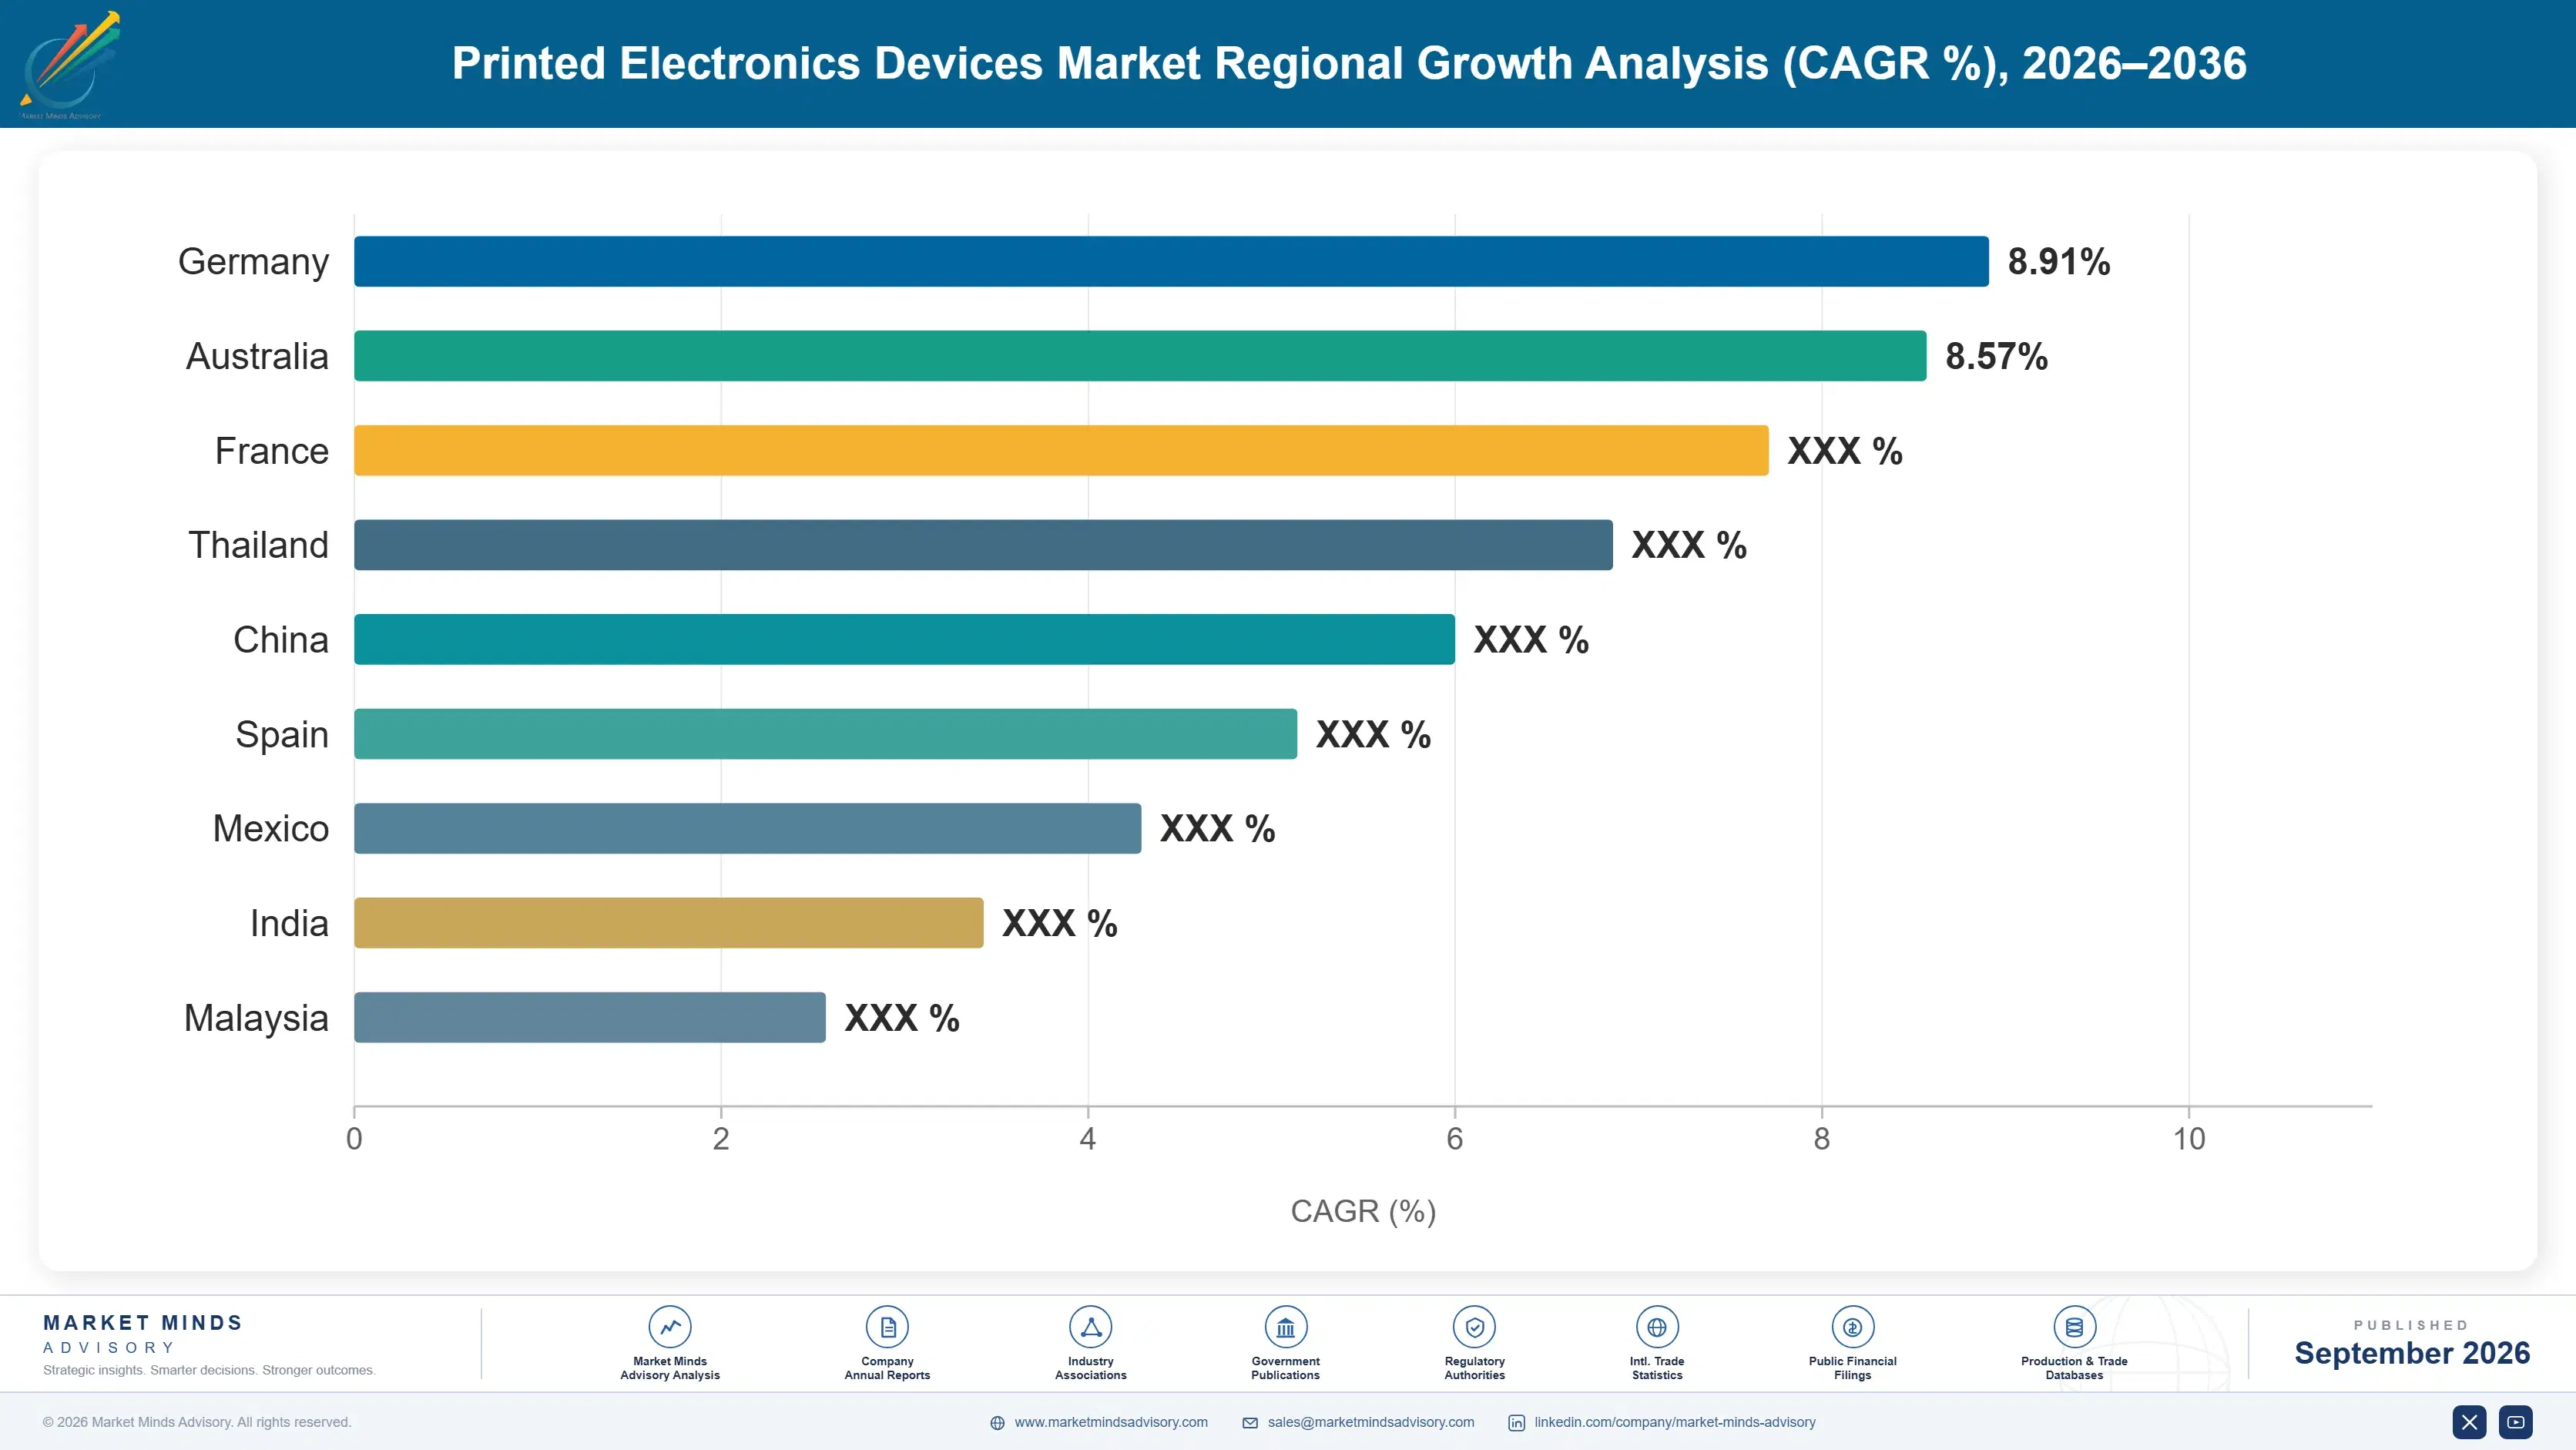
printed-electronics-devices-market-country-cagr-analysis-1789998170194

Where Printed Electronics Vendors Capture Margin

Bare component sales have thinned as manufacturing yield improves and competition intensifies among established vendors, so the strongest performers capture additional margin through design-win lock-in, custom calibration services, and long-term supply agreements layered on top of the base component sale rather than through unit price alone across every deployed customer program and product line.

Lock In Multi-Year Design-Win Supply Agreements

Vendors that secure early design-win status on a new wearable or medical device platform capture guaranteed multi-year supply volume worth 3 to 4 times the value of a single transactional order, since replacing a qualified component mid-production run requires the customer to repeat costly validation testing and regulatory recertification work. This lock-in also gives vendors visibility into customer production forecasts that inform their own manufacturing capacity planning decisions. Contract renewal conversations increasingly start from this design-win baseline directly rather than from a bare, uncertified component price quote each and every renewal cycle.
Market Impact: Design wins lock in 3 to 4x order value

Sell Custom Calibration and Integration Services

Vendors increasingly sell paid custom calibration and integration services to device manufacturers lacking in-house printed electronics engineering expertise, capturing a price premium of roughly 25 to 35 percent above the base component price for hands-on support through the entire product integration process. This service tier has become especially popular among smaller device manufacturers entering printed electronics for the first time without dedicated internal expertise. Renewal rates in these calibrated accounts run noticeably higher than the broader average seen across the entire customer base and entire full product portfolio and account tracked.
Market Impact: Calibration services add 25 to 35% more revenue

License Proprietary Ink Formulations to Smaller Manufacturers

Larger vendors that developed proprietary conductive ink formulations increasingly license the underlying material technology to smaller manufacturers lacking the research investment to develop it independently, capturing 10 to 15 percent of licensee revenue as an ongoing royalty stream that scales directly with the licensee's own production volume over time. This licensing model also extends the larger vendor's technology influence across the industry without direct manufacturing investment. Larger licensee accounts routinely pay well above this stated baseline figure once production volume scales meaningfully over sustained time and continued production growth overall.
Market Impact: Ink licensing captures 10 to 15% more royalty

Charge Volume-Tiered Pricing for Long-Term Supply Contracts

Vendors negotiate multi-year volume-tiered supply agreements with large consumer electronics and medical device customers, trading guaranteed order volume for pricing that still captures 15 to 20 percent more margin than spot-market component sales, since customers value supply security and consistent manufacturing yield highly enough to accept less aggressive price negotiation than a one-time transactional purchase would otherwise produce. This arrangement also locks customers into a specific vendor's material platform. Larger customer accounts with extensive product portfolios routinely exceed this baseline margin considerably each and every single contract renewal year overall.
Market Impact: Volume contracts capture 15 to 20% more margin

Who Controls the Margin Pool

CR5 sits at 32 percent, evaluated on annual printed electronics device revenue across each vendor's full product portfolio, reflecting a market genuinely more fragmented than most adjacent semiconductor categories given the still-emerging nature of production-scale manufacturing capability. DuPont holds the clearest lead given its deep materials science heritage and conductive ink manufacturing scale, though the gap to Molex has narrowed noticeably as flexible connector integration accelerates competition.
Competitive activity today centers on manufacturing yield and roll-to-roll production scalability rather than laboratory-scale prototype performance, since translating impressive demonstration results into commercially viable output remains the single largest barrier facing most developers in the category. DuPont, Molex, and Samsung Electronics have all expanded dedicated flexible sensor manufacturing capacity over the past two years, while smaller specialist vendors focus on niche medical applications larger vendors deprioritize.

Emerging pressure comes from Asian material suppliers offering lower-cost conductive inks and substrate materials, undercutting established Western vendors particularly in cost-sensitive consumer electronics applications where component cost matters more than premium performance specifications. Rankings are most likely to shift in the wearable sensor segment, where manufacturing yield and design integration expertise matter more than brand recognition alone, giving specialist regional entrants a genuine opening against established incumbents.
printed-electronics-devices-market-company-positioning-matrix-1789998170719

Competitive Moat and Risk Dimensions

DUPONT

Moat: Materials Science Manufacturing Heritage

DuPont's decades of materials science research and conductive ink manufacturing give it production scale and formulation expertise that smaller competitors cannot easily replicate, along with deep existing relationships with electronics manufacturers that ease cross-selling into printed sensor and battery categories across the entire industry today.
DUPONT

Risk: Slower Consumer Product Iteration

DuPont's materials-first organizational structure moves more slowly on consumer product iteration than device-focused competitors, occasionally costing it design wins to vendors offering faster prototyping and customization cycles for rapidly evolving wearable device requirements and specifications each product cycle, fiscal quarter, and full calendar year overall.
MOLEX

Moat: Flexible Connector Integration Expertise

Molex's deep expertise in flexible connector and interconnect design gives it a natural integration advantage when printed electronics components must interface with traditional rigid circuitry inside a finished consumer or medical device product across every category served, every design cycle, and every long-term customer relationship.
MOLEX

Risk: Narrower Materials Science Depth

Molex's connector and interconnect heritage leaves it with narrower proprietary materials science depth than DuPont, occasionally requiring it to license or partner for core conductive ink and substrate material technology rather than developing it fully and entirely independently in-house at a real, meaningful production scale.

Players Tracked

Prominent Players

DuPont
Molex
Samsung Electronics
LG Display
E Ink Holdings

Other Key Players

Thin Film Electronics
NovaCentrix
PragmatIC Semiconductor
Brewer Science
Heraeus
Henkel
BASF
Toray Industries
Panasonic
Fujifilm
Sun Chemical
Avery Dennison
Nissha Co.
ISORG
Applied Materials

Recent Developments

FEBRUARY 2026

DuPont Launches New Conductive Ink Formulation Platform

DuPont launched a new conductive ink formulation platform specifically optimized for wearable health sensor applications, featuring improved flexibility and durability under repeated mechanical stress conditions targeting the growing consumer wearable device market and its many device manufacturers operating worldwide today, this year, and going forward.
Signal: Confirms materials innovation remains central to competitive differentiation across leading vendor product roadmaps and strategies today.
SEPTEMBER 2025

Samsung Electronics Expands Flexible Sensor Production Capacity

Samsung Electronics expanded its flexible sensor production capacity at an existing manufacturing facility, targeting growing demand from both its own wearable device lineup and external customers seeking printed sensor components for their own competing consumer electronics products sold across markets globally, regionally, domestically, and internationally.
Signal: Shows leading electronics manufacturers continuing to vertically integrate printed sensor production capability broadly and quite quickly.
MAY 2025

Molex Acquires Printed Circuit Integration Startup

Molex acquired a smaller printed circuit integration startup to strengthen its flexible interconnect capability, adding specialized design expertise that closed a specific capability gap identified by device manufacturer customers evaluating competing platforms and other readily available integration approaches, vendors, technology providers, and specialized service partners.
Signal: Signals established connector vendors continuing to acquire specialized integration capability rather than build it themselves in-house.

Silver Ink Cost Behind Every Printed Device

Silver-based conductive ink accounts for roughly 35 percent of cost of goods sold for a typical printed electronics vendor, with the remainder split across substrate materials, printing equipment amortization, and quality testing expenses paid throughout the manufacturing process. Silver ink material costs concentrate heavily on global silver commodity pricing rather than manufacturer-specific production costs alone.
A 2025 surge in silver commodity pricing during a period of unusually high industrial and investment demand, documented in commodity pricing disclosures reviewed by MMA analysts, pushed conductive ink material costs up roughly 22 percent industrywide within a single year as available silver supply tightened sharply across multiple end markets competing for the same underlying raw material simultaneously. Vendors without hedging arrangements already in place absorbed the increase immediately.

Smaller printed electronics vendors relying entirely on spot-market silver purchases face far more cost volatility than the largest vendors that negotiate long-term hedging arrangements directly with commodity suppliers at meaningful volume. That negotiating advantage increasingly determines which vendors can guarantee stable pricing to device manufacturers who plan multi-year product roadmaps months or years in advance around a specific component's confirmed cost and availability.
printed-electronics-devices-market-cost-volatility-analysis-1789998170916

Hedge Silver Commodity Exposure Through Forward Contracts

Larger vendors negotiate forward purchasing contracts directly with silver commodity suppliers, locking in pricing for future delivery months or years in advance, shielding them from the sharp cost swings smaller vendors face during periods of unusually high commodity demand across the entire global industry each and every fiscal year. Larger customer volume commitments earn even better priority treatment and rates.

Develop Copper-Based Alternatives to Reduce Silver Dependence

Several vendors now develop copper-based conductive ink formulations as a lower-cost alternative to silver for applications where copper's slightly lower conductivity remains fully acceptable, reducing exposure to silver price volatility while maintaining adequate electrical performance for many mainstream consumer applications and product categories overall each year. This copper-substitution approach has become nearly standard industry practice.

Reduce Ink Volume Through Precision Deposition Techniques

Vendors increasingly invest in precision printing techniques that deposit conductive ink more efficiently with less material waste per unit produced, reducing overall silver consumption per device without compromising electrical performance or reliability across the finished product's expected service life and full warranty coverage period. Larger production volumes amplify these material savings considerably each year.

Portfolio Architecture for Margin Defence

Gross margin in printed electronics spreads widely depending on manufacturing yield and how much of the revenue comes from bare components versus design-win contracts and custom calibration services layered on top. A commodity printed component sold at competitive pricing clears margin well below what a fully qualified, design-win-locked device component commands, since the latter embeds specialized engineering and validation work that buyers pay a real, sustained premium to access reliably.
Volume and premium tiers pull vendors toward genuinely different customer bases and engineering investment levels. Volume players compete on low-cost, standard components sold broadly into consumer electronics applications, while premium players concentrate on medical device and industrial customers willing to pay substantially more for validated reliability, custom calibration, and long-term supply guarantees built in. Few vendors execute both strategies at once, since engineering investment and validation requirements diverge sharply.

High-value margin pools concentrate specifically in medical-grade validated components, proprietary ink formulation licensing, and long-term design-win supply agreements rather than in bare consumer electronics components, which increasingly function as a low-margin, high-volume entry point that funds the engineering infrastructure supporting the much higher-margin medical and licensed business built on top of that same underlying printing platform.

Volume / Commodity-Adjacent

Standard printed components sold at low, competitive pricing into consumer electronics applications, competing mainly on unit price, delivery lead time, and broad distributor availability across every region and market worldwide.
Gross Margin: 16-24%

Premium / Certified

Design-win-locked components bundled with custom calibration, validated reliability testing, and dedicated engineering support sold to large device manufacturer accounts across regulated industries and every major market, geography, country, and region.
Gross Margin: 34-42%

Sustainability / Regulatory / Next-Generation

Medical-grade validated sensors and biosensors meeting emerging regulatory clearance and biocompatibility standards demanded by device manufacturers pursuing clinical diagnostic and continuous patient monitoring applications globally, domestically, regionally, locally, and everywhere else.
Gross Margin: 42-50%
printed-electronics-devices-market-portfolio-architecture-1789998171431

High-value Sub-segments and Strategic Watch-out

Medical-Grade Sensor Validation

The highest-margin pool in the category, growing fastest as medical device manufacturers increasingly demand pre-validated, regulatory-cleared sensors rather than pursuing costly independent validation themselves after purchase and integration. Adoption keeps rising sharply among manufacturers with the largest deployed product portfolios. Larger manufacturers with continent-wide distribution drive most of this demand.
Gross Margin: 46-54%

Proprietary Ink Formulation Licensing

High-value, technology-driven revenue commanding strong margin as smaller manufacturers license proprietary conductive ink formulations from larger competitors rather than developing the capability independently from scratch at considerable cost and lost engineering time. Adoption keeps rising sharply among the largest device manufacturer accounts and their broader product portfolios.
Gross Margin: 38-46%

Commodity Consumer Electronics Components

The largest volume core of the market, mature and increasingly low-margin, facing continued commoditization pressure as Asian material suppliers steadily close the technical gap on both price and overall product quality metrics tracked closely. This tier increasingly funds premium research investment elsewhere in the business.
Gross Margin: 16-24%

Manufacturing Yield Risk Segment

A strategic watch-out segment where persistent manufacturing yield challenges keep printed electronics confined to premium applications, threatening to limit broader mainstream cost-competitive market penetration considerably over time. Vendors must improve yield consistently to capture broader mainstream market opportunity. This trend eases as component costs keep falling steadily each year.
Gross Margin: N/A

Why Design Wins Last Product Cycles

A printed electronics design win behaves more like an annuity than a one-time component sale once it becomes embedded inside a customer's validated end product, since re-qualifying an entire product design around a competing component requires repeating regulatory validation, reliability testing, and manufacturing process qualification from scratch. That requalification cost alone can exceed the annual value of the underlying component business many times over across a multi-year product lifecycle and subsequent generations.
Stickiness varies sharply by end-use vertical and validation depth achieved during initial design. Medical device customers show the deepest lock-in, since re-certifying a design around a new component can take a year or longer and cost hundreds of thousands of dollars in regulatory validation work. Consumer electronics customers show comparatively shallower stickiness, since switching a standard, uncertified component requires far less validation effort and regulatory overhead overall.

Buyer profiles are shifting generationally as dedicated flexible electronics engineering teams, rather than general component procurement staff treating printed electronics as one purchasing decision among many, increasingly drive supplier selection decisions. This generational shift favors vendors offering strong manufacturing yield track records and custom calibration support over vendors competing primarily on raw component price and basic specifications alone.
printed-electronics-devices-market-end-use-penetration-index-1789998171923

Where to Compete in Printed Electronics

These are among the four positions where our research anticipates prominent divergence between winners and laggards over the coming forecast period. Each is grounded in the demand model, the regulatory perimeter, and the announced capacity pipeline.
01 / MANUFACTURING YIELD INVESTMENT

Solve yield challenges before rivals scale commercial production

Manufacturing yield remains the single largest barrier separating laboratory demonstration from genuine commercial success in this category, yet many developers still underinvest in production process engineering relative to core material research, development priorities, and long-term roadmaps. A challenger investing early in genuine yield optimization can win commercial-scale contracts before larger incumbents close this specific manufacturing gap through their own dedicated investment, engineering, and decisive action. That window narrows measurably each year as roll-to-roll manufacturing techniques mature broadly across the industry.
02 / MEDICAL VALIDATION FOCUS

Build medical-grade validation depth before generalists catch up

Medical-grade validated sensors already command the highest margin in the category, yet most printed electronics developers still treat regulatory validation as the customer's problem to solve independently after purchase and full product integration work is complete. A challenger investing early in genuine validation and clinical testing infrastructure can lock in medical device accounts before larger incumbents build comparable capability internally through their own dedicated investment. That window narrows measurably each year as validation support becomes a standard vendor offering broadly.
03 / SILVER COST HEDGING STRATEGY

Hedge silver commodity exposure before the next price shock hits

The 2025 silver commodity pricing surge demonstrated clearly how exposed unhedged vendors are to sudden raw material cost spikes entirely beyond their direct control or influence over available global commodity markets, supply, and price movements. Vendors that hedge silver exposure through forward contracts or develop copper-based alternatives now protect their own margin against the next inevitable shock far better than competitors dependent on unhedged spot-market purchasing alone and acting too slowly. This decision increasingly separates resilient vendors from fragile, exposed ones.
04 / FOLDABLE DEVICE PARTNERSHIP

Partner with device makers early on foldable form factor design

Foldable consumer electronics adoption is accelerating rapidly, yet many printed electronics vendors still lack established design partnerships with the major device manufacturers driving this specific product category forward across the broader global consumer electronics industry today. A vendor building early design partnerships now can secure long-term supply positions before device manufacturers standardize on a competitor's flexible circuit and display technology platform entirely, completely, and decisively. This partnership window narrows as foldable device architectures mature and standardize broadly across the industry.

Engagement Snapshot From the Field

A live engagement with an industry participant carrying material or product regulatory and market exposure ahead of a defining policy shift, showing how our research translates into a defensible multi-year portfolio strategy.
MARKET MINDS ADVISORY · CLIENT ENGAGEMENT SUMMARY
Printed Electronics Devices Producer Strategic Portfolio Review and Transition Roadmap 2026·Investment Scenario on Printed Electronics Devices Exposure Evaluation 2025-26
CLIENT PROFILE
The client designs consumer wearable health monitoring devices sold through direct-to-consumer and retail channels, reporting client-reported annual revenue of approximately $280 million (client-reported, unverified by MMA). Facing a strategic decision to add continuous sweat-based hydration monitoring to its next flagship product generation, leadership sought an independent evaluation of printed sensor vendors before committing to a multi-year design partnership and manufacturing agreement.
STRATEGIC CHALLENGE
Three candidate vendors offered printed sensors with meaningfully different manufacturing yield track records, calibration accuracy, and pricing structures, and the client's own hardware engineering team lacked the specific manufacturing process expertise needed to independently assess which vendor could reliably deliver commercial-scale production volume without significant yield-related delays and cost overruns.
MMA APPROACH
MMA analysts evaluated each vendor's manufacturing yield track record against comparable wearable sensor products already in commercial production, assessed sensor calibration accuracy against independent reference measurements, and modeled total cost of ownership including component pricing, expected yield losses, and time to commercial-scale production under three realistic development timelines and scenarios.
KEY FINDINGS
  1. The vendor with the most impressive laboratory demonstration actually showed the weakest manufacturing yield track record, running roughly 15 percentage points below the eventual selected vendor.
  2. Sensor calibration accuracy varied less than expected across all three vendors, making manufacturing yield and design-win pricing the more decisive factors in vendor selection overall.
  3. None of the three vendors had previously supported a wearable product targeting the client's specific combination of sensing requirements without significant additional customization work.
  4. The selected vendor's design-win pricing structure, once modeled against expected production volume, saved the client roughly $2.1 million (client-reported, unverified by MMA) over three years.
CLIENT PROFILE
The client designs consumer wearable health monitoring devices sold through direct-to-consumer and retail channels, reporting client-reported annual revenue of approximately $280 million (client-reported, unverified by MMA). Facing a strategic decision to add continuous sweat-based hydration monitoring to its next flagship product generation, leadership sought an independent evaluation of printed sensor vendors before committing to a multi-year design partnership and manufacturing agreement.
STRATEGIC CHALLENGE
Three candidate vendors offered printed sensors with meaningfully different manufacturing yield track records, calibration accuracy, and pricing structures, and the client's own hardware engineering team lacked the specific manufacturing process expertise needed to independently assess which vendor could reliably deliver commercial-scale production volume without significant yield-related delays and cost overruns.
MMA APPROACH
MMA analysts evaluated each vendor's manufacturing yield track record against comparable wearable sensor products already in commercial production, assessed sensor calibration accuracy against independent reference measurements, and modeled total cost of ownership including component pricing, expected yield losses, and time to commercial-scale production under three realistic development timelines and scenarios.
KEY FINDINGS
  1. The vendor with the most impressive laboratory demonstration actually showed the weakest manufacturing yield track record, running roughly 15 percentage points below the eventual selected vendor.
  2. Sensor calibration accuracy varied less than expected across all three vendors, making manufacturing yield and design-win pricing the more decisive factors in vendor selection overall.
  3. None of the three vendors had previously supported a wearable product targeting the client's specific combination of sensing requirements without significant additional customization work.
  4. The selected vendor's design-win pricing structure, once modeled against expected production volume, saved the client roughly $2.1 million (client-reported, unverified by MMA) over three years.
RECOMMENDED STRATEGY
Phase 1: Phase 1 (Months 1 to 3): Finalize sensor selection and begin joint manufacturing qualification with the selected vendor's production engineering team immediately. Phase 2: Phase 2 (Months 4 to 9): Complete clinical accuracy validation testing and scale manufacturing yield to commercial production volume targets. Phase 3: Phase 3 (Months 10 to 14): Launch the flagship product following validation completion and begin volume production under the negotiated design-win pricing.
OUTCOME
The client selected the recommended vendor and achieved commercial-scale manufacturing yield targets roughly 2 months faster (client-reported, unverified by MMA) than its original internal timeline projected. The flagship product launched on schedule with continuous hydration monitoring as its headline differentiating feature and primary marketing focus.

Frequently Asked Questions

Foundational context covering the market sizes, CAGR, scope, country, region and competition that inform every finding below. This section is provided to cover basics and most often pre-purchase conversations, answered from the MMA Primary Research Dataset.

What is the current size of the Printed Electronics Devices Market?

The Printed Electronics Devices Market reached $12.8 billion in base-year value in 2025, spanning printed sensors, batteries, RFID tags, and flexible displays sold worldwide today.

How large will the Printed Electronics Devices Market be by 2036?

The market is projected to reach $40.35 billion by 2036, expanding roughly 2.84 times its 2026 value as manufacturing yield improves and adoption broadens considerably.

What is the CAGR for the Printed Electronics Devices Market 2026 to 2036?

The market is forecast to grow at a compound annual growth rate of 11.0 percent between 2026 and 2036, driven by wearable health sensors and foldable devices.

Which segment is growing fastest?

Printed and flexible sensors lead all segments at a 16.0 percent CAGR, roughly 1.45 times the overall market rate, as wearable health monitoring devices expand adoption.

Who are the major companies in the Printed Electronics Devices Market?

DuPont, Molex, Samsung Electronics, LG Display, and E Ink Holdings lead the competitive field, evaluated on annual printed electronics device revenue and their full product portfolio.

Which country is growing fastest?

South Korea leads all countries tracked at a 13.5 percent CAGR, fueled by its concentration of flexible display and consumer electronics manufacturing capacity nationwide today.

Report Segmentation Architecture

The full report scope spans multiple orthogonal segmentation dimensions, with cross-tabulated demand data provided for each dimension pair. Coverage extends further to regional breakdowns, trend trajectories, and the competitive detail needed to support segment-level decision-making.

By Primary Market Dimension

  • Printed and Flexible Sensors
  • Printed Batteries and Energy Storage
  • Printed RFID Tags and Antennas
  • Flexible and Printed Displays
  • Printed Circuit and Interconnect Devices
  • Conductive Inks and Printed Electrodes

By End-Use Industry

  • Consumer Electronics
  • Healthcare and Medical Devices
  • Automotive
  • Retail and Packaging
  • Industrial and Manufacturing

By Commercial Dimension

  • Direct Component Sale
  • Design-Win Supply Agreement
  • Custom Calibration Service
  • Material Licensing Arrangement

By Region

  • North America
  • Western Europe
  • East Asia
  • South Asia and Pacific
  • Latin America
  • Middle East and Africa
  • Eastern Europe

Scope, Methodology, and Coverage

Every figure in this report is reproducible from documented input assumptions. The scope below maps the historical period, the forecast horizon, the segmentation dimensions, and the countries covered, alongside the underlying primary and qualitative methodology.
Historical Period
2020 to 2025
Forecast Period
2026 to 2036
Base Year
2025 (USD billions; MMA Primary Research Dataset, September 2026)
Market Definition
The Printed Electronics Devices Market covers electronic components and devices manufactured using printing techniques including inkjet, screen, and gravure printing to deposit conductive, semiconductive, or dielectric materials onto flexible or rigid substrates. It excludes traditional silicon-based semiconductor manufacturing, conventional rigid printed circuit board assembly, and non-electronic printed materials.
Quantitative Units
USD billions (current prices); device unit shipment volume where applicable
Segmentation Dimensions
By Primary Market Dimension; By End-Use Industry; By Commercial Dimension; By Region
Regions Covered
North America, Western Europe, East Asia, South Asia and Pacific, Latin America, Middle East and Africa, Eastern Europe
Countries Covered
USA, China, Germany, France, UK, Japan, South Korea, India, Australia, Canada, Brazil, Mexico, Indonesia, Vietnam, Thailand, Malaysia, UAE, Saudi Arabia, South Africa, Nigeria, Turkey, Poland, Netherlands, Italy, Spain, Sweden, Switzerland, Argentina, Colombia, Singapore, and additional markets relevant to this sector
Key Companies Profiled
DuPont, Molex, Samsung Electronics, LG Display, E Ink Holdings, Thin Film Electronics, NovaCentrix, PragmatIC Semiconductor, Brewer Science, Heraeus, Henkel, BASF, Toray Industries, Panasonic, Fujifilm, Sun Chemical, Avery Dennison, Nissha Co., ISORG, Applied Materials
Quantitative Methodology
Primary survey, n=3,800 respondents, Q4 2025, six countries; demand-side model with trade association cross-validation
Qualitative Methodology
47 expert interviews, Q4 2025; applied to validate demand model assumptions, identify emerging dynamics, and assess competitive positioning
Report Format
PDF and XLSX data workbook (Word format preview document)
Publisher
Market Minds Advisory
Report Code
MMA-2026-TEC-217
Published
September 2026
Contact
sales@marketmindsadvisory.com | www.marketmindsadvisory.com

Purchase the full Printed Electronics Devices Market Report (2026 to 2036).

This report delivers a comprehensive assessment of the Printed Electronics Devices Market from 2026 through 2036, covering sizing, segmentation, and regional demand patterns across all seven world regions tracked. It profiles twenty companies competing on manufacturing yield depth, materials science innovation, and design-win lock-in rather than laboratory-scale performance alone. Readers get detailed analysis of revenue levers, silver ink cost exposure, and portfolio margin economics specific to this hardware category and its buyers. The report closes with a strategic verdict identifying exactly where new capital should concentrate over the coming decade.
Full seven-region market sizing and forecast data
Twenty-company competitive profiling and moat analysis
Segment-level CAGR and market share breakdown
Silver cost exposure and mitigation pathway analysis
Revenue lever and portfolio margin economics detail
Anonymized client case study with recommended strategy

Built For The People Who Decide

From boardroom strategy to bench-side execution, this report is read cover-to-cover by leaders shaping the next decade of their industry, turning demand scenarios, market dynamics and valuation benchmarks into decisions.
CXOs/ Presidents/ VPs/ Managers
M&A and Corporate Development
Strategy Teams and R&D Heads
Procurement and Product Directors
Regulatory and Compliance Leaders
Investor Relations and Equity Analysts