Market Minds Advisory
Premix Packaging Machine Market

Premix Packaging Machine Market: Changeover Time Is The Constraint, Not Throughput

Ready-to-drink brands now launch flavour variants faster than any line was ever designed to accommodate, so machines built for long production runs spend their day being cleaned and reconfigured instead.

Lead Analyst

Published

September 2026

Make Smarter Decisions with Customized Research Insights

Request a free sample report and evaluate market opportunities, growth trends, and competitive dynamics relevant to your business needs.

2025 MARKET VALUE$2.0BMarket Size 2025
2036 FORECAST VALUE$4.7BBase Case , 2026 to 2036
CAGR 2026 TO 20368.0 %Bull 9.2% / Bear 6.8%
INCREMENTAL OPPORTUNITY$2.5BNet 10- year value creation
EXPANSION MULTIPLE2.16x2036 value over 2026 base
Strategic Levers
M&A Pipeline
Regional Outlook
Country Rankings
Competitive Intelligence
Segmental Deep-dive
Call-Us : 91 93563 13602

Executive Snapshot and Market Trajectory

Lines in this category were designed for long runs of a single product. Ready-to-drink brands now launch flavour variants continuously, so the same equipment spends its shift being cleaned and reconfigured rather than filling, and changeover time has replaced throughput as the binding constraint.
North America takes 31% of value because the recent expansion in premixed ready-to-drink beverages happened there and machinery demand follows new line capacity rather than existing consumption. East Asia at 27% is close behind on a category Japan has run at scale for three decades. Rapid changeover and format systems grow at 12.0%, half again the market rate of 8.0%. Consumption and capacity investment sit in different places.
Concentration sits at 36% and the technical difficulty is understated everywhere. Alcohol, dissolved carbon dioxide and high sugar make a genuinely hard fill, and spirits-based products cannot be pasteurised the way beer can. Filling therefore has to be effectively sterile or the product needs preservatives, which is a formulation decision the equipment choice quietly forces. Brand teams rarely realise the equipment decision reaches that far into the recipe. Recipe and equipment are decided together.
Market Definition
The market covers machinery used to fill, close and package premixed ready-to-drink beverages into cans, bottles and kegs, including counter-pressure filling systems, can seaming and closing systems, carbonation and blending systems, rapid changeover and format systems, inline inspection and seam control, and small-batch and mobile canning units. Container manufacture, secondary packaging and palletising equipment, brewing and distilling process plant, and dispensing equipment for on-premise service are excluded. Contract packing services fall outside scope.
Base Year Value
$2.0B in 2025 (MMA Primary Research Dataset, August 2026)
Forecast Period
2026 to 2036, eleven discrete annual values
CAGR
8.0% base case. Bull 9.2%. Bear 6.8%.
Fastest Growth Segment
Rapid Changeover and Format Systems: 12.0% CAGR
Fastest Growth Country
India: 10.2% CAGR
Fastest Growth Region
South Asia and Pacific: 10.0% CAGR
Largest Region
North America: 31% of 2025 global value
Market Leaders
Krones, KHS Group, Sidel, Barry-Wehmiller, Sacmi. Source: MMA Analysis based on disclosed beverage and liquid packaging machinery revenue, company annual reports 2025.
Primary Survey
n=3,800 procurement and R&D decision-makers, Q4 2025, six countries
Methodology
Demand-side build-up, cross-validated against public data, 47 expert interviews

Premix Packaging Machine Market Forecast Scenarios

premix-packaging-machine-market-size-forecast-scenario-1787696170752
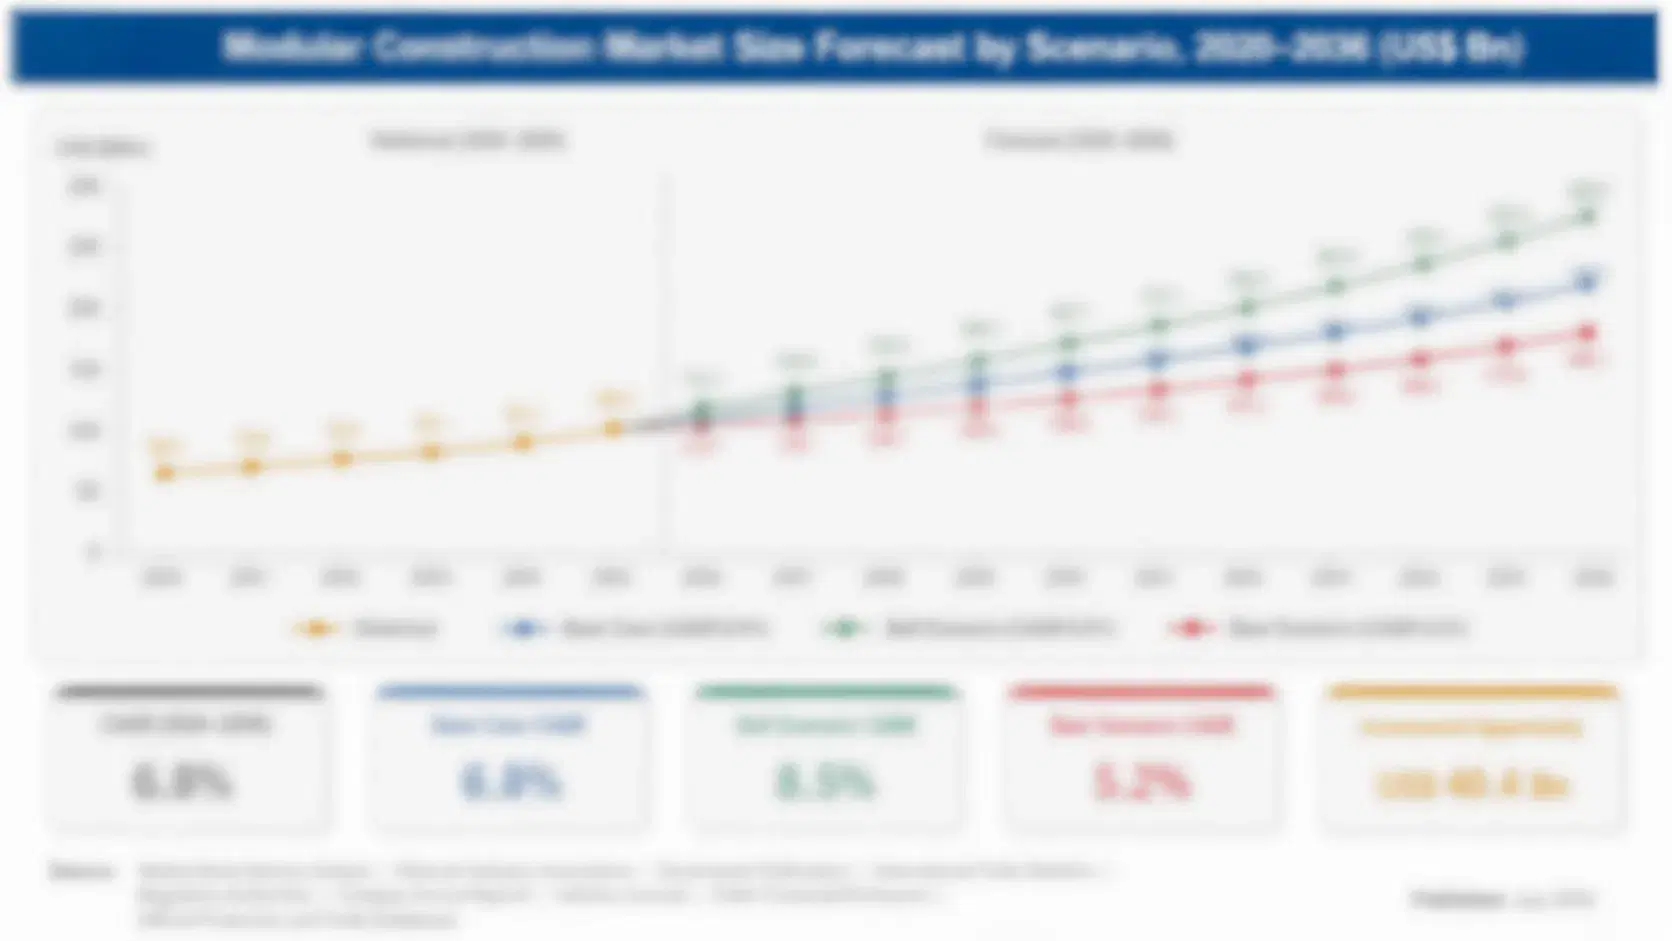
Growth from 2020 to 2025 ran at 7.0% and a category expansion drove it rather than any equipment advance. Premixed ready-to-drink beverages grew quickly through the period, and because distillers held no canning capability and brewers held no spirits handling, the capacity was built in contract packing facilities instead. Machinery demand therefore concentrated among co-packers rather than among the brands whose names appeared on the cans.
The 8.0% base case rests on three mechanisms. Flavour variant proliferation continues, which makes changeover capability worth more than nominal filling speed on almost every line being specified now. Seam inspection is being taken seriously after leakage failures that appeared weeks after production reached trade. And Asian ready-to-drink volumes keep growing from a mature Japanese base and a rapidly expanding Chinese and Indian one. Each mechanism works independently of the others entirely.
The bull case at 9.2% turns on premixed spirits gaining regulatory and retail parity with beer in more markets, which would open shelf space and pull line investment forward. The bear case at 6.8% is category growth normalising after an unusual expansion, which would leave co-packers holding capacity built for volumes that stopped arriving and no appetite for further equipment.

Built For Runs That No Longer Happen

A canning line specified five years ago assumed long runs of a single recipe. Ready-to-drink brands now maintain flavour ranges that turn over constantly, and a line running four variants a day spends around four hours per changeover cleaning, purging and reconfiguring. Nominal speed matters little when the machine is stopped a third of the shift. Builders quoting cans per minute answer a question customers abandoned.
FIVE-FIRM CONCENTRATION36%Share of beverage packaging machinery revenue held by leading builders
MID-SPEED LINE COST$3.4 millionTypical installed cost of a mid speed canning line
TOP CONSUMING COUNTRYUSA 26%American share of global premix packaging machinery demand annually
AVERAGE CHANGEOVER TIME4 hoursTypical duration to clean and reconfigure between product variants
CO-PACKER VOLUME SHARE62%Volume filled by contract packers rather than brand owners
SEAM FAILURE DETECTION LAG5 weeksTypical delay before a defective closure shows as leakage
The fill itself is harder than the category's marketing suggests. Alcohol lowers surface tension and promotes foaming, dissolved carbon dioxide must be held through the fill, and high sugar loads complicate cleaning between variants. Spirits-based products also cannot be pasteurised the way beer can without damaging flavour, so either the filling environment is effectively sterile or the formulation carries preservatives. The equipment specification quietly determines that product decision.
Closure quality is where failures actually originate and where investment is thinnest. A double seam marginally outside specification does not fail on the line; it leaks slowly and shows up in trade around five weeks later, by which point substantial stock is affected. Inline seam inspection catches it and many contract packers treat that equipment as optional. Roughly 62% of category volume is filled by co-packers.
"Everybody sells cans per minute and the customer is running four flavours a day. The machine that changes over in forty minutes beats the faster one every single time."
Director, Beverage Packaging Machinery Practice · MMA Industrial Equipment Practice · August 2026

Market Trends

Changeover Capability Displaces Filling Speed As Specification

Flavour ranges that turn over constantly mean a line runs several variants a day, and at around four hours per changeover the machine spends a large part of the shift stopped. Rapid changeover design, tool-free format parts and clean-in-place routines built for frequent switching therefore deliver more output than raw speed does. Growth at 12.0% follows that reasoning directly. Builders still quoting nominal cans per minute are answering the question customers asked before the category fragmented into permanent variant launches. The category fragmented into permanent variant launches. Format handling is the answer.
Market Impact: Concentrates 62% of category volume

Seam Inspection Moves From Optional To Specified

A double seam slightly outside specification leaks slowly rather than obviously, and the failure surfaces in trade roughly five weeks after production when considerable stock is already distributed. Inline seam inspection catches the defect at the machine, and contract packers historically treated it as an optional extra rather than a control. Growth at 10.2% reflects brands beginning to specify it in packing agreements, since the recall exposure sits with them while the equipment decision sat with somebody else entirely. Contracts rather than packer preference are driving it. Packers evaluate cost, brands evaluate risk.
Market Impact: Draws on 30 years of maturity

Market Opportunities and Growth Drivers

Contract Packers Rather Than Brands Buy The Machinery

Distillers held no canning capability and brewers held no spirits handling, so the premixed category was built inside contract packing facilities rather than at the brand owners whose names appear on the cans. Roughly 62% of volume is filled that way. Machinery demand therefore concentrates among co-packers, who buy on utilisation and flexibility rather than on brand requirements. Builders selling to brand owners are calling on customers who specify the product and never sign an equipment purchase order at all. Co-packers evaluate on multi-category flexibility instead. Brands sign no equipment orders.
Market Impact: Forces choice between 2 routes

Japanese Ready-To-Drink Maturity Anchors Asian Demand

Japan has run premixed ready-to-drink beverages as a mainstream category for three decades, considerably longer than any Western market, which gives the region an installed base that replaces on predictable cycles rather than expanding erratically. Chinese and Korean consumption is growing quickly alongside it. That combination of mature replacement demand and genuine expansion makes East Asian machinery purchasing steadier than the American market, where capacity was added rapidly during a category surge and now faces a normalisation question. Replacement demand there is genuinely predictable. Expansion continues alongside it steadily. Both drivers compound.
Market Impact: Risks idling 62% co-packer capacity

Market Restraints and Challenges

Alcohol And Carbonation Make A Genuinely Hard Fill

Alcohol lowers surface tension and promotes foaming while dissolved carbon dioxide must be held through the filling cycle, and high sugar loads complicate cleaning between variants considerably. Root cause is physical chemistry rather than any equipment shortcoming. The commercial impact is that spirits-based products cannot be pasteurised as beer is without damaging flavour, so either the filling environment is effectively sterile or the formulation carries preservatives. Mitigation runs through aseptic and ultra-clean filling, which costs considerably more and which brand teams frequently discover late. Brand teams discover the trade-off late.
Market Impact: Cuts 4 hour changeovers substantially

Capacity Was Built For Growth That May Normalise

Contract packers added canning capacity rapidly during an unusual category expansion, and much of that equipment was specified for volumes that assumed continued growth at the same rate. Root cause is that co-packers invest against contracted volume that brands can withdraw at short notice. The commercial impact is that a category normalisation leaves capacity idle and removes appetite for further machinery entirely, which affects builders more sharply than it affects anybody else. Mitigation involves flexible lines serving several categories, which is what changeover capability actually buys. Flexibility is what changeover capability actually buys.
Market Impact: Prevents 5 week failure lags
3 additional market trends, 4 additional growth drivers, and 2 additional restraints and challenges are covered in the full report. Contact sales@marketmindsadvisory.com to access the complete intelligence.

Segment CAGR and Growth Architecture

Segmentation follows machine function: what each system does to the product or the container within the line, rather than which beverage runs through it or who owns the facility. Six functions cover the market without overlap, from counter-pressure filling through to mobile canning units. Beverage type and commercial arrangement are treated separately here. Both cut across all six functions.
premix-packaging-machine-market-market-share-analysis-1787696170927

Rapid Changeover and Format Systems

Tool-free format parts, automated recipe handling and clean-in-place routines designed for frequent switching address the constraint that actually limits output on a modern premix line. At around four hours per changeover and several variants a day, a machine spends a large share of its shift stopped regardless of how fast it fills. Growth at 12.0%, half again the market rate of 8.0%, follows that arithmetic rather than any advance in filling technology. Builders quoting nominal cans per minute are still answering the question customers asked before flavour ranges began turning over continuously. Effective output is a calculation somebody has to build from the customer's own production plan. Very few builders construct it.
CAGR 12.0%

Inline Inspection and Seam Control

A double seam slightly outside specification does not fail visibly at the machine; it leaks slowly and reaches trade before anybody notices, typically around five weeks after production when substantial stock has already shipped. Inline inspection catches it immediately. Growth at 10.2% comes from brands writing the requirement into contract packing agreements, since the recall exposure sits with the brand while the equipment decision historically sat with the packer. That misalignment is being corrected contractually rather than through any change in how packers themselves evaluate quality investment. Roughly 62% of volume is packed by businesses that did not design the product and carry none of the recall exposure. Contracts are correcting that.
CAGR 10.2%
Full segment breakdown across 6 segments available in the complete report.

Regional Architecture and Country Demand Map

Geography follows where new line capacity is being installed rather than where the beverages are consumed, and the two differ considerably. North America leads on recent capacity addition, East Asia on a mature installed base replacing on cycle, and South Asia grows fastest overall. Consumption and capacity investment diverge sharply.

North America

American demand reflects a category expansion that added canning capacity rapidly, mostly inside contract packing facilities rather than at brand owners who lacked the licences and the equipment to fill their own products. Roughly 62% of volume is packed that way, which makes co-packers the machinery customer and brands the specification writer. Flavour variant proliferation is more extreme here than anywhere, which pushed changeover capability to the front of every specification. Canadian demand follows similar patterns at smaller scale. Mexican capacity serves both domestic consumption and export filling for American brands. Flavour variant proliferation is more extreme here than anywhere else, which pushed changeover capability to the front of every specification written recently.
Share: 31% | CAGR: 7.2% (2026 to 2036)

Western Europe

European ready-to-drink volumes are smaller relative to beer and wine than in America, and the machinery base reflects a beverage industry that was already well equipped before the premixed category expanded. German, Italian and French builders supply lines used worldwide, which makes the region a larger producer of this equipment than consumer of it. Regulatory treatment of premixed spirits varies considerably between countries and shapes where filling capacity locates. Energy costs weigh on the region's machinery manufacturing, and European builders compete increasingly against Asian equipment on price. The region builds considerably more of this equipment than it consumes, which makes European builders exporters competing increasingly against Asian machines on price.
Share: 21% | CAGR: 6.4% (2026 to 2036)
Regional intelligence for 5 additional markets available in the complete report: East Asia, South Asia and Pacific, Latin America, Middle East and Africa, Eastern Europe. Contact sales@marketmindsadvisory.com.
premix-packaging-machine-market-country-cagr-analysis-1787696171109

Selling Uptime Not Line Speed

Changeovers run around four hours against several variants a day, roughly 62% of volume sits with co-packers, and seam failures surface five weeks after production. Four levers work on changeover, quality exposure, customer identification and fill chemistry rather than on nominal throughput, which nobody is buying on. Throughput arguments reach none of those four problems.

Quote Effective Output Rather Than Nominal Speed

A line running several variants a day at around four hours per changeover spends a large share of its shift stopped, which makes nominal filling speed close to meaningless as a purchasing criterion. Builders who calculate effective daily output from a customer's own variant schedule reframe the comparison entirely and frequently win against faster machines. The work is building that calculation from the customer's production plan rather than developing anything, and remarkably few builders do it as a matter of course. Roughly 4 hours per changeover across several variants decides the day's output, not the filler's rated speed.
Market Impact: Recovers around 4 hours of changeover time daily

Sell Seam Inspection To Brands Not Packers

Seam defects surface in trade around five weeks after production and the recall exposure sits with the brand owner, while the equipment purchase decision sits with a contract packer filling roughly 62% of category volume. Selling inspection capability to packers means selling a cost to somebody who does not carry the risk. Reaching brand quality functions puts the requirement into packing agreements instead, which converts an optional extra into a contractual specification the packer must then satisfy. The packer then has to satisfy it regardless of whether they wanted the equipment.
Market Impact: Addresses a 5 week defect detection lag properly

Call On Contract Packers Rather Than Brand Owners

Roughly 62% of premixed volume is filled by contract packers who buy machinery on utilisation and flexibility, while brand owners specify the product and never sign an equipment order. Builders whose commercial organisation calls on beverage brands are addressing customers who cannot purchase what they are being shown. Redirecting coverage toward co-packers reaches the actual buyer, and those buyers evaluate very differently, weighing multi-category flexibility above any single product's requirements. Around 62% of volume passes through those facilities, and their evaluation criteria differ completely from a brand's. Flexibility beats specification there.
Market Impact: Reaches the buyers of 62% of category volume

Advise On Fill Chemistry Before Specification Closes

Alcohol promotes foaming, dissolved carbon dioxide must survive the fill and spirits-based products cannot be pasteurised as beer is, which leaves either effectively sterile filling or a formulation carrying preservatives. Brand teams frequently discover that trade-off after the recipe is fixed. Builders who raise it during specification shape a decision that determines which equipment is even viable, and that positions them inside the product development conversation rather than inside a later equipment tender. That is a choice between 2 quite different routes, and equipment determines which remains available. Raising it early positions the builder inside development.
Market Impact: Frames a choice between 2 distinct filling routes

Who Controls the Margin Pool

Measured on disclosed beverage and liquid packaging machinery revenue, the five leading builders hold a CR5 of 36%, which is moderate and reflects a market spanning high speed lines and a large population of small-format equipment suppliers. Krones, KHS and Sidel dominate high speed installations, while Barry-Wehmiller and a set of specialist builders supply the seaming, inspection and small-batch equipment that the category's fragmentation created. Category fragmentation created a small format segment nobody planned for.
Three contests define activity. High speed line supply competes on integration and service network across long installations. Changeover and format capability competes on effective output rather than nominal speed, which is a different calculation entirely. Small-batch and mobile canning competes on capital cost and simplicity for producers who could never justify a full line. A builder strong in one of those three contests frequently competes in none of the others.

Pressure comes from Chinese and Indian builders supplying lower specification equipment at prices European manufacturers cannot approach in price-sensitive markets. Rankings shift where changeover capability decides a purchase, since that criterion favours builders who redesigned format handling rather than those who improved filling speed. Format handling redesign is what wins now.
premix-packaging-machine-market-company-positioning-matrix-1787696171289

Competitive Moat and Risk Dimensions

KRONES

Moat: Integrated Line Engineering Depth

Krones supplies complete lines including filling, seaming, labelling and conveying engineered to work together, which matters enormously when a customer wants one supplier accountable for whether the whole installation runs. That integration capability took decades to assemble across several product families. A specialist builder leaves the customer coordinating interfaces between suppliers who blame one another.
KRONES

Risk: Small Format Segment Absence

The premixed category created a large population of small producers who could never justify a high speed line and who buy compact or mobile canning equipment instead. That segment is served by specialist builders with entirely different cost structures. Line engineering depth provides no advantage where the customer's whole budget is smaller than the engineering study on a full installation.
BARRY-WEHMILLER

Moat: Seaming And Closure Technical Position

Barry-Wehmiller holds deep seaming and closure capability, which is where premix packaging failures actually originate and where the technical difficulty concentrates rather than in the fill itself. Seam quality expertise is genuinely specialised and slow to build. A line builder competing on filling performance still needs a seamer that holds specification consistently, which is a narrower discipline than it appears.
BARRY-WEHMILLER

Risk: Line Integration Dependency

Supplying a critical station rather than a complete line means depending on integrators and line builders to specify the equipment into installations they control. Customers seeking single-supplier accountability push toward complete line vendors regardless of individual station quality. A superb seamer inside somebody else's line captures less value than the same capability inside an owned installation would.

Players Tracked

Prominent Players

Krones
KHS Group
Sidel
Barry-Wehmiller
Sacmi

Other Key Players

CFT Group
Comac
Ferrum Packaging
JBT Marel
GEA Group
Coesia
Shibuya Corporation
Mitsubishi Heavy Industries Machinery Systems
Cask Brewing Systems
Wild Goose Filling
ABE Beverage Equipment
Tetra Pak
Ronchi Mario
Palmer Canning Systems
Codi Manufacturing

Recent Developments

FEBRUARY 2025

Contract packer specifies rapid changeover line for variant production

A beverage contract packer specified a canning line built around rapid format changeover rather than maximum filling speed, a capital procurement rather than any partnership. The stated reason was that variant production had made effective daily output depend on changeover duration rather than nominal speed.
Signal: Effective output is replacing nominal speed as the purchasing criterion, which reorders how these lines get compared.
JUNE 2025

Brand owner writes seam inspection into contract packing agreement

A ready-to-drink brand owner wrote inline seam inspection requirements into its contract packing agreements, a commercial contracting decision rather than any equipment purchase of its own. Seam defects surface weeks after production and the recall exposure sits with the brand rather than the packer. Contracts now specify it.
Signal: Quality equipment is being specified contractually by the party carrying the risk rather than the party buying machines.
OCTOBER 2025

Asian builder expands compact canning system export capacity

An Asian machinery builder expanded production capacity for compact canning systems aimed at export markets, an organic capital investment rather than any acquisition. Small producers created by category fragmentation cannot justify high speed lines and buy compact equipment at price points European builders do not serve.
Signal: Category fragmentation created a small format segment that established line builders have largely ignored entirely so far.

What A Filling Line Costs

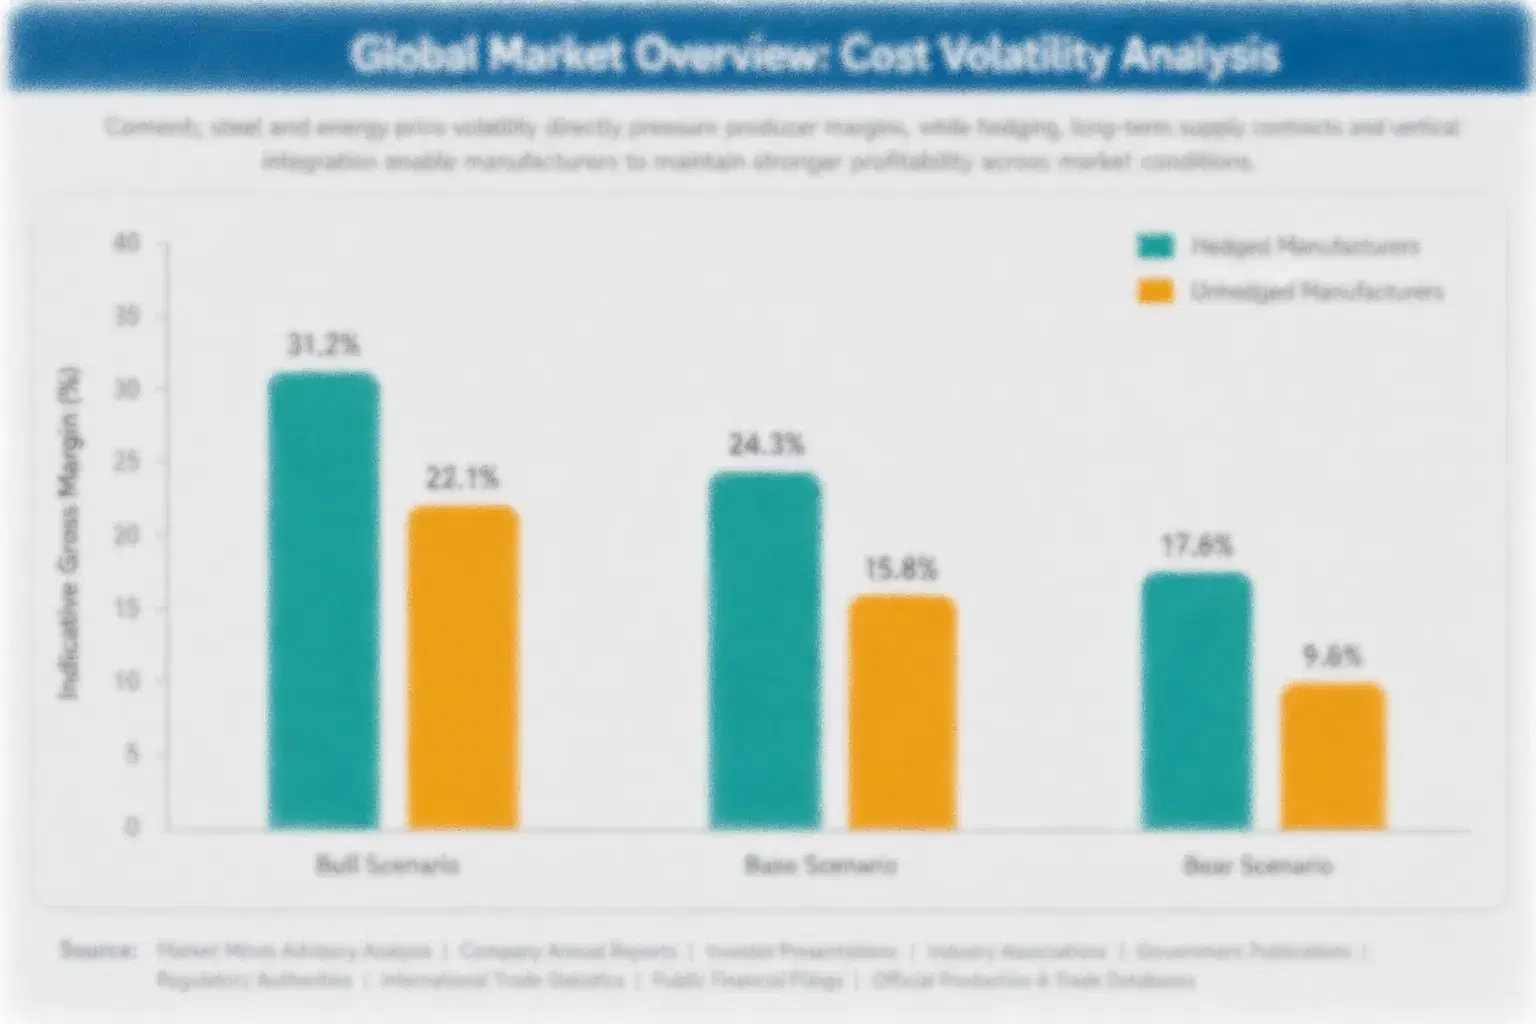
Bought-in components dominate machine cost. Servo drives, control systems, valves, stainless fabrication and bearings together run 46 to 53% of manufacturing cost for a mid-speed filling and seaming line, with drives and controls the largest purchased elements by a considerable margin. Assembly, factory acceptance testing and commissioning carry most of what remains, and commissioning cost rises sharply with installation complexity rather than with machine capability.
The volatility that matters is control components and stainless fabrication. Industrial control and servo lead times extended well beyond production assumptions through 2021 and 2022, and stainless pricing moved with alloy surcharges across the same period. IEA industrial energy data documents the European cost increases that compounded fabrication expense. Builders holding allocation met quoted schedules; spot buyers quoted longer and lost orders. A customer commissioning a line has an immovable launch date.

Exposure divides by manufacturing location and machine class. European builders carry energy-intensive fabrication and higher labour cost on machines whose specifications competitors broadly match. Compact and mobile equipment producers carry simpler bills of materials and far shorter commissioning. Builders supplying complete lines carry integration and commissioning risk that station suppliers do not. That integration risk is why customers pay for single-supplier accountability.
premix-packaging-machine-market-cost-volatility-analysis-1787696171479

Hold control component allocation against quoted schedules

Servo and control lead times extended well past production assumptions through 2021 and 2022, and builders without allocation quoted commissioning dates they could not meet or lost orders outright. Allocation agreements cost working capital and inventory risk. They prevent the failure that loses a capital order, since a launch date cannot move. Launch dates do not move for anybody.

Price commissioning separately from machine supply

Commissioning cost rises with installation complexity rather than with machine capability, and bundling it into machine price hides where the money actually goes. Builders pricing it separately quote machines competitively and recover integration effort honestly. Those bundling it either lose on headline price or absorb commissioning overruns that no machine margin was ever sized to carry.

Develop a compact platform for fragmented producers

Category fragmentation created many small producers who cannot justify a high speed line and buy compact equipment instead, which established builders have largely ignored. A simplified platform sharing components with existing machines reaches that segment without a separate engineering base. The organisational obstacle is willingness to sell a lower specification machine rather than any technical difficulty.

Portfolio Architecture for Margin Defence

Margin follows how comparable the machine looks on a specification sheet. High speed fillers are broadly comparable across credible builders and priced accordingly against strong competition. Seaming and closure equipment earns better on genuine technical difficulty. Changeover and format systems earn more because the benefit is measurable in a customer's own production plan. Inspection systems earn well and sell against a risk somebody else carries.
The tension is that the volume business is where Chinese and Indian builders compete hardest and the differentiated business requires selling to people the industry does not call on. Changeover capability has to be argued from a customer's variant schedule, and inspection has to be sold to brand quality functions rather than to packers. Builders organised around line specification selling reach neither conversation naturally, which is why both segments remain relatively open.

High-value pools sit in three places. Changeover and format systems sold on effective output rather than nominal speed. Inline seam inspection specified by brands into packing agreements. And compact platforms for the many small producers the category's fragmentation created, whom established line builders have essentially ignored. Each of the three requires reaching a buyer or an argument the industry does not currently address.

Volume / Commodity-Adjacent

Standard counter-pressure fillers and conventional seaming equipment supplied against broadly comparable competitor specifications. The 7-point range separates builders with component allocation and standardised platforms from those exposed to spot control pricing and bespoke engineering on every order.
Gross Margin: 21-28%

Premium / Certified

Integrated line supply, carbonation and blending systems requiring process capability alongside mechanical engineering. The 7-point spread separates builders offering full line accountability and commissioning support from those supplying stations into installations that somebody else integrates and guarantees.
Gross Margin: 32-39%

Sustainability / Regulatory / Next-Generation

Rapid changeover format systems, inline seam inspection and compact or mobile canning platforms. The 21-point range is wide because inspection and changeover systems command pricing tied to measurable customer benefit while compact platforms compete on capital cost with simple bills of materials.
Gross Margin: 35-56%
premix-packaging-machine-market-portfolio-architecture-1787696171671

High-value Sub-segments and Strategic Watch-out

Rapid Changeover Format Systems

Highest value and fastest growth at 12.0%, priced against a benefit that can be calculated directly from a customer's own variant production schedule. The risk is that the argument requires building that calculation for each prospect, which most commercial organisations are not equipped or trained to do.
Gross Margin: 53-56%

Inline Seam Inspection

Strong value sold against a recall exposure that surfaces roughly five weeks after production reaches trade. The risk is that the buyer is a contract packer carrying the cost while a brand owner carries the risk, which means the sale has to reach a party that buys no machinery.
Gross Margin: 46-49%

Standard Filling Equipment

The volume core, broadly comparable across credible builders and increasingly priced against Chinese and Indian equipment in cost-sensitive markets. Builders hold the position because filling volume carries the line relationships through which higher value systems reach the same customers afterward. Relationships justify holding it. Volume carries access.
Gross Margin: 22-25%

Capacity Expansion Dependency

The strategic watch-out. Contract packers added canning capacity rapidly during an unusual category expansion and invest against contracted volume brands can withdraw. The risk is normalisation leaving equipment idle and removing appetite for further machinery entirely across the whole customer base. Nobody controls that outcome.
Gross Margin: 26-29%

Machines That Outlast Brands

A filling line runs for fifteen years or more while the products passing through it change constantly, which is precisely why changeover capability matters more than any single product's requirements. Machine revenue is lumpy and infrequent, and the recurring revenue attaches to format parts, spares and service across that whole life. Treating parts and service as an afterthought surrenders the only continuous income here.
Stickiness depends on integration depth. A complete line engineered and commissioned by one builder is effectively permanent, since replacing any station means revalidating interfaces the customer never wanted to think about. Individual stations inside somebody else's line are replaced far more readily. Compact and mobile equipment moves most freely of all, since it requires no installation and carries essentially no switching cost beyond the purchase itself.

The buyer is not who the industry addresses. Roughly 62% of category volume is filled by contract packers who buy equipment on utilisation and multi-category flexibility, while brand owners specify products and sign no equipment orders. Builders whose commercial organisation calls on beverage brands are demonstrating machines to people who cannot buy them, and reaching co-packers means a different call list and an entirely different argument.
premix-packaging-machine-market-end-use-penetration-index-1787696171856

Where Output Actually Comes From

These are among the four positions where our research anticipates prominent divergence between winners and laggards over the coming forecast period. Each is grounded in the demand model, the regulatory perimeter, and the announced capacity pipeline.
01 / EFFECTIVE OUTPUT SELLING

Nominal speed answers a question nobody asks

A line running several flavour variants a day at around four hours per changeover spends a substantial share of every shift stopped, which makes nominal filling speed close to meaningless as a purchasing criterion for anybody. Builders who calculate effective daily output directly from a customer's own variant schedule reframe the comparison entirely and frequently beat faster machines. The work is constructing that calculation from the customer's production plan rather than developing anything new, and remarkably few builders do it routinely.
02 / RISK HOLDER TARGETING

Sell inspection to whoever carries the recall

Seam defects surface in trade roughly five weeks after production, and the recall exposure sits squarely with the brand owner while the equipment purchase decision sits with a contract packer filling around 62% of category volume. Selling inspection capability to packers means selling a cost to a party that does not carry the corresponding risk at all. Reaching brand quality functions puts the requirement into packing agreements instead, converting an optional extra into a contractual specification the packer must satisfy.
03 / BUYER IDENTIFICATION CORRECTION

Brands specify, co-packers actually purchase

Roughly 62% of premixed volume is filled by contract packers who buy machinery on utilisation and multi-category flexibility, while brand owners specify the product recipe and never sign an equipment purchase order of any kind. Builders whose commercial organisation calls primarily on beverage brands are demonstrating machines to customers who genuinely cannot buy any of them. Redirecting commercial coverage toward co-packers reaches the actual buyer, and those buyers evaluate flexibility across several categories rather than any single product's particular requirements.
04 / FILL CHEMISTRY ADVISORY

Equipment choice decides the formulation quietly

Alcohol promotes foaming, dissolved carbon dioxide must survive the filling cycle, and spirits-based products cannot be pasteurised the way beer can without damaging their flavour profile. That leaves either effectively sterile filling or a formulation carrying preservatives, and brand teams frequently discover the trade-off only after the recipe has been fixed. Builders who raise that question during specification shape a decision determining which equipment is even viable at all, positioning themselves inside product development rather than inside a later tender.

Engagement Snapshot From the Field

A live engagement with an industry participant carrying material or product regulatory and market exposure ahead of a defining policy shift, showing how our research translates into a defensible multi-year portfolio strategy.
MARKET MINDS ADVISORY · CLIENT ENGAGEMENT SUMMARY
Premix Packaging Machine Producer Strategic Portfolio Review and Transition Roadmap 2026·Investment Scenario on Premix Packaging Machine Exposure Evaluation 2025-26
CLIENT PROFILE
A European beverage machinery builder supplying counter-pressure filling and seaming lines across 19 markets, with reported revenue of 214 million euros (client-reported, unverified by MMA). Marketing and quotations led on nominal filling speed across every product family. Its commercial organisation of 38 people called on beverage brand owners, with contract packers covered indirectly through distributors and rarely visited at all.
STRATEGIC CHALLENGE
Win rates against slower competitor machines had fallen for three consecutive years despite a clear speed advantage on paper. Management was funding further speed development. Nobody had examined how customers actually calculated output, or established which organisations were signing the purchase orders the company was losing. Neither assumption was ever tested.
MMA APPROACH
MMA reconstructed twelve lost tenders, tracing who evaluated, on what basis and who ultimately signed, which the company had never documented. Fifteen expert interviews with contract packers, brand quality managers and line engineers established how purchasing decisions are genuinely made. The analysis separated the specification writer from the purchaser, which internal reporting had treated as the same party throughout.
KEY FINDINGS
  1. Every lost tender was decided on effective daily output including changeover, where the client's faster machine performed worse than the competitor it lost to.
  2. Purchase orders were signed by contract packers in ten of twelve cases, and the commercial team had met those buyers in only three of them.
  3. Seam inspection had been quoted as an optional extra and declined by packers, while brand quality managers described wanting it specified contractually.
  4. Building an effective output calculator modelled better win rates than further speed development would deliver (client-reported, unverified by MMA). Speed was never the problem.
CLIENT PROFILE
A European beverage machinery builder supplying counter-pressure filling and seaming lines across 19 markets, with reported revenue of 214 million euros (client-reported, unverified by MMA). Marketing and quotations led on nominal filling speed across every product family. Its commercial organisation of 38 people called on beverage brand owners, with contract packers covered indirectly through distributors and rarely visited at all.
STRATEGIC CHALLENGE
Win rates against slower competitor machines had fallen for three consecutive years despite a clear speed advantage on paper. Management was funding further speed development. Nobody had examined how customers actually calculated output, or established which organisations were signing the purchase orders the company was losing. Neither assumption was ever tested.
MMA APPROACH
MMA reconstructed twelve lost tenders, tracing who evaluated, on what basis and who ultimately signed, which the company had never documented. Fifteen expert interviews with contract packers, brand quality managers and line engineers established how purchasing decisions are genuinely made. The analysis separated the specification writer from the purchaser, which internal reporting had treated as the same party throughout.
KEY FINDINGS
  1. Every lost tender was decided on effective daily output including changeover, where the client's faster machine performed worse than the competitor it lost to.
  2. Purchase orders were signed by contract packers in ten of twelve cases, and the commercial team had met those buyers in only three of them.
  3. Seam inspection had been quoted as an optional extra and declined by packers, while brand quality managers described wanting it specified contractually.
  4. Building an effective output calculator modelled better win rates than further speed development would deliver (client-reported, unverified by MMA). Speed was never the problem.
RECOMMENDED STRATEGY
Phase 1: Phase one: halt speed development and build an effective output calculator that quotes from a customer's own variant production schedule instead. Phase 2: Phase two: redirect commercial coverage toward contract packers, who sign the orders, and stop calling primarily on brand owners. Brands cannot buy machines. Phase 3: Phase three: sell seam inspection to brand quality functions so it enters packing agreements rather than remaining a declined optional extra.
OUTCOME
The output calculator was built and win rates recovered materially within a year with no change to the machines themselves. Coverage was redirected toward co-packers and produced tenders the company had never previously been invited to (client-reported, unverified by MMA). Two brand owners subsequently specified inline seam inspection into their packing agreements.

Frequently Asked Questions

Foundational context covering the market sizes, CAGR, scope, country, region and competition that inform every finding below. This section is provided to cover basics and most often pre-purchase conversations, answered from the MMA Primary Research Dataset.

What is the current size of the Premix Packaging Machine Market?

The market was worth 2.0 billion dollars in 2025, covering counter-pressure filling, seaming, carbonation, changeover systems, inline inspection and compact canning units. It reaches 2.16 billion dollars in 2026.

How large will the Premix Packaging Machine Market be by 2036?

MMA forecasts 4.66 billion dollars by 2036, an increase of 2.50 billion dollars over the 2026 base. That represents an expansion multiple of 2.16 times across the forecast period.

What is the CAGR for the Premix Packaging Machine Market 2026 to 2036?

The base case compounds at 8.0% annually. MMA's bull case reaches 9.2% if premixed spirits gain retail parity with beer more widely, while the bear case sits at 6.8% on category normalisation.

Which segment is growing fastest?

Rapid changeover and format systems, at 12.0%, half again the market rate of 8.0%. Changeover duration rather than filling speed now determines effective output on most lines.

Who are the major companies in the Premix Packaging Machine Market?

Krones, KHS Group, Sidel, Barry-Wehmiller and Sacmi lead on disclosed beverage and liquid packaging machinery revenue. CFT Group, Comac, Ferrum Packaging and Wild Goose Filling compete in specific functions.

Which country is growing fastest?

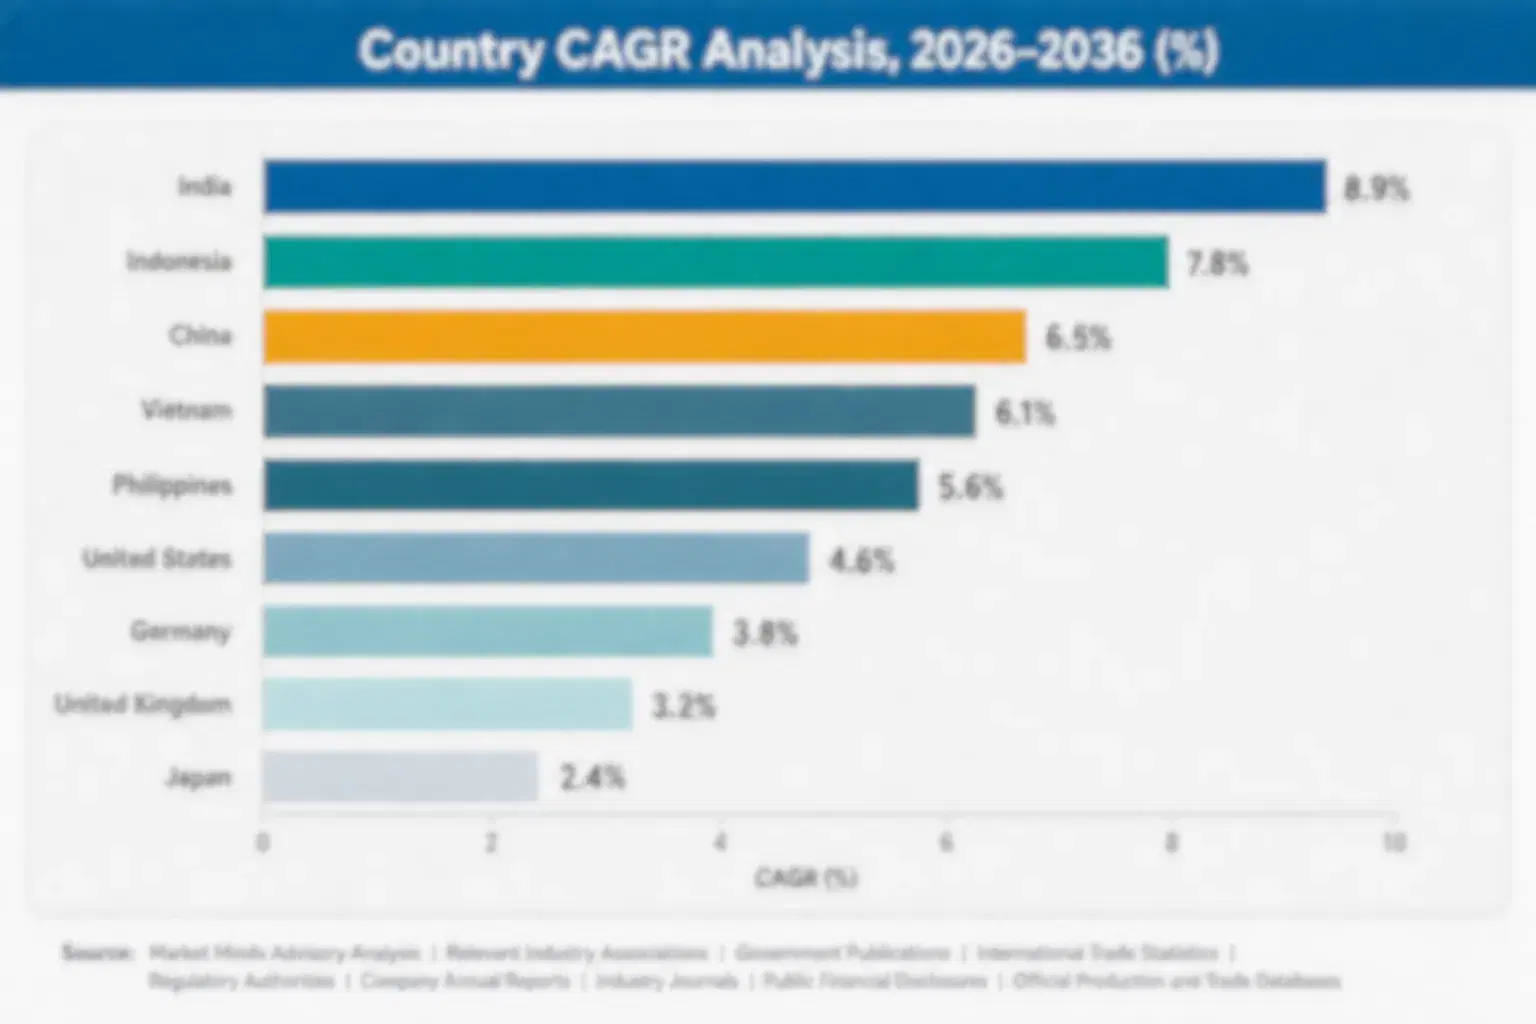
India at 10.2%, driven by ready-to-drink consumption rising from a low base as regulation develops and organised retail expands. China follows on similar category growth.

Report Segmentation Architecture

The full report scope spans multiple orthogonal segmentation dimensions, with cross-tabulated demand data provided for each dimension pair. Coverage extends further to regional breakdowns, trend trajectories, and the competitive detail needed to support segment-level decision-making.

By Machine Function

  • Counter-Pressure Filling Systems
  • Can Seaming and Closing Systems
  • Carbonation and Blending Systems
  • Rapid Changeover and Format Systems
  • Inline Inspection and Seam Control
  • Small-Batch and Mobile Canning Units

By End-Use Industry

  • Contract Beverage Packers
  • Spirits and Distilled Beverage Brands
  • Brewing Operations
  • Soft Drink and Energy Producers
  • Craft and Small Batch Producers
  • Non-Alcoholic Ready to Drink

By Commercial Dimension

  • Direct Capital Purchase
  • Integrated Line Contract
  • Distributor Supplied Equipment
  • Equipment Lease Arrangement
  • Contract Packer Specification
  • Brand Specified Requirement

By Region

  • North America
  • Western Europe
  • East Asia
  • South Asia and Pacific
  • Latin America
  • Middle East and Africa
  • Eastern Europe

Scope, Methodology, and Coverage

Every figure in this report is reproducible from documented input assumptions. The scope below maps the historical period, the forecast horizon, the segmentation dimensions, and the countries covered, alongside the underlying primary and qualitative methodology.
Historical Period
2020 to 2025
Forecast Period
2026 to 2036
Base Year
2025 (USD billions; MMA Primary Research Dataset, August 2026)
Market Definition
Scope covers machinery used to fill, close, inspect and package premixed ready-to-drink beverages into cans, bottles and kegs, spanning counter-pressure filling systems handling carbonated and alcoholic products, can seaming and closing systems, carbonation and blending systems preparing the product before fill, rapid changeover and format systems, inline inspection and seam control equipment, and small-batch and mobile canning units. Container manufacture including can and bottle production, secondary packaging, case packing and palletising equipment, brewing and distilling process plant upstream of blending, and dispensing equipment used for on-premise service are excluded. Contract packing services and container decoration fall outside the boundary.
Quantitative Units
USD billions (current prices); lines installed; machines shipped; changeover duration; effective daily output
Segmentation Dimensions
By Machine Function; By End-Use Industry; By Commercial Dimension; By Region
Regions Covered
North America, Western Europe, East Asia, South Asia and Pacific, Latin America, Middle East and Africa, Eastern Europe
Countries Covered
USA, Japan, Germany, China, Italy, India, UK, Australia, Brazil, Mexico, South Korea, Poland, South Africa, Vietnam, France
Key Companies Profiled
Krones, KHS Group, Sidel, Barry-Wehmiller, Sacmi, CFT Group, Comac, Ferrum Packaging, JBT Marel, GEA Group, Coesia, Shibuya Corporation, Mitsubishi Heavy Industries Machinery Systems, Cask Brewing Systems, Wild Goose Filling, ABE Beverage Equipment, Tetra Pak, Ronchi Mario, Palmer Canning Systems, Codi Manufacturing
Quantitative Methodology
Primary survey, n=3,800 respondents, Q4 2025, six countries; demand-side model with trade association cross-validation
Qualitative Methodology
47 expert interviews, Q4 2025; applied to validate demand model assumptions, identify emerging dynamics, and assess competitive positioning
Report Format
PDF and XLSX data workbook (Word format preview document)
Publisher
Market Minds Advisory
Report Code
MMA-2026-CON-133
Published
August 2026
Contact
sales@marketmindsadvisory.com | www.marketmindsadvisory.com

Purchase the full Premix Packaging Machine Market Report (2026 to 2036).

The full report runs to 165 pages and covers all six machine function segments, seven regions and 20 profiled companies in detail. It includes the complete segment CAGR set, regional installation and category volume data, and effective output modelling across representative variant production schedules. Company profiles carry evaluation on disclosed beverage and liquid packaging machinery revenue, with moat and risk assessment for the top five builders. The competitive section extends to 14 tracked corporate developments across 2024 and 2025, each with commercial interpretation. Primary research inputs include a quantitative survey of 3,800 respondents and 47 expert interviews conducted in Q4 2025.
Six machine function segments with individual CAGR forecasts
Seven regional markets with installation and category volume data
Twenty company profiles on consistent revenue evaluation basis
Fourteen tracked corporate developments with commercial interpretation notes
Effective output modelling across representative variant production schedules
Contract packer versus brand owner purchasing responsibility mapped by region

Built For The People Who Decide

From boardroom strategy to bench-side execution, this report is read cover-to-cover by leaders shaping the next decade of their industry, turning demand scenarios, market dynamics and valuation benchmarks into decisions.
CXOs/ Presidents/ VPs/ Managers
M&A and Corporate Development
Strategy Teams and R&D Heads
Procurement and Product Directors
Regulatory and Compliance Leaders
Investor Relations and Equity Analysts