Market Minds Advisory
Pre made Bags Market

Pre made Bags Market: Paying a Premium Per Unit to Avoid Owning a Machine

A pre-made bag costs roughly a quarter more than the same pack formed on a filling line. Brands pay it to avoid a machine they cannot justify, and the crossover sits near four million units.

Lead Analyst

Bilal Shaikh

Published

September 2026

Make Smarter Decisions with Customized Research Insights

Request a free sample report and evaluate market opportunities, growth trends, and competitive dynamics relevant to your business needs.

2025 MARKET VALUE$28.5BMarket Size 2025
2036 FORECAST VALUE$57.6BBase Case , 2026 to 2036
CAGR 2026 TO 20366.6 %Bull 7.8% / Bear 5.4%
INCREMENTAL OPPORTUNITY$27.2BNet 10- year value creation
EXPANSION MULTIPLE1.89x2036 value over 2026 base
Strategic Levers
M&A Pipeline
Regional Outlook
Country Rankings
Competitive Intelligence
Segmental Deep-dive
Call-Us : 91 93563 13602

Executive Snapshot and Market Trajectory

The whole category rests on one trade-off. A form-fill-seal line makes bags from roll stock at very low unit cost and costs around 410,000 dollars. A pre-made bag costs about 28% more per unit and needs almost no machinery. Below four million units yearly, paying the premium wins.
Growth runs at 6.6% on retail assortment widening rather than on any packaging innovation, since short runs destroy the economics that justify a dedicated forming line at all. Flat bottom and box pouches grow fastest at 9.9%, exactly 1.50 times the market rate, on shelf presence that roll stock formats simply cannot match. Spouted pouches follow at 8.7% on continued conversion out of rigid bottles and jars.
Concentration reaches only 17% across the top five measured on annual pre-made bag and pouch units converted, which is exceptionally low because freight economics keep converters regional and the technical barriers to entry stay modest everywhere. East Asia holds 33%, above its framework band, supplying both a very large domestic market and a substantial share of Western import volume, while India grows fastest at 9.6% on rapid domestic brand and assortment expansion.
Market Definition
This market covers flexible bags and pouches supplied to fillers already formed, measured at converter realised prices, spanning pillow and flat pouches, stand-up pouches, flat bottom and box pouches, spouted pouches, side gusset and quad seal bags, and retort-capable pre-made pouches. Roll stock supplied for form-fill-seal conversion, rigid and semi-rigid packaging, paper sacks without a polymer barrier, filling and pouching machinery, and base film production fall outside scope.
Base Year Value
$28.5B in 2025 (MMA Primary Research Dataset, August 2026)
Forecast Period
2026 to 2036, eleven discrete annual values
CAGR
6.6% base case. Bull 7.8%. Bear 5.4%.
Fastest Growth Segment
Flat Bottom and Box Pouches: 9.9% CAGR
Fastest Growth Country
India: 9.6% CAGR
Fastest Growth Region
South Asia and Pacific: 8.8% CAGR
Largest Region
East Asia: 33% of 2025 global value
Market Leaders
Amcor, ProAmpac, Mondi, Sonoco, Huhtamaki. Source: MMA Analysis based on company annual reports.
Primary Survey
n=3,800 procurement and R&D decision-makers, Q4 2025, six countries
Methodology
Demand-side build-up, cross-validated against public data, 47 expert interviews

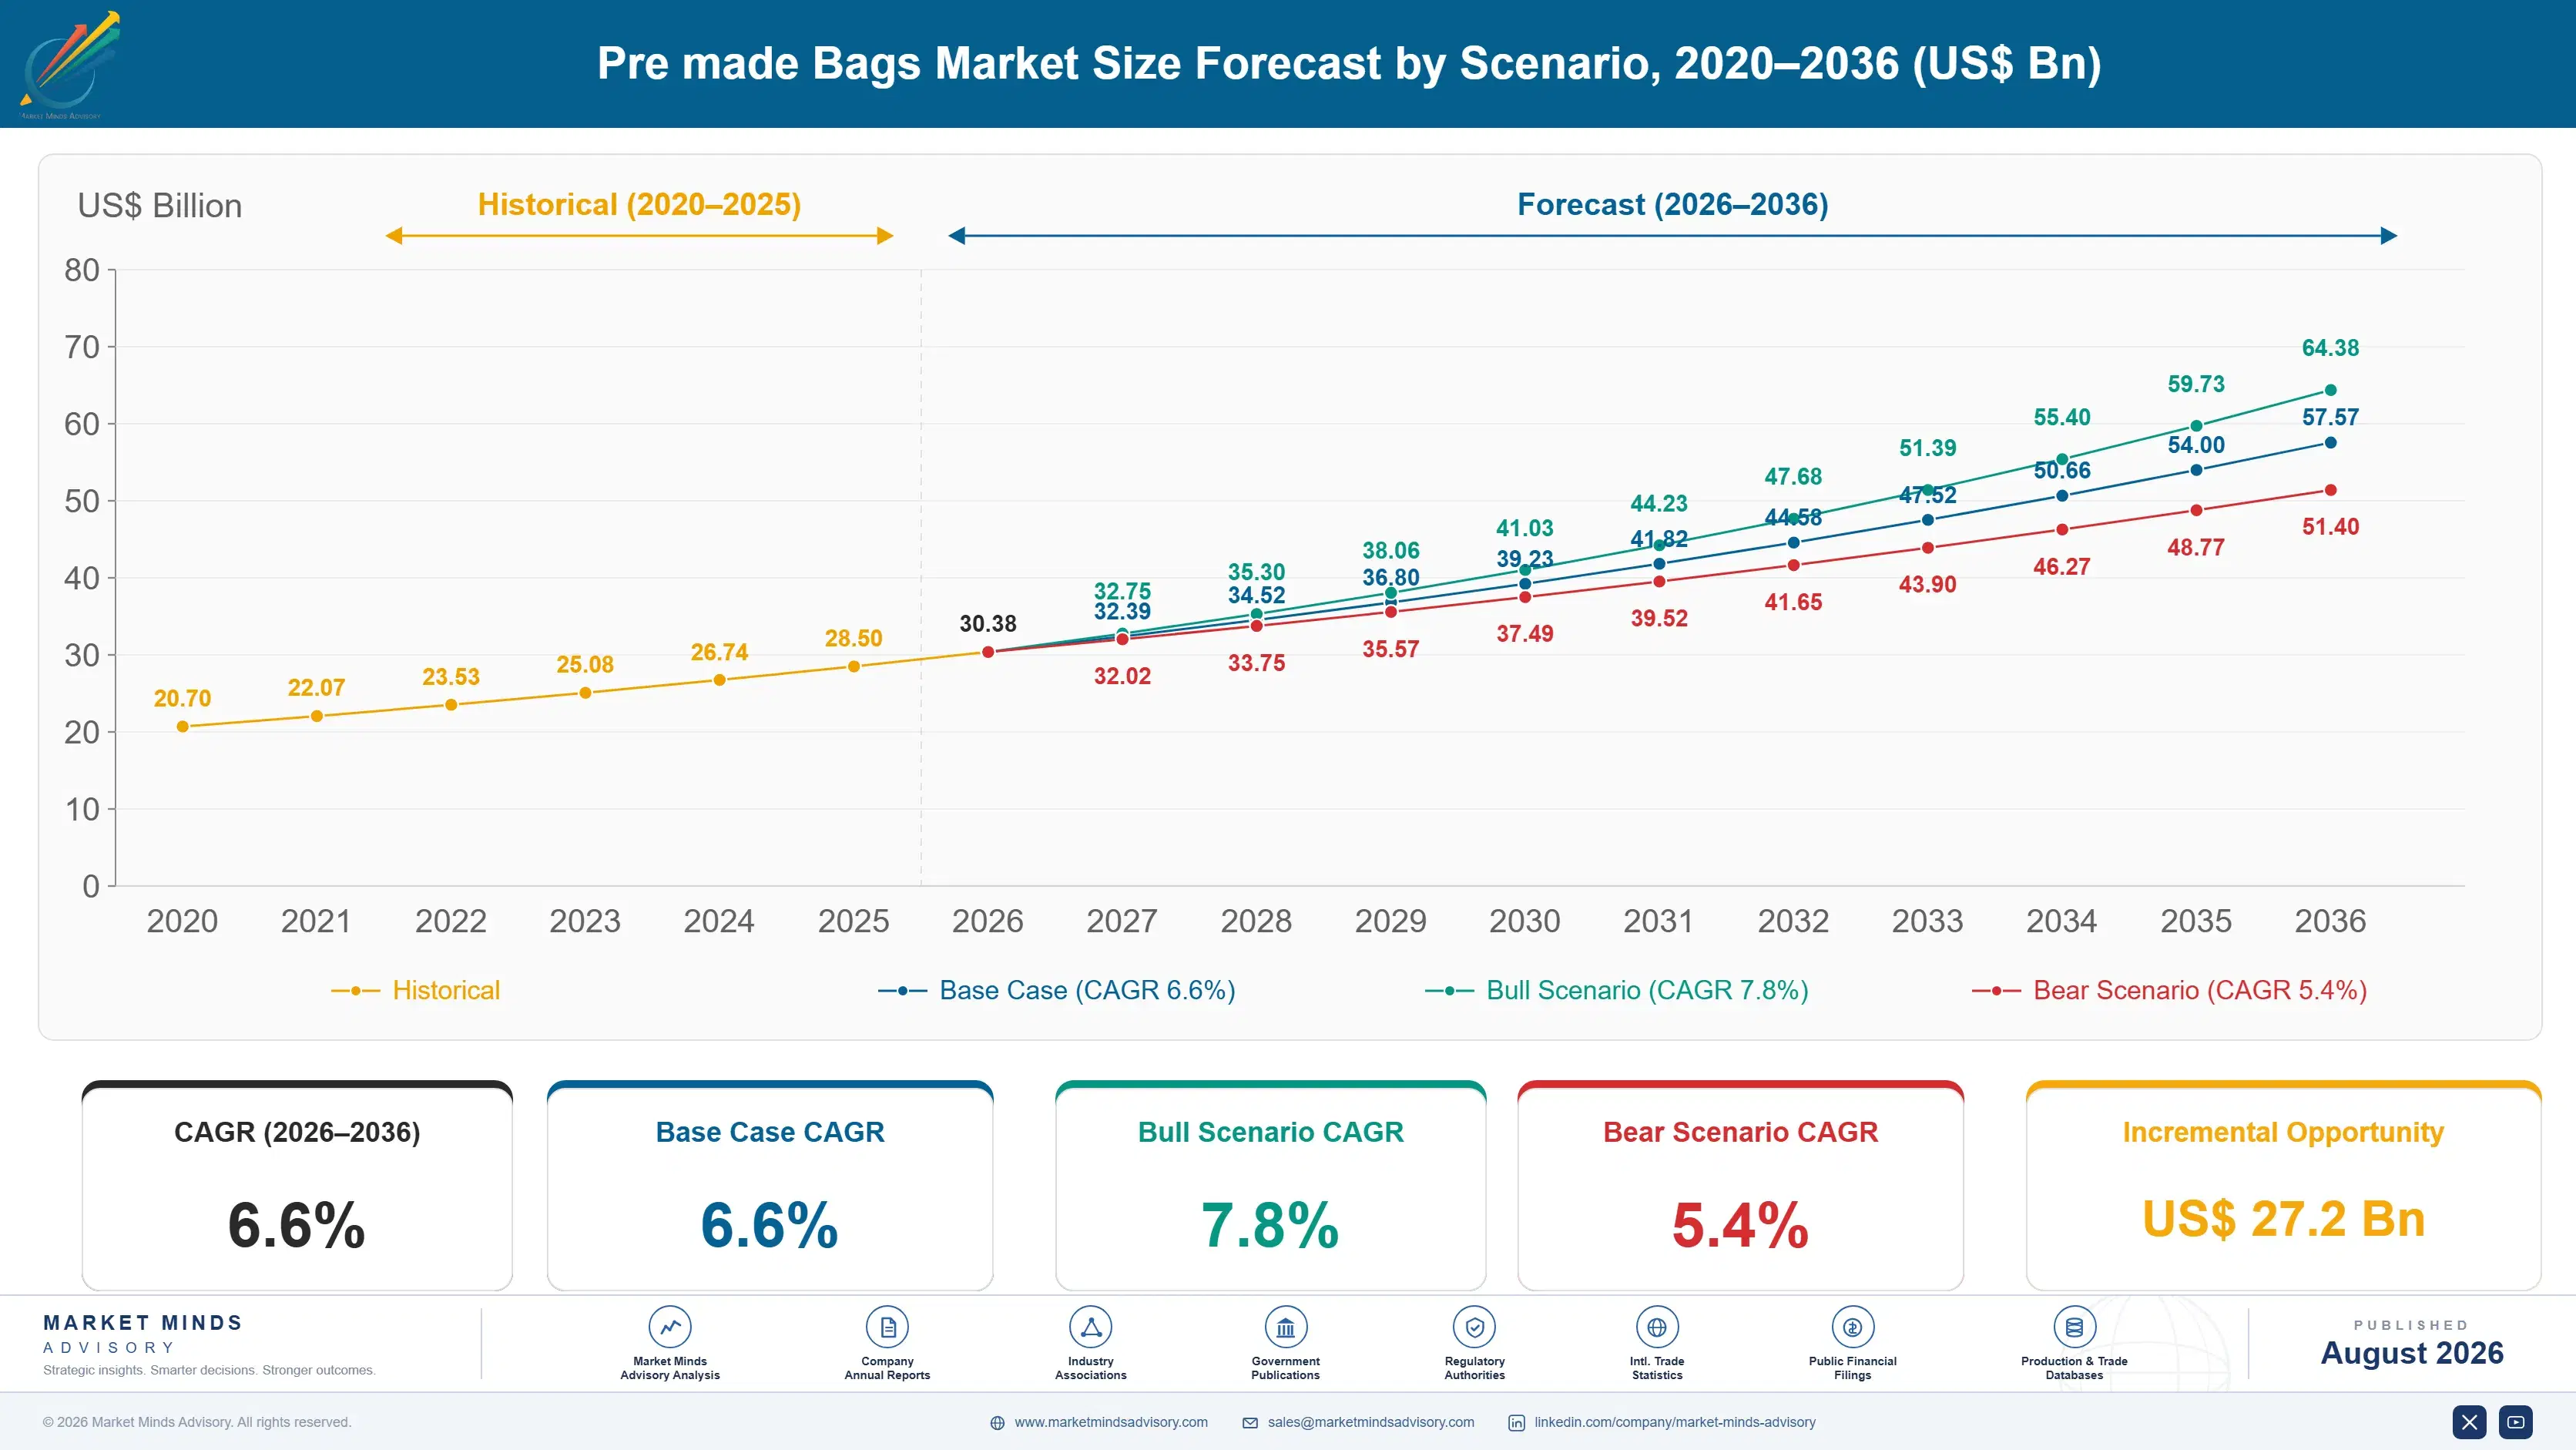
Pre made Bags Market Forecast Scenarios

pre-made-bags-market-size-forecast-scenario-1787299847369
The 2020 to 2025 period ran at 5.6% and the driver shifted halfway through. Early growth came from format conversion out of rigid packaging, which continued steadily. From 2022 the more powerful mechanism was retail assortment expansion, since every new variant carried a run length too short to justify tooling and changeover on a forming line. Co-packers absorbed much of that volume.
Three mechanisms carry the 6.6% base case. Assortment expansion is the largest, because short runs and high SKU counts move the crossover threshold upward and keep more volume on pre-made formats. Premium shelf presence is the second, growing flat bottom and box pouches at 9.9% on print area and shelf stability that roll stock forming cannot deliver. And Asian conversion capacity is the third, supplying both domestic demand and Western import volume.
The 7.8% bull case rests on mono-material recyclable structures reaching pre-made formats faster than they reach forming lines, since a filler does not have to requalify machinery when the bag arrives already made. The 5.4% bear case is high-speed forming equipment falling in price, which would drag the crossover threshold down and pull volume back onto roll stock at converters' expense.

Where the Crossover Actually Sits

The arithmetic here is unusually clean for a packaging category. Roll stock formed on a filling line produces the cheapest possible bag, and the line to do it costs around 410,000 dollars before installation, tooling, and the operator training that follows. A pre-made bag arrives ready to fill and costs roughly 28% more per unit. Divide the machine cost by the per-unit premium and you get a crossover near four million units a year.
TOP FIVE CONCENTRATION17%Extremely fragmented across thousands of regional pouch converters
CROSSOVER VOLUME THRESHOLD4 millionUnits yearly where forming on line begins beating pre-made
UNIT COST PREMIUM28%Paid per bag against equivalent roll stock formed on line
FILLING CAPITAL AVOIDED410,000 dollarsMachine investment a brand does not need to make
FREIGHT VOLUME RATIO5.8 timesTruck space needed against the equivalent roll stock shipment
AVERAGE ACTIVE SKUS34 SKUsRun by a typical co-packer across a single filling line
Retail assortment has been pushing that crossover upward for a decade. A brand running one flavour at eight million units is obviously a forming line candidate. The same brand running twelve flavours at 700,000 units each is not, since every changeover costs tooling, downtime, and scrap. A typical co-packer now runs 34 active SKUs across one filling line, which is only possible with pre-made bags.
Freight is the offsetting penalty and it is severe. A pre-made bag ships as mostly air, occupying around 5.8 times the truck space of the equivalent roll stock, which caps how far a converter can economically ship. That is why concentration sits at only 17% despite modest technical barriers: this is a regional business wearing a global label.
"Every brand I meet wants to know whether to buy a forming line. The honest answer is usually a division: machine cost over unit premium. What they should actually be asking is how many flavours they intend to launch, because that is the number that moves the answer."
Director, Flexible Packaging and Pouch Conversion Practice · MMA Packaging and F

Market Trends

Assortment Expansion Keeps Moving The Crossover Upward

A dedicated forming line rewards long runs of one format and punishes anything else, since each changeover costs tooling, downtime, and start-up scrap. Retail assortment has widened relentlessly, with typical co-packers now running 34 active SKUs across a single filling line, and every added variant shortens the run length behind it. The four million unit crossover therefore keeps moving upward in practice even where it holds in theory. Volume that would once have justified forming equipment now stays on pre-made bags simply because the schedule fragments. Nobody plans that outcome, it simply happens.
Market Impact: Avoids 410,000 dollars per format

Recyclable Structures Reach Pre-Made Formats First

Switching a filling line to a mono-material recyclable structure means requalifying the machine, retuning sealing parameters, and accepting slower running while operators learn a stiffer and more sensitive web. Switching a pre-made bag means asking the converter for a different specification and receiving it. That difference has pulled recyclability conversions toward pre-made formats ahead of roll stock in several categories. Converters absorb the technical difficulty and price it in, which most brands accept readily rather than take machinery downtime during a compliance deadline. The converter absorbs the risk and prices it, which is a trade almost every brand accepts.
Market Impact: India grows at 9.6% annually

Market Opportunities and Growth Drivers

Co-Packers Cannot Justify Format-Specific Forming Capital

Contract packers fill for many brands with contracts that turn over regularly, which makes any format-specific machinery a bet on business they may not hold in three years. A pouch filler that runs any pre-made bag someone hands it is the only rational investment in that position. Around 34 active SKUs across a single line is normal, and no forming line handles that spread economically. Co-packer share of packaged food and consumer goods volume keeps rising, and every point of that shift moves volume toward pre-made formats. Every point of co-packer share moves volume here.
Market Impact: Occupies 5.8 times truck space

Indian Conversion Capacity Is Expanding Very Quickly

Indian pouch converters have grown on domestic spice, snack, dairy, and personal care demand while building export volume into the Gulf, Africa, and increasingly Europe. Domestic brand proliferation is extreme, with run lengths short enough that forming equipment is rarely justified outside the largest national players. India contributes the fastest national growth rate in this forecast at 9.6%. Print quality and structure capability have improved considerably, which has moved Indian converters from the value end toward mid-specification work over five years. Domestic assortment expansion and export growth are pulling in the same direction simultaneously, which is unusual.
Market Impact: Threshold sits near 4 million

Market Restraints and Challenges

A Pre-Made Bag Ships Almost Entirely As Air

A formed pouch occupies roughly 5.8 times the truck space of the roll stock that would make the same pack, because the volume is already in the bag rather than added at the filler. The root cause is geometric and no packing improvement changes it materially. Commercial impact is a hard limit on economic shipping radius, which is why this market fragments into regional converters and why concentration sits at only 17%. Converters mitigate with regional plants, nested bag designs, and compressed palletisation that recovers part of the penalty. Nothing about the geometry changes with better packing.
Market Impact: Co-packers run 34 active SKUs

Forming Equipment Prices Keep Drifting Downward

Every reduction in the capital cost of a form-fill-seal line drags the crossover threshold below four million units and pulls volume back onto roll stock. The root cause is competition among machinery builders and the entry of lower-cost Asian equipment at specifications that were previously European only. Commercial impact falls on converters supplying mid-volume brands, who are the most exposed group in this market. Mitigation runs through formats forming lines handle badly, through short-run capability, and through structures brands do not want to requalify. Mid-volume accounts are where this pressure actually lands.
Market Impact: Avoids 410,000 dollars requalification exposure
3 additional market trends, 4 additional growth drivers, and 2 additional restraints and challenges are covered in the full report. Contact sales@marketmindsadvisory.com to access the complete intelligence.

Segment CAGR and Growth Architecture

Segmentation follows bag format, because format determines the converting equipment needed, the shelf presentation achieved, the filling machinery a customer requires, and whether a forming line could produce it at all. End-use category and barrier structure both cut across every format rather than separating them, which makes either a weak primary dimension for this business.
pre-made-bags-market-market-share-analysis-1787299847899

Flat Bottom And Box Pouches

The fastest format at 9.9%, exactly 1.50 times the market rate, and the one a forming line cannot readily produce at all. Five printable panels, a genuinely flat base, and squared side gussets give shelf presence closer to a carton than to a pouch, which is why coffee, pet food, and premium dry goods adopted it so heavily. Converting requires more complex sealing geometry and tooling than a stand-up pouch, so realised price per unit is considerably higher. The format is effectively immune to the crossover argument, because there is no roll stock alternative producing the same pack. That immunity is worth more than the growth rate suggests on its own.
CAGR 9.9%

Spouted Pouches

Second fastest at 8.7%, and growing on liquid and semi-liquid conversion out of rigid bottles, cartons, and jars across baby food, beverages, sauces, and household products. Fitting a spout is an assembly operation rather than a converting one, requiring insertion and welding equipment that most general pouch converters do not hold, which keeps the qualified supplier list shorter than the format's simplicity suggests. Spout supply is concentrated in a handful of producers globally. Filling a spouted pouch also needs specific machinery, so this format brings its own capital question back into the customer's decision. Spout supply concentration is a genuine exposure for anybody building here. Filling one also needs its own machinery, which brings the capital question straight back.
CAGR 8.7%
Full segment breakdown across 6 segments available in the complete report.

Regional Architecture and Country Demand Map

Conversion capacity rather than consumption sets the shape here, and freight economics keep most supply reasonably close to its own market. East Asia sits above its framework band because Chinese converters serve both an enormous domestic market and a substantial share of Western import volume.

East Asia

Thirty-three percent, above the framework band, and the justification is conversion capacity serving two markets at once: Chinese converters supply an enormous domestic packaged goods sector and also a substantial share of the pre-made pouches filled in North America and Europe. Freight penalties that keep most of this business regional are tolerated on long-haul Chinese supply because unit price differences remain wide enough to absorb them. Japanese and Korean converters occupy the high-specification end on retort and barrier work. Growth at 7.6% runs above the global rate on domestic assortment expansion and continued export volume together. Nothing else in flexible packaging exports this far against freight. Unit price gaps remain wide enough to absorb the penalty.
Share: 33% | CAGR: 7.6% (2026 to 2036)

North America

Twenty-four percent, and the character here is a mature market where co-packer share of filling has risen faster than anywhere else, which favours pre-made formats directly. Pet food, coffee, snacks, and better-for-you categories drive most of the premium format demand, with flat bottom pouches particularly strong. A meaningful share of supply arrives from Asia despite the freight penalty, which domestic converters have contested on lead time and short-run flexibility rather than on price. Growth at 6.0% sits below the global rate, reflecting a mature base where assortment rather than category expansion carries the volume. Co-packer share of total filling volume has risen faster here than anywhere, which accounts for much of the format growth.
Share: 24% | CAGR: 6.0% (2026 to 2036)
Regional intelligence for 5 additional markets available in the complete report: Western Europe, South Asia and Pacific, Latin America, Eastern Europe, Middle East and Africa. Contact sales@marketmindsadvisory.com.
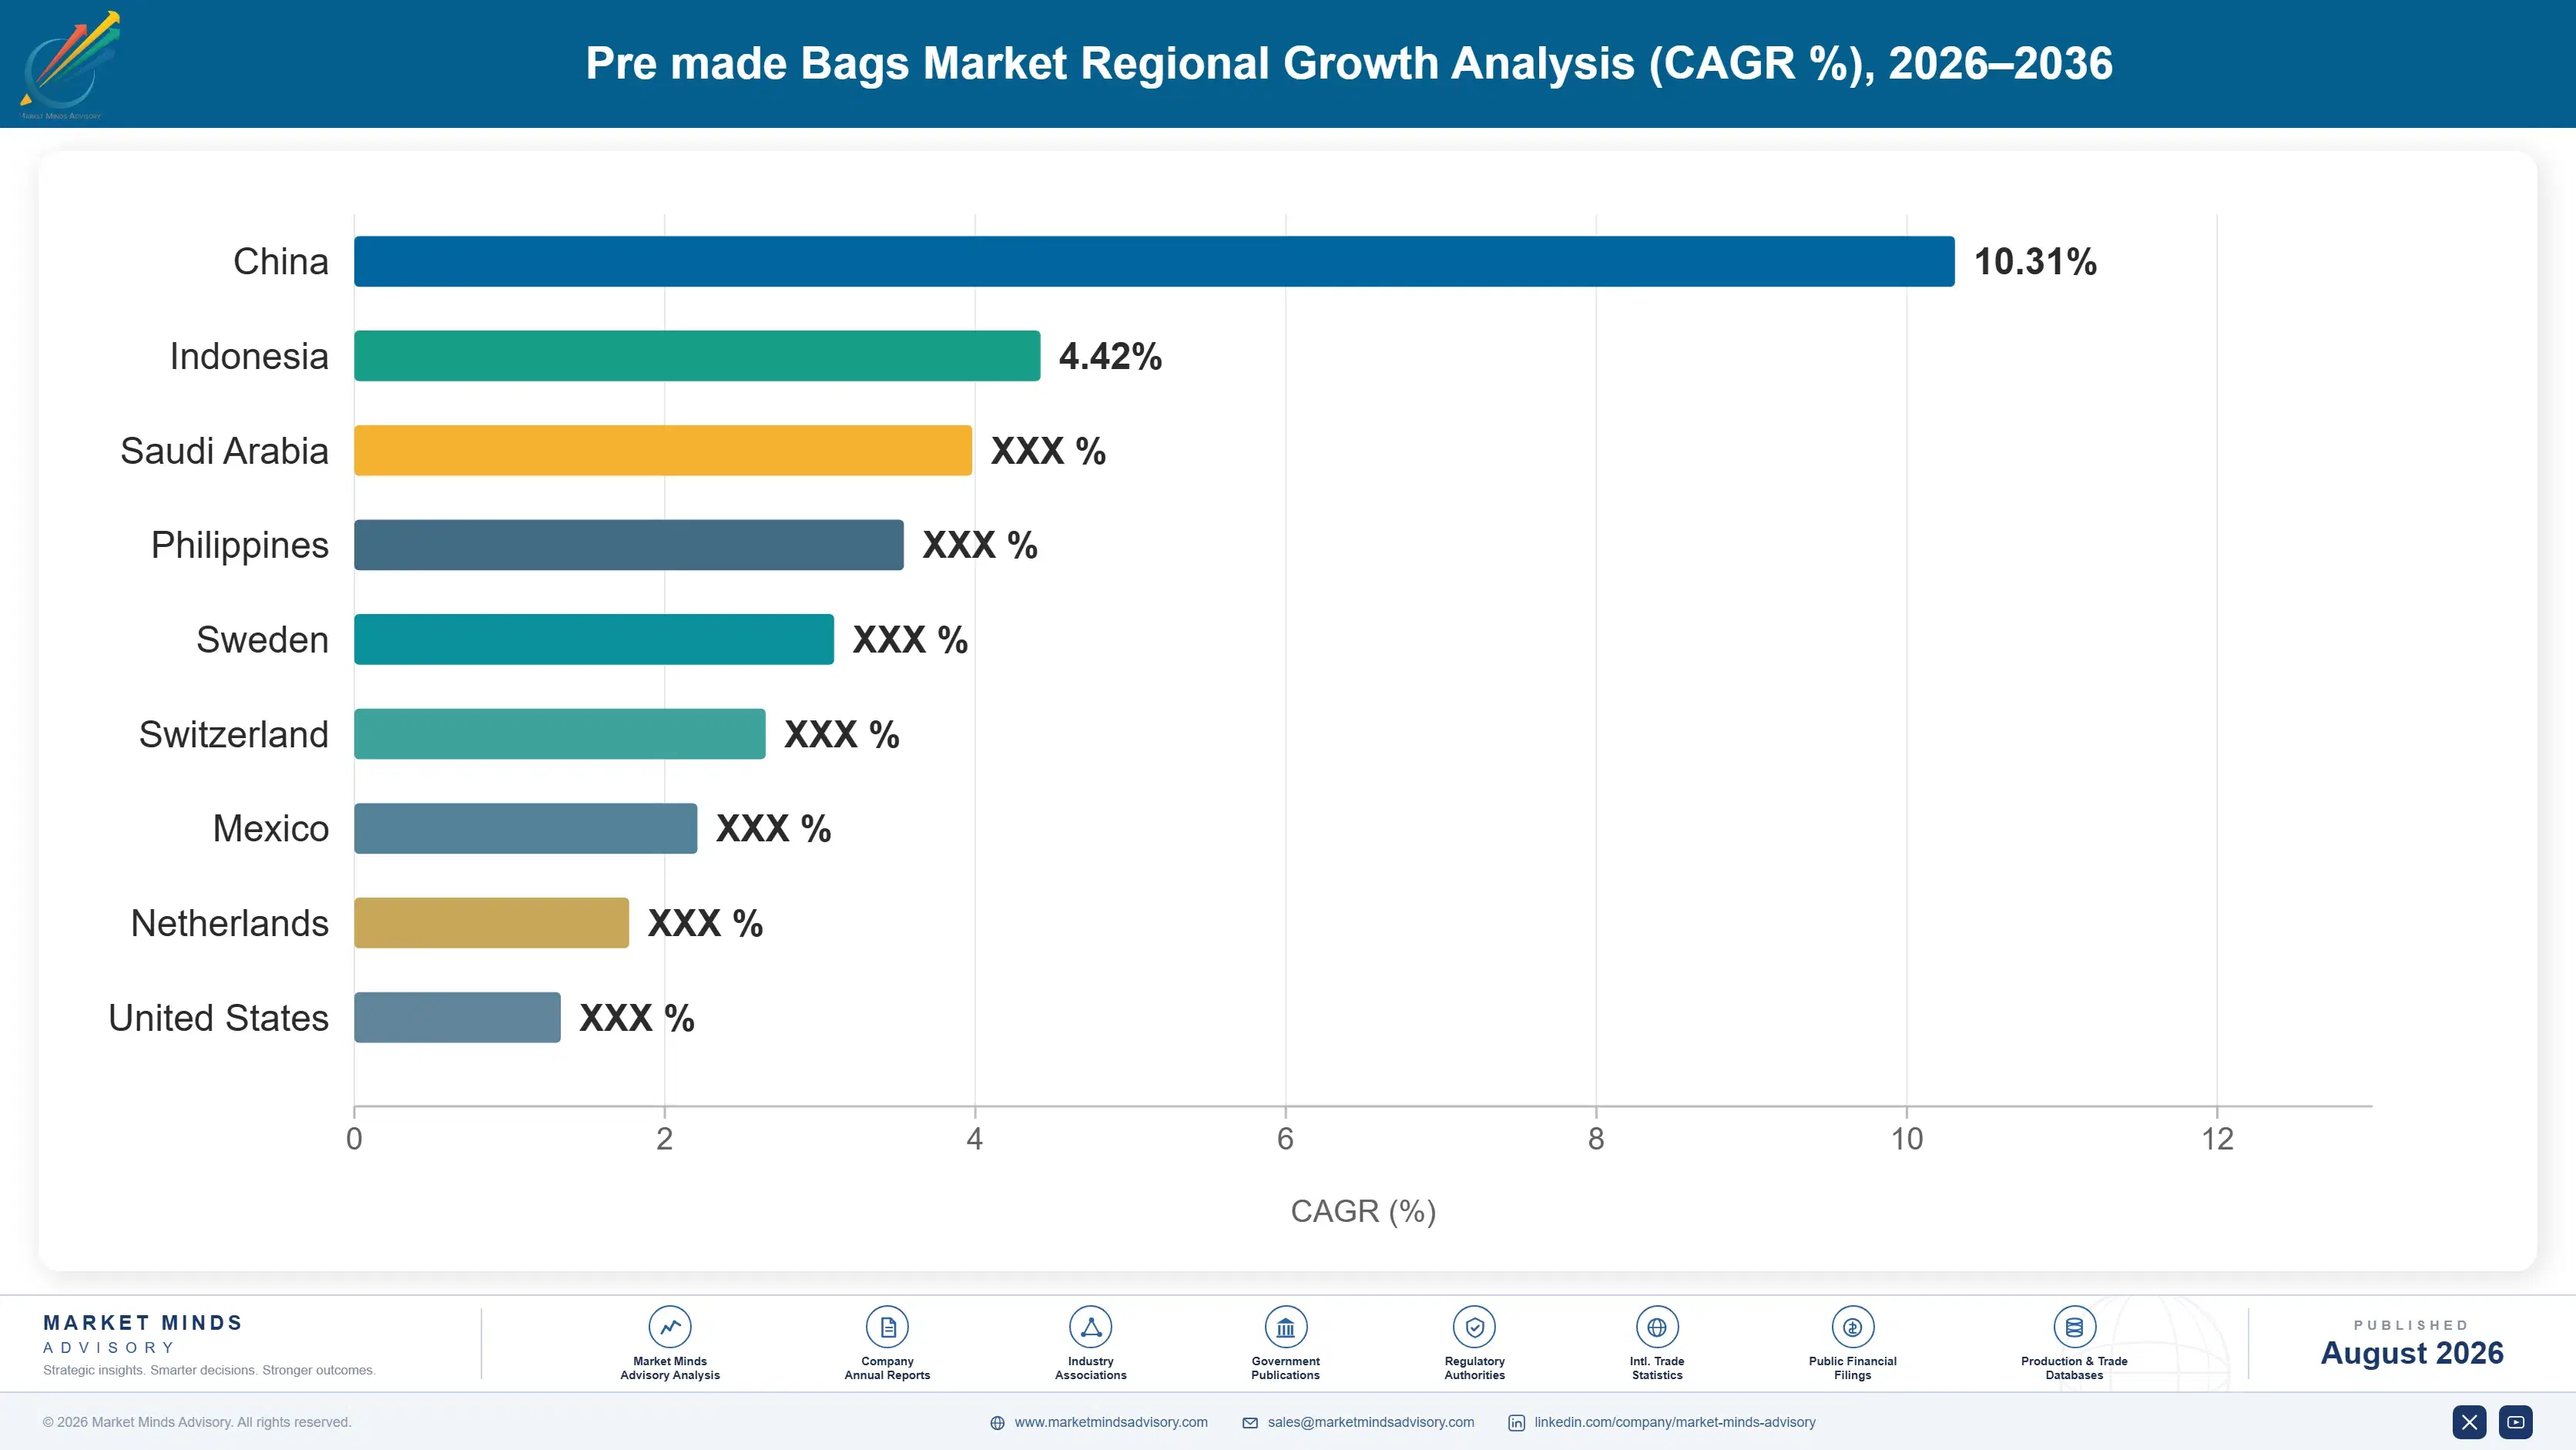
pre-made-bags-market-country-cagr-analysis-1787299848415

Competing Against A Machine Purchase

Every customer here is one division away from buying a forming line, and the freight penalty caps how far a converter can economically reach. Value comes from selling against the crossover honestly, from owning formats no forming line makes, from placing capacity near demand, and from absorbing the recyclability transition brands do not want.

Sell Against The Crossover Rather Than Ignoring It

Every mid-volume customer eventually computes machine cost divided by unit premium and arrives at a crossover near four million units. A converter who runs that calculation with the customer, including changeover cost, scrap, tooling for each format, and the operator time nobody budgets, usually finds the real threshold sits well above the naive one. Converters who avoid the conversation lose the account when a machinery salesperson has it instead. Changeover cost alone frequently adds 30% to the effective threshold, and the honest arithmetic favours pre-made far more often than converters seem to believe.
Market Impact: Real threshold exceeds 4 million units each year

Build Depth In Formats Forming Lines Cannot Make

A flat bottom pouch with five printable panels and squared gussets has no roll stock equivalent, which removes the crossover argument entirely rather than merely winning it. That format grows at 9.9% against 6.6% for the market and carries realised prices well above stand-up pouches on more complex tooling and sealing geometry. Converting capability costs roughly 2.8 million dollars per line to install properly. Converters weighted toward pillow and stand-up formats are competing on exactly the ground where a machinery purchase is easiest to justify. That is the easiest contest in this market to lose.
Market Impact: Flat bottom capability costs 2.8 million dollars each

Place Capacity Inside The Freight Radius That Matters

A formed bag occupies around 5.8 times the truck space of equivalent roll stock, so freight consumes margin faster than in almost any other packaging category. Converters serving customers beyond an economic radius are subsidising delivery out of conversion margin whether or not they have calculated it. Mapping customer locations against plant geography and closing or relocating capacity accordingly typically recovers three to five points of margin. Very few converters have ever run that analysis properly, and fewer still have acted on the answer. The answer is usually uncomfortable. Route consolidation follows naturally.
Market Impact: Recovers 3 to 5 points of delivered margin

Absorb The Recyclability Transition Customers Fear

Changing a filling line to a mono-material structure means requalification, retuning, and slower running during a compliance deadline, which is exactly when a brand can least afford machinery downtime. Changing a pre-made bag means changing a purchase specification. Converters who invest in mono-material capability early convert that fear into orders, and the qualification work costs perhaps 900,000 dollars in structure development and shelf life testing. It also wins volume that would otherwise never have left roll stock. Structure development also travels with the converter who performed it, which makes the resulting volume considerably stickier than standard pouch work ever is.
Market Impact: Structure qualification costs around 900,000 dollars in total

Who Controls the Margin Pool

Concentration reaches only 17% across the top five measured on annual pre-made bag and pouch units converted, which is exceptionally low for a market of this size. The reason is freight rather than technology: a formed bag occupies roughly 5.8 times the truck space of roll stock, so economic shipping radius is short and thousands of regional converters serve their own catchments profitably. The gap between leader and challenger reflects geographic footprint rather than any capability difference.
Competitive activity runs on three fronts. Format capability is the first, since flat bottom and spouted work needs tooling and assembly equipment that general converters do not hold. Lead time and short-run flexibility is the second, and it is where regional converters beat distant low-cost supply. Structure development is the third, as brands push recyclability changes onto suppliers rather than onto their own machinery.

Pressure comes from two directions. Chinese converters keep taking long-haul volume wherever unit price gaps outrun the freight penalty, which happens most readily at the premium end. And falling form-fill-seal equipment prices pull mid-volume customers back toward making their own bags, which is where rankings will shift as the crossover threshold keeps drifting downward.
pre-made-bags-market-company-positioning-matrix-1787299848935

Competitive Moat and Risk Dimensions

AMCOR

Moat: Format breadth across many regions

Serving a multinational brand that wants the same pouch specification filled on three continents requires converting capability inside each freight radius, which very few suppliers hold. That footprint took decades and considerable capital to assemble and cannot be replicated by any regional converter regardless of technical quality. Freight economics make it durable in a way scale alone would not.
AMCOR

Risk: Regional converters win short runs

Assortment expansion favours short runs and fast changeovers, which a large multi-plant operation handles less nimbly than a local converter with one press and a hungry sales team. The growth in this market sits precisely in the fragmented short-run work. Scale advantages built for long runs apply least where the volume is actually moving.
PROAMPAC

Moat: Depth in premium pouch formats

Capability across flat bottom, spouted, and retort formats places a converter in the parts of this market where no forming line offers an alternative, which removes the crossover argument rather than requiring it to be won. Those formats also carry the highest realised prices and the shortest qualified supplier lists. Tooling and assembly equipment take years to build out properly.
PROAMPAC

Risk: Premium formats invite Asian entry

Chinese and Indian converters have moved up the specification range steadily, and premium formats carry unit prices wide enough to absorb long-haul freight where commodity pouches do not. The freight penalty that protects regional converters in standard work protects them far less at the premium end. Lead time and development responsiveness are the remaining defences.

Players Tracked

Prominent Players

Amcor
ProAmpac
Mondi
Sonoco
Huhtamaki

Other Key Players

Glenroy
American Packaging Corporation
TC Transcontinental
Berry Global
Winpak
UFlex
Constantia Flexibles
Coveris
Sealed Air
Bryce Corporation
Hood Packaging
Printpack
Wipak
Shining Sanhe
Guangdong Danqing Printing

Recent Developments

FEBRUARY 2025

Converter commissions flat bottom pouch line for premium coffee

A flexible packaging converter commissioned a dedicated flat bottom pouch line aimed at premium coffee and pet food customers requiring five printable panels and squared gussets. The investment was organic capital expenditure funded internally rather than any joint venture, acquisition, or partnership with a machinery builder or brand owner.
Signal: Formats with no roll stock equivalent remove the crossover argument entirely rather than merely winning it
MAY 2025

Machinery builder launches lower-cost form-fill-seal platform

A packaging machinery manufacturer introduced a form-fill-seal platform priced substantially below established European equivalents, aimed at mid-volume brands currently buying pre-made pouches. The launch was a product introduction rather than any joint venture, licensing arrangement, or acquisition of an existing machinery business. Installation lead times were quoted at four months.
Signal: Every reduction in forming equipment price drags the crossover threshold down and pulls volume off pre-made
SEPTEMBER 2025

Brand owner shifts recyclable structure conversion onto pouch suppliers

A consumer goods company chose to meet design-for-recycling requirements through pre-made pouch specification changes rather than by requalifying its own form-fill-seal lines during the compliance window. The decision was internal packaging policy rather than any framework supply agreement or arrangement with a particular converter. No converter was named.
Signal: Brands are moving the recyclability transition risk onto suppliers wherever the format allows them to do it

Film, Print Cylinders and Air

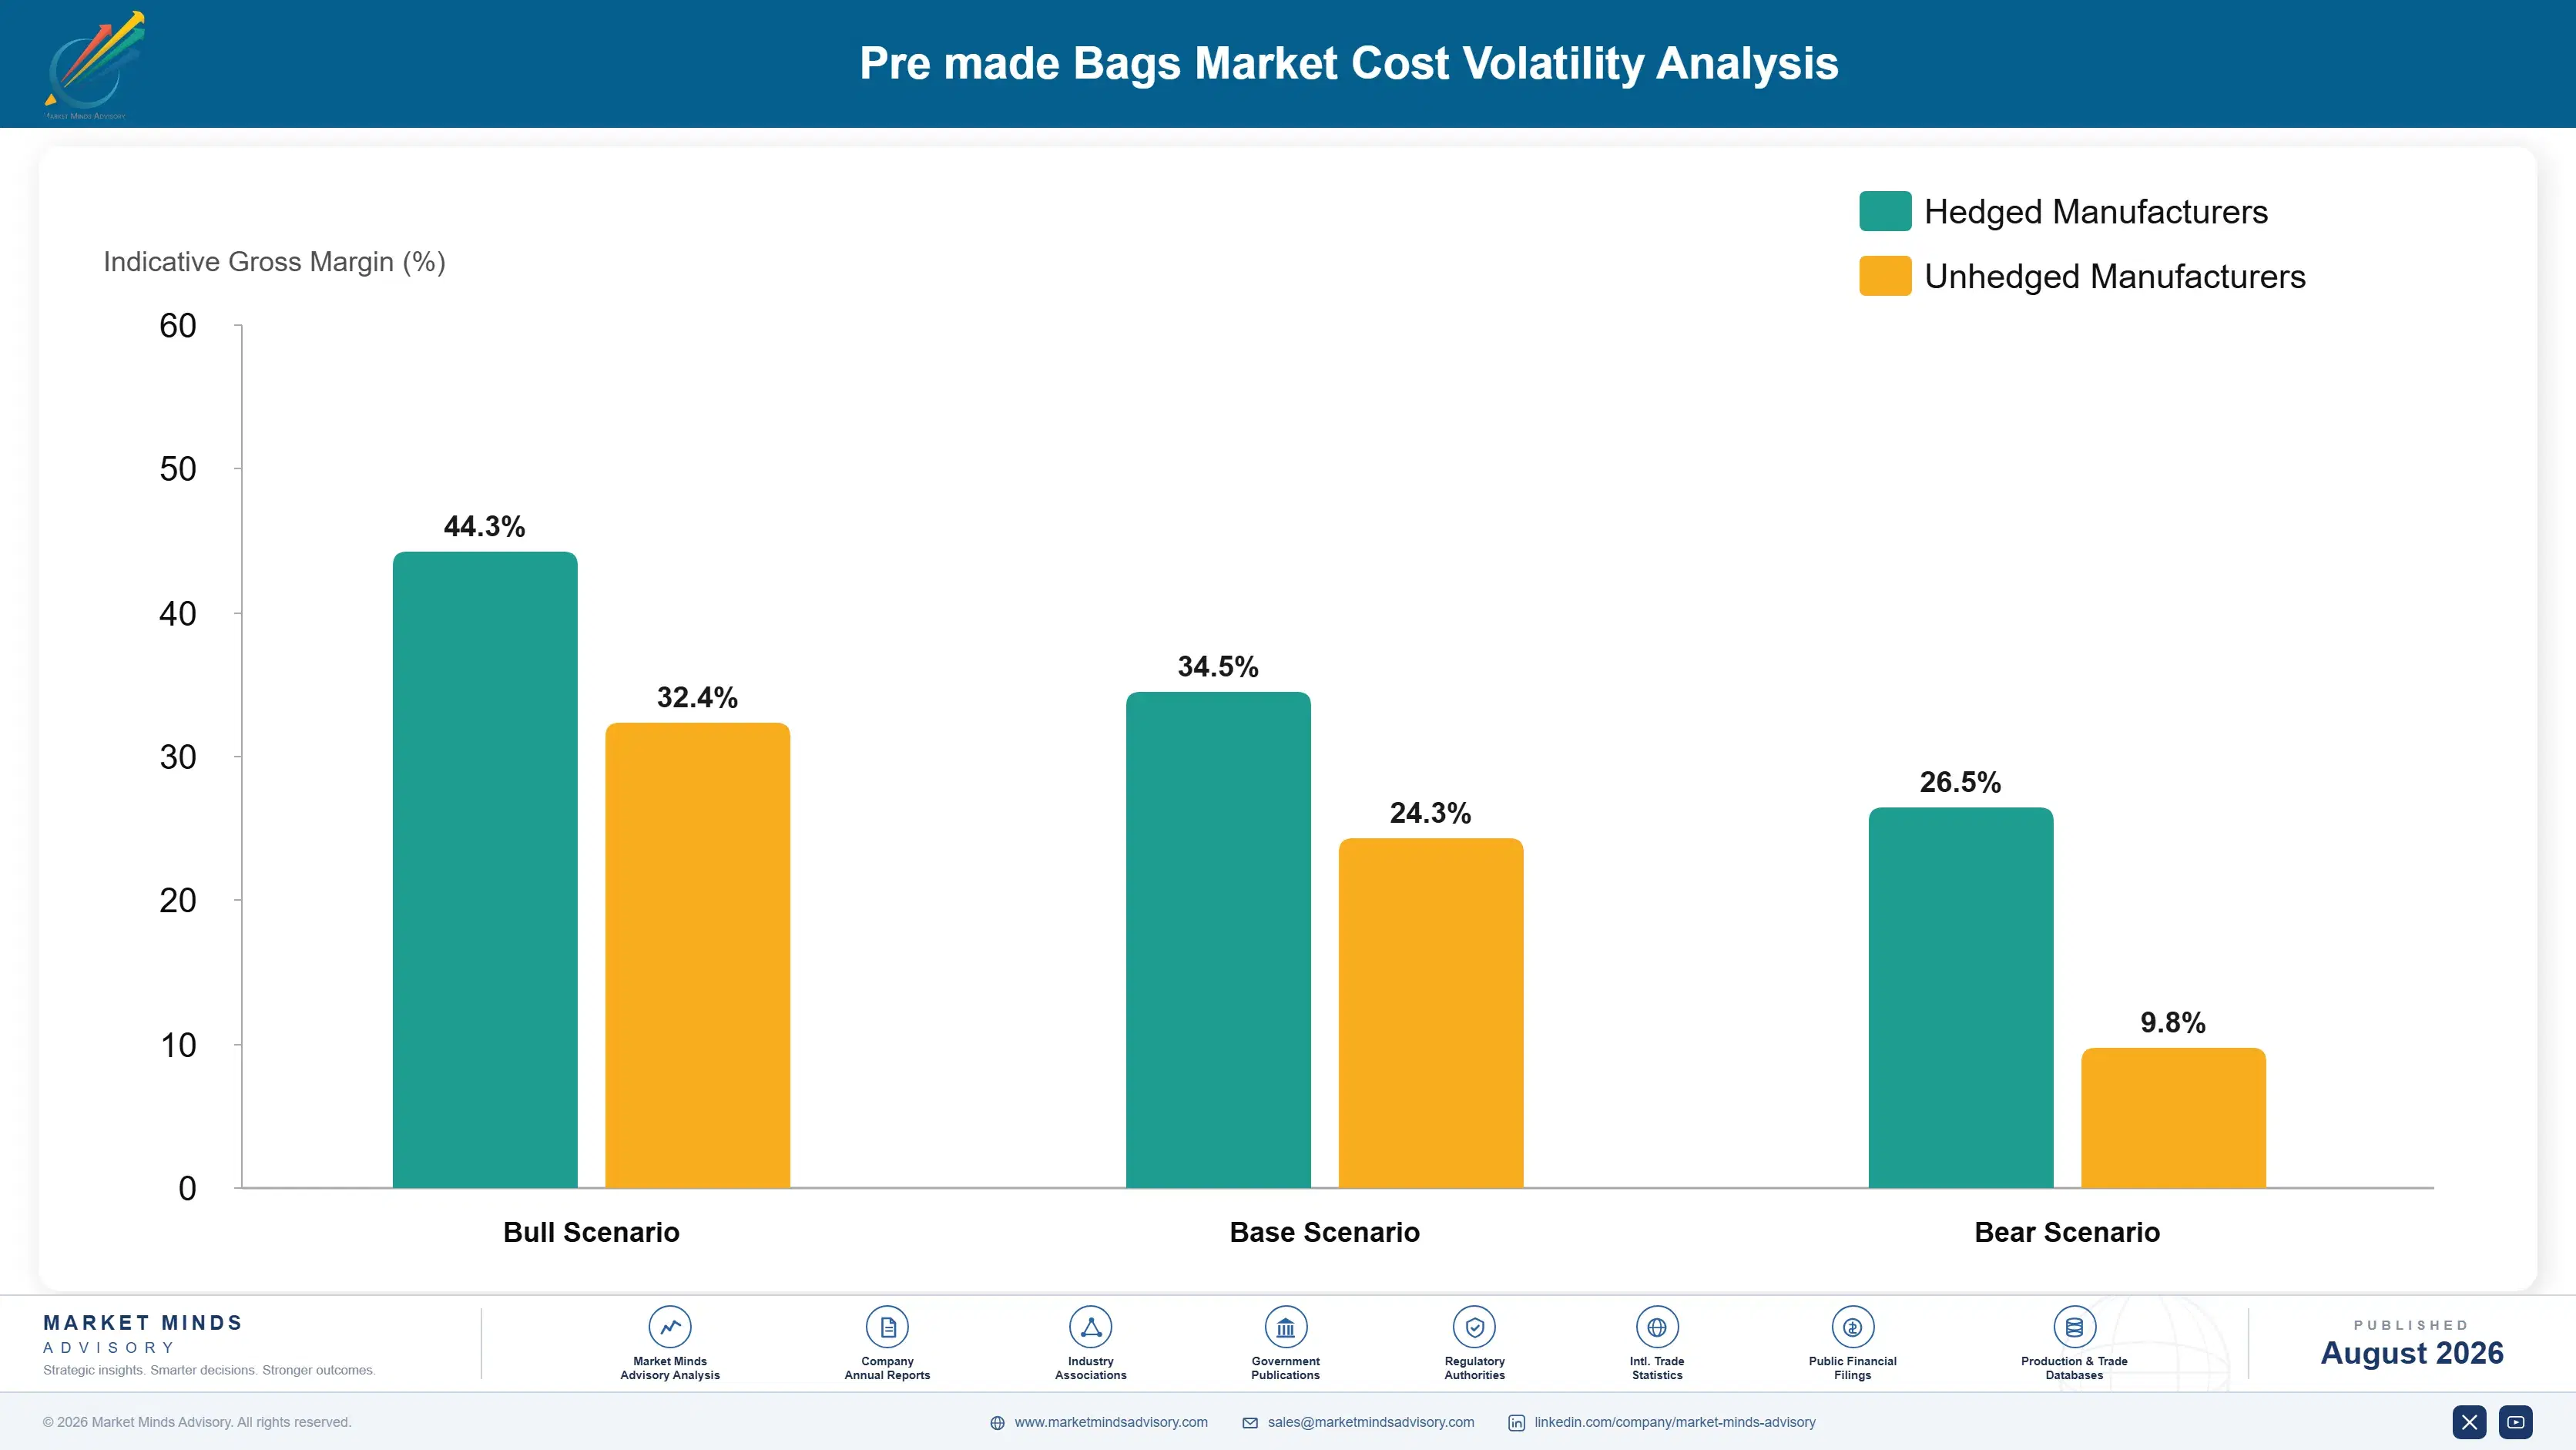
Laminate film dominates at roughly 58% of cost of goods, purchased from regional extruders and laminators or produced in house by integrated converters. Printing consumes about 14%, including cylinder or plate origination that is amortised over run length and therefore hits short runs hardest. Pouch forming, zippers, and spouts add around 13%, with outbound freight taking roughly 15%, unusually high because a formed bag ships as air.
Chinese plastics processing cost movement is the exposure that matters most, given how much conversion capacity sits there. China MIIT reporting on plastics processing industry output and cost documented substantial swings in resin and film pricing alongside energy and utility cost movement across recent years. Converters buying laminate film on spot terms absorbed those swings, while integrated operations producing their own film carried far smaller exposure.

The competitive disadvantage mechanism runs through run length rather than through purchasing scale. Print origination cost divides across the units produced, so a converter serving 34 SKU customers at short run lengths carries several times the origination cost per bag that a long-run converter does. Digital printing removes that penalty and carries higher cost per square metre instead, which is another calculation worth doing.
pre-made-bags-market-cost-volatility-analysis-1787299849130

Qualify digital printing for short run work deliberately

Cylinder origination amortised across a short run raises cost per bag sharply, and assortment expansion keeps shortening runs across most customers. Digital printing carries higher cost per square metre and no origination charge at all, which reverses the comparison below a calculable run length. Converters running both technologies route each job to whichever is cheaper rather than defending one press.

Integrate laminate film production where volume supports it

Film is 58% of cost of goods and buying it on spot terms exposes the entire book to price swings a converter cannot influence or predict at all. Integrated operations producing their own laminate absorbed recent movements far better than those purchasing at market did. Integration requires volume to justify the extrusion capital involved.

Design bags to nest and palletise more densely

Outbound freight runs roughly 15% of cost because a formed bag ships largely as air, occupying about 5.8 times the space of equivalent roll stock. Nested designs, compressed palletisation, and gusset folding recover a useful part of that penalty across every shipment thereafter. The engineering work is modest and the saving applies permanently to every unit shipped afterward.

Portfolio Architecture for Margin Defence

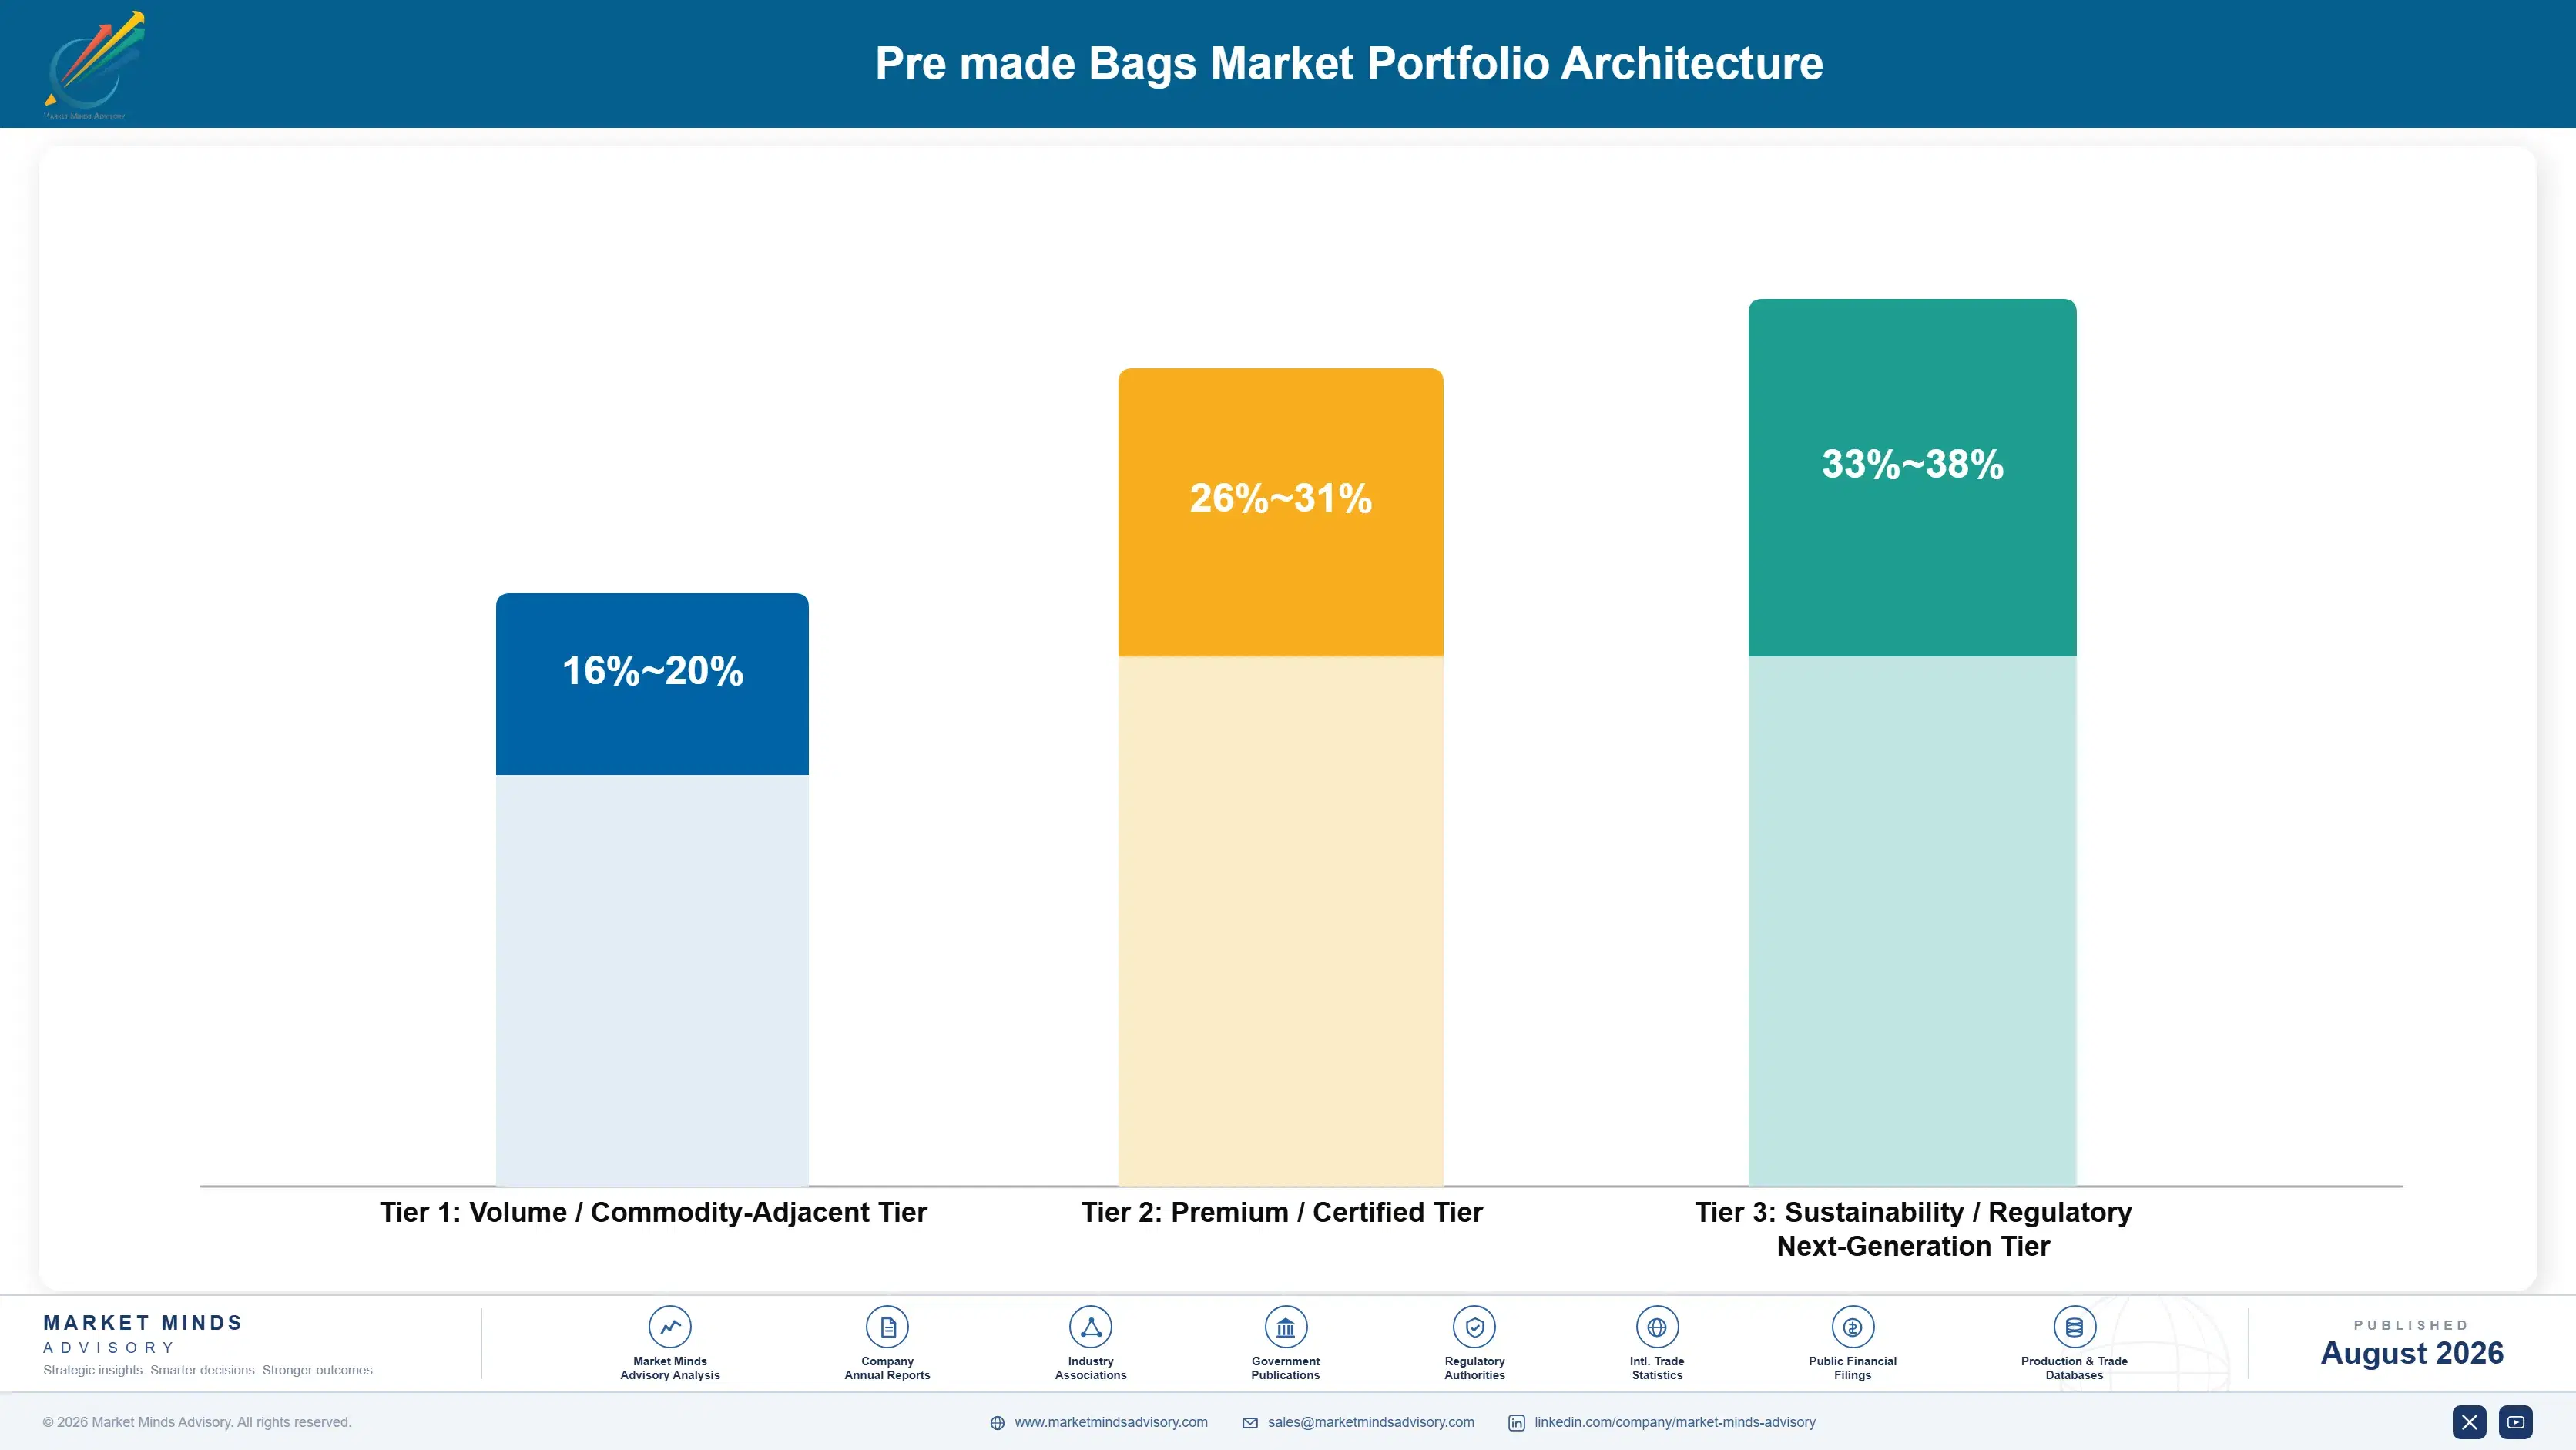
Three tiers describe this business and the spread is set by whether a forming line offers an alternative. Pillow and stand-up pouches sit at the bottom, where roll stock produces the same pack and the crossover argument is live at every renewal. Spouted and retort formats sit higher on assembly and process capability. Flat bottom and box pouches occupy a third tier because no forming line makes them at all.
The tension is that the contestable tier carries the volume and the relationship. A converter present on a customer's standard pillow and stand-up work is in the plant when premium formats are specified, and knows the schedule, the fillers, and the buyer. Converters chasing premium formats exclusively found themselves quoting into accounts somebody else already understood. Format advantage rarely outweighs knowing the schedule, the fillers, and the buyer.

High-value pools concentrate where a format cannot be formed on line and a structure cannot be requalified quickly. Flat bottom pouches, retort structures, and mono-material conversions under compliance deadlines all share that property, and none of them re-tender on unit price alone. That combination of format scarcity and timing pressure is where realised prices hold.

Volume / Commodity-Adjacent Tier

Pillow, flat, and standard stand-up pouches where roll stock formed on a filling line produces an equivalent pack. Thin margin under permanent crossover pressure, but the work that keeps a converter present in the plant when better formats get specified.
Gross Margin: 16-20%

Premium / Certified Tier

Spouted and retort-capable pouches requiring spout insertion, welding, and process validation that general pouch converters do not hold. Margin reflects assembly capability and a qualified supplier list far shorter than the format's apparent simplicity would suggest.
Gross Margin: 26-31%

Sustainability / Regulatory / Next-Generation Tier

Flat bottom and box pouches plus mono-material recyclable structures supplied with shelf life evidence. Best margin because no forming line produces these formats and because brands will pay to avoid requalifying machinery during a compliance window.
Gross Margin: 33-38%
pre-made-bags-market-portfolio-architecture-1787299849633

High-value Sub-segments and Strategic Watch-out

Flat Bottom And Box Pouches

Fastest growth at 9.9%, exactly 1.50 times the market rate, and effectively immune to the crossover argument since no roll stock alternative produces the same pack. Tooling and sealing geometry are demanding enough to keep the qualified converter list genuinely short. Realised prices sit well above stand-up work.
Gross Margin: 33-38%

Mono-Material Recyclable Conversions

Strong margin from brands avoiding filling line requalification during compliance windows, which is precisely when machinery downtime costs most. Converters absorb the technical difficulty and price it in, winning volume that would otherwise have stayed on roll stock indefinitely. The development work travels with whoever did it.
Gross Margin: 33-38%

Standard Stand-Up And Pillow Pouches

The volume core at thin margin, contested at every renewal by a forming line quotation and by distant low-cost converters. It nonetheless keeps a supplier inside the plant when premium formats are specified, which is where the actual margin in this business sits. Exiting it costs the relationship above.
Gross Margin: 16-20%

Mid-Volume Customer Accounts

The strategic watch-out, since falling form-fill-seal equipment prices drag the four million unit crossover downward and these customers are the first to move. Short-run flexibility and formats with no roll stock equivalent are the only durable defences available. These accounts move first when equipment prices fall.
Gross Margin: 16-20%

How Bag Volume Actually Recurs

Demand recurs per product rather than per customer, which sounds like a distinction without a difference and is not. A qualified bag specification runs for the commercial life of the product behind it, typically four to seven years for a packaged food line, and reorders happen against a standing schedule without anybody revisiting the choice. Losing a customer means losing several such products at once, but winning one usually means winning a single new launch and waiting.
Stickiness varies sharply by format. Flat bottom and spouted work sticks hardest, since requalifying a different converter's tooling and seal geometry takes months and no brand does it casually. Standard stand-up and pillow pouches stick least, re-tendering annually on unit price against both other converters and a machinery quotation. Mono-material conversions stick well because the structure development work travels with the converter who did it.

Buyer profiles have shifted toward operations and sustainability together. Procurement once decided almost everything on unit price, and now shares the decision with people managing filling schedules and compliance deadlines. That widens the argument a converter has to make, favouring suppliers who can talk credibly about line downtime and compliance deadlines.
pre-made-bags-market-end-use-penetration-index-1787299850122

What We Would Tell a Board

These are among the four positions where our research anticipates prominent divergence between winners and laggards over the coming forecast period. Each is grounded in the demand model, the regulatory perimeter, and the announced capacity pipeline.
01 / CROSSOVER ARGUMENT OWNERSHIP

Have the machine conversation before a salesperson does

Every mid-volume customer eventually divides forming line capital by the per-unit premium and lands somewhere near four million units, usually with a machinery salesperson holding the calculator. A converter who runs that arithmetic first, including changeover cost, tooling per format, start-up scrap, and operator time nobody budgets, generally finds the honest threshold sits well above the naive one. Avoiding that conversation does not prevent it happening at all, it only guarantees that somebody selling machinery gets to frame the arithmetic first.
02 / UNCONTESTABLE FORMAT DEPTH

Build what no forming line can produce at all

A flat bottom pouch with five printable panels and squared gussets has no roll stock equivalent, which removes the crossover argument rather than requiring a converter to win it every year. That format grows at 9.9% against 6.6% for the market and realises prices well above stand-up work on genuinely more demanding tooling and sealing geometry. Installing the capability costs around 2.8 million dollars per line, which is modest against permanently escaping a contest that can only ever be drawn rather than won.
03 / FREIGHT RADIUS DISCIPLINE

You are shipping air and paying for it in margin

A formed bag occupies roughly 5.8 times the truck space of the roll stock that would make the same pack, so freight consumes margin here faster than in almost any comparable category. Converters serving customers beyond an economic radius are quietly subsidising delivery from conversion margin, usually without ever having calculated it. Mapping customers against plant geography and acting on the answer typically recovers three to five margin points, and remarkably few converters have ever run that analysis properly or acted on it.
04 / COMPLIANCE RISK ABSORPTION

Brands will pay to keep their lines running

Converting a filling line to a mono-material recyclable structure means requalification, retuning, and slower running at exactly the moment a compliance deadline makes downtime least affordable for anybody. Changing a pre-made bag means changing a purchase specification on an order form and nothing else at all. Converters investing perhaps 900,000 dollars in structure development and shelf life testing convert that fear directly into orders, and much of that is volume which would never otherwise have left roll stock at all.

Engagement Snapshot From the Field

A live engagement with an industry participant carrying material or product regulatory and market exposure ahead of a defining policy shift, showing how our research translates into a defensible multi-year portfolio strategy.
MARKET MINDS ADVISORY · CLIENT ENGAGEMENT SUMMARY
Pre made Bags Producer Strategic Portfolio Review and Transition Roadmap 2026·Investment Scenario on Pre made Bags Exposure Evaluation 2025-26
CLIENT PROFILE
A regional pouch converter with approximately 165 million dollars in annual revenue (client-reported, unverified by MMA), operating four plants and supplying food, pet care, and household goods customers across two countries. The range was weighted heavily toward stand-up and pillow formats, held no flat bottom capability, and priced freight into a national delivered rate regardless of distance.
STRATEGIC CHALLENGE
Three mid-volume customers had installed their own form-fill-seal lines within two years and volume had fallen accordingly, while gross margin declined in each of those years. Management proposed reducing unit prices to defend remaining mid-volume accounts. The board wanted an independent read on whether price would hold those customers before approving a margin reduction across the book.
MMA APPROACH
We rebuilt the crossover calculation for every account, including changeover cost, tooling per format, start-up scrap, and operator time that customer business cases had omitted. Delivered margin was recalculated by customer using actual freight rather than the national rate. Format capability was mapped against the fastest growing demand, and lost accounts were interviewed on what had actually decided the machinery purchase.
KEY FINDINGS
  1. Every lost account had used a machinery supplier's crossover calculation that excluded changeover, tooling, and scrap, and the corrected threshold sat well above their actual volumes.
  2. Delivered margin on the furthest 18% of customers was negative once actual freight was applied, and the national delivered rate had concealed it for years.
  3. The client held no flat bottom capability at all, which excluded it from the fastest growing format and from the accounts least exposed to any crossover argument.
  4. Two further mid-volume customers were actively evaluating forming equipment, and neither had been shown a corrected calculation by anybody at the client.
CLIENT PROFILE
A regional pouch converter with approximately 165 million dollars in annual revenue (client-reported, unverified by MMA), operating four plants and supplying food, pet care, and household goods customers across two countries. The range was weighted heavily toward stand-up and pillow formats, held no flat bottom capability, and priced freight into a national delivered rate regardless of distance.
STRATEGIC CHALLENGE
Three mid-volume customers had installed their own form-fill-seal lines within two years and volume had fallen accordingly, while gross margin declined in each of those years. Management proposed reducing unit prices to defend remaining mid-volume accounts. The board wanted an independent read on whether price would hold those customers before approving a margin reduction across the book.
MMA APPROACH
We rebuilt the crossover calculation for every account, including changeover cost, tooling per format, start-up scrap, and operator time that customer business cases had omitted. Delivered margin was recalculated by customer using actual freight rather than the national rate. Format capability was mapped against the fastest growing demand, and lost accounts were interviewed on what had actually decided the machinery purchase.
KEY FINDINGS
  1. Every lost account had used a machinery supplier's crossover calculation that excluded changeover, tooling, and scrap, and the corrected threshold sat well above their actual volumes.
  2. Delivered margin on the furthest 18% of customers was negative once actual freight was applied, and the national delivered rate had concealed it for years.
  3. The client held no flat bottom capability at all, which excluded it from the fastest growing format and from the accounts least exposed to any crossover argument.
  4. Two further mid-volume customers were actively evaluating forming equipment, and neither had been shown a corrected calculation by anybody at the client.
RECOMMENDED STRATEGY
Phase 1: Phase 1 (months one to six): cancel the price reduction and take a corrected crossover calculation to every mid-volume account personally. Phase 2: Phase 2 (months six to twenty): reprice or exit customers outside the economic freight radius and consolidate delivery routing accordingly. Phase 3: Phase 3 (months twenty to thirty-six): install flat bottom pouch capability and build into premium coffee and pet food. Those formats face no crossover argument.
OUTCOME
The price reduction was cancelled. Both customers evaluating forming equipment stayed after seeing the corrected arithmetic, delivered margin improved by more than three points once distant accounts were repriced, and flat bottom capability was approved for installation (client-reported, unverified by MMA). Two further accounts were retained the following quarter.

Frequently Asked Questions

Foundational context covering the market sizes, CAGR, scope, country, region and competition that inform every finding below. This section is provided to cover basics and most often pre-purchase conversations, answered from the MMA Primary Research Dataset.

What is the current size of the Pre made Bags Market?

The market is valued at USD 28.5 billion in 2025, rising to USD 30.38 billion in 2026. Scope covers bags and pouches supplied already formed, not roll stock for form-fill-seal.

How large will the Pre made Bags Market be by 2036?

MMA forecasts USD 57.56 billion by 2036, an increase of USD 27.18 billion over the 2026 base. That represents an expansion multiple of 1.89 times across the forecast period.

What is the CAGR for the Pre made Bags Market 2026 to 2036?

The base case CAGR is 6.6%, with a bull case of 7.8% and a bear case of 5.4%. The historical rate from 2020 to 2025 was 5.6%, so growth is accelerating modestly.

Which segment is growing fastest?

Flat bottom and box pouches at 9.9%, exactly 1.50 times the market rate. No form-fill-seal line produces the same pack, which removes the crossover argument entirely for this format.

Who are the major companies in the Pre made Bags Market?

Amcor, ProAmpac, Mondi, Sonoco, and Huhtamaki lead on annual bag and pouch units converted. The top five hold only 17%, because freight economics keep this a regional business.

Which country is growing fastest?

India at 9.6%, driven by extreme domestic brand proliferation across spice, snack, dairy, and personal care categories with run lengths too short to justify forming equipment.

Report Segmentation Architecture

The full report scope spans multiple orthogonal segmentation dimensions, with cross-tabulated demand data provided for each dimension pair. Coverage extends further to regional breakdowns, trend trajectories, and the competitive detail needed to support segment-level decision-making.

By Bag Format

  • Pillow And Flat Pouches
  • Stand-Up Pouches
  • Flat Bottom And Box Pouches
  • Spouted Pouches
  • Side Gusset And Quad Seal Bags
  • Retort-Capable Pre-Made Pouches

By End-Use Industry

  • Packaged Food And Snacks
  • Coffee, Tea And Beverages
  • Pet Food And Animal Nutrition
  • Household And Personal Care
  • Agricultural And Industrial Products

By Customer Type

  • Multinational Brand Owners
  • Regional And Emerging Brands
  • Contract Packers And Co-Manufacturers
  • Private Label Manufacturers
  • Packaging Distributors And Resellers

By Region

  • East Asia
  • North America
  • Western Europe
  • South Asia and Pacific
  • Latin America
  • Eastern Europe
  • Middle East and Africa

Scope, Methodology, and Coverage

Every figure in this report is reproducible from documented input assumptions. The scope below maps the historical period, the forecast horizon, the segmentation dimensions, and the countries covered, alongside the underlying primary and qualitative methodology.
Historical Period
2020 to 2025
Forecast Period
2026 to 2036
Base Year
2025 (USD billions; MMA Primary Research Dataset, August 2026)
Market Definition
This market comprises flexible bags and pouches supplied to fillers in already formed condition, measured at converter realised prices for printed and unprinted output across all end-use categories. Format coverage spans pillow and flat pouches, stand-up pouches, flat bottom and box pouches, spouted pouches including fitment supply, side gusset and quad seal bags, and retort-capable pre-made pouches. Roll stock supplied for form-fill-seal conversion on a filling line, rigid and semi-rigid packaging, paper sacks and bags without a polymer barrier layer, filling, pouching and form-fill-seal machinery, closures and fitments sold separately, and base film extrusion and lamination fall outside scope.
Quantitative Units
USD billions (current prices); billion bag units converted; realised price per bag; average run length per specification
Segmentation Dimensions
By Bag Format; By End-Use Industry; By Customer Type; By Region
Regions Covered
East Asia, North America, Western Europe, South Asia and Pacific, Latin America, Eastern Europe, Middle East and Africa
Countries Covered
China, Japan, South Korea, Taiwan, India, Vietnam, Indonesia, Thailand, Australia, USA, Canada, Mexico, Germany, Italy, Spain, France, UK, Netherlands, Belgium, Poland, Czechia, Hungary, Romania, Turkey, Brazil, Argentina, Colombia, Chile, Saudi Arabia, UAE, Egypt, Morocco, South Africa, and additional markets relevant to this sector
Key Companies Profiled
Amcor, ProAmpac, Mondi, Sonoco, Huhtamaki, Glenroy, American Packaging Corporation, TC Transcontinental, Berry Global, Winpak, UFlex, Constantia Flexibles, Coveris, Sealed Air, Bryce Corporation, Hood Packaging, Printpack, Wipak, Shining Sanhe, Guangdong Danqing Printing
Quantitative Methodology
Primary survey, n=3,800 respondents, Q4 2025, six countries; demand-side model with trade association cross-validation
Qualitative Methodology
47 expert interviews, Q4 2025; applied to validate demand model assumptions, identify emerging dynamics, and assess competitive positioning
Report Format
PDF and XLSX data workbook (Word format preview document)
Publisher
Market Minds Advisory
Report Code
MMA-2026-PAC-462
Published
August 2026
Contact
sales@marketmindsadvisory.com | www.marketmindsadvisory.com

Purchase the full Pre made Bags Market Report (2026 to 2036).

The full report sizes pre-made bags across six formats, five end-use industries, five customer types, and seven regions, with country detail for the thirty largest markets. Crossover economics against form-fill-seal are modelled by format and volume band, including changeover cost, tooling, and start-up scrap that customer business cases routinely omit. Freight penalty against roll stock is quantified by format and shipping distance to establish economic conversion radius. Competitive profiling covers twenty companies on annual bag units converted. Run length distribution is analysed against print origination cost by technology.
Crossover economics modelled against form-fill-seal by volume
Freight penalty quantified by format and shipping distance
Run length distribution analysed against print origination cost
Format capability mapped across converters by region
Mono-material conversion routes compared across bag and roll
Co-packer active SKU counts benchmarked by end-use category

Built For The People Who Decide

From boardroom strategy to bench-side execution, this report is read cover-to-cover by leaders shaping the next decade of their industry, turning demand scenarios, market dynamics and valuation benchmarks into decisions.
CXOs/ Presidents/ VPs/ Managers
M&A and Corporate Development
Strategy Teams and R&D Heads
Procurement and Product Directors
Regulatory and Compliance Leaders
Investor Relations and Equity Analysts