Market Minds Advisory
Power Transmission Lines and Towers Market

Power Transmission Lines and Towers Market: Power Transmission Lines and Towers Market: The Corridor Is Worth More Than The Line

A new line takes eleven years and most of that is permission, not construction. Doubling the capacity of a line that already exists takes eighteen months and no new corridor at all.

Lead Analyst

Published

September 2026

Make Smarter Decisions with Customized Research Insights

Request a free sample report and evaluate market opportunities, growth trends, and competitive dynamics relevant to your business needs.

2025 MARKET VALUE$68.0BMarket Size 2025
2036 FORECAST VALUE$146.1BBase Case , 2026 to 2036
CAGR 2026 TO 20367.2 %Bull 8.4% / Bear 6.0%
INCREMENTAL OPPORTUNITY$73.2BNet 10- year value creation
EXPANSION MULTIPLE2.00x2036 value over 2026 base
Strategic Levers
M&A Pipeline
Regional Outlook
Country Rankings
Competitive Intelligence
Segmental Deep-dive
Call-Us : 91 93563 13602

Executive Snapshot and Market Trajectory.

The grid is the bottleneck in the energy transition and everybody now agrees about that. What almost nobody has followed through is the consequence: a new corridor takes eleven years, so the capacity that arrives this decade will come from upgrading lines that already exist today.
High-temperature low-sag conductors grow at 10.8%, half again the market rate of 7.2%, because replacing conductor on existing towers roughly doubles capacity without a new right of way, a new permit or a new tower. East Asia holds 30% of demand on a Chinese ultra-high-voltage programme larger than the rest of the world's transmission construction combined, and Chinese tower fabricators and conductor mills now supply projects on four other continents as well as at home.
Concentration is remarkably low at 22%, because towers are fabricated regionally, conductors are drawn regionally and erection is done by local crews with local licences. Nobody has ever consolidated it and the freight economics say nobody will. The commercially decisive capability is not manufacturing at all: it is holding rights of way, which cannot be bought, built or imported from anywhere. Utilities hold them and almost nobody else does.
Market Definition
The power transmission lines and towers market covers the physical components and structures that carry electricity at transmission voltage above 66 kilovolts overhead, spanning lattice steel transmission towers, tubular steel and concrete poles, conventional ACSR and AAAC conductors, high-temperature low-sag conductors, insulators and line hardware, and optical ground wire with associated line communications. Scope is measured as delivered component value across new-build and reconductoring projects. Excluded are substations and transformers, underground and submarine cables, distribution voltage networks below 66 kilovolts, switchgear, and grid control software.
Base Year Value
$68.0B in 2025 (MMA Primary Research Dataset, August 2026)
Forecast Period
2026 to 2036, eleven discrete annual values
CAGR
7.2% base case. Bull 8.4%. Bear 6.0%.
Fastest Growth Segment
High-Temperature Low-Sag Conductors: 10.8% CAGR
Fastest Growth Country
India: 9.5% CAGR
Fastest Growth Region
South Asia and Pacific: 9.5% CAGR
Largest Region
East Asia: 30% of 2025 global value
Market Leaders
Prysmian, Nexans, KEC International, Valmont Industries and Sumitomo Electric. Source: MMA Analysis, July 2026.
Primary Survey
n=3,800 procurement and R&D decision-makers, Q4 2025, six countries
Methodology
Demand-side build-up, cross-validated against public data, 47 expert interviews

Power Transmission Lines and Towers Market Forecast Scenarios

power-transmission-lines-and-towers-market-size-forecast-scenario-1788193750309
Between 2020 and 2025 the sector compounded at 6.0%, and the number conceals two opposite movements. Order books filled with announced projects at a rate nobody had seen since the post-war build, while actual construction lagged years behind because permitting and right-of-way acquisition did not accelerate at all. Backlog grew faster than revenue throughout, which flattered almost everybody's reported position quite considerably.
The 7.2% base case rests on three mechanisms. Renewable interconnection queues hold more generation capacity than the grid can accept, and that gap converts directly into transmission procurement. Reconductoring with high-temperature conductors delivers capacity inside a political cycle rather than across three of them, which is why it grows fastest. And ageing conductor installed in the 1960s and 1970s across North America and Europe is reaching replacement regardless of the transition. None of the three depends on new corridors being approved.
The bull case at 8.4% turns on permitting reform shortening the eleven year corridor timeline, which several governments have promised and none has delivered. The bear case at 6.0% is aluminium and steel: both are energy-intensive commodities subject to trade measures, and a move in either pushes projects past the point where a regulator approves a tariff.

Eleven Years For A Corridor

Eleven years is the median from route selection to energisation on a greenfield corridor, and 78% of that time is consumed before a single foundation is dug. Landowner negotiation, environmental assessment, judicial review and regulatory approval all run in sequence rather than in parallel. The engineering takes about eighteen months. A supplier reading a project announcement is looking at revenue that arrives in the next decade.
TOP FIVE CONCENTRATION22%Share of delivered volume held by the five largest suppliers
NEW LINE LEAD TIME11 yearsMedian from route selection to energisation on greenfield corridors
RECONDUCTORING CAPACITY GAIN94%Capacity added by replacing conductor on existing tower lines
ALUMINIUM COST SHARE36%Portion of conductor cost accounted for by primary metal
PERMITTING SCHEDULE SHARE78%Portion of project timeline consumed before any construction begins
CORRIDOR REUSE RATE41%Portion of new capacity delivered inside existing rights of way
That arithmetic explains why reconductoring has become the growth story rather than new construction. Replacing conventional ACSR with a high-temperature low-sag conductor on the same towers and inside the same corridor adds roughly 94% capacity, needs no new right of way and no new environmental consent, and completes in months. Some 41% of new transmission capacity is now delivered inside existing rights of way, and that share keeps climbing.
The cost base is two commodities and very little else. Aluminium is 36% of conductor cost and galvanised steel dominates a lattice tower, and both are energy-intensive metals subject to trade measures in most producing regions. This is a commodity pass-through business dressed as an engineering one, and the participants who survive metal cycles are the ones who wrote the contracts properly.
"Every utility in the world has a list of lines it wants to build and a much shorter list it can actually get permission for. The interesting question is what you do with the corridors you already hold, and remarkably few of them have a serious answer."
Director, Transmission Infrastructure Practice · MMA Energy Practice · August 2026

Market Trends

Reconductoring replaced new build as the capacity route

Replacing conventional conductor with high-temperature low-sag material on existing towers adds around 94% capacity without a new corridor, a new environmental consent or a new tower foundation, and it completes in months rather than across an eleven year permitting cycle. That makes it the only route to meaningful capacity inside a political term, which is why 41% of new transmission capacity now arrives inside existing rights of way. High-temperature conductors grow at 10.8% against a market rate of 7.2% for that single reason, and utilities that dismissed the technology a decade ago are now specifying it by default.
Market Impact: Drives 30% of world demand
Interconnection queues converted directly into transmission orders

Renewable and storage projects waiting for grid connection now exceed the capacity of the networks meant to carry them across North America, Europe, India and Australia, and those queues have become the most quoted evidence in every transmission tariff case filed. Regulators approving investment want queue relief rather than reliability arguments, which changes the case a utility builds and the projects that get funded. The commercial consequence for suppliers is that order books fill from a constraint nobody in this sector created, and it will not clear inside the forecast period.
Market Impact: Replaces conductor installed 60 years ago

Market Opportunities and Growth Drivers

Chinese ultra-high-voltage construction dwarfs everything else

China has built more transmission line at ultra-high voltage in a decade than the rest of the world holds in total, connecting western generation to eastern load across distances no other country attempts. The programme continues, and it has produced a fabrication and conductor drawing base at a scale and cost that now supplies projects across Africa, South America, the Middle East and South Asia. East Asia takes 30% of category demand as a result. Competing against that on price is not a strategy any Western fabricator has made work for very long.
Market Impact: Consumes 78% of project schedule

Ageing conductor is reaching replacement regardless

Conductor installed across North America and Western Europe in the 1960s and 1970s is reaching the end of its service life on a schedule that has nothing to do with the energy transition, and annealing, corrosion and repeated thermal cycling all show up in inspection records now. That replacement is not discretionary and it does not require a regulator to approve new capacity. Utilities are increasingly combining the mandatory replacement with a high-temperature upgrade, which delivers capacity on a maintenance budget rather than through a capital case. That single move has quietly reshaped procurement.
Market Impact: Exposes 36% of conductor cost

Market Restraints and Challenges

Permitting consumes most of every project schedule

Route selection to energisation runs eleven years on a greenfield corridor and 78% of that elapses before construction starts, because landowner negotiation, environmental assessment, judicial review and regulatory approval proceed one after another rather than together. The root cause is that transmission crosses jurisdictions while consent is granted locally, so any single objector can add years. Commercial impact is a backlog that converts to revenue slowly and unpredictably. Participants are responding by targeting reconductoring work that needs no consent, bidding replacement programmes, and pricing schedule risk into contracts rather than absorbing it.
Market Impact: Adds 94% capacity per line

Metal pricing moves faster than tariff approvals

Aluminium is 36% of conductor cost and galvanised steel dominates tower cost, and both reprice on energy markets and trade measures within weeks while a regulated tariff takes years to adjust. The root cause is a mismatch between commodity markets and regulatory process that neither side can fix. Commercial impact is that a supplier holding a firm-price multi-year contract carries an exposure no operational improvement can offset. Mitigation runs through metal escalation clauses, hedging programmes, shorter price validity on tenders and back-to-back supply agreements with mills. Nobody in this sector is a metals trader.
Market Impact: Fills order books across 4 regions
3 additional market trends, 4 additional growth drivers, and 2 additional restraints and challenges are covered in the full report. Contact sales@marketmindsadvisory.com to access the complete intelligence.

Segment CAGR and Growth Architecture

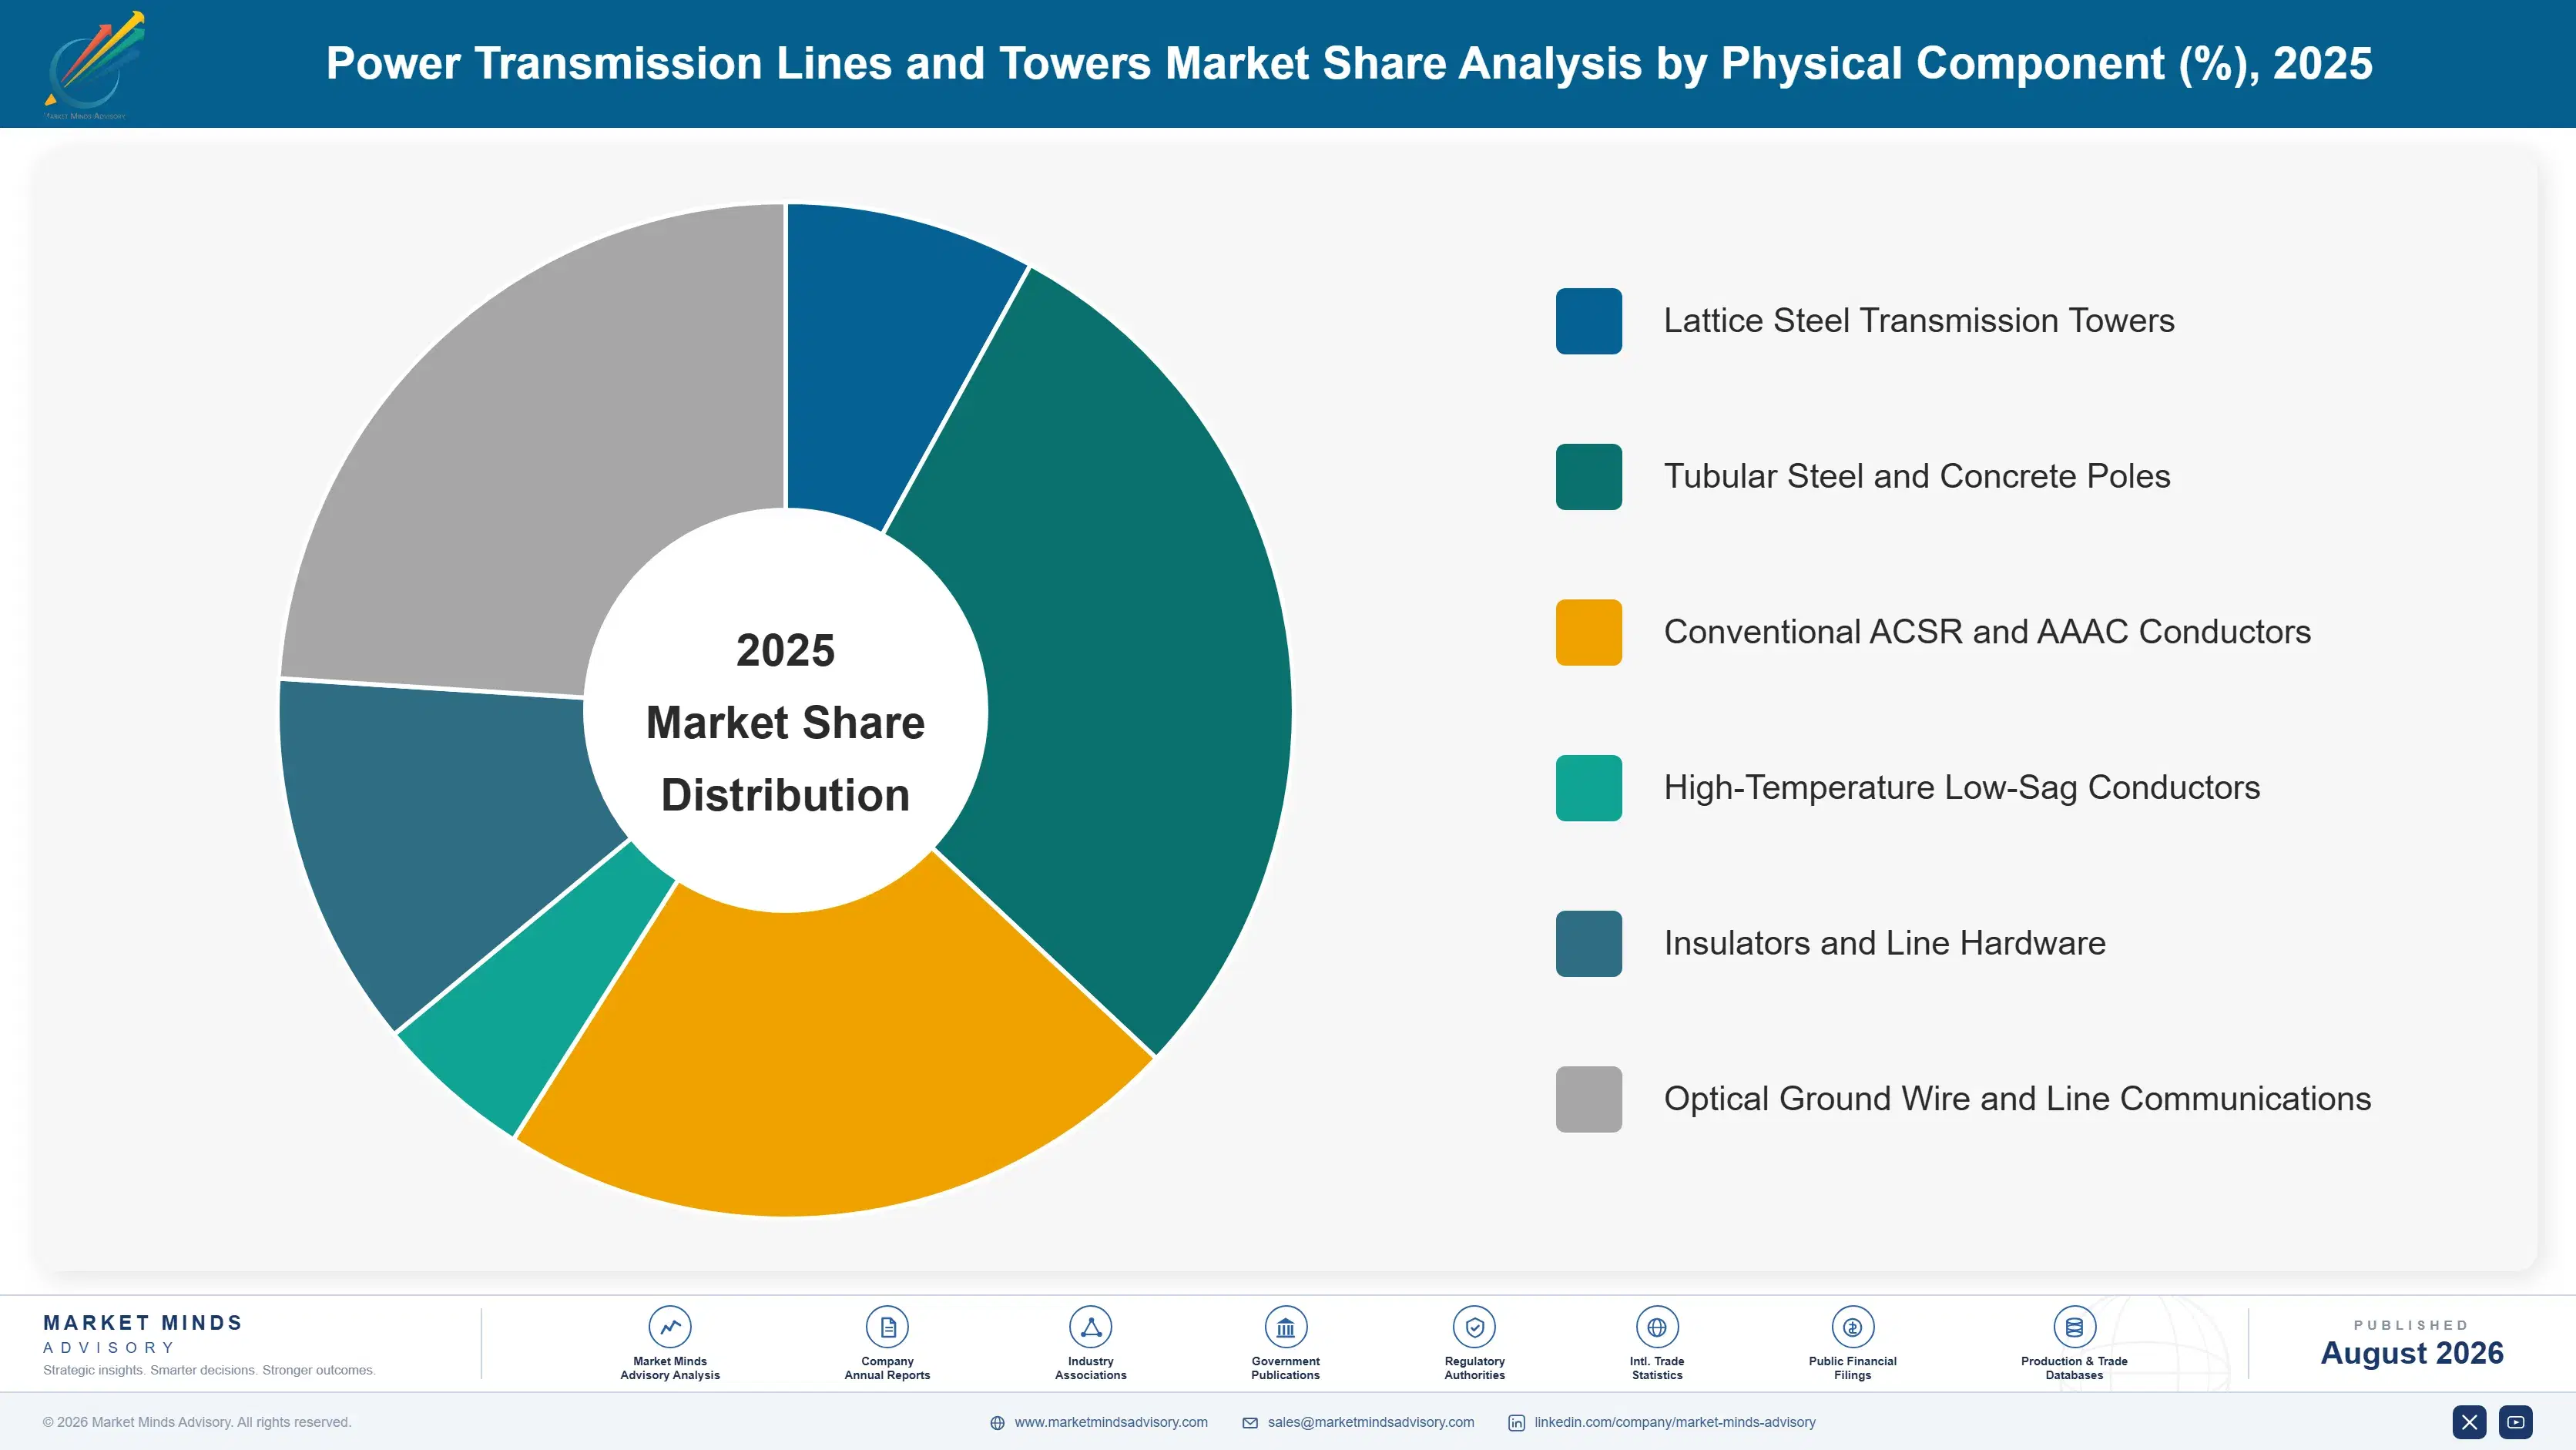
Segmentation follows physical component, the dimension on which metal content, manufacturing route and replacement cycle all move together. Lattice towers and conventional conductor carry the volume on projects that take a decade to reach construction. High-temperature conductor and optical ground wire carry the growth, because both go onto lines that already exist and already have permission.
power-transmission-lines-and-towers-market-market-share-analysis-1788193750871

High-Temperature Low-Sag Conductors

High-temperature low-sag conductors grow at 10.8%, half again the market rate of 7.2%, and the reason is regulatory rather than metallurgical. A composite or annealed-aluminium core conductor runs hotter without sagging into the clearance envelope, which means it carries roughly 94% more current on the same towers inside the same corridor. No new right of way, no environmental consent and no new foundation is required, so the work completes in months against eleven years for a greenfield line. Unit price runs several times conventional ACSR and utilities pay it without much argument, because the alternative is waiting a decade. Supply is concentrated among a handful of qualified producers and qualification takes years.
CAGR 10.8%

Optical Ground Wire and Line Communications

Optical ground wire at 8.6% does two jobs from one installation, shielding the line from lightning while carrying fibre for protection signalling and utility communications. Every reconductoring project and every new line installs it now, and a large installed base of plain earth wire is being replaced with it during outages that were scheduled anyway. Utility demand is only part of the story: spare fibre pairs in a transmission corridor are commercially valuable to telecommunications operators, and several utilities have built genuine revenue lines from leasing them. That secondary income is rarely counted when the transmission case is made, which understates the return on the whole installation. Very few transmission cases count it.
CAGR 8.6%
Full segment breakdown across 6 segments available in the complete report.

Regional Architecture and Country Demand Map

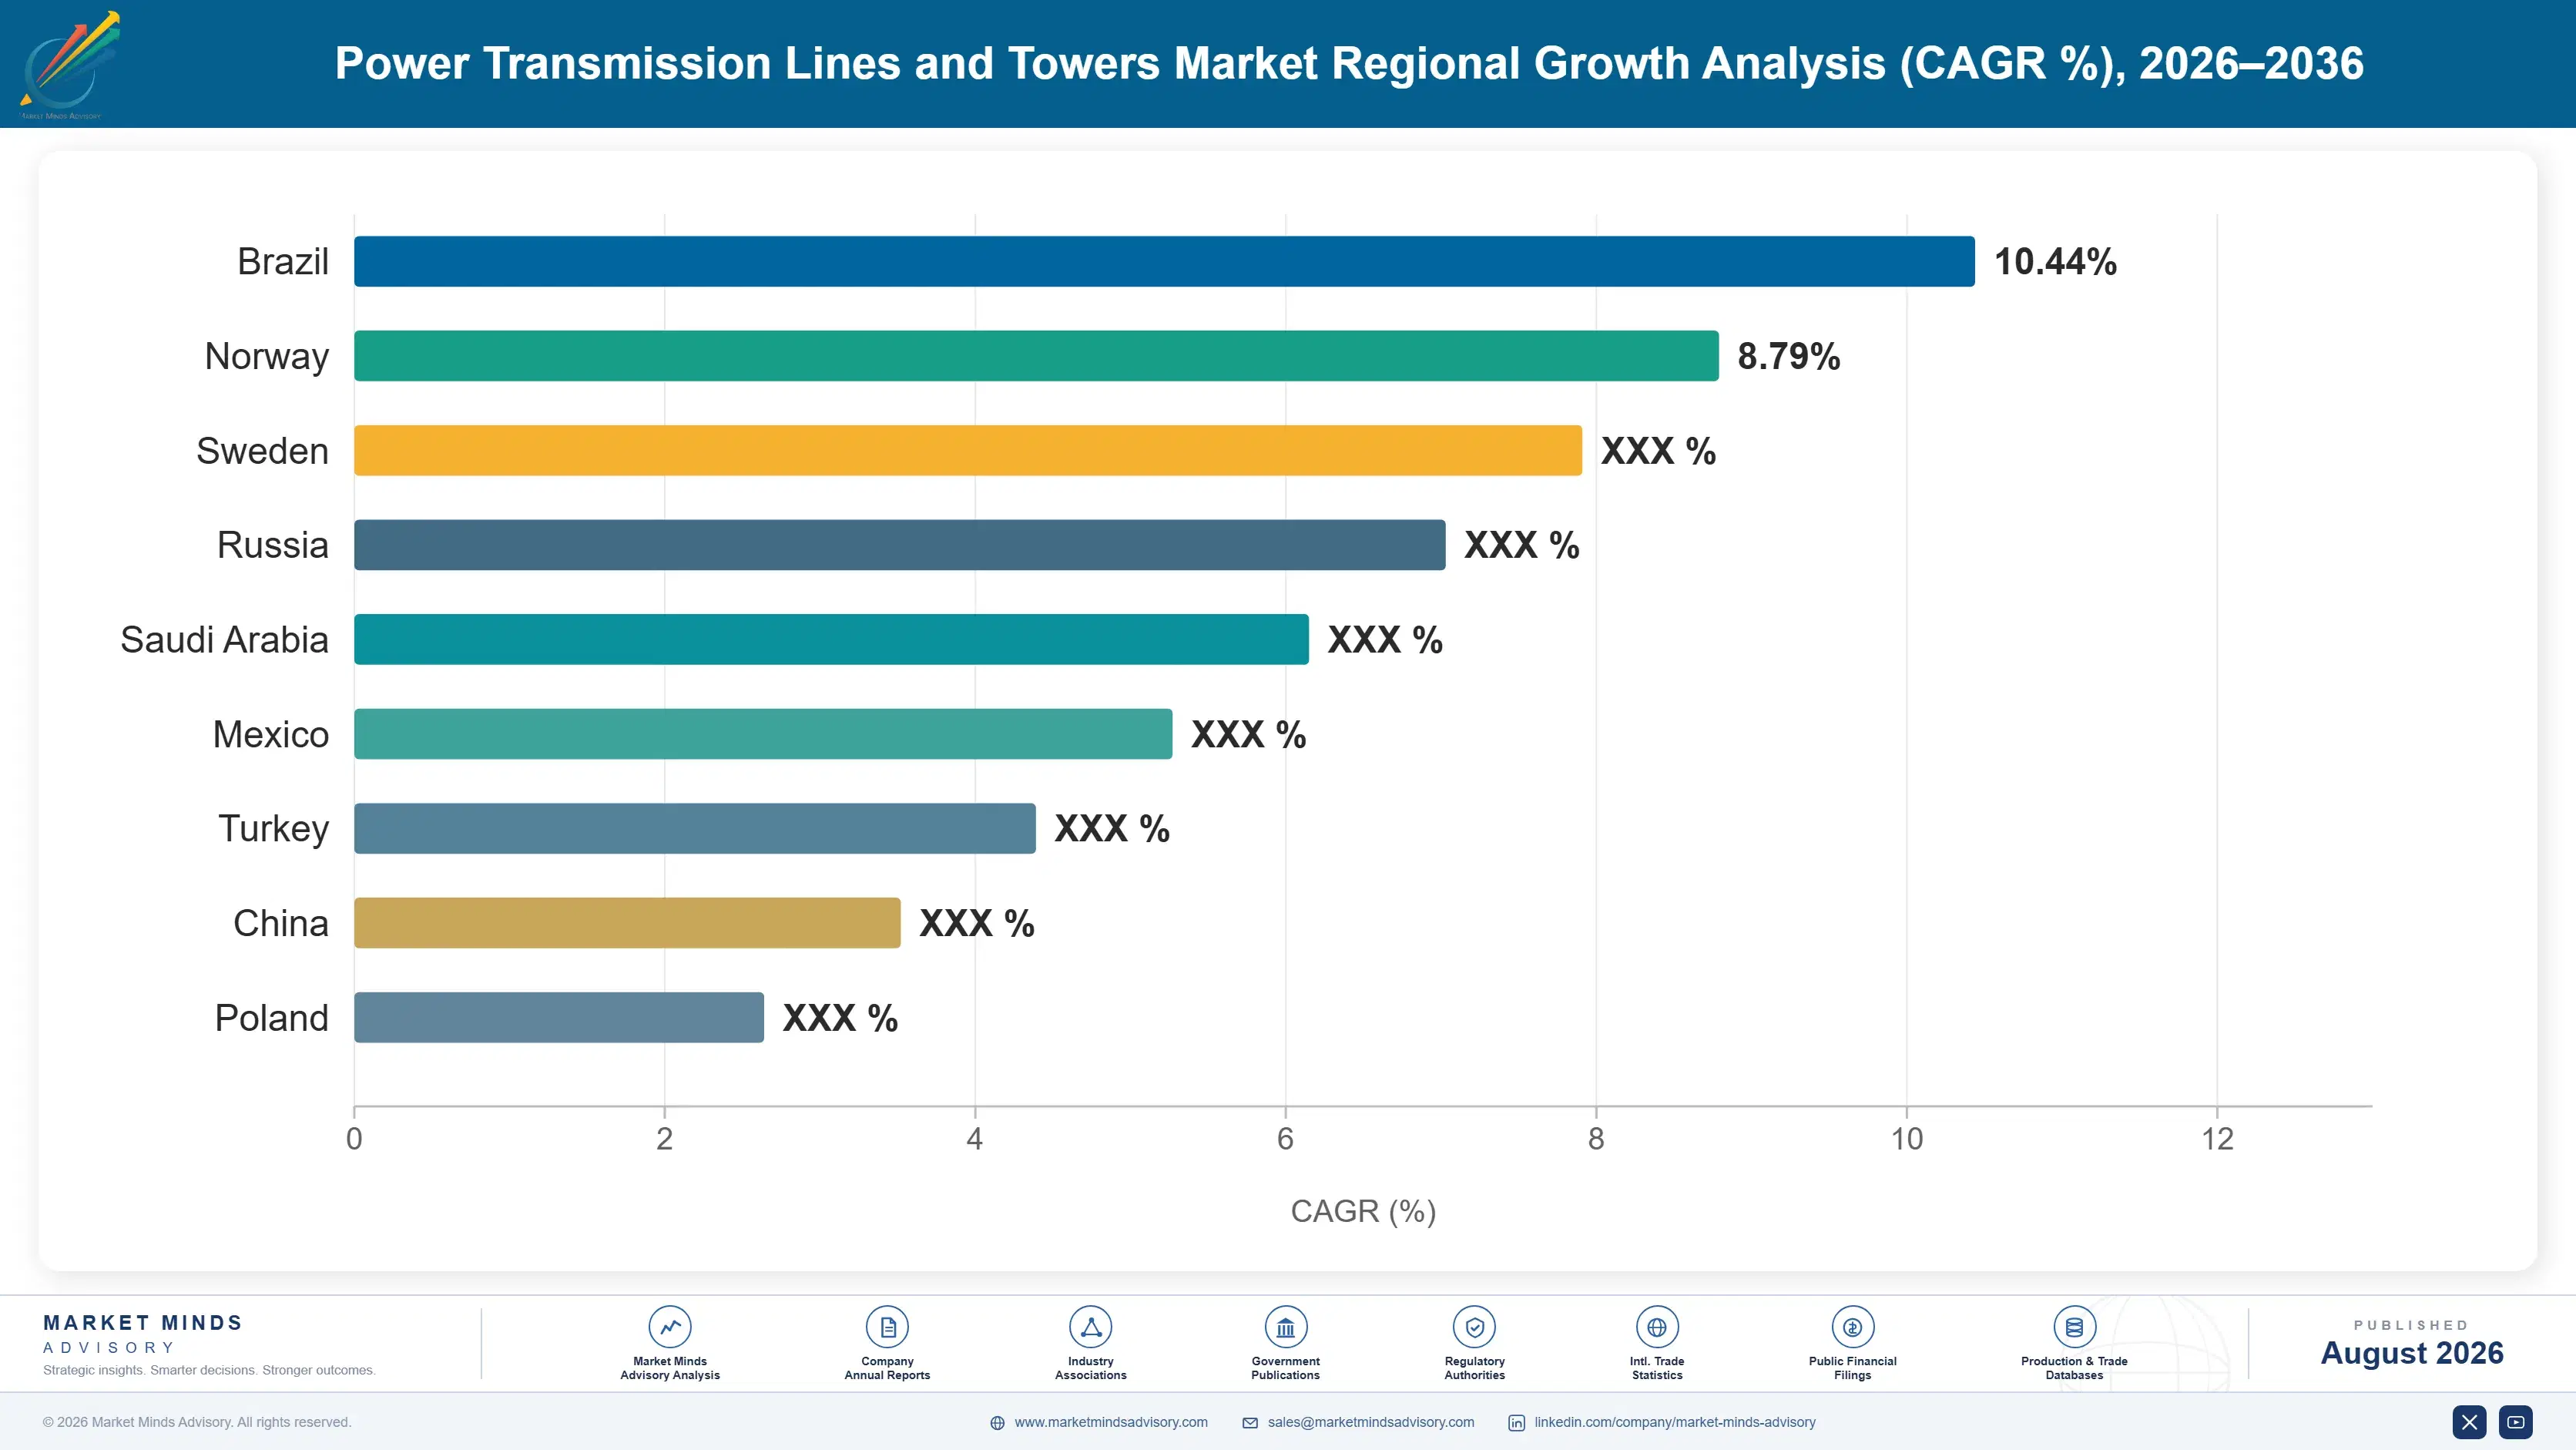
East Asia takes 30% on a Chinese ultra-high-voltage programme with no equivalent anywhere. South Asia sits above its usual band at 14% on the Indian transmission build. North America grows fastest of the Western regions on ageing conductor. Freight economics keep every one of these markets regional.

East Asia

Scale here is not comparable to anywhere else and the numbers stop being useful as a comparison. China's ultra-high-voltage programme moves power from western generation to eastern load across distances no other country has attempted, and it has built more transmission line in a decade than most national grids hold in total. That volume produced a tower fabrication and conductor drawing base with costs Western manufacturers cannot approach, and it now exports across Africa, South America and South Asia. Japanese and Korean demand is replacement rather than expansion, with high-temperature conductor used heavily because new corridors are effectively impossible in either country. The export position is the part that reshapes everybody else's market.
Share: 30% | CAGR: 7.8% (2026 to 2036)

North America

Two separate demand streams run here at once and utilities have finally started combining them. Conductor installed through the 1960s and 1970s is reaching replacement on its own schedule, which needs no capacity approval, while interconnection queues holding more generation than the network can accept make the case for capacity that regulators are now willing to fund. Combining a mandatory replacement with a high-temperature upgrade delivers both from a single outage. Growth at 8.0% leads the Western regions for that reason. Permitting remains the constraint on anything greenfield, with corridor timelines that federal reform has repeatedly promised to shorten and has not. Nothing about the greenfield timeline has actually changed yet.
Share: 22% | CAGR: 8.0% (2026 to 2036)
Regional intelligence for 5 additional markets available in the complete report: Western Europe, South Asia and Pacific, Latin America, Middle East and Africa, Eastern Europe. Contact sales@marketmindsadvisory.com.
power-transmission-lines-and-towers-market-country-cagr-analysis-1788193751405

Four Moves On Existing Corridors

None of these four requires a new right of way, which is the point, because a new right of way takes eleven years and a supplier cannot influence that timeline at all. Each works on lines that already exist, permissions that already exist, and outages that were going to happen anyway. That is a narrower field than it sounds.

Bundle the upgrade into the mandatory replacement

Conductor installed in the 1960s and 1970s has to be replaced whether or not anybody wants more capacity, and that work needs no capacity approval and no new consent. Specifying high-temperature conductor for the replacement adds roughly 94% capacity on a maintenance budget rather than through a capital case that a regulator has to approve. The outage was already scheduled and the crews were already mobilised. Utilities that understood this are adding capacity years ahead of those still preparing capital submissions, and the suppliers who framed the proposal that way won the work.
Market Impact: Adds 94% more capacity on a maintenance budget

Sell the fibre, not just the wire

Optical ground wire installs on every reconductoring project and carries far more fibre pairs than utility protection signalling requires. Spare capacity inside a transmission corridor is commercially valuable to telecommunications operators who cannot obtain a comparable route at any price, and several utilities have built genuine revenue lines from leasing it. A supplier presenting optical ground wire as a communications asset with a 20 year income stream rather than as a lightning shield reaches the finance function rather than the engineering one. That is a different and considerably easier conversation.
Market Impact: Adds a 20 year fibre leasing income stream

Write metal escalation into every long contract

Aluminium is 36% of conductor cost and galvanised steel dominates tower cost, and both reprice within weeks while a regulated tariff takes years. A supplier holding firm prices across a multi-year framework carries an exposure that no operational improvement offsets, as the last aluminium cycle demonstrated to several participants terminally. Escalation clauses, index-linked pricing and back-to-back mill agreements cost a negotiation rather than money. Utilities resist them and then sign them, because the alternative is a supplier that cannot deliver the contract at all. That is a negotiation, not a cost.
Market Impact: Covers the 36% of conductor cost most exposed

Qualify early where qualification takes years

High-temperature conductor supply is concentrated among a handful of producers because utility qualification involves multi-year testing of thermal cycling, creep and connector performance before a single kilometre is ordered. That barrier protects the incumbents and it grows the longer the segment runs at 10.8%. Starting qualification now costs testing time and very little money, and it is the only route into the fastest growing segment in this sector. Several capable conductor manufacturers have watched the segment triple while deciding whether the testing programme was worth funding. The barrier only hardens from here.
Market Impact: Enters a qualified segment growing at 10.8% annually

Who Controls the Margin Pool

CR5 stands at 22% measured on contracted circuit-kilometre volume delivered, which is the only comparable basis across manufacturers reporting in very different revenue categories. That is remarkably low for a capital goods sector and it reflects physics rather than fragmentation of will: towers are heavy, conductor is heavy, and freight economics keep both regional. Nobody has consolidated it and nobody credibly will.
Competition runs on qualification status, metal contracting and local erection capability. Qualification decides who can bid the high-temperature work at all, because utility testing programmes run years. Metal contracting decides who survives an aluminium cycle. Local crews and licences decide who can actually install, since erection cannot be imported. Product engineering differentiates far less than any supplier catalogue implies.

Rankings will move on where the Chinese and Indian fabrication bases choose to compete. Both now serve projects on four continents at costs Western manufacturers cannot match, and both are moving up from commodity towers toward qualified conductor. The pressure comes from a cost base rather than from a technology, which is considerably harder to answer. Western participants defending on quality are defending a narrowing gap.
power-transmission-lines-and-towers-market-company-positioning-matrix-1788193751931

Competitive Moat and Risk Dimensions

PRYSMIAN

Moat: Qualification breadth across utility specifications

Decades of conductor and cable qualification with utilities across dozens of national specifications give the group approved status where a new entrant faces multi-year testing before a first order. That approval position compounds, because each qualification makes the next specification easier to satisfy. It is a barrier built from time rather than capital, which is why it holds.
PRYSMIAN

Risk: European cost base under pressure

Conductor drawing is energy intensive and aluminium is a traded commodity, so a European manufacturing base competes against Chinese and Indian mills with permanently cheaper inputs on a product that is difficult to differentiate. Freight protects regional positions only partially at transmission volumes. Quality arguments hold for qualified conductor and hold much less well for commodity ACSR.
KEC INTERNATIONAL

Moat: Tower fabrication with erection capability

Combining tower manufacture with transmission line erection across South Asia, Africa and the Middle East gives the group control of the part of the project that cannot be imported, which is the installation itself. Local crews, licences and equipment take years to assemble in any new market. That integration wins work that a component supplier alone can never reach.
KEC INTERNATIONAL

Risk: Project execution risk concentrates margin

Turnkey transmission contracts carry schedule, weather, land access and commodity exposure simultaneously, and a single delayed corridor can absorb the margin from several completed projects. Component suppliers avoid all of it by selling material and leaving. Integration buys revenue and buys a risk profile that is considerably harder to price accurately.

Players Tracked

Prominent Players

Prysmian
Nexans
KEC International
Valmont Industries
Sumitomo Electric

Other Key Players

Southwire
CTC Global
LS Cable and System
Furukawa Electric
Fujikura
NKT
Kalpataru Projects International
Skipper Limited
Arcosa
Sabre Industries
Hubbell
TE Connectivity
Qingdao Wuxiao Group
Jiangsu Shemar Power Equipment
Hindalco Industries

Recent Developments

FEBRUARY 2025

United States advanced reconductoring guidance reached utilities

Federal guidance directed transmission planners to evaluate advanced conductor reconductoring as an alternative before proposing new corridors, on the basis that capacity delivered inside an existing right of way avoids the permitting timeline entirely. Utility procurement for high-temperature conductor rose measurably across the following two quarters.
Signal: A single planning instruction changed procurement faster than a decade of technical advocacy had ever managed.
JUNE 2025

Indian transmission programme awarded record circuit-kilometre volume

Indian transmission awards reached record circuit-kilometre volume for a single year, connecting western and southern renewable zones to national load centres. Domestic tower fabricators and conductor mills took the majority of the work, with several also holding export contracts across Africa and the Middle East simultaneously.
Signal: The Indian domestic build is now funding an export position that competes globally on cost alone.
OCTOBER 2025

Aluminium price movement triggered conductor contract renegotiations

Sharp aluminium price movement led several conductor suppliers to reopen multi-year framework agreements with European and North American utilities, since primary metal represents roughly 36% of conductor cost. Suppliers holding index-linked pricing were unaffected, and those on firm terms absorbed the losses across all delivered volume.
Signal: The contract structure, rather than the purchasing function, decided who actually made any money that year.

Aluminium, Zinc And Galvanised Steel

Primary aluminium accounts for roughly 36% of conductor cost, galvanised structural steel around 44% of tower cost, and zinc for galvanising a further 9% of it. All three are energy-intensive metals produced in a small number of regions and traded on exchanges that reprice continuously. Erection labour and heavy lift equipment make up most of what remains on an installed basis.
The 2021 and 2022 energy crisis showed how exposed this cost base is. European aluminium smelters curtailed production as power prices rose, and the International Energy Agency documented the industrial energy movement behind those closures. Conductor suppliers holding index-linked framework agreements passed the increase through without incident. Those on firm multi-year prices delivered contracted volume at losses, and two European participants left the segment entirely rather than continue.

The disadvantage falls on contract structure rather than on purchasing capability, which is the uncomfortable part. A regulated utility adjusts its tariff over years while metal reprices over weeks, so a supplier accepting firm pricing is absorbing a mismatch that no procurement skill can close. Suppliers integrated back into smelting or holding mill agreements price steadily. Everybody else quotes and hopes, which is not a strategy.
power-transmission-lines-and-towers-market-cost-volatility-analysis-1788193752126

Index conductor pricing to primary metal

Aluminium is 36% of conductor cost and reprices continuously while a regulated tariff takes years to adjust, which is a mismatch no purchasing function can close. Index-linked framework pricing costs a negotiation and removes the largest uncontrolled exposure in the business. Suppliers who held firm prices through the last cycle delivered contracted volume at a loss for two years.

Hold back-to-back agreements with metal mills

Matching a supply commitment to a utility with a corresponding agreement at the mill converts a price exposure into a margin, which is what integrated participants have always done. The agreements cost volume commitment rather than cash. Suppliers buying conductor rod and tower steel on spot against multi-year delivery obligations are running an unhedged commodity position without calling it one.

Price schedule risk rather than absorbing it

Permitting consumes 78% of a project timeline and a supplier holding firm prices across that period carries years of metal exposure for work that may not proceed. Price validity limits, milestone repricing and schedule-linked escalation move the risk to the party that actually controls the schedule. Utilities resist this and sign it, because a failed supplier delays them further.

Portfolio Architecture for Margin Defence

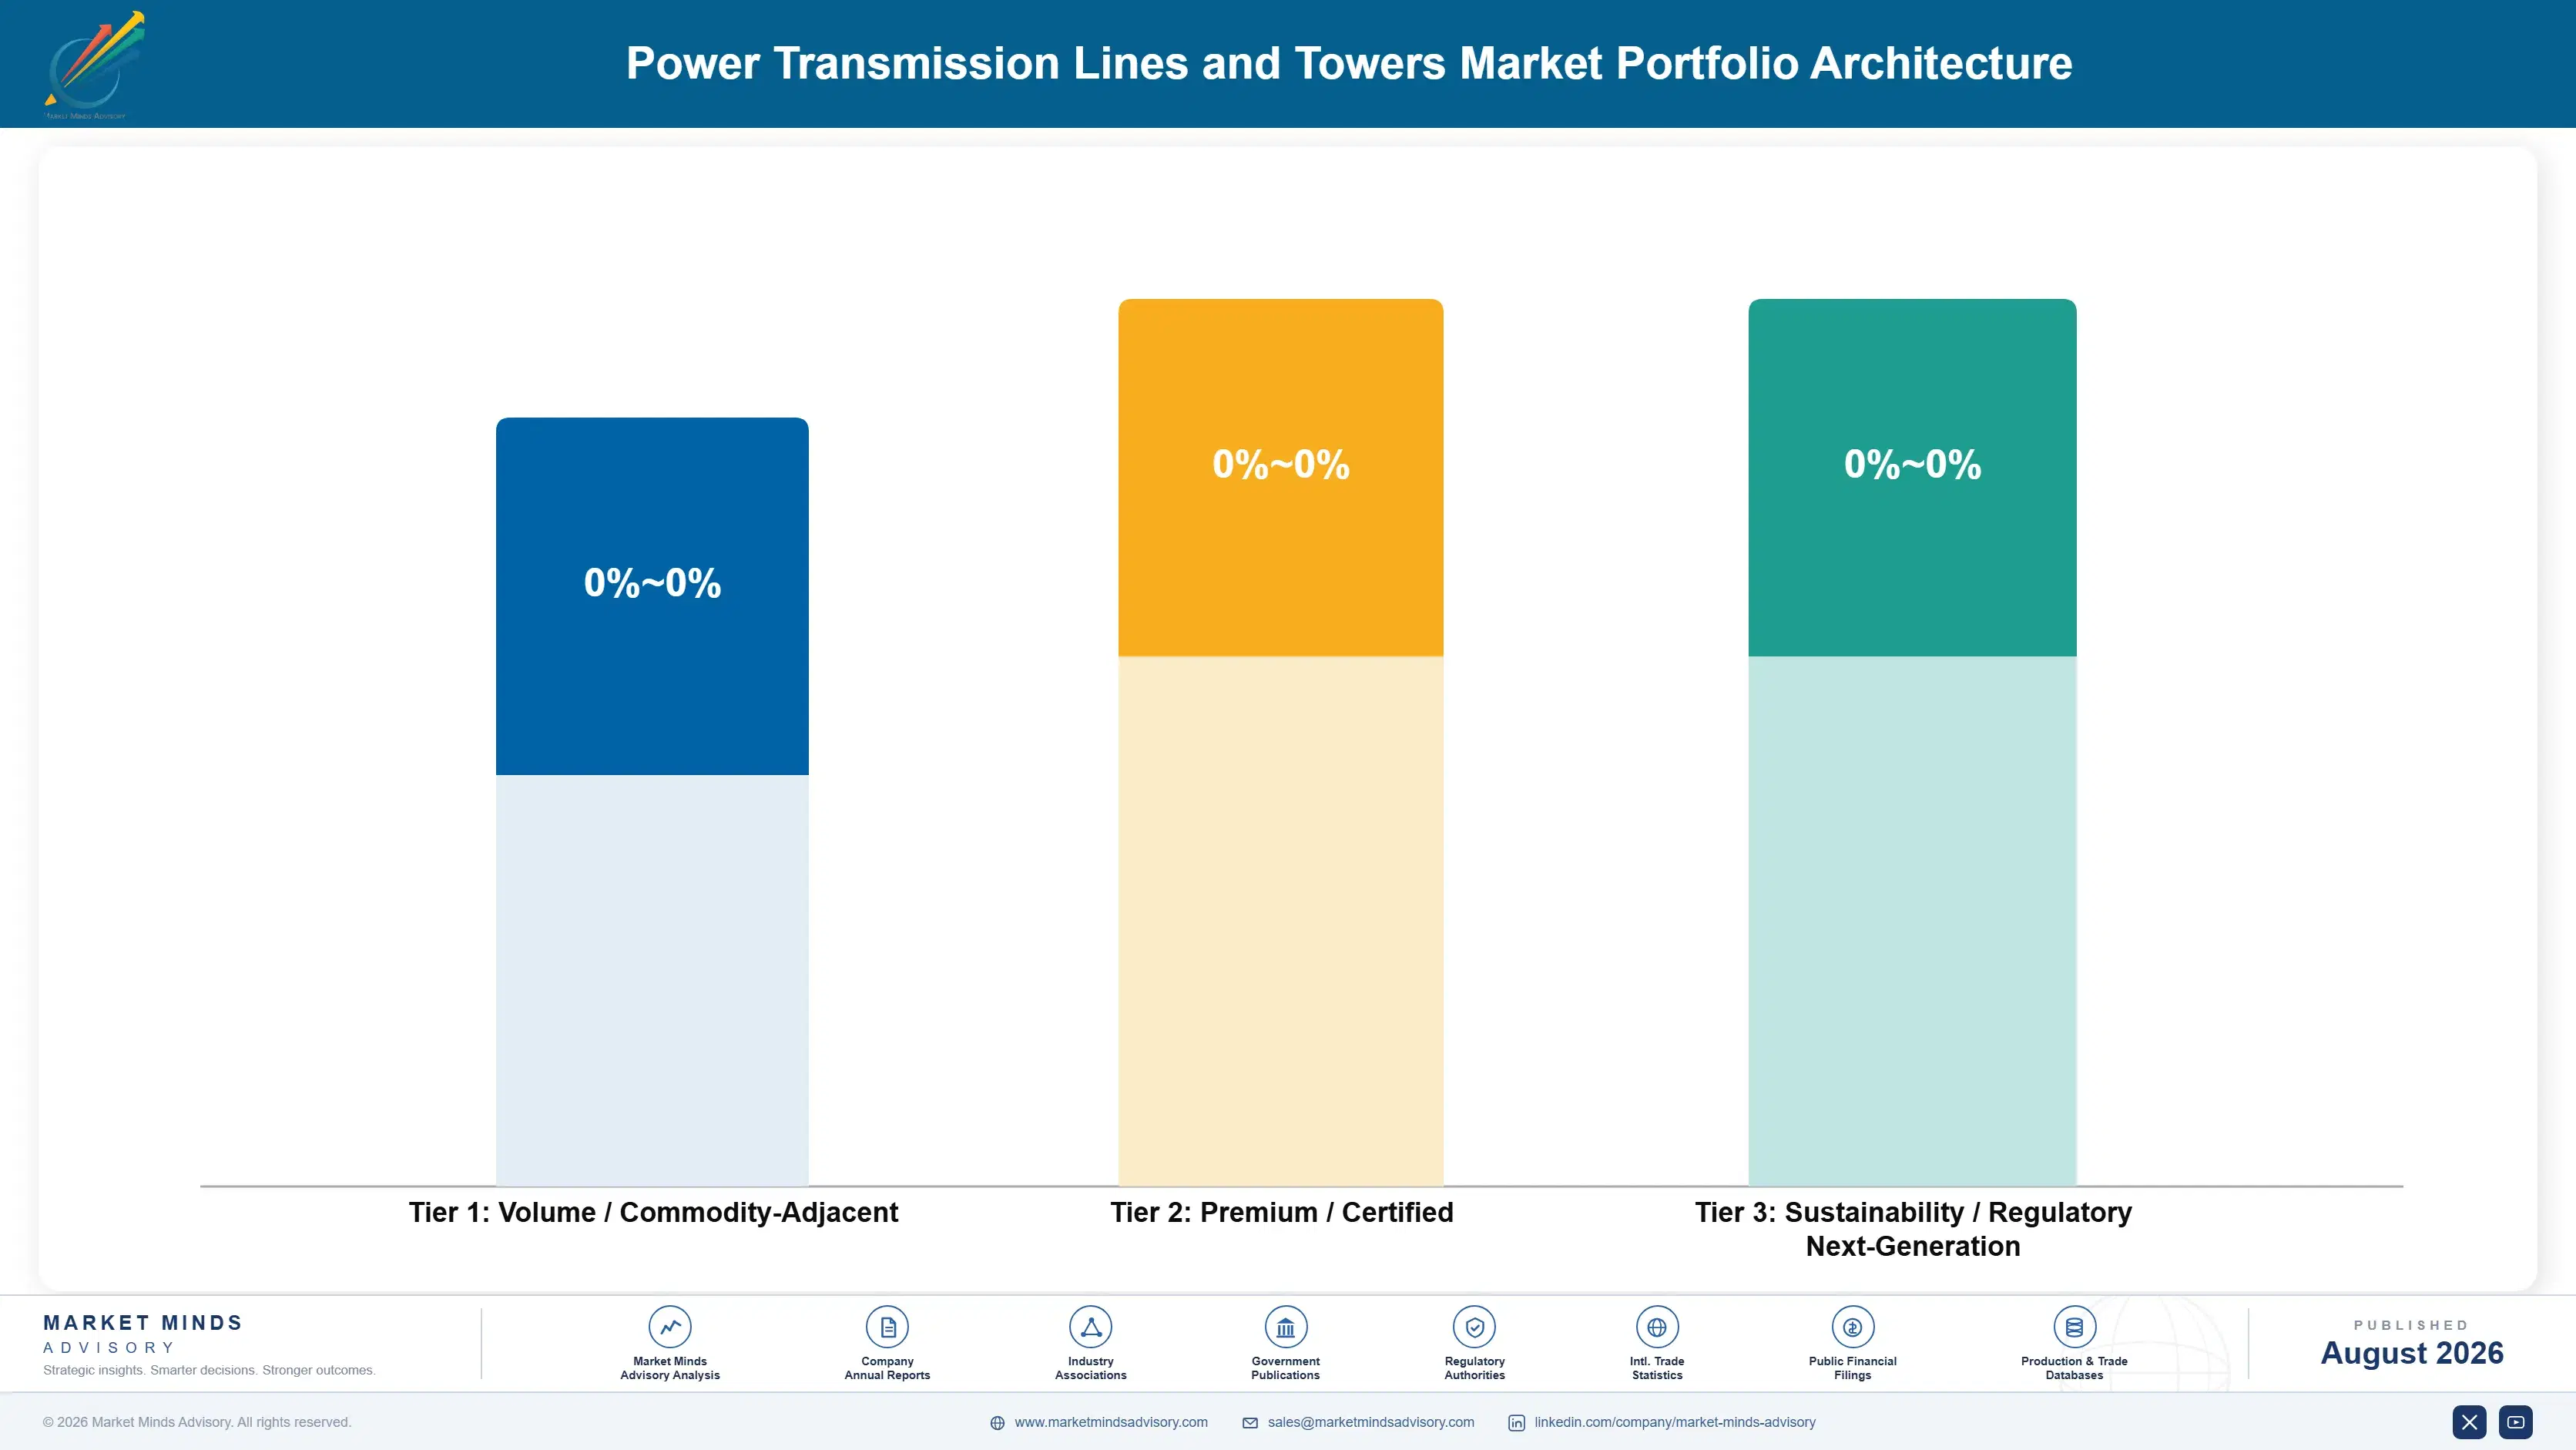
Margin here follows qualification status rather than product complexity, which is not what the catalogues suggest. Conventional ACSR is a commodity anybody with a drawing line can make and it prices accordingly. A qualified high-temperature conductor earns several times the margin on a manufacturing cost difference far smaller than the price gap, because utility testing programmes take years and the approved list is short.
Volume and premium pull against each other through the utility relationship rather than the factory. Commodity conductor and lattice towers carry the tonnage that keeps a supplier on framework agreements and inside annual planning conversations, and that position is what gets the high-temperature product specified when an upgrade is discussed. Abandoning the volume tier saves margin and removes the access that makes the premium tier reachable.

High-value pools sit in qualified high-temperature conductor, in optical ground wire with fibre leasing attached and in long-term framework agreements with escalation built in. The third earns nothing directly and protects everything else, because a framework with index-linked pricing converts a commodity exposure into a stable margin across a decade. Very few suppliers treat contract structure as a product.

Volume / Commodity-Adjacent

Conventional ACSR and AAAC conductor, lattice steel towers and standard line hardware sold on tonnage against competitive tender. Metal content dominates cost and differentiation is minimal. The 8 point spread reflects whether the supplier is integrated back into metal production.
Gross Margin: 9 to 17%

Premium / Certified

Qualified high-temperature conductor, composite insulators and engineered structures supplied against utility specifications requiring multi-year approval. Qualification status rather than price supports the margin. The 8 point spread reflects how many national specifications the product holds approval against.
Gross Margin: 22 to 30%

Sustainability / Regulatory / Next-Generation

Optical ground wire with fibre leasing, monitoring and dynamic line rating hardware, and long-term framework agreements carrying index-linked pricing. Margins are high because the income is contractual rather than transactional. The 16 point spread separates hardware supply from recurring communications and monitoring revenue.
Gross Margin: 28 to 44%
power-transmission-lines-and-towers-market-portfolio-architecture-1788193752633

High-value Sub-segments and Strategic Watch-out

High-Temperature Low-Sag Conductors

High value and high growth at 10.8%. It adds capacity inside an existing corridor with no consent required, and qualification barriers keep the approved supplier list very short. The 8 point spread reflects core technology and how many separate utility specifications the product actually satisfies.
Gross Margin: 26 to 34%

Optical Ground Wire and Communications

High value with strong growth at 8.6%. It installs on every project and carries fibre worth leasing to telecommunications operators who cannot obtain the route otherwise. The 8 point spread reflects whether the supplier participates in any of that leasing income at all. Most do not.
Gross Margin: 24 to 32%

Lattice Steel Transmission Towers

The volume core. It earns modestly and it holds the framework agreements and planning relationships that make the premium products specifiable later. The 8 point spread reflects proximity to a galvanising line and to the project, since freight decides these economics. Nobody ships towers very far.
Gross Margin: 10 to 18%

Conventional ACSR and AAAC Conductors

The strategic watch-out. Chinese and Indian mills price this commodity below Western production cost and reconductoring programmes increasingly specify high-temperature material instead. The 20 point spread separates integrated producers from those buying aluminium rod on the open market. Western producers are losing this tier permanently and know it.
Gross Margin: 6 to 26%

Frameworks, Outages And Decades

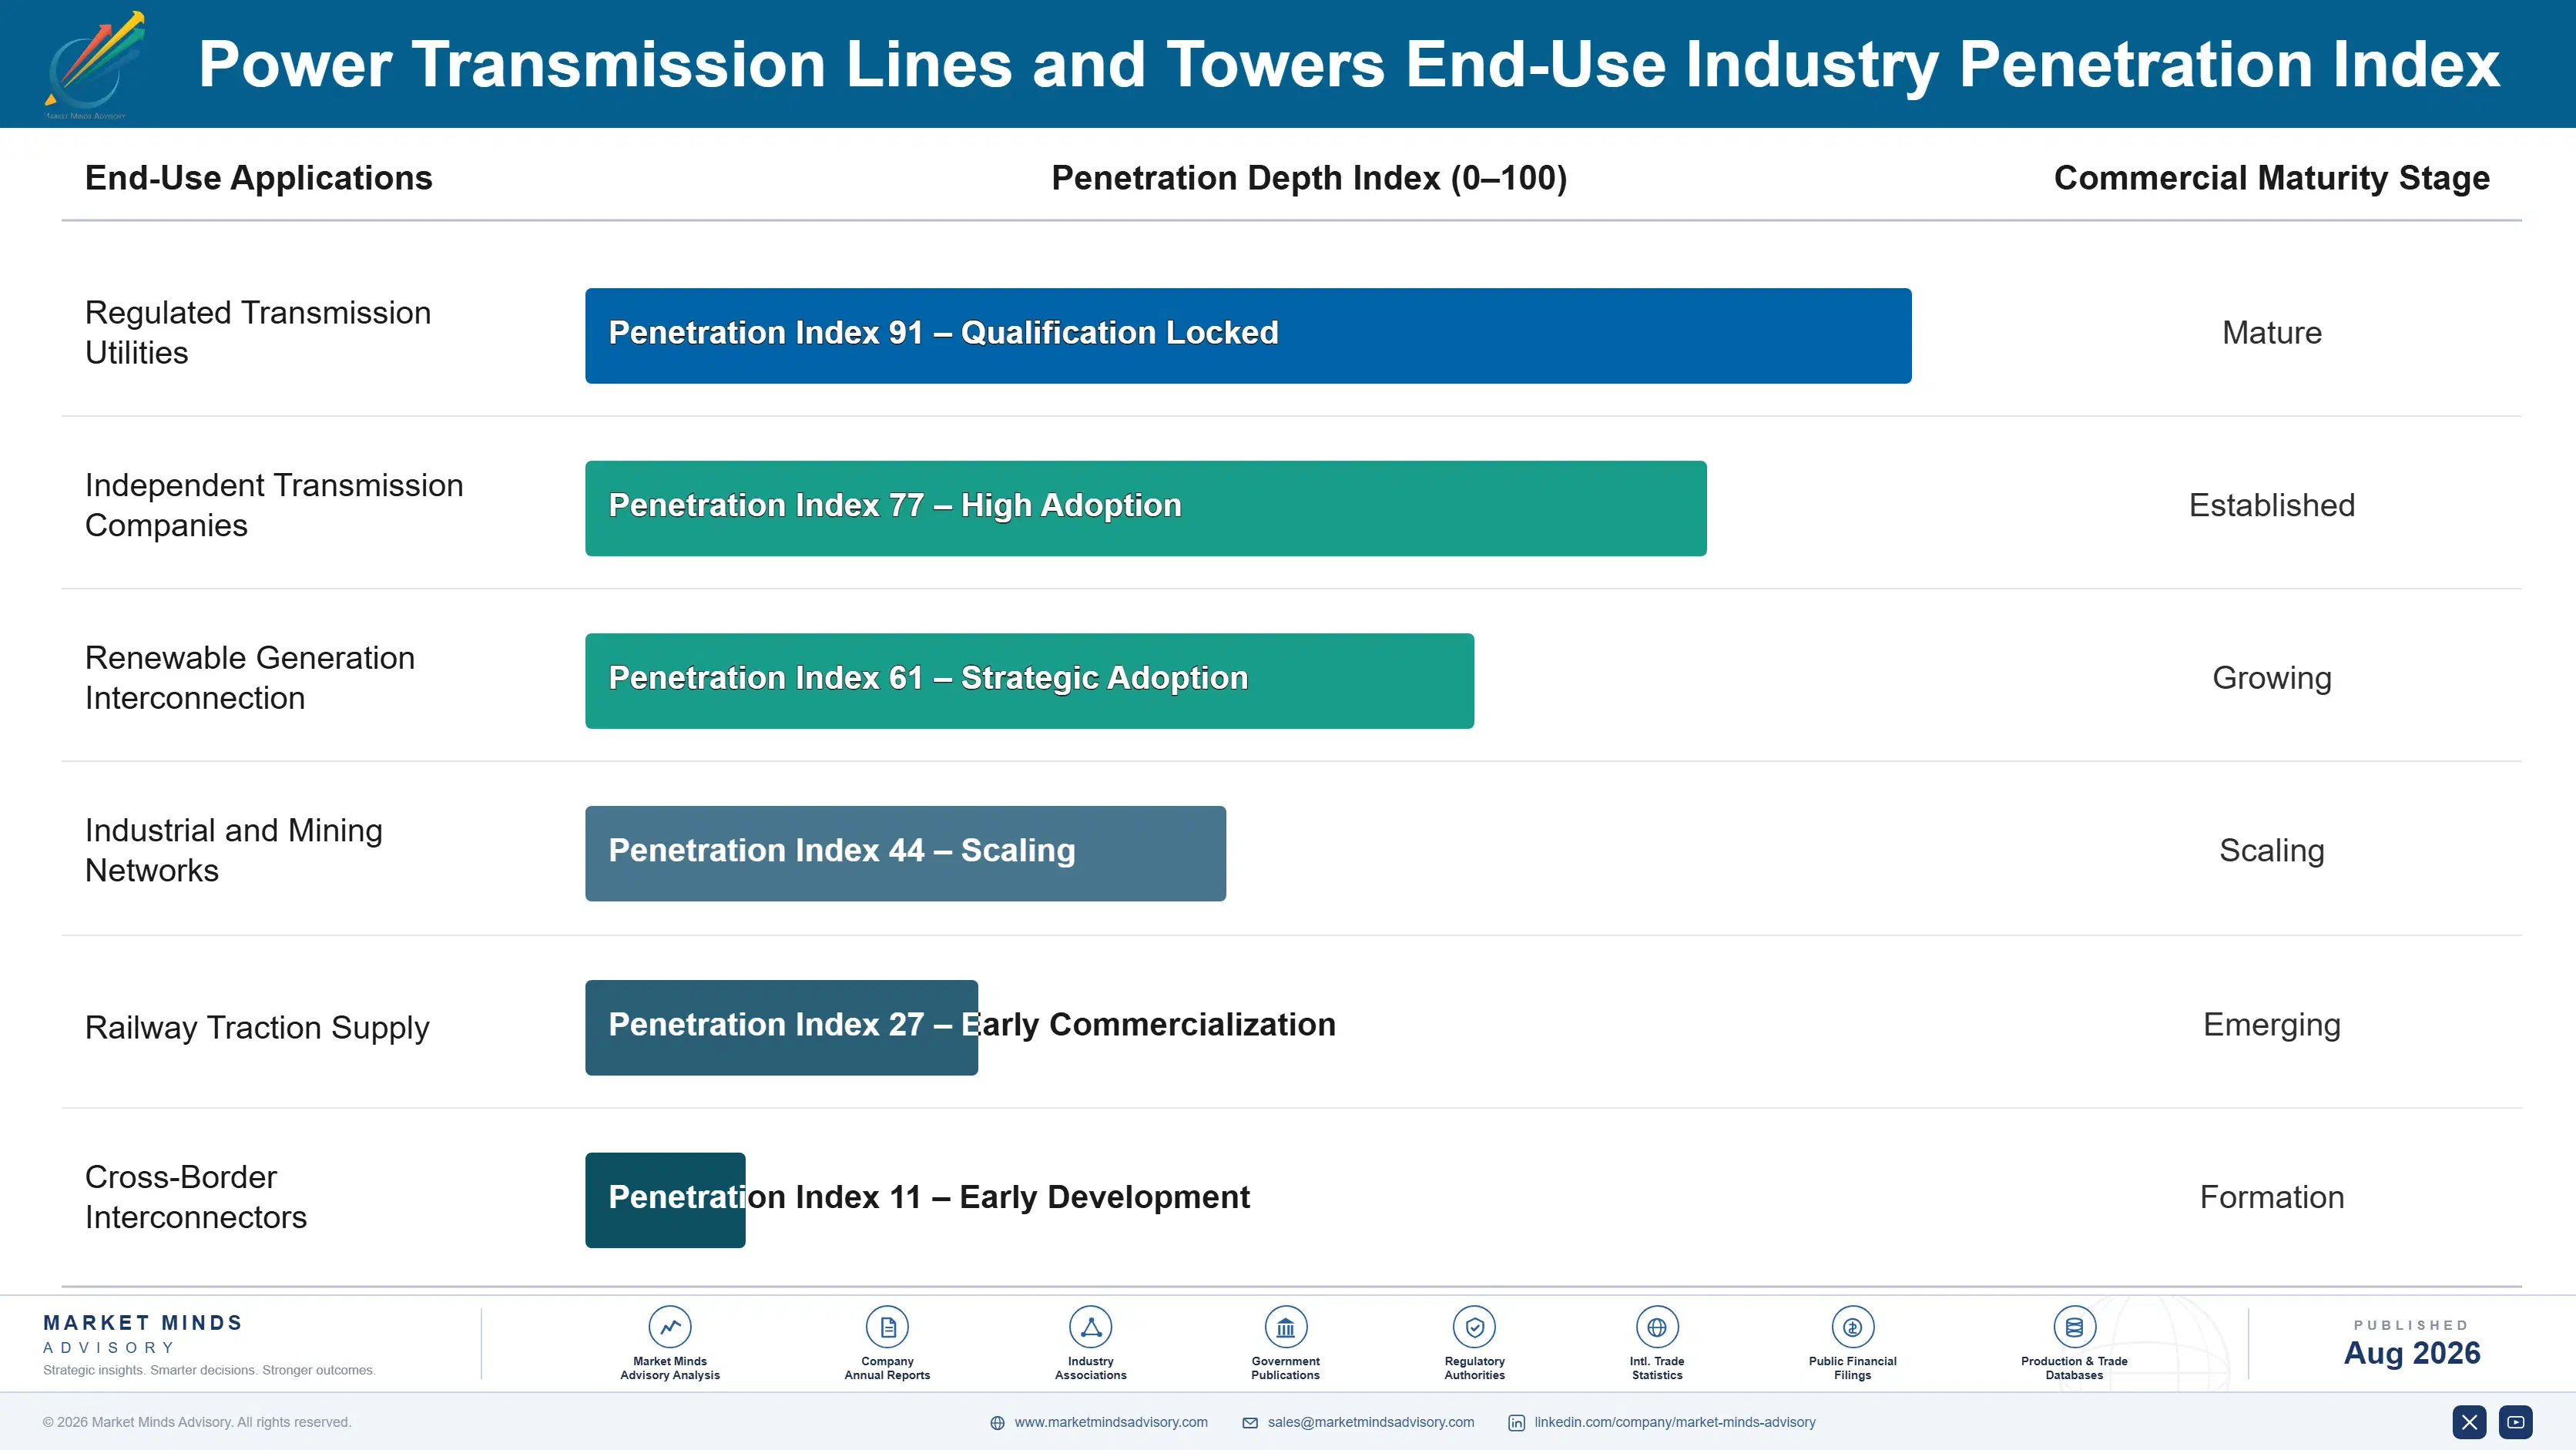
The annuity here runs through framework agreements rather than through individual projects, which is why the order book matters more than the pipeline. A utility signs multi-year supply frameworks and draws against them as projects reach construction, so a supplier holding the framework earns from every project that proceeds without bidding for any of them. Losing a framework removes a decade of revenue at a single procurement decision.
Stickiness varies enormously by product rather than by customer. A qualified high-temperature conductor is written into a utility specification and stays there for years, because requalifying an alternative costs testing time nobody wants to spend. Lattice towers are retendered on every project because a tower is a tower. Optical ground wire sits between the two, since the fibre has to match what the utility already operates.

Buyer profiles have shifted from transmission engineers toward planning and regulatory functions, and the suppliers who noticed are winning. An engineer asks about ampacity and sag. A planner asks whether this avoids a permitting cycle and whether the regulator will approve it as maintenance rather than capital. The second conversation decides the order and most sales organisations are not equipped to hold it.
power-transmission-lines-and-towers-market-end-use-penetration-index-1788193753127

What The Corridor Decides

These are among the four positions where our research anticipates prominent divergence between winners and laggards over the coming forecast period. Each is grounded in the demand model, the regulatory perimeter, and the announced capacity pipeline.
01 / REPLACEMENT CYCLE CAPTURE

Upgrade the conductor while replacing it anyway

Conductor installed across North America and Western Europe in the 1960s and 1970s has to be replaced regardless of any capacity argument, and that work requires no new consent and no capacity approval from a regulator. Specifying high-temperature material for the replacement adds roughly 94% capacity on a maintenance budget, using an outage that was already scheduled and crews that were already mobilised. Utilities that understood this are adding capacity years ahead of those still preparing capital submissions to their regulators.
02 / FIBRE REVENUE ATTACHMENT

Present the ground wire as a communications asset

Optical ground wire installs on every reconductoring project and carries far more fibre than utility protection signalling needs, and spare capacity inside a transmission corridor is valuable to telecommunications operators who cannot obtain a comparable route at any price. Several utilities have built genuine multi-decade income lines from leasing it, and that income never appears in the transmission business case. A supplier framing the product for the finance function rather than the engineering one is holding a considerably easier conversation.
03 / METAL CONTRACT DISCIPLINE

Index the price or leave the business

Aluminium is 36% of conductor cost and galvanised steel dominates tower cost, and both reprice within weeks while the regulated tariff funding the project takes years to adjust to anything. A supplier holding firm prices across a multi-year framework carries a mismatch that no purchasing skill or operational improvement can offset, as the last energy cycle demonstrated when two European participants exited the segment. Escalation clauses cost nothing but a negotiation, and they decide who is still trading in this sector afterwards.
04 / CONDUCTOR QUALIFICATION TIMING

Start the testing before the segment closes

High-temperature conductor supply stays concentrated among a handful of producers because utility qualification involves years of thermal cycling, creep and connector testing before a first kilometre can be ordered from anybody. That barrier protects incumbents and hardens further as the segment compounds at 10.8% against a market rate of 7.2%. Capable manufacturers have watched the segment triple while still deciding whether to fund a testing programme that costs testing time rather than any real money at all, which is the cheapest entry barrier in this sector.

Engagement Snapshot From the Field

A live engagement with an industry participant carrying material or product regulatory and market exposure ahead of a defining policy shift, showing how our research translates into a defensible multi-year portfolio strategy.
MARKET MINDS ADVISORY · CLIENT ENGAGEMENT SUMMARY
Power Transmission Lines and Towers Producer Strategic Portfolio Review and Transition Roadmap 2026·Investment Scenario on Power Transmission Lines and Towers Exposure Evaluation 2025-26
CLIENT PROFILE
A North American investor-owned transmission utility operating several thousand circuit-kilometres across two states, facing an interconnection queue holding more generation than its network could accept and a capital plan its regulator had already trimmed twice (client-reported, unverified by MMA). Two proposed greenfield corridors were in their sixth and eighth years of permitting respectively. Neither had a completion date.
STRATEGIC CHALLENGE
The queue was growing faster than the network and both greenfield corridors faced judicial review with uncertain outcomes and no reliable completion date. Management needed capacity this decade rather than next, and needed a route that did not depend on a consent process the utility could neither control nor accelerate through any amount of additional spending.
MMA APPROACH
MMA assessed every transmission circuit in the client's network for conductor age, thermal headroom, structure condition and clearance envelope, producing a ranked reconductoring list rather than a corridor strategy. Forty-seven expert interviews with conductor manufacturers, line contractors, regulatory staff and neighbouring utilities established what could be delivered, what could be approved as maintenance and what capacity each upgrade would actually release.
KEY FINDINGS
  1. Conductor on 31% of the network was past 55 years of service and already scheduled for replacement inside the existing maintenance plan.
  2. High-temperature reconductoring on those circuits would release more capacity than both stalled greenfield corridors combined, at under 3 years of elapsed time.
  3. Structures on 4 of the 9 priority circuits needed no reinforcement at all, since the high-temperature conductor weighed no more than what it replaced.
  4. The regulator had approved comparable upgrades as maintenance rather than capital for two neighbouring utilities, which the client's own planners had not known.
CLIENT PROFILE
A North American investor-owned transmission utility operating several thousand circuit-kilometres across two states, facing an interconnection queue holding more generation than its network could accept and a capital plan its regulator had already trimmed twice (client-reported, unverified by MMA). Two proposed greenfield corridors were in their sixth and eighth years of permitting respectively. Neither had a completion date.
STRATEGIC CHALLENGE
The queue was growing faster than the network and both greenfield corridors faced judicial review with uncertain outcomes and no reliable completion date. Management needed capacity this decade rather than next, and needed a route that did not depend on a consent process the utility could neither control nor accelerate through any amount of additional spending.
MMA APPROACH
MMA assessed every transmission circuit in the client's network for conductor age, thermal headroom, structure condition and clearance envelope, producing a ranked reconductoring list rather than a corridor strategy. Forty-seven expert interviews with conductor manufacturers, line contractors, regulatory staff and neighbouring utilities established what could be delivered, what could be approved as maintenance and what capacity each upgrade would actually release.
KEY FINDINGS
  1. Conductor on 31% of the network was past 55 years of service and already scheduled for replacement inside the existing maintenance plan.
  2. High-temperature reconductoring on those circuits would release more capacity than both stalled greenfield corridors combined, at under 3 years of elapsed time.
  3. Structures on 4 of the 9 priority circuits needed no reinforcement at all, since the high-temperature conductor weighed no more than what it replaced.
  4. The regulator had approved comparable upgrades as maintenance rather than capital for two neighbouring utilities, which the client's own planners had not known.
RECOMMENDED STRATEGY
Phase 1: Phase one: reconductor the 4 circuits requiring no structure work, funded from the existing maintenance plan rather than any capital submission. Phase 2: Phase two: begin conductor qualification with two additional suppliers, since the approved list was short enough to create genuine delivery risk. Phase 3: Phase three: keep both greenfield corridors alive but stop treating either as the capacity answer for this decade at all.
OUTCOME
Within six quarters three circuits had been reconductored and released more capacity than the utility had added in the previous decade, at a fraction of a corridor's cost (client-reported, unverified by MMA). The interconnection queue shortened measurably for the first time. Both greenfield corridors remain in permitting and neither has a completion date.

Frequently Asked Questions

Foundational context covering the market sizes, CAGR, scope, country, region and competition that inform every finding below. This section is provided to cover basics and most often pre-purchase conversations, answered from the MMA Primary Research Dataset.

What is the current size of the Power Transmission Lines and Towers Market?

The global power transmission lines and towers market was valued at USD 68.0 billion in 2025, covering overhead conductors, structures and line hardware above 66 kilovolts. The 2026 figure reaches USD 72.90 billion.

How large will the Power Transmission Lines and Towers Market be by 2036?

MMA forecasts USD 146.11 billion by 2036, an increase of USD 73.21 billion over the 2026 base. That represents an expansion multiple of 2.00 times across the forecast period.

What is the CAGR for the Power Transmission Lines and Towers Market 2026 to 2036?

The base case compound annual growth rate is 7.2%, with a bull case at 8.4% and a bear case at 6.0%. Historical growth between 2020 and 2025 ran at 6.0%.

Which segment is growing fastest?

High-temperature low-sag conductors grow at 10.8%, half again the market rate of 7.2%, because they add capacity inside an existing corridor. Optical ground wire follows at 8.6%.

Who are the major companies in the Power Transmission Lines and Towers Market?

Prysmian, Nexans, KEC International, Valmont Industries and Sumitomo Electric lead on contracted circuit-kilometre volume, with combined CR5 of 22%. Concentration is low because freight keeps manufacturing regional.

Which country is growing fastest?

India grows fastest at 9.5%, on a national transmission programme connecting western and southern renewable generation to load. South Asia and Pacific leads regionally at 9.5%.

Report Segmentation Architecture

The full report scope spans multiple orthogonal segmentation dimensions, with cross-tabulated demand data provided for each dimension pair. Coverage extends further to regional breakdowns, trend trajectories, and the competitive detail needed to support segment-level decision-making.

By Physical Component

  • Lattice Steel Transmission Towers
  • Tubular Steel and Concrete Poles
  • Conventional ACSR and AAAC Conductors
  • High-Temperature Low-Sag Conductors
  • Insulators and Line Hardware
  • Optical Ground Wire and Line Communications

By End-Use Industry

  • Regulated Transmission Utilities
  • Independent Transmission Companies
  • Renewable Generation Interconnection
  • Industrial and Mining Networks
  • Railway Traction Supply
  • Cross-Border Interconnectors

By Commercial Dimension

  • Multi-Year Framework Agreements
  • Project Specific Tenders
  • Turnkey EPC Contracts
  • Reconductoring Programmes
  • Maintenance and Replacement Contracts
  • Fibre Capacity Leasing Arrangements

By Region

  • North America
  • Western Europe
  • East Asia
  • South Asia and Pacific
  • Latin America
  • Middle East and Africa
  • Eastern Europe

Scope, Methodology, and Coverage

Every figure in this report is reproducible from documented input assumptions. The scope below maps the historical period, the forecast horizon, the segmentation dimensions, and the countries covered, alongside the underlying primary and qualitative methodology.
Historical Period
2020 to 2025
Forecast Period
2026 to 2036
Base Year
2025 (USD billions; MMA Primary Research Dataset, August 2026)
Market Definition
The power transmission lines and towers market covers the physical components and structures that carry electricity at transmission voltage above 66 kilovolts overhead, spanning lattice steel transmission towers, tubular steel and concrete poles, conventional ACSR and AAAC conductors, high-temperature low-sag conductors, insulators and line hardware, and optical ground wire with associated line communications. Scope is measured as delivered component value across new-build and reconductoring projects. Excluded are substations and transformers, underground and submarine cables, distribution voltage networks below 66 kilovolts, switchgear, and grid control software.
Quantitative Units
USD billion, 2025 base year, 2026 to 2036 forecast period
Segmentation Dimensions
Physical component, end-use network type, commercial model, region
Regions Covered
North America, Western Europe, East Asia, South Asia and Pacific, Latin America, Middle East and Africa, Eastern Europe
Countries Covered
United States, Canada, Germany, United Kingdom, France, Spain, Italy, Poland, China, Japan, South Korea, India, Australia, Brazil, Chile, Saudi Arabia, United Arab Emirates, South Africa
Key Companies Profiled
20 companies across conductor manufacturers, structure fabricators and line contractors
Quantitative Methodology
Primary survey, n=3,800 respondents, Q4 2025, six countries; demand-side model with trade association cross-validation
Qualitative Methodology
47 expert interviews, Q4 2025; applied to validate demand model assumptions, identify emerging dynamics, and assess competitive positioning
Report Format
PDF and XLSX data workbook (Word format preview document)
Publisher
Market Minds Advisory
Report Code
MMA-2026-ENE-331
Published
August 2026
Contact
sales@marketmindsadvisory.com | www.marketmindsadvisory.com

Purchase the full Power Transmission Lines and Towers Market Report (2026 to 2036).

The full MMA report on the power transmission lines and towers market runs to detailed component and regional models across the 2026 to 2036 forecast period, with cost benchmarks separated by metal content and manufacturing origin. It profiles 20 companies on a consistent contracted circuit-kilometre basis, covering conductor manufacturers, structure fabricators and line erection contractors. Reconductoring opportunity is sized against installed conductor age by network and by region. Regional chapters cover the seven MMA regions with country-level detail on the eighteen markets surveyed. Primary research draws on a quantitative survey of 3,800 respondents across six countries and 47 expert interviews conducted in Q4 2025.
Cost benchmarks by metal content and manufacturing origin
Reconductoring opportunity sized against installed conductor age
Permitting timelines mapped across eighteen surveyed national markets
Twenty company profiles on consistent circuit-kilometre volume basis
High-temperature conductor qualification status by utility specification
Seven regional chapters with eighteen country detail tables

Built For The People Who Decide

From boardroom strategy to bench-side execution, this report is read cover-to-cover by leaders shaping the next decade of their industry, turning demand scenarios, market dynamics and valuation benchmarks into decisions.
CXOs/ Presidents/ VPs/ Managers
M&A and Corporate Development
Strategy Teams and R&D Heads
Procurement and Product Directors
Regulatory and Compliance Leaders
Investor Relations and Equity Analysts