Market Minds Advisory
Power System Simulator Market

Power System Simulator Market: Power System Simulator Market. Grid Complexity Drives Simulation Tool Adoption

Renewable integration and grid instability events are pushing utilities toward real-time digital simulators, forcing legacy offline modeling vendors to requalify entire product lines against faster, more volatile grid dynamics worldwide.

Lead Analyst

Published

October 2026

Make Smarter Decisions with Customized Research Insights

Request a free sample report and evaluate market opportunities, growth trends, and competitive dynamics relevant to your business needs.

2025 MARKET VALUE$0.8BMarket Size 2025
2036 FORECAST VALUE$2.1BBase Case , 2026 to 2036
CAGR 2026 TO 20368.8 %Bull 10.1% / Bear 7.5%
INCREMENTAL OPPORTUNITY$1.2BNet 10- year value creation
EXPANSION MULTIPLE2.32x2036 value over 2026 base
Strategic Levers
M&A Pipeline
Regional Outlook
Country Rankings
Competitive Intelligence
Segmental Deep-dive
Call-Us : 91 93563 13602

Executive Snapshot and Market Trajectory.

Power system simulator demand is shifting from offline, steady-state modeling toward real-time digital simulation as renewable integration and grid instability events reward utilities who can test control logic before deployment rather than after an outage. That shift is already well underway across major utility procurement cycles worldwide.
Renewable integration and microgrid simulators now drive the fastest-growing demand pool, outpacing legacy offline software by a wide margin as grid operators add inverter-based resources at scale across most major markets. East Asia leads on grid buildout and renewable deployment pace, while North America drives premium real-time hardware-in-the-loop demand tied to utility R&D investment programs. Sensor-integrated monitoring now features in a growing share of new installations.
Five vendors hold roughly 44 percent combined share on a revenue basis, a moderately high concentration reflecting the specialized engineering required for real-time simulation accuracy. Grid code compliance testing requirements and renewable interconnection studies are reshaping which vendors get specified into new utility procurement. Smaller challengers respond with narrower product lines focused on specific study types. That specialization pattern is becoming more common across the industry as grid study complexity keeps rising steadily.
Market Definition
This report covers software and hardware simulation tools used to model, test, and validate power system behavior for utilities, grid operators, and equipment manufacturers worldwide. It excludes general-purpose engineering simulation software and SCADA systems that serve distinct operational functions.
Base Year Value
$0.8B in 2025 (MMA Primary Research Dataset, October 2026)
Forecast Period
2026 to 2036, eleven discrete annual values
CAGR
8.8% base case. Bull 10.1%. Bear 7.5%.
Fastest Growth Segment
Renewable Integration and Microgrid Simulators: 12.3% CAGR
Fastest Growth Country
China: 10.8% CAGR
Fastest Growth Region
South Asia and Pacific: 10.9% CAGR
Largest Region
North America: 28% of 2025 global value
Market Leaders
RTDS Technologies, OPAL-RT Technologies, Siemens PTI, DIgSILENT GmbH, Hitachi Energy. Source: MMA Analysis based on company annual reports.
Primary Survey
n=3,800 procurement and R&D decision-makers, Q4 2025, six countries
Methodology
Demand-side build-up, cross-validated against public data, 47 expert interviews

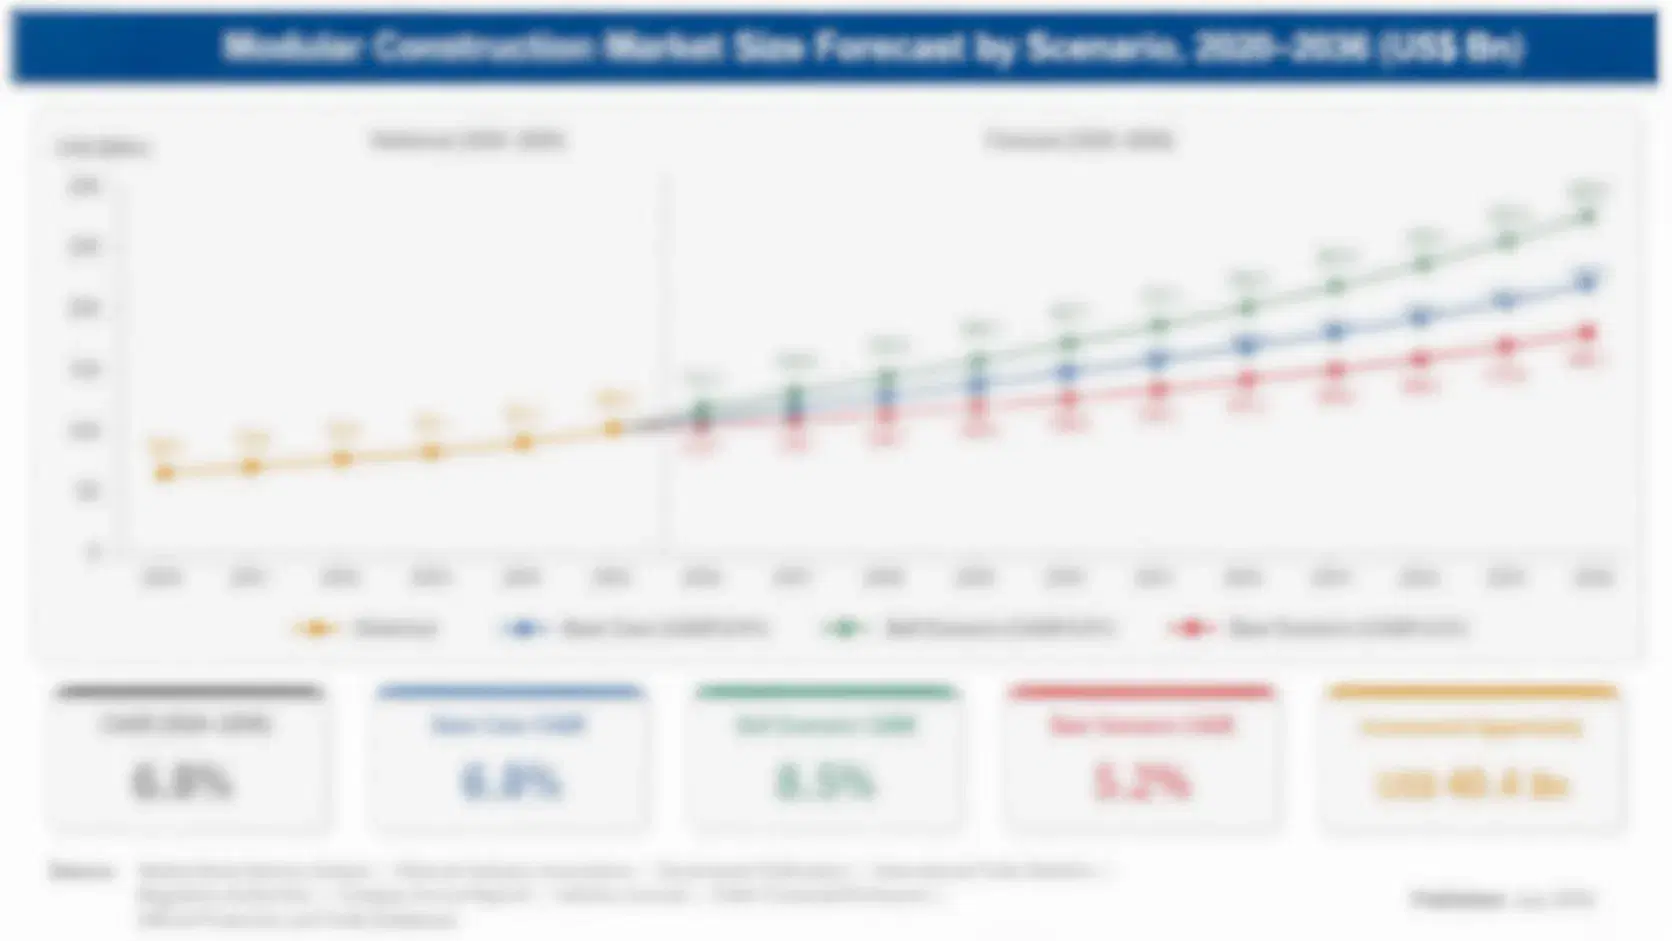
Power System Simulator Market Forecast Scenarios

power-system-simulator-market-size-forecast-scenario-1790928323301
Power system simulator demand grew steadily between 2020 and 2025 as renewable integration studies and grid modernization programs expanded the category, advancing at an estimated 7.8 percent historical rate across most major grid operators without a single dominant catalyst driving the trajectory. Offline modeling software replacement added a quieter layer of demand beneath the real-time simulator base.
The base case assumes 8.8 percent annual growth through 2036, anchored on three mechanisms: renewable interconnection studies requiring real-time validation as inverter-based resources multiply, grid modernization programs replacing legacy offline modeling tools with hardware-in-the-loop systems, and utility R&D investment expanding simulation capacity to test control logic before deployment. Each mechanism compounds the others rather than competing for the same capital budget across utility procurement cycles. Capital allocation across all three channels has tracked utility budget cycles closely across major markets.
The bull case, near 10.1 percent, assumes faster renewable buildout pulls real-time simulation demand forward across more grid operators simultaneously. The bear case, near 7.5 percent, assumes legacy offline software retains share in cost-sensitive utility segments faster than expected, compressing real-time system growth in that channel. Either scenario leaves legacy offline modeling demand as the stable floor beneath more volatile real-time growth.

Renewable Volatility Redraws Simulation Tool Standards

Three forces are converging on the power system simulator market at once. Renewable interconnection studies are forcing requalification work legacy offline modeling vendors never budgeted for, grid modernization programs are spreading real-time hardware-in-the-loop demand across utility R&D departments simultaneously, and specialized engineering costs are rising at the same time demand volume is expanding. Vendors that solved all three simultaneously are pulling ahead of those still treating each as a separate problem.
MARKET CONCENTRATIONCR5 44%top five vendors hold combined global revenue share
AVERAGE SELLING PRICE$180,000per system, varies by channel count and fidelity
LEADING PRODUCER SHARECanada 22%of global real-time simulator manufacturing output produced annually
CAPACITY UTILIZATION68%across qualified simulator hardware production lines worldwide currently
R&D COST SHARE31%of vendor cost of goods sold currently industry-wide
REPLACEMENT CYCLE6-8 yearstypical simulator hardware service life before full replacement
Commercially, the market behaves like a specialty engineering software and hardware business rather than a pure commodity category. Buyers increasingly qualify vendors on simulation fidelity and real-time accuracy first, price second, which protects incumbent margins against low-cost entrants lacking accredited grid code validation. That dynamic held through the last several utility procurement cycles without meaningful price erosion.
Over the next decade, real-time hardware-in-the-loop capability and renewable interconnection validation will separate vendors who hold share from those who lose it to generic engineering simulation platforms in cost-sensitive research segments. Utility R&D departments are rewriting approved vendor lists around exactly these two criteria. That rewrite is accelerating faster than most vendors expected going into 2026 across several major utility markets.
"Everyone assumed offline modeling would hold the utility market for another decade. Renewable volatility just compressed that timeline sharply."
Director, Grid Technology Practice · MMA Technology Practice · October 2026

Market Trends

Real-Time Simulation Displaces Offline Modeling for Renewable Studies

Grid operators are specifying real-time digital simulators over offline steady-state modeling tools for renewable interconnection studies, a transition driven by inverter-based resources whose dynamic behavior offline tools cannot adequately capture. Several major grid operators have standardized real-time simulation across interconnection studies over the past two years, and more than 50 percent of new renewable interconnection applications in 2025 required real-time validation rather than offline modeling alone. This shift is pushing offline-only vendors to either requalify product lines or cede share in the fastest-growing study segment entirely. Smaller suppliers increasingly outsource real-time validation to accredited labs rather than build capability internally.
Market Impact: Adds demand per 200 R&D programs
Grid Code Compliance Testing Requirements Tighten Across Major Markets

Grid operators across Europe and several US regions have tightened interconnection compliance testing requirements over the past three years, mandating real-time hardware-in-the-loop validation before new generation assets can connect to the grid. Several European grid codes, revised in 2024, now require compliance testing roughly 30 percent more extensive than the prior standard. Equipment manufacturers are investing in simulator capacity ahead of enforcement deadlines rather than risk interconnection delays for new projects. Equipment makers serving these markets report order backlogs stretching several months as compliance demand outpaces available qualified capacity. Interest keeps growing.
Market Impact: Grows 2x in microgrid-heavy markets

Market Opportunities and Growth Drivers

Utility R&D Investment Sustains Real-Time Simulation Demand

Utility research budgets dedicated to grid modernization continue to expand globally as operators pursue renewable integration capability, and each new R&D program requires simulation infrastructure to validate control logic before field deployment. Several major utilities disclosed R&D budget growth in recent annual reports, directly correlating with simulator procurement across new research facilities. This procurement channel is growing steadily because every new R&D program creates incremental simulation demand regardless of overall grid capacity expansion trends. Capital spent on these programs is shaping which vendors lead simulation specification over the next decade of grid modernization.
Market Impact: Limits upgrade volume for 6-8 years

Microgrid Deployment Requires Advanced Simulation Capability

Facilities and communities deploying microgrids increasingly require advanced simulation tools capable of modeling islanded operation, distributed generation, and storage dispatch simultaneously. Several equipment makers disclosed rising demand for microgrid-specific simulation modules in recent annual reports, citing distributed energy adoption as the primary driver behind this shift. Advanced simulator sales are growing roughly twice as fast as standard grid simulator sales in markets where microgrid adoption runs highest. Utilities disclosing these mandates frame distributed energy integration as a durable shift in grid design rather than a temporary trend. That shift favors incumbents already certified.
Market Impact: Extends hiring timelines by 6 months

Market Restraints and Challenges

Long Replacement Cycles Limit Near-Term Upgrade Volume

Power system simulator hardware typically lasts 6 to 8 years before replacement, meaning research facilities with newer systems have little immediate incentive to upgrade even as renewable integration complexity accelerates around them. Several utility R&D departments report delaying upgrades until existing equipment approaches end of service life rather than replacing ahead of schedule. The root cause is that simulator hardware is genuinely durable, not a planned obsolescence issue. Vendors are responding by offering software-only upgrade paths that add new modeling capability without full hardware replacement. Retrofit uptake remains modest but is growing steadily.
Market Impact: Reaches 50 percent of interconnection studies

Specialized Engineering Talent Shortage Constrains Vendor Growth

Real-time simulation development requires specialized power systems and real-time computing engineering talent that remains scarce relative to demand, constraining vendor capacity to expand product development and customer support simultaneously. Several vendors report extended hiring timelines for qualified engineers in recent public statements. The root cause is that university programs produce far fewer power systems specialists than software engineers generally, a gap unlikely to close quickly. Vendors are responding by partnering directly with universities to build dedicated talent pipelines. That university partnership approach is expected to ease the talent gap gradually over the next several years.
Market Impact: Expands testing scope by 30 percent
3 additional market trends, 4 additional growth drivers, and 3 additional restraints and challenges are covered in the full report. Contact sales@marketmindsadvisory.com to access the complete intelligence.

Segment CAGR and Growth Architecture

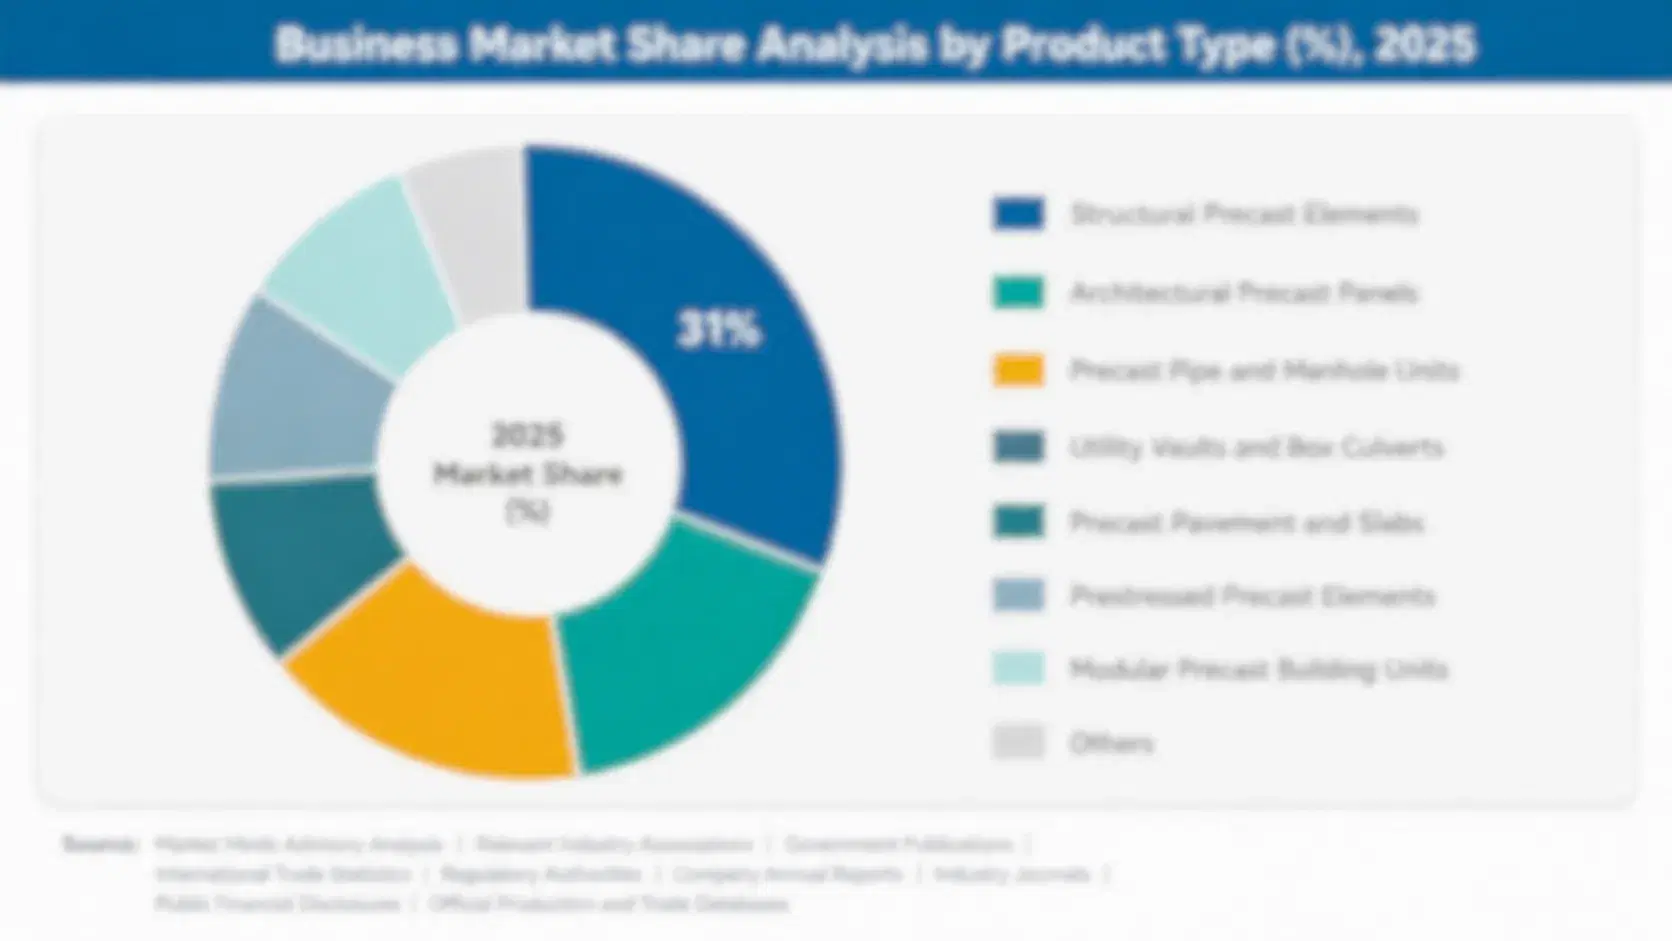
Segmentation follows simulation technology, the dimension that determines fidelity, target application, and real-time computing requirements. Technology, not vendor origin or software licensing model alone, decides who gets specified into a given utility's research program. The six segments defined this way stay mutually exclusive. Underlying hardware form factor and software licensing overlap across several segments without blurring the primary technology boundary.
power-system-simulator-market-market-share-analysis-1790928323474

Renewable Integration and Microgrid Simulators

This segment covers simulators modeling inverter-based resources, distributed generation, and islanded microgrid operation, where dynamic grid behavior demands real-time fidelity offline tools cannot provide. Growth here outpaces every other simulation technology by a wide margin as renewable deployment accelerates across major grid operators simultaneously. Vendors with proven real-time renewable modeling capability are capturing disproportionate share of new interconnection study wins, while offline-only vendors struggle to compete on fidelity. Pricing power in this segment already exceeds the broader market average meaningfully, and that premium looks durable through the decade as renewable buildout keeps expanding. Capital committed to real-time engineering now shapes which vendors hold position at commissioning across new interconnection studies.
CAGR 12.3%

Hardware-in-the-Loop Simulation Systems

This segment covers hardware-in-the-loop systems testing physical control equipment against simulated grid conditions, targeting equipment manufacturers and utilities validating protection and control logic before field deployment. Grid code compliance demand is compressing replacement cycles and pulling forward demand that would otherwise have landed later in the forecast window as interconnection standards tighten. North American and European grid operators lead this compliance wave, disclosed clearly in vendor order data from recent reporting periods. Growth here trails renewable and microgrid applications but still comfortably outpaces offline modeling demand, making it the second priority for vendors allocating research capital this decade. Vendors winning early compliance contracts retain that relationship through subsequent standard cycles, valuable well beyond the initial award.
CAGR 10.6%
Full segment breakdown across 6 segments available in the complete report.

Regional Architecture and Country Demand Map

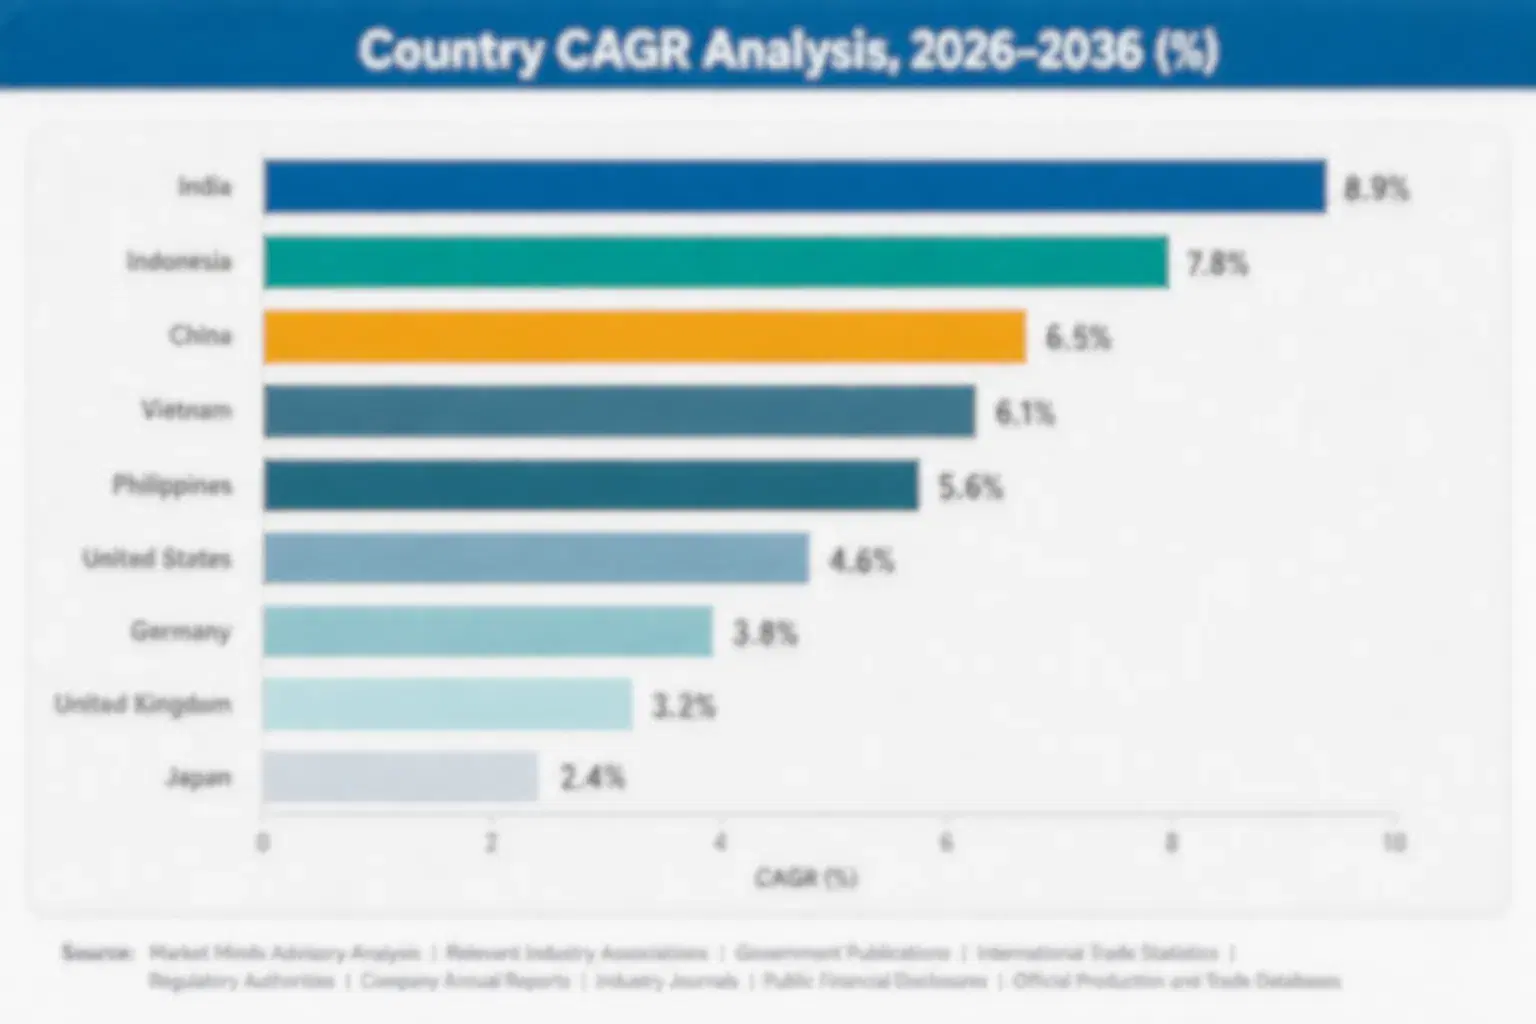
North America leads narrowly on utility R&D spending and national lab investment, with East Asia close behind on grid buildout and renewable deployment pace. South Asia and Pacific grows fastest off a smaller base, trailed by a balanced spread across the remaining regions. Eastern Europe sits smallest.

North America

US national laboratory investment anchors regional demand, with several major labs disclosing multi-year simulation infrastructure budgets to validate grid modernization and renewable interconnection standards before nationwide rollout. Utility R&D programs across multiple states are expanding real-time simulation capacity ahead of renewable buildout targets. Canada's real-time simulator manufacturing base, concentrated around Manitoba, adds a further supply-side layer unique to this region. Vendors with proven hardware-in-the-loop product lines are winning disproportionate specification share here as utility R&D budgets climb past prior industry forecasts. Mexico's grid modernization program is also beginning to add incremental demand as renewable buildout expands near the border region overall. This trend is expected to continue accelerating through the decade ahead.
Share: 28% | CAGR: 10.2% (2026 to 2036)

Western Europe

European demand centers on ENTSO-E grid code compliance testing that tightened meaningfully after 2024, driving simulator procurement across Germany, France, and the Netherlands. Regulatory bodies here were early to mandate real-time interconnection validation, giving European vendors an early compliance advantage now translating into export wins elsewhere. Legacy offline modeling installations across the region still generate steady replacement demand. Growth trails East Asia and North America modestly because the installed research base is already mature and replacement, not new procurement, drives most of this region's unit volume. The UK's grid operator contributes a further steady layer of replacement demand tied to interconnection standard commitments. Spain's grid operator is following a similar modernization path at a smaller scale.
Share: 19% | CAGR: 7.3% (2026 to 2036)
Regional intelligence for 5 additional markets available in the complete report: East Asia, South Asia and Pacific, Latin America, Middle East and Africa, Eastern Europe. Contact sales@marketmindsadvisory.com.
power-system-simulator-market-country-cagr-analysis-1790928323652

Monetizing Validation Scarcity Beyond Hardware Sales

Simulator vendors are finding that validation services and compliance expertise are worth more than the hardware itself alone. Four levers now capture value beyond straightforward unit sales across the utility research supply chain. Each depends on engineering credibility rather than production scale, which favors incumbents over new low-cost entrants industry-wide. That dynamic is reshaping where margin concentrates industry-wide.

Interconnection Validation Services for Equipment Manufacturers

Vendors with accredited real-time simulation labs are offering interconnection validation services to equipment manufacturers who cannot justify building their own simulation capacity. This generates service revenue independent of hardware sales and builds relationships that often convert into future equipment supply agreements. Several vendors report validation services now contribute roughly 12 percent of segment revenue, a figure growing as interconnection standards tighten across most jurisdictions. This approach also shortens the sales cycle for the vendor's own hardware lines by spreading fixed lab costs across a larger validation volume. This pattern is becoming the default route into equipment validation.
Market Impact: Adds roughly 12 percent validation revenue growth now

Multi-Year Research Partnerships With Utility R&D Departments

Early engagement with utility R&D departments during program design phase, before formal procurement begins, lets vendors lock in multi-year research partnerships ahead of competitors who wait for formal tender processes. This early-engagement advantage is proving durable because switching simulation vendors mid-program triggers costly requalification work utilities want to avoid. Vendors using this approach report winning roughly 24 percent more research program slots than those competing only at formal tender stage. Utilities value the reduced requalification risk enough that price competition from late-stage challengers rarely dislodges an early-engaged incumbent vendor. Interest keeps growing.
Market Impact: Wins roughly 24 percent more research program slots

Grid Code Compliance Advisory Services for Developers

Rather than selling only simulation hardware, vendors are offering grid code compliance advisory services that assess developer interconnection designs against tightening validation requirements and recommend testing schedules. This advisory approach captures consulting margin that pure hardware sales leave on the table entirely, while building the kind of trust that wins the eventual validation contract. Developers report these advisory services cut interconnection approval timelines by roughly 18 percent compared to managing validation without external guidance. Advisory relationships also give vendors visibility into future program timing, letting them plan capacity further ahead than hardware sales alone would allow.
Market Impact: Cuts approval timelines by 18 percent overall now

Who Controls the Margin Pool

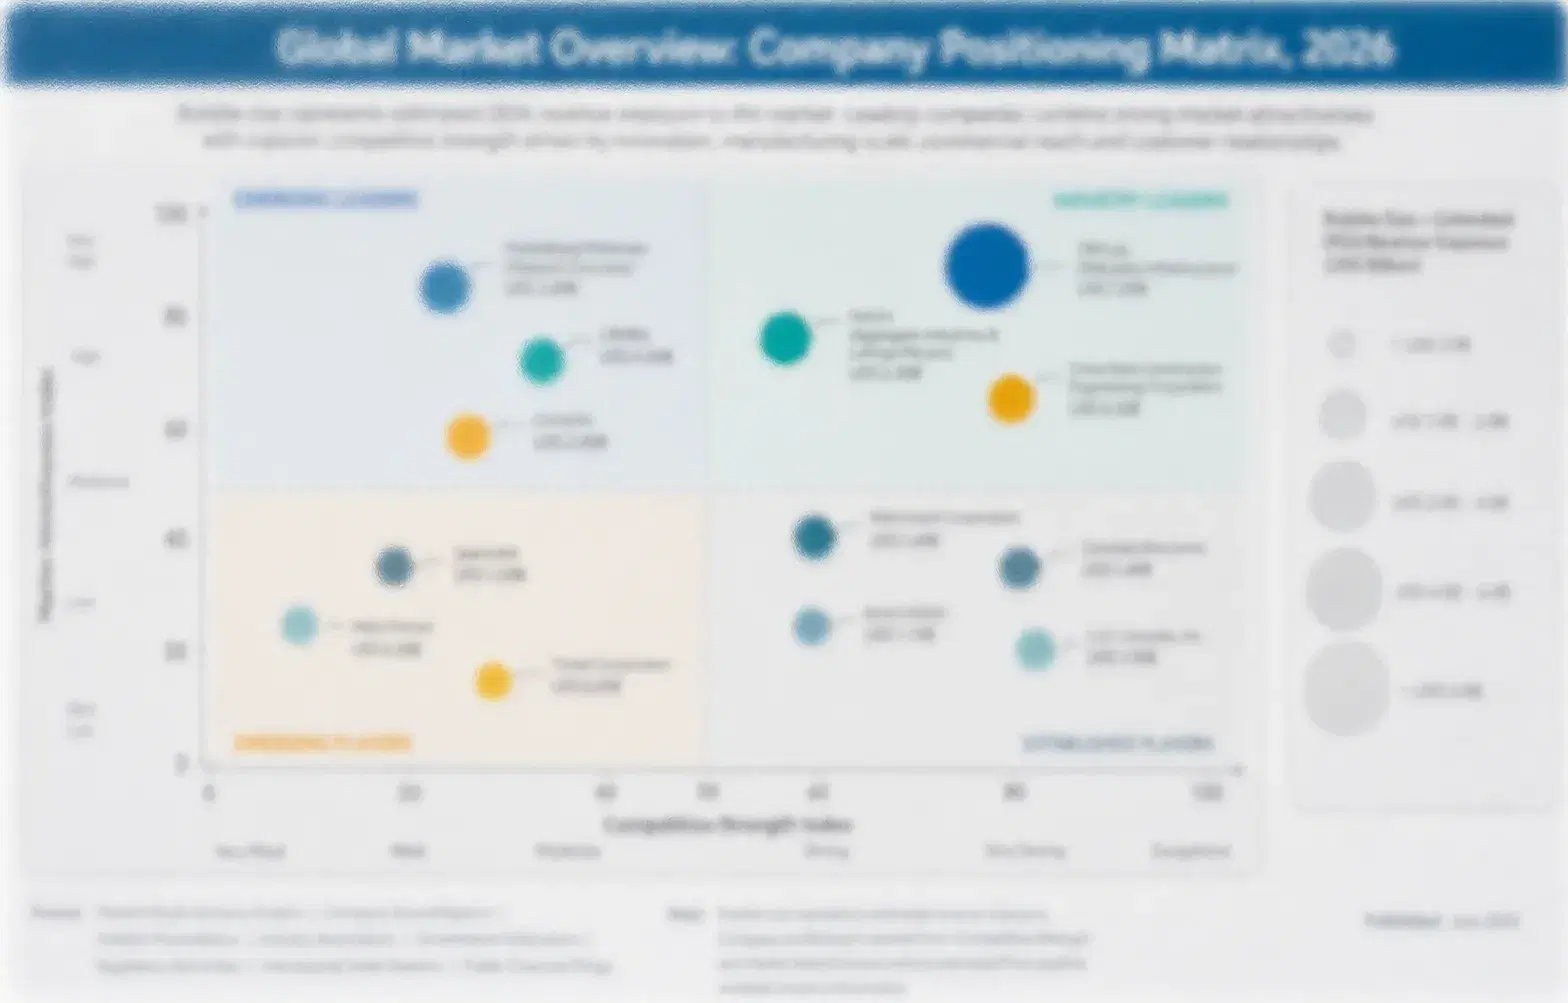
Five vendors hold roughly 44 percent combined share on a revenue basis, a moderately high concentration reflecting the specialized engineering required for real-time accuracy. RTDS Technologies and OPAL-RT Technologies sit clearly ahead of the pack on real-time fidelity, while the gap to third place is narrower than the gap separating the top two from everyone else. That gap reflects engineering depth more than manufacturing scale alone.
Current competitive activity centers on three dimensions: real-time hardware-in-the-loop technology development, grid code compliance certification, and distribution partnerships extending reach into South Asia and Pacific markets growing faster than incumbents' traditional footprints. Smaller challengers are specializing in narrow study-type niches rather than competing across full simulation suites. Patent filings around real-time computing architecture have accelerated noticeably over the past two years.

Emerging pressure comes from Chinese vendors scaling domestic simulation capacity fast enough to challenge established incumbents on price within export markets, and from utility R&D departments increasingly demanding custom modeling capability. Rankings could shift meaningfully over the next five years if renewable interconnection standards tighten faster across mid-sized grid operators. Pricing discipline among the top five is also eroding slightly as Chinese entrants compete more aggressively on cost.
power-system-simulator-market-company-positioning-matrix-1790928323831

Competitive Moat and Risk Dimensions

RTDS TECHNOLOGIES

Moat: Real-Time Fidelity and Accuracy

RTDS Technologies holds the deepest real-time simulation fidelity of any vendor, a technical lead built over decades that newer entrants cannot replicate quickly. This accuracy lets the company win interconnection validation contracts that competitors with lower fidelity systems must decline. This reach also helps RTDS absorb regional demand swings more comfortably than single-market rivals.
RTDS TECHNOLOGIES

Risk: Premium Pricing Limits Volume Share

RTDS Technologies' premium positioning leaves it less competitive on price-sensitive bids against lower-cost regional vendors, particularly in Latin America and South Asia and Pacific markets where price sensitivity runs higher. That gap widens further whenever specialized engineering costs rise and premium features add proportionally more cost.
OPAL-RT TECHNOLOGIES

Moat: Modular Architecture and Flexibility

OPAL-RT's modular hardware architecture lets customers scale simulation capacity incrementally rather than committing to large fixed systems, an advantage smaller research programs value highly. This flexibility also lets OPAL-RT serve a broader range of customer budgets than fixed-configuration rivals. That flexibility helps OPAL-RT retain customers who later expand capacity rather than switch vendors entirely.
OPAL-RT TECHNOLOGIES

Risk: Enterprise Segment Growth Lags Rivals

OPAL-RT has grown more slowly than RTDS in the largest enterprise utility accounts, risking lost specification share as major grid operators modernize. That gap compounds if enterprise R&D budgets keep expanding before OPAL-RT closes its relationship gap across relevant customer categories. OPAL-RT has signaled intent to close this gap but has not yet disclosed a concrete timeline.

Players Tracked

Prominent Players

RTDS Technologies
OPAL-RT Technologies
Siemens PTI
DIgSILENT GmbH
Hitachi Energy

Other Key Players

ETAP (Operation Technology Inc)
PowerWorld Corporation
Typhoon HIL
CYME International
Neplan AG
Manitoba Hydro International
ASPEN Inc
Hydro-Quebec
Schweitzer Engineering Laboratories
National Instruments
dSPACE GmbH
Speedgoat GmbH
ABB Ltd
MathWorks
Advanced Digital Power Systems

Recent Developments

FEBRUARY 2026

RTDS Launches Expanded Renewable Modeling Platform

RTDS Technologies introduced a dedicated renewable integration modeling platform with expanded inverter-based resource libraries, targeting utility R&D departments directly. The launch followed sixteen months of internal development and positions RTDS ahead of rivals still pursuing comparable renewable modeling depth. Observers expect rivals to accelerate renewable programs in response.
Signal: Signals accelerating vendor race for renewable modeling leadership across utility research markets. Utility buyers are watching closely.
SEPTEMBER 2025

OPAL-RT Expands European Compliance Testing Capacity

OPAL-RT Technologies announced organic expansion of its grid code compliance testing capacity to meet tightening ENTSO-E requirements, adding staff at its primary testing facility. The expansion is expected to reach full capacity within twelve months, according to the company's statement. Compliance leadership remains central to its strategy.
Signal: Confirms OPAL-RT is prioritizing compliance certification over enterprise expansion for now. European export share could rise as a result.
APRIL 2026

Siemens PTI Signs Multi-Year Utility Research Agreement

Siemens PTI signed a multi-year research partnership agreement with a major North American utility to provide simulation infrastructure across a multi-year grid modernization program. The agreement was not structured as a joint venture or acquisition but as a direct bilateral research arrangement. Analysts called the deal a useful model.
Signal: Shows mid-tier vendors winning large research partnerships away from top-five incumbents directly. Larger incumbents are taking notice.

Specialized Processor Exposure Across the Chain

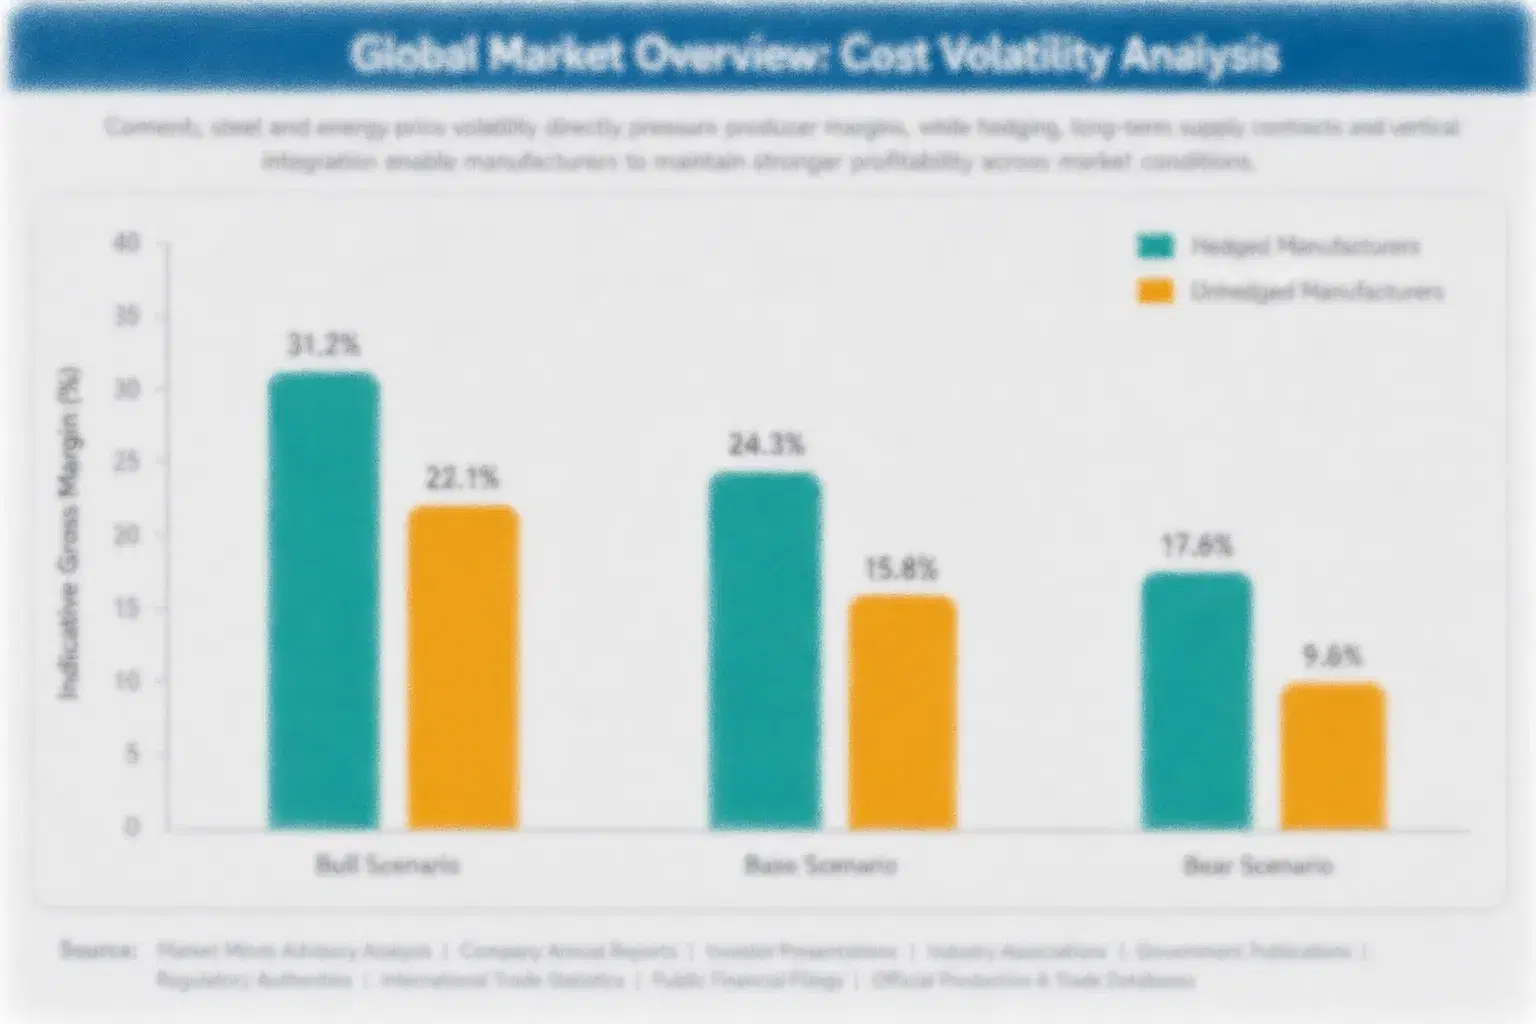
Specialized real-time processors and FPGA components together represent roughly 31 percent of simulator cost of goods sold, sourced primarily from a handful of specialized semiconductor foundries that serve the broader real-time computing industry. This concentration leaves vendors exposed whenever semiconductor supply tightens or processor lead times extend sharply. Chassis inputs add a smaller cost layer.
Specialized processor prices and lead times spiked sharply through 2022 amid global semiconductor shortages affecting real-time computing broadly, an episode several vendors referenced in annual report commentary on margin compression that year. Vendors without hedging programs absorbed higher component costs for roughly a year before prices moderated, compressing margins on fixed-price multi-year research contracts signed before the surge. Several vendors renegotiated supplier terms afterward to avoid repeating that exposure in future product cycles.

Smaller regional vendors carry proportionally higher cost exposure than RTDS Technologies and OPAL-RT Technologies, who negotiate volume-based component contracts directly with foundry partners. This gap widens further for vendors redesigning entry-tier hardware without the engineering budget to accelerate that work. Scale matters here: larger vendors spread fixed foundry relationships across far greater purchase volume than smaller regional rivals can match.
power-system-simulator-market-cost-volatility-analysis-1790928324017

Multi-Year Processor Supply Agreements

Leading vendors lock in specialized processor pricing through multi-year supply agreements with foundry partners, trading some pricing flexibility for budget certainty across large multi-year research contracts. This approach shielded several vendors' margins during the 2022 shortage more effectively than spot-market purchasing alone. Several vendors report this held cost growth below component price swings across recent sourcing cycles.

Modular Hardware Redesign Programs

Vendors are investing in modular hardware designs requiring fewer specialized processor components without sacrificing real-time computing accuracy. Early redesigns cut component content meaningfully while meeting existing performance standards across most product tiers tested so far. Wider commercial rollout across additional product lines is expected within the next two to three years. Early feedback has been positive.

Portfolio Architecture for Margin Defence

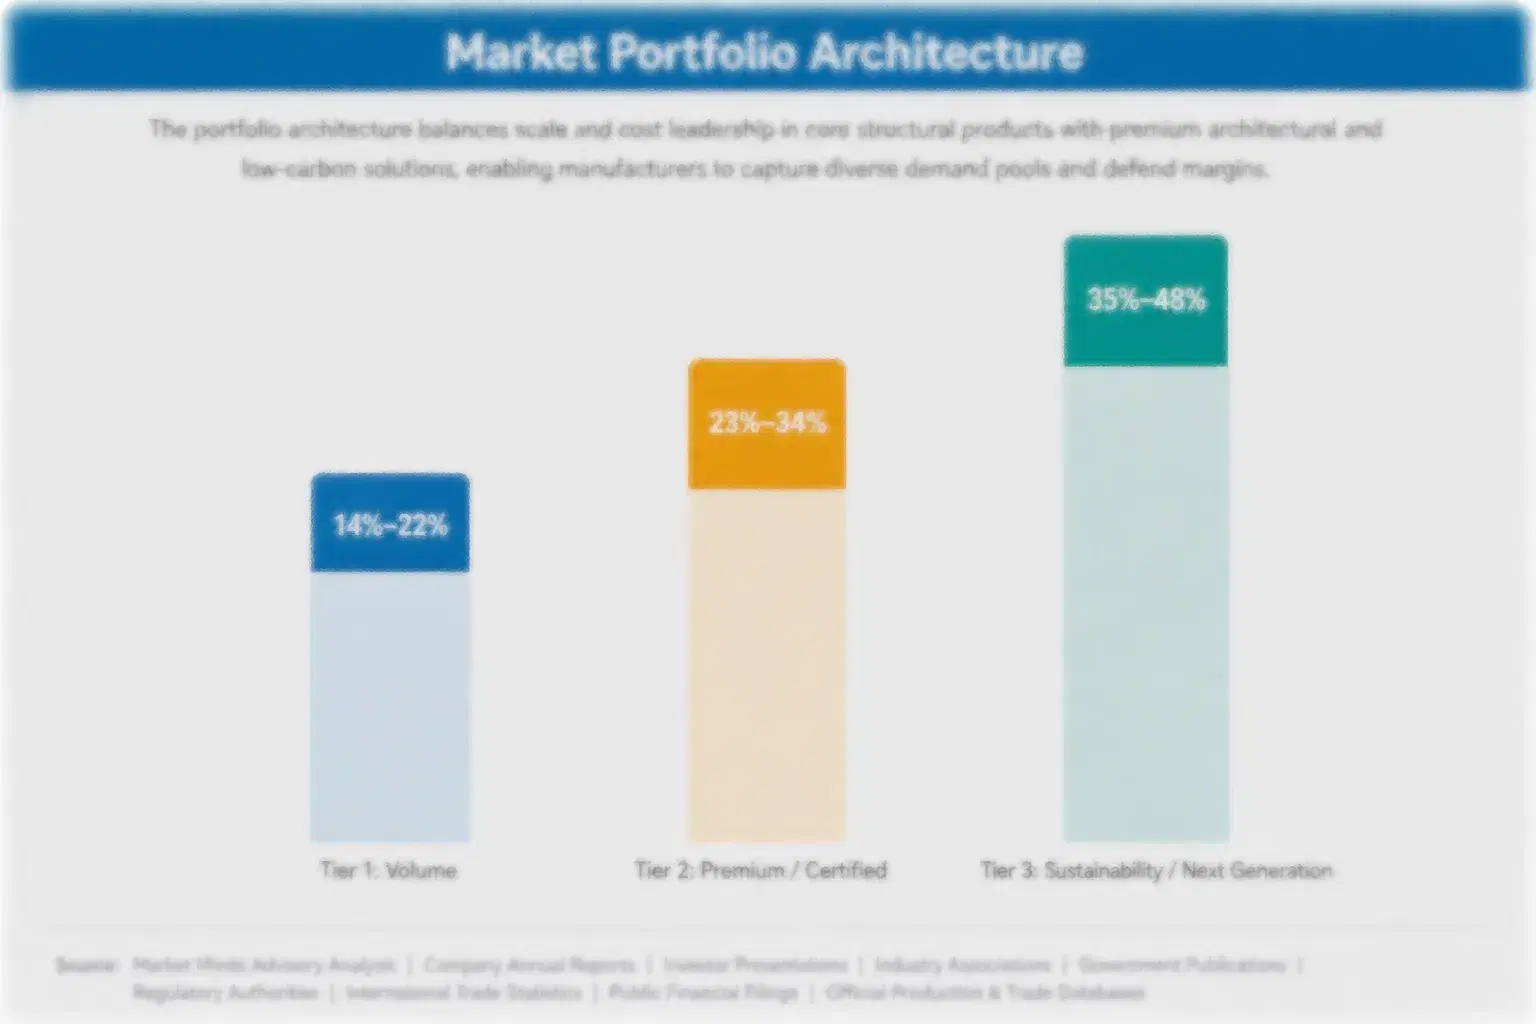
Power system simulator vendors split into three economic tiers. Volume commodity-adjacent offline modeling software carries thin margins defended mainly on installed base and distributor relationships rather than engineering differentiation. Premium certified lines serving real-time renewable and grid code compliance applications command meaningfully wider margins because fidelity requirements, not price, decide the award in most large research contracts. Capacity utilization decides who wins each tier.
The volume versus premium tension is sharpening as renewable buildout spreads real-time demand and grid code tightening pressures offline-only vendors simultaneously. Vendors chasing volume alone face thinning margins from both directions at once. Those investing in real-time engineering and compliance certification capture specification-driven pricing power volume producers cannot access quickly. The certification investment pays back over several years once accreditation opens recurring research and compliance pipelines.

High-value pools concentrate in renewable interconnection validation contracts and utility R&D partnerships, where certification scarcity, not production cost, sets the price. Sustainability and next-generation renewable modeling applications sit at the top of the margin curve today, and that gap is widening as interconnection standards expand faster than certified supply across most jurisdictions. Vendors slow to qualify renewable modeling capability risk losing specification slots to faster-moving rivals permanently.

Volume / Commodity-Adjacent

Standard offline steady-state modeling software sold into legacy utility applications, competing mainly on installed base and distributor relationships with thin margins industry-wide. Replacement cycle length, not design innovation, largely governs revenue stability in this tier.
Gross Margin: 16-22%

Premium / Certified

Real-time hardware-in-the-loop systems specified directly into grid code compliance and renewable interconnection contracts, sustained by certification requirements most low-cost competitors cannot meet quickly. Scarce certification keeps competitive intensity lower here than in the volume tier.
Gross Margin: 34-42%

Sustainability / Regulatory / Next-Generation

Renewable integration and microgrid simulators engineered for utility R&D specification and distributed energy validation, commanding the highest margins as renewable mandates expand nationwide. Research investment in renewable fidelity is concentrated heavily in this tier.
Gross Margin: 44-52%
power-system-simulator-market-portfolio-architecture-1790928324207

High-value Sub-segments and Strategic Watch-out

Renewable Integration and Microgrid Simulators

Fastest-growing and highest-margin segment, driven directly by renewable buildout and inverter-based resource proliferation. Fidelity scarcity is pronounced enough that qualified vendors command premium pricing and multi-year contract visibility ahead of most competitors. Vendors who secured fidelity early are now winning repeat research contracts ahead of late entrants.
Gross Margin: 44-52%

Hardware-in-the-Loop Simulation Systems

Second-fastest segment combining steady compliance-driven demand with durable research cycles. Multi-year partnerships signed during program design phase sustain predictable order books for vendors engaged early in development. Utilities increasingly request these partnerships before formal procurement even begins. Pricing competition rarely dislodges a vendor engaged from the design phase onward.
Gross Margin: 34-42%

Offline Steady-State Modeling Software

The volume core of the industry, sold into legacy utility and general engineering applications. Growth tracks utility research spending closely, and margins stay moderate against component cost pressure industry-wide. Pricing pressure here rarely eases, keeping this segment the industry's steady baseline. Few vendors exit voluntarily despite thinner economics.
Gross Margin: 18-24%

Specialized Engineering Talent Exposure

A strategic watch-out segment tied closely to the specialized talent shortage constraining vendor capacity. Demand is steady but growth is modest, and vendors without strong university partnerships risk losing development capacity to better-staffed rivals. Vendors with strong talent pipelines are pulling ahead of competitors lacking comparable investment.
Gross Margin: 20-26%

Validation Lock-In Across Research Programs

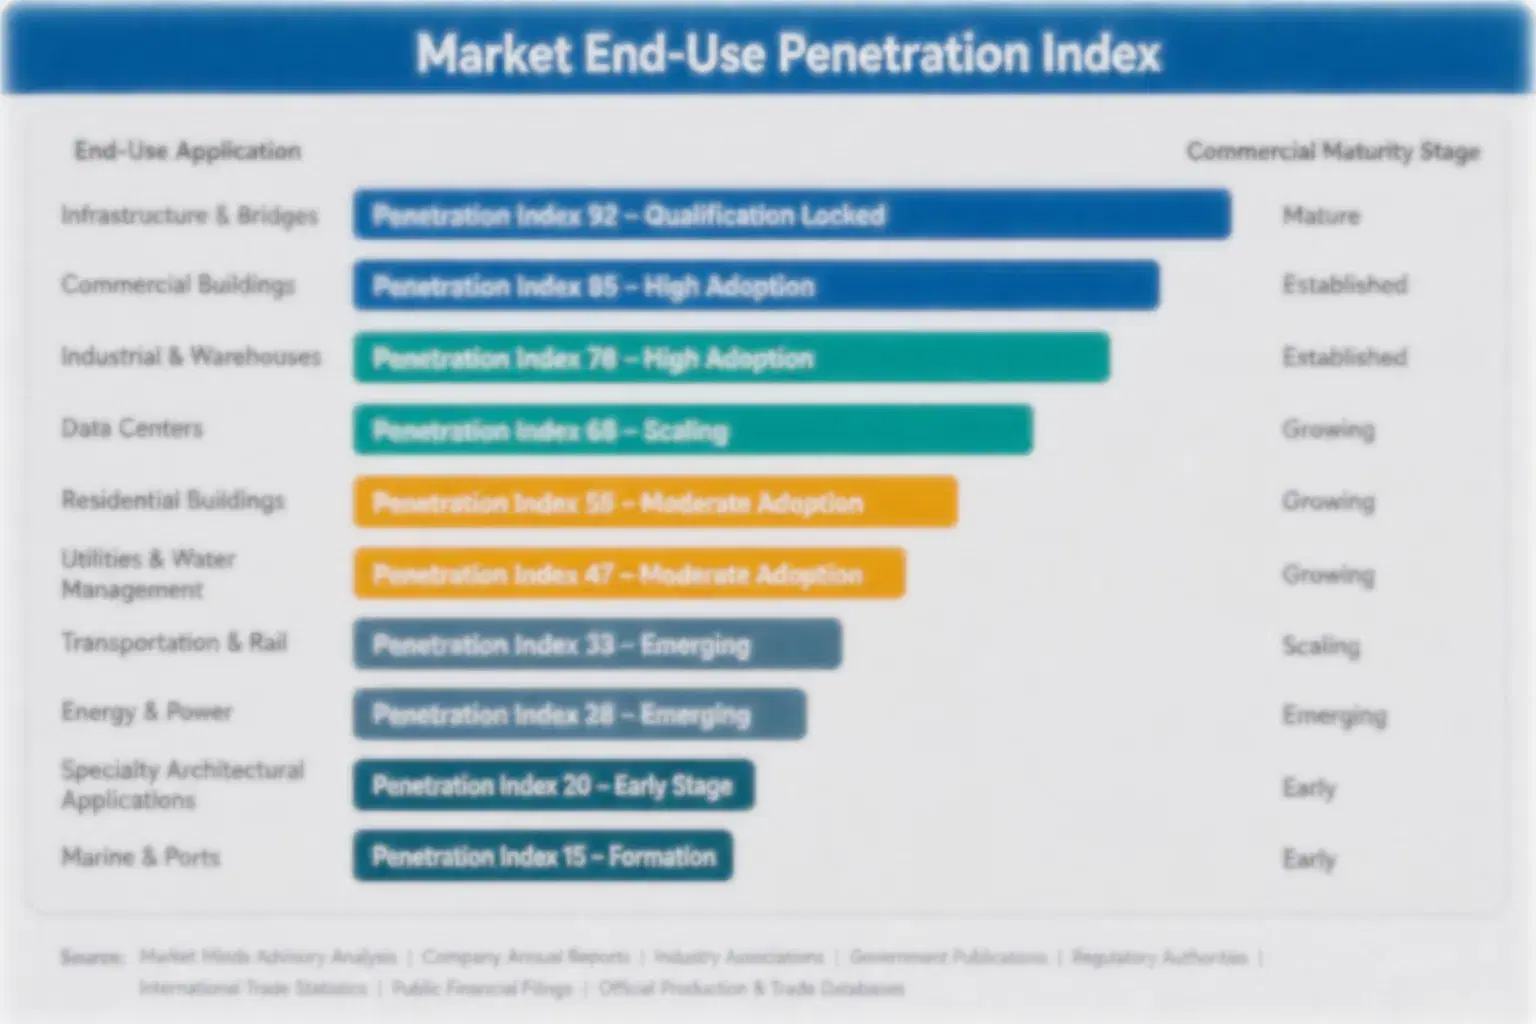
Power system simulator demand behaves closer to an annuity than a one-time sale once a utility R&D department standardizes on a vendor's real-time hardware-in-the-loop line. Program extensions and multi-year research partnerships generate recurring revenue for years after the initial specification, and switching vendors mid-program triggers costly requalification work most utilities want to avoid entirely. Program managers treat an approved simulator design as a qualified component, locking in supply for the program's operational life.
Adoption stickiness varies sharply by end-use vertical. Utility R&D departments rarely re-bid mid-program once a simulator passes validation testing, while equipment manufacturer buyers in cost-sensitive channels switch more readily on price alone. Grid operator compliance partners sit closest to the utility end of this spectrum, locking in preferred vendors early and rarely revisiting that choice. That middle position makes equipment manufacturing the segment where competitive share actually moves most.

Buyer profiles are shifting generationally as power systems engineers trained on real-time simulation enter utility research roles and favor real-time specifications by default rather than treating them as a special case. This shift favors vendors who invested early in real-time infrastructure, while legacy offline-only vendors face a slower erosion of their traditional customer relationships.
power-system-simulator-market-end-use-penetration-index-1790928324390

Where Simulation Capital Should Go Next

These are among the four positions where our research anticipates prominent divergence between winners and laggards over the coming forecast period. Each is grounded in the demand model, the regulatory perimeter, and the announced capacity pipeline.
01 / REAL-TIME ENGINEERING INVESTMENT

Qualify real-time renewable modeling before rivals close the gap

Real-time engineering capability is already the binding constraint on renewable interconnection study supply, and every vendor waiting on the sidelines extends that gap further for everyone still relying on offline-only product lines. Early movers lock in utility R&D specification slots that late entrants cannot easily dislodge once a design is approved for a program's standard. Vendors that qualify real-time modeling within the next eighteen months stand to capture a disproportionate share of a segment growing at 12.32 percent annually through the forecast window.
02 / UTILITY R&D RELATIONSHIP DEPTH

Engage utility R&D departments during design phase, not at tender

Utility research demand rewards vendors who engage R&D departments during program design phase, before formal procurement begins, because switching vendors mid-program triggers costly requalification work utilities want to avoid entirely. Vendors using this approach already report winning meaningfully more research program slots than those competing only at tender stage. This segment's strong growth rate makes it worth defending actively through dedicated account coverage, not the opportunistic bidding that happens once programs are already structured and leverage has shifted toward whichever vendor engaged first.
03 / PROCESSOR SUPPLY RISK MANAGEMENT

Lock multi-year processor agreements before the next shortage cycle

Specialized processors represent roughly a third of unit cost, and the 2022 shortage showed how exposed vendors without supply agreements become during tight periods for global semiconductor output. Waiting for the next shortage cycle to negotiate terms simply repeats the same margin compression smaller vendors already absorbed once before. Vendors that secure multi-year agreements now protect margin durably across the next full product cycle, regardless of what semiconductor markets do next or how quickly global semiconductor supply chains eventually recover.
04 / UNIVERSITY TALENT PIPELINE STRATEGY

Build university partnerships before the talent shortage deepens further

Specialized power systems engineering talent remains scarce relative to demand, and vendors waiting for the labor market to ease will find hiring even harder as renewable complexity drives more R&D program growth across the industry. University partnerships that build dedicated talent pipelines take years to mature, making early investment the only realistic path to adequate staffing. Vendors that build these partnerships now protect development capacity they would otherwise lose to faster-moving competitors already investing today in dedicated university staffing programs.

Engagement Snapshot From the Field

A live engagement with an industry participant carrying material or product regulatory and market exposure ahead of a defining policy shift, showing how our research translates into a defensible multi-year portfolio strategy.
MARKET MINDS ADVISORY · CLIENT ENGAGEMENT SUMMARY
Power System Simulator Producer Strategic Portfolio Review and Transition Roadmap 2026·Investment Scenario on Power System Simulator Exposure Evaluation 2025-26
CLIENT PROFILE
A mid-sized regional utility with roughly $340 million (client-reported, unverified by MMA) in annual R&D budget allocation, operating a legacy offline modeling capability with no real-time simulation infrastructure despite rapidly increasing renewable interconnection application volume across its service territory. The utility had grown through steady regional expansion over the prior decade. The utility's engineering team recognized the limitation but lacked internal justification for the capital investment.
STRATEGIC CHALLENGE
Renewable interconnection application backlogs stretched past fourteen months as offline modeling tools could not adequately validate inverter-based resource behavior, risking regulatory penalties and developer complaints. Leadership needed to decide how much capital to commit to real-time simulation infrastructure within a constrained budget before the backlog grew further. The board had set a firm deadline for a capital allocation decision within the current fiscal quarter.
MMA APPROACH
MMA benchmarked real-time simulator vendors against validation throughput, accuracy, and total cost of ownership, conducted primary interviews with the utility's interconnection engineering staff on operational bottlenecks, and modeled capital allocation scenarios prioritizing throughput improvement against the regulatory penalty exposure from continued delays. The analysis also flagged which interconnection queue segments carried the highest regulatory penalty risk for board review.
KEY FINDINGS
  1. The interconnection backlog represented an estimated $12 million (client-reported, unverified by MMA) in delayed developer revenue across pending renewable projects. across the pending project pipeline.
  2. Real-time simulation infrastructure would cut validation time per application from roughly six weeks to two weeks based on vendor benchmarks. assuming no major supply chain delays affected the deployment schedule.
  3. Full infrastructure investment would require approximately $5.6 million (client-reported, unverified by MMA) in capital, recoverable within an estimated three years. phased across the three recommended implementation stages over roughly a year.
  4. Peer utilities with real-time simulation capability processed interconnection applications at nearly triple the throughput rate of offline-only operations. a gap the utility's engineering team had flagged repeatedly in prior quarters.
CLIENT PROFILE
A mid-sized regional utility with roughly $340 million (client-reported, unverified by MMA) in annual R&D budget allocation, operating a legacy offline modeling capability with no real-time simulation infrastructure despite rapidly increasing renewable interconnection application volume across its service territory. The utility had grown through steady regional expansion over the prior decade. The utility's engineering team recognized the limitation but lacked internal justification for the capital investment.
STRATEGIC CHALLENGE
Renewable interconnection application backlogs stretched past fourteen months as offline modeling tools could not adequately validate inverter-based resource behavior, risking regulatory penalties and developer complaints. Leadership needed to decide how much capital to commit to real-time simulation infrastructure within a constrained budget before the backlog grew further. The board had set a firm deadline for a capital allocation decision within the current fiscal quarter.
MMA APPROACH
MMA benchmarked real-time simulator vendors against validation throughput, accuracy, and total cost of ownership, conducted primary interviews with the utility's interconnection engineering staff on operational bottlenecks, and modeled capital allocation scenarios prioritizing throughput improvement against the regulatory penalty exposure from continued delays. The analysis also flagged which interconnection queue segments carried the highest regulatory penalty risk for board review.
KEY FINDINGS
  1. The interconnection backlog represented an estimated $12 million (client-reported, unverified by MMA) in delayed developer revenue across pending renewable projects. across the pending project pipeline.
  2. Real-time simulation infrastructure would cut validation time per application from roughly six weeks to two weeks based on vendor benchmarks. assuming no major supply chain delays affected the deployment schedule.
  3. Full infrastructure investment would require approximately $5.6 million (client-reported, unverified by MMA) in capital, recoverable within an estimated three years. phased across the three recommended implementation stages over roughly a year.
  4. Peer utilities with real-time simulation capability processed interconnection applications at nearly triple the throughput rate of offline-only operations. a gap the utility's engineering team had flagged repeatedly in prior quarters.
RECOMMENDED STRATEGY
Phase 1: Phase one: deploy real-time simulation infrastructure for the highest-volume interconnection queue first, within six months. This sequencing addressed the highest regulatory risk first. Phase 2: Phase two: measure validation throughput improvement before committing further capital to additional simulation capacity. This validation step reduced capital risk before full rollout began. Phase 3: Phase three: expand real-time capability across all remaining interconnection queues once throughput gains are confirmed. Full completion was targeted within twelve months of the pilot phase.
OUTCOME
The utility deployed phase one infrastructure within five months and reported (client-reported, unverified by MMA) cutting its interconnection backlog by 60 percent within the first year, avoiding regulatory penalty exposure and improving developer relationships across its service territory meaningfully. Leadership credited the phased approach with restoring developer confidence ahead of competing utilities.

Frequently Asked Questions

Foundational context covering the market sizes, CAGR, scope, country, region and competition that inform every finding below. This section is provided to cover basics and most often pre-purchase conversations, answered from the MMA Primary Research Dataset.

What is the current size of the Power System Simulator Market?

The power system simulator market reached an estimated $0.92 billion in global value in 2025, covering software and hardware tools used to model and validate power system behavior for utilities and grid operators.

How large will the Power System Simulator Market be by 2036?

MMA projects the market reaching roughly $2.15 billion by 2036, driven primarily by renewable interconnection validation and continued utility R&D investment spending worldwide. That growth trajectory reflects rising global renewable deployment broadly.

What is the CAGR for the Power System Simulator Market 2026 to 2036?

The market is forecast to grow at an 8.8 percent compound annual rate between 2026 and 2036, with real-time and renewable modeling lines growing meaningfully faster than that average.

Which segment is growing fastest?

Renewable Integration and Microgrid Simulators leads at a 12.32 percent CAGR, roughly 1.4 times the overall market rate, driven by inverter-based resource proliferation worldwide. Growth here keeps accelerating steadily.

Who are the major companies in the Power System Simulator Market?

Leading participants include RTDS Technologies, OPAL-RT Technologies, Siemens PTI, DIgSILENT GmbH, and Hitachi Energy, together holding an estimated 44 percent combined revenue share. No single vendor holds more than a modest double-digit slice individually.

Which country is growing fastest?

China leads country-level growth at an estimated 10.8 percent CAGR, supported by rapid renewable deployment and expanding domestic grid modernization investment nationwide. That lead is expected to persist through much of the forecast window.

Report Segmentation Architecture

The full report scope spans multiple orthogonal segmentation dimensions, with cross-tabulated demand data provided for each dimension pair. Coverage extends further to regional breakdowns, trend trajectories, and the competitive detail needed to support segment-level decision-making.

By Simulation Technology

  • Real-Time Digital Simulators
  • Offline Steady-State Simulation Software
  • Protection and Relay Testing Simulators
  • Renewable Integration and Microgrid Simulators
  • Training and Education Simulators
  • Hardware-in-the-Loop Simulation Systems

By End-Use Industry

  • Utilities and Grid Operators
  • Equipment Manufacturers
  • Academic and Research Institutions
  • Government and National Laboratories
  • Independent Power Producers

By Commercial Dimension

  • Direct Hardware and Software Sales
  • Validation and Compliance Services
  • Research Partnership Agreements
  • Training and Support Services

By Region

  • North America
  • Western Europe
  • East Asia
  • South Asia and Pacific
  • Latin America
  • Middle East and Africa
  • Eastern Europe

Scope, Methodology, and Coverage

Every figure in this report is reproducible from documented input assumptions. The scope below maps the historical period, the forecast horizon, the segmentation dimensions, and the countries covered, alongside the underlying primary and qualitative methodology.
Historical Period
2020 to 2025
Forecast Period
2026 to 2036
Base Year
2025 (USD billions; MMA Primary Research Dataset, October 2026)
Market Definition
This report covers software and hardware simulation tools used to model, test, and validate power system behavior for utilities, grid operators, and equipment manufacturers worldwide. It excludes general-purpose engineering simulation software and SCADA systems that serve distinct operational functions.
Quantitative Units
USD billions, market value; percentage, CAGR and share
Segmentation Dimensions
Simulation technology, end-use industry, commercial dimension, region
Regions Covered
North America, Western Europe, East Asia, South Asia and Pacific, Latin America, Middle East and Africa, Eastern Europe
Countries Covered
25 countries across North America, Europe, Asia Pacific, Latin America, Middle East and Africa
Key Companies Profiled
20 companies including RTDS Technologies, OPAL-RT Technologies, Siemens PTI, DIgSILENT GmbH, and Hitachi Energy
Quantitative Methodology
Primary survey, n=3,800 respondents, Q4 2025, six countries; demand-side model with trade association cross-validation
Qualitative Methodology
47 expert interviews, Q4 2025; applied to validate demand model assumptions, identify emerging dynamics, and assess competitive positioning
Report Format
PDF and XLSX data workbook (Word format preview document)
Publisher
Market Minds Advisory
Report Code
MMA-2026-TEC-618
Published
October 2026
Contact
sales@marketmindsadvisory.com | www.marketmindsadvisory.com

Purchase the full Power System Simulator Market Report (2026 to 2036).

The full MMA report on the power system simulator market extends this summary with complete country-level sizing, a detailed competitive benchmarking matrix across all 20 profiled companies, and granular segment forecasts through 2036. It includes primary survey data from 3,800 respondents across six countries and 47 expert interviews conducted in the fourth quarter of 2025. The report also maps real-time simulation certification capacity by region, a factor increasingly deciding competitive position across utility research channels. Subscribers additionally receive quarterly updates tracking renewable interconnection standards and validation trends as they develop.
Full 7-region sizing and forecast tables
Complete 20-company competitive benchmarking matrix detail
Segment-level margin and growth detail breakdown
Quarterly interconnection standard tracking updates included
Downloadable data tables in Excel format
Direct analyst access for custom queries

Built For The People Who Decide

From boardroom strategy to bench-side execution, this report is read cover-to-cover by leaders shaping the next decade of their industry, turning demand scenarios, market dynamics and valuation benchmarks into decisions.
CXOs/ Presidents/ VPs/ Managers
M&A and Corporate Development
Strategy Teams and R&D Heads
Procurement and Product Directors
Regulatory and Compliance Leaders
Investor Relations and Equity Analysts