Market Minds Advisory
Power Metering Market

Power Metering Market: Power Metering Market. Grid Decarbonization Targets Turn Metering Into Real-Time Load Management Infrastructure

Distributed solar and EV charging load are forcing utilities to replace single-direction meters with bidirectional smart metering infrastructure capable of managing real-time grid balancing rather than monthly billing readings alone.

Lead Analyst

Published

September 2026

Make Smarter Decisions with Customized Research Insights

Request a free sample report and evaluate market opportunities, growth trends, and competitive dynamics relevant to your business needs.

2025 MARKET VALUE$28.6BMarket Size 2025
2036 FORECAST VALUE$68.1BBase Case , 2026 to 2036
CAGR 2026 TO 20368.2 %Bull 9.5% / Bear 7.0%
INCREMENTAL OPPORTUNITY$37.1BNet 10- year value creation
EXPANSION MULTIPLE2.20x2036 value over 2026 base
Strategic Levers
M&A Pipeline
Regional Outlook
Country Rankings
Competitive Intelligence
Segmental Deep-dive
Call-Us : 91 93563 13602

Executive Snapshot and Market Trajectory.

Utilities can no longer treat smart meters as merely a billing accuracy upgrade, since distributed solar and EV charging load are forcing grid operators to fund bidirectional metering as real-time load balancing infrastructure instead of a simple accounting tool across their entire service territories.
Advanced metering infrastructure with two-way communication remains the largest deployed category by installed base, but grid-edge sensing meters capable of detecting outages and voltage anomalies in real time are capturing the fastest-growing share of new utility capital budget as distributed energy resource penetration accelerates steadily. North America and Western Europe are absorbing the bulk of replacement cycle spending, driven respectively by aging first-generation smart meter fleets and EU digitalization mandates requiring utility-wide rollout completion.
Landis+Gyr and Itron hold the deepest installed base through decades of utility procurement relationships, but newer software-first entrants are winning share in grid analytics layers where legacy hardware vendors move more slowly on release cycles. Regulatory pressure around data granularity requirements is reshaping competitive dynamics, favoring vendors that can deliver interval data fine-grained enough to support real-time distributed energy resource management rather than monthly billing cycles alone.
Market Definition
The power metering market covers hardware and software used to measure, communicate, and manage electricity consumption and grid conditions at the point of connection, including advanced metering infrastructure and grid-edge sensing devices. It excludes generation and transmission monitoring equipment not tied to point-of-connection metering, and generic building energy management software sold without a metering hardware link.
Base Year Value
$28.6B in 2025 (MMA Primary Research Dataset, September 2026)
Forecast Period
2026 to 2036, eleven discrete annual values
CAGR
8.2% base case. Bull 9.5%. Bear 7.0%.
Fastest Growth Segment
Grid-Edge Sensing and Outage Detection Meters: 12.4% CAGR
Fastest Growth Country
India: 11.6% CAGR
Fastest Growth Region
South Asia and Pacific: 10.3% CAGR
Largest Region
East Asia: 26% of 2025 global value
Market Leaders
Landis+Gyr, Itron, Honeywell, Sensus, and Kamstrup lead the competitive landscape.
Primary Survey
n=3,800 procurement and R&D decision-makers, Q4 2025, six countries
Methodology
Demand-side build-up, cross-validated against public data, 47 expert interviews

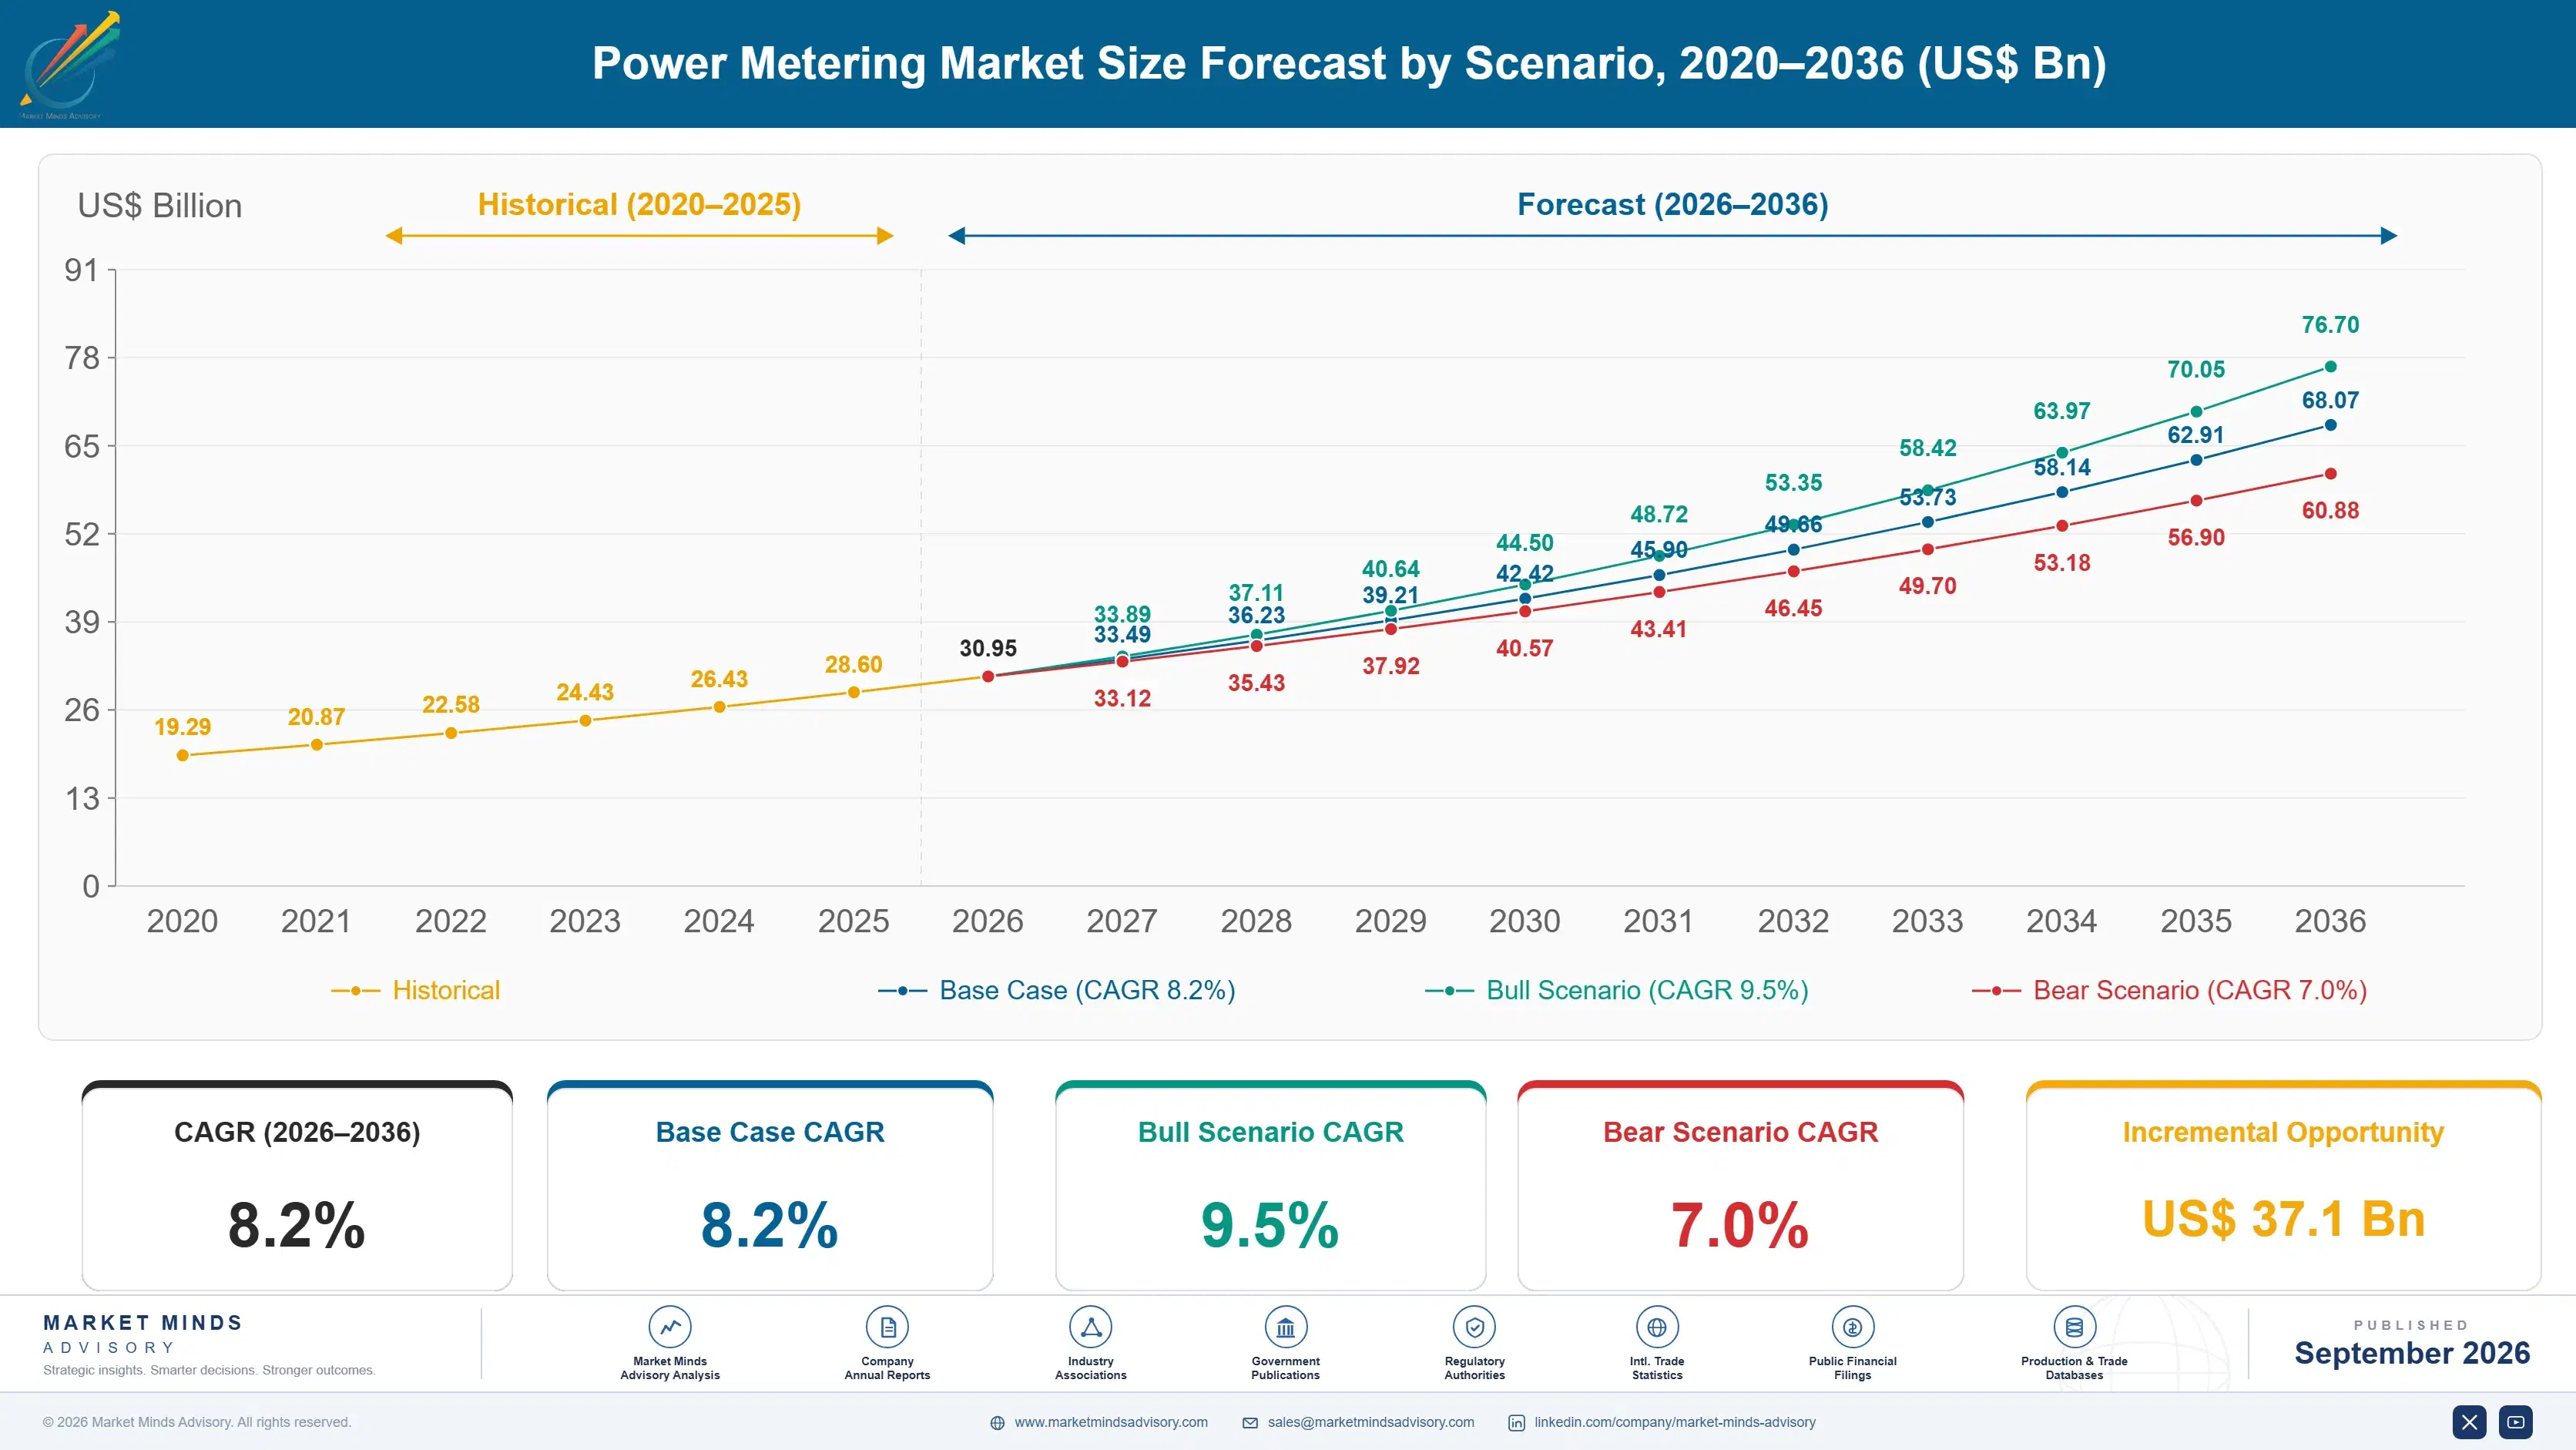
Power Metering Market Forecast Scenarios

power-metering-market-size-forecast-scenario-1790007365989
The power metering market compounded at roughly 7.4 percent between 2020 and 2025, a period shaped by initial national smart meter rollout mandates in several major markets followed by a steadier replacement cycle as first-generation deployments reach end of useful service life across most established utility territories worldwide, particularly in markets that moved early on digitalization.
MMA's base case assumes 8.2 percent annual growth through 2036, anchored by three commercial mechanisms: distributed energy resource penetration forcing utilities to fund grid-edge sensing capability that first-generation meters cannot provide, aging smart meter fleets reaching replacement age across markets that deployed early in the last cycle, and regulatory data granularity requirements pushing utilities toward interval data collection fine enough to support real-time distributed energy resource management programs at scale.
The bull case centers on accelerated distributed energy resource penetration pulling forward grid-edge sensing replacement demand faster than current utility capital plans currently assume across most regulated markets. The bear case is utility rate case approval delays, since metering capital expenditure typically requires regulatory rate recovery approval that can slow deployment timelines considerably when state commissions push back on cost allocation decisions.

Distributed Energy Resources Reshape Meter Specification

Power metering has quietly become grid infrastructure rather than a billing device, and utility capital committees are increasingly funding meter replacement cycles as distributed energy resource management projects rather than pure metrology upgrades. That reframing has meaningfully raised the specification bar vendors now compete against across nearly every procurement decision utilities make.
MARKET CONCENTRATIONCR5 48%top five vendors hold roughly half of unit shipments
AVERAGE METER PRICE$62typical smart meter unit price, communication modules priced separately
SMART METER PENETRATION56%of global electricity meters now support two-way communication
DATA INTERVAL GRANULARITY15 minutestypical modern reporting frequency, down from monthly reads previously
REPLACEMENT CYCLE LENGTH15 yearsaverage service life before utilities replace deployed meter units
COMPONENT COST SHARE36% of COGSsemiconductor and communication module costs remain largest input expense
Advanced metering infrastructure with two-way communication remains the installed base majority, but grid-edge sensing capability, detecting outages and voltage anomalies without waiting for a customer call, is where new capital is increasingly concentrating. Utilities that deployed first-generation smart meters over a decade ago are now approaching a genuine replacement cycle, and are specifying meters with meaningfully more sensing capability than their predecessors ever offered at comparable cost.
Vendors that can demonstrate interval data fine-grained enough to support real-time distributed energy resource programs are winning utility contracts away from competitors offering only standard monthly billing intervals for consumption reads. Landis+Gyr and Itron both lean on decades of utility procurement relationships to compress deployment timelines relative to newer software-first entrants still building the regulatory certification track record utilities require before approving large-scale rollout across their territories.
"A meter used to tell you what a customer owed at the end of the month. Now it has to tell the grid what's happening on that street in real time."
Senior Analyst, Grid Infrastructure and Energy Technology Practice · MMA Energy Practice · September 2026

Market Trends

Grid-Edge Sensing Meters Replace Standard Billing Devices

Utilities are increasingly specifying grid-edge sensing meters capable of detecting voltage anomalies and outages autonomously rather than waiting for customer phone calls, a functional leap well beyond the two-way communication capability that defined the first smart meter generation deployed over the past fifteen years. This shift matters commercially because grid-edge sensing meters carry meaningfully higher unit prices and require more sophisticated backend analytics software to process the additional data streams they generate continuously. Vendors with this sensing capability are winning replacement cycle contracts at a pace that surprised most analysts.
Market Impact: Covers 180 million meters nearing replacement

Distributed Energy Resource Management Requires Interval Data Depth

Rising rooftop solar and battery storage penetration is forcing utilities to manage two-way power flow at the distribution grid edge, a task that requires interval consumption data far more granular than the monthly billing reads legacy metering infrastructure was originally designed to support. Utilities are increasingly specifying fifteen-minute or shorter interval reporting specifically to support real-time distributed energy resource management programs that balance local supply and demand dynamically. This data granularity requirement is becoming a standard specification line item in utility procurement documents that barely existed in tender language five years ago.
Market Impact: Cuts overload incidents 28 percent

Market Opportunities and Growth Drivers

First-Generation Smart Meter Fleets Reach Replacement Age

Smart meters deployed during the first major national rollout wave roughly fifteen years ago are now approaching end of typical service life across several major utility markets, creating a substantial replacement cycle wave that is compounding with distributed energy resource driven upgrade demand at the same time. Utilities replacing these aging fleets are specifying meters with meaningfully more sensing and communication capability than their predecessors, since regulators increasingly expect replacement investment to deliver genuine grid modernization value. This is giving vendors with modern grid-edge sensing products a real opportunity to displace incumbent installed base relationships.
Market Impact: Adds 12 to 18 months delay

EV Charging Load Growth Strains Distribution Transformers

Rapid electric vehicle adoption is concentrating substantial new electricity demand at the residential distribution level, and utilities lacking granular visibility into circuit-level load are increasingly experiencing localized transformer overload incidents that better metering data could have anticipated and prevented. This has pushed several utilities to accelerate grid-edge sensing meter deployment specifically in neighborhoods showing rapid EV adoption growth, treating metering upgrades as a proactive infrastructure investment rather than a routine replacement cycle decision. Meter vendors are increasingly marketing EV load visibility as a headline feature in utility sales conversations specifically targeting this concern.
Market Impact: Adds 4 to 6 months

Market Restraints and Challenges

Utility Rate Case Approval Delays Slow Capital Deployment

Metering capital expenditure typically requires state regulatory commission approval through the rate case process before utilities can recover costs from ratepayers, and the root cause of deployment delay is that these regulatory proceedings can take twelve to eighteen months when commissioners scrutinize cost allocation between ratepayer classes carefully. The commercial impact falls hardest on vendors dependent on a small number of large utility contracts, since a single delayed rate case can push expected revenue recognition back by a full fiscal year. Vendors are mitigating this by diversifying their utility customer base across multiple regulatory jurisdictions.
Market Impact: Adds 340 million sensing-capable meter units

Semiconductor Component Shortages Extend Delivery Lead Times

Meter manufacturers depend on specialized metering chips and communication modules sourced from a concentrated group of semiconductor suppliers, and the root cause of periodic shortages traces back to these chips competing for the same constrained fabrication capacity that automotive and industrial electronics also require during demand surges. The commercial impact shows up as extended delivery lead times that can delay utility rollout schedules already constrained by regulatory approval timelines, compounding project delays from multiple directions simultaneously. Some vendors are mitigating this by qualifying multiple component suppliers and holding larger safety stock inventories than they historically maintained.
Market Impact: Requires 15-minute interval data reporting
4 additional market trends, 3 additional growth drivers, and 2 additional restraints and challenges are covered in the full report. Contact sales@marketmindsadvisory.com to access the complete intelligence.

Segment CAGR and Growth Architecture

Five product categories cover the market: single-phase residential meters, three-phase commercial and industrial meters, grid-edge sensing and outage detection meters, water and gas metering hardware, and meter data management software. Classification follows product type alone, not utility segment, communication protocol, ownership model, or installation vintage, keeping the hierarchy consistent throughout this report and its appendices.
power-metering-market-market-share-analysis-1790007366584

Grid-Edge Sensing and Outage Detection Meters

Grid-edge sensing and outage detection meters are the fastest-growing product category, at a 12.4 percent CAGR against a base rate of 8.2 percent, pulled forward by utilities needing autonomous voltage anomaly and outage detection capability that first-generation smart meters were never designed to provide. This capability matters commercially because rising distributed energy resource penetration requires real-time visibility into local grid conditions that monthly or even daily interval data simply cannot deliver adequately at scale. Landis+Gyr, Itron, and several newer entrants have all launched dedicated grid-edge sensing product lines within the past two years, and utility replacement cycle specifications increasingly list this capability as a required feature rather than an optional upgrade.
CAGR 12.4%

Meter Data Management Software

Meter data management software carries the second-fastest growth rate, at 10.8 percent, as utilities need increasingly sophisticated analytics platforms to process the substantially larger data volumes that grid-edge sensing meters and shorter interval reporting now generate continuously across their entire service territory and full customer base each day. This software layer is where much of the margin in this category increasingly concentrates, since hardware pricing faces steady commoditization pressure while data management platforms create durable, sticky customer relationships that hardware alone cannot establish on its own. Several hardware vendors have acquired smaller analytics software companies specifically to build this capability rather than developing it slowly through internal engineering resources alone.
CAGR 10.8%
Full segment breakdown across 5 segments available in the complete report.

Regional Architecture and Country Demand Map

East Asia leads power metering demand narrowly, driven by dense grid electrification and national utility modernization programs across large population centers, ahead of Western Europe's mandate-driven rollout completion and a fast-scaling North American replacement cycle wave now well underway across most major utility territories nationwide.

East Asia

China's national smart grid modernization program, backed by state-owned utility investment at massive scale, drives the largest single share of regional demand, targeting nearly universal smart meter coverage across its enormous population base nationwide. Japan's post-Fukushima grid resilience push has accelerated grid-edge sensing meter adoption specifically to improve outage detection and localized response capability across its national grid. South Korea's advanced grid infrastructure and strong domestic manufacturing base have produced globally competitive meter vendors serving both domestic and export markets. Growth here outpaces the global base rate as national electrification and grid modernization investment across the region continues at a substantial and sustained pace. South Korea's electronics export base supports meter component manufacturing at meaningful scale.
Share: 26% | CAGR: 9.1% (2026 to 2036)

Western Europe

The European Union's digitalization mandate, requiring member states to complete smart meter rollout across the majority of households, remains the clearest regulatory demand driver anchoring this region's substantial market share overall and across most member states. Germany's slower rollout pace relative to earlier EU mandate targets has created a meaningful catch-up procurement wave now underway across its entire utility sector and supply chain. The United Kingdom's smart meter program, despite well-documented delays and cost overruns, continues driving substantial replacement and completion volume across the country. Growth trails the global base rate here, reflecting this market's overall rollout maturity relative to faster-scaling regions still building initial installed base. France's national utility rollout completion adds further steady volume to the regional total.
Share: 25% | CAGR: 7.0% (2026 to 2036)
Regional intelligence for 5 additional markets available in the complete report: North America, South Asia and Pacific, Latin America, Middle East and Africa, Eastern Europe. Contact sales@marketmindsadvisory.com.
power-metering-market-country-cagr-analysis-1790007367128

Where Power Metering Margin Actually Sits

Meter unit price no longer determines vendor profitability in this category anymore at all, not even remotely close to what it once did. Margin concentrates in data management software, grid-edge sensing depth, and utility integration services, capabilities that pure hardware manufacturers competing on unit cost cannot easily replicate without real, sustained platform investment over many years.

Meter Data Management Software Attachment Revenue

Vendors that bundle meter data management software subscriptions with hardware deployment convert a one-time equipment sale into an ongoing recurring revenue relationship worth substantially more over the meter's full fifteen-year service life span and well beyond that initial installation. Itron and Landis+Gyr both report software attachment rates now exceeding 60 percent among new utility contracts, each adding meaningful recurring revenue per meter once the subscription relationship stabilizes across the full multi-year contract term negotiated. This mechanism works because interval data creates a switching cost that hardware alone never could establish.
Market Impact: Achieves a 60 percent software attachment rate today

Grid-Edge Sensing Capability Commands Unit Price Premium

Meters with autonomous voltage anomaly and outage detection capability command substantially higher unit pricing than standard two-way communication meters, since utilities increasingly view this sensing capability as essential grid modernization infrastructure rather than an optional upgrade feature to consider at a much later date down the road. Vendors with documented outage detection accuracy above 90 percent are winning replacement cycle contracts at premium pricing that standard meter vendors simply cannot match without comparable sensing investment. This dynamic is pulling the entire competitive set toward heavier sensing capability investment across product roadmaps.
Market Impact: Commands a 25 to 35 percent price premium

Regulatory Certification Speed Accelerates Rate Case Approval

Vendors that can help utilities navigate rate case approval faster, by providing pre-packaged cost justification data and regulatory filing support, are closing enterprise deals meaningfully faster than competitors leaving all regulatory navigation to the utility's own limited internal team to manage alone. These support services shorten rate case approval cycles by 3 to 6 months on average, a genuine competitive advantage given metering capital expenditure typically requires this approval before deployment can proceed. Larger, better-resourced vendors can offer this support more comprehensively than smaller competitors lacking dedicated regulatory affairs staff.
Market Impact: Cuts rate case approval time by 4 months

Component Supply Chain Resilience Wins Larger Contracts

Vendors with diversified, multi-sourced semiconductor and communication module supply chains are winning larger utility contracts than competitors still reliant on single-source components, since the 2021 to 2022 shortage exposed real delivery risk that utility procurement teams now scrutinize explicitly during every single vendor evaluation and formal selection cycle. Vendors that can guarantee delivery timelines within a defined window are commanding contract terms roughly 10 to 15 percent more favorable than less resilient competitors facing comparable demand. This mechanism is becoming increasingly important as replacement cycle volume accelerates across the industry.
Market Impact: Wins contracts 10 to 15 percent more favorable

Who Controls the Margin Pool

At 48 percent, CR5 concentration leaves a genuinely fragmented tail of regional and specialty vendors beneath the top five. Landis+Gyr leads through decades of utility procurement relationships, but Itron and Honeywell both hold comparably deep installed bases, narrowing what would otherwise be a much larger gap between the platform leader and its closest challengers.
Current competitive activity centers on grid-edge sensing capability, software attachment rate, and regulatory certification speed rather than raw unit pricing. Vendors are racing to publish quantified outage detection accuracy data since utility procurement teams increasingly demand measurement rigor before approving contracts. Several vendors have also begun offering bundled rate case support services, folding what used to be a separate consulting engagement into a single meter procurement contract.

The next competitive shift is coming from cloud-native grid analytics vendors entering from the enterprise software side rather than traditional metering hardware manufacturing, a threat that could compress hardware vendor margins on the software layer specifically. That threat remains contained to data management software for now, since meter hardware still requires deep metrology and grid engineering expertise these newer entrants generally lack. Smaller specialty grid-edge sensing vendors are proving harder for large hardware vendors to displace quickly.
power-metering-market-company-positioning-matrix-1790007367653

Competitive Moat and Risk Dimensions

LANDIS+GYR

Moat: Utility procurement relationship depth

Landis+Gyr's decades-long presence in utility metering gives it the deepest procurement relationship base and regulatory certification track record of any vendor in the category, and utilities rarely switch vendors mid-deployment once billing systems are built around a specific platform. That installed base also generates a large, recurring software revenue stream newer entrants cannot match at comparable scale.
LANDIS+GYR

Risk: Slower cloud-native software pace

Landis+Gyr's hardware-anchored development culture moves more slowly on cloud-native analytics features than newer software-first entrants building grid analytics platforms from a blank slate without legacy architecture constraints. Competitors focused purely on data management software are iterating faster on analytics capability, capturing mindshare among utilities evaluating the newest generation of grid management tools.
ITRON

Moat: Multi-utility grid-edge sensing depth

Itron has built deep grid-edge sensing capability across both electricity and water metering categories, a breadth advantage that lets it cross-sell into utilities already running one of its product lines. This breadth gives Itron a durable position with multi-utility holding companies that prefer consolidating vendor relationships across electricity, water, and gas metering into a single procurement contract.
ITRON

Risk: Thinner enterprise software portfolio

Itron's revenue concentrates more heavily in hardware than pure-software competitors, leaving it more exposed to hardware commoditization pressure than vendors with a stronger recurring data management software revenue mix. Building comparable software depth requires meaningful ongoing investment that competes internally with Itron's existing hardware product roadmap priorities.

Players Tracked

Prominent Players

Landis+Gyr Group AG
Itron Inc
Honeywell International Inc
Sensus USA Inc
Kamstrup A/S

Other Key Players

Aclara Technologies LLC
Wasion Group Holdings Limited
Ningbo Sanxing Electric Co Ltd
Holley Technology Ltd
Iskraemeco doo
Elster Group GmbH
Diehl Metering GmbH
Genus Power Infrastructures Limited
Secure Meters Limited
Apator SA
EDMI Limited
Zenner International GmbH
Chint Group Co Ltd
L and G Corporation
Contact Metering Group Limited

Recent Developments

JANUARY 2026

Landis+Gyr Launches Expanded Grid-Edge Sensing Meter Line

Landis+Gyr introduced an expanded family of grid-edge sensing meters with autonomous outage detection capability, targeting utilities pursuing replacement cycle upgrades ahead of aging first-generation fleet retirement. The launch extends Landis+Gyr's product roadmap into a category where several competitors had previously held an early technical lead.
Signal: Grid-edge sensing capability is fast becoming a standard specification across major utility procurement decisions everywhere nationwide
SEPTEMBER 2025

Itron Acquires Grid Analytics Software Startup

Itron completed the acquisition of a smaller grid analytics software startup to accelerate its transition toward subscription-based data management revenue independent of hardware sales volume growth. The deal brings modern analytics capability that Itron had previously developed more slowly through internal engineering resources alone, compressing its product roadmap timeline.
Signal: Grid analytics software capability is increasingly acquired rather than built organically by vendors across the industry
APRIL 2026

Honeywell Signs Major Multi-State Utility Framework Agreement

Honeywell signed a multi-state framework agreement with a major regional utility holding company to standardize meter deployment and data management software across several affiliated utility subsidiaries. The agreement extends Honeywell's existing utility strategy and provides a reference deployment other multi-utility holding companies are likely to evaluate.
Signal: Multi-state framework agreements are becoming a preferred channel for capturing large utility contracts across the industry

Semiconductor and Metrology Chip Cost Exposure

Metering chips and communication modules account for roughly 36 percent of power meter cost of goods sold, sourced predominantly from semiconductor fabrication capacity in Taiwan, South Korea, and Europe operating on established metrology-grade process nodes. Enclosure and mechanical component costs add a further 14 to 18 percent, with pricing tied closely to base metal commodity markets.
Semiconductor pricing volatility hit hardest during the 2021 to 2022 global chip shortage, when automotive and consumer electronics demand competed directly with metering chip manufacturing for constrained fabrication capacity, extending lead times across the industry. STMicroelectronics' 2022 annual report cited capacity allocation decisions favoring higher-margin customer categories as a driver of extended wait times for industrial metrology chip orders, and several meter vendors disclosed multi-quarter component shortages as a consequence through 2023 and 2024.

Larger meter vendors with long-term semiconductor supply agreements absorbed the 2021 to 2022 shortage with far less disruption than smaller vendors reliant on spot-market component purchases, a resilience gap that persists today. Exposure also varies by product category: grid-edge sensing meters requiring more sophisticated processing chips face materially higher semiconductor cost sensitivity than basic communication-only meters, giving vendors with a broader product mix better insulation from component price swings.
power-metering-market-cost-volatility-analysis-1790007367848

Multi-Year Semiconductor Supply Agreements

Larger vendors are securing multi-year semiconductor supply commitments directly with major foundries, locking in guaranteed capacity allocation and stable pricing that shields them from spot-market volatility during industry-wide demand surges affecting the broader global chip supply chain, unlike smaller rivals that remain fully exposed to unpredictable spot pricing swings each and every single quarter.

Multi-Source Component Qualification Programs

Vendors are increasingly qualifying two or more chip suppliers for the very same metrology design specifically to avoid single-source dependency, a hard lesson drawn directly from the 2021 to 2022 shortage that left several meter vendors entirely unable to fulfill utility contracts on time and lost real business to competitors as a direct result.

Base Metal Hedging Contract Strategies

Vendors are increasingly using forward hedging contracts to lock in base metal pricing well ahead of actual need for enclosure and mechanical components, reducing exposure to commodity price volatility that has periodically and meaningfully compressed margins on the hardware side of the business over the past several years and continues doing so steadily today.

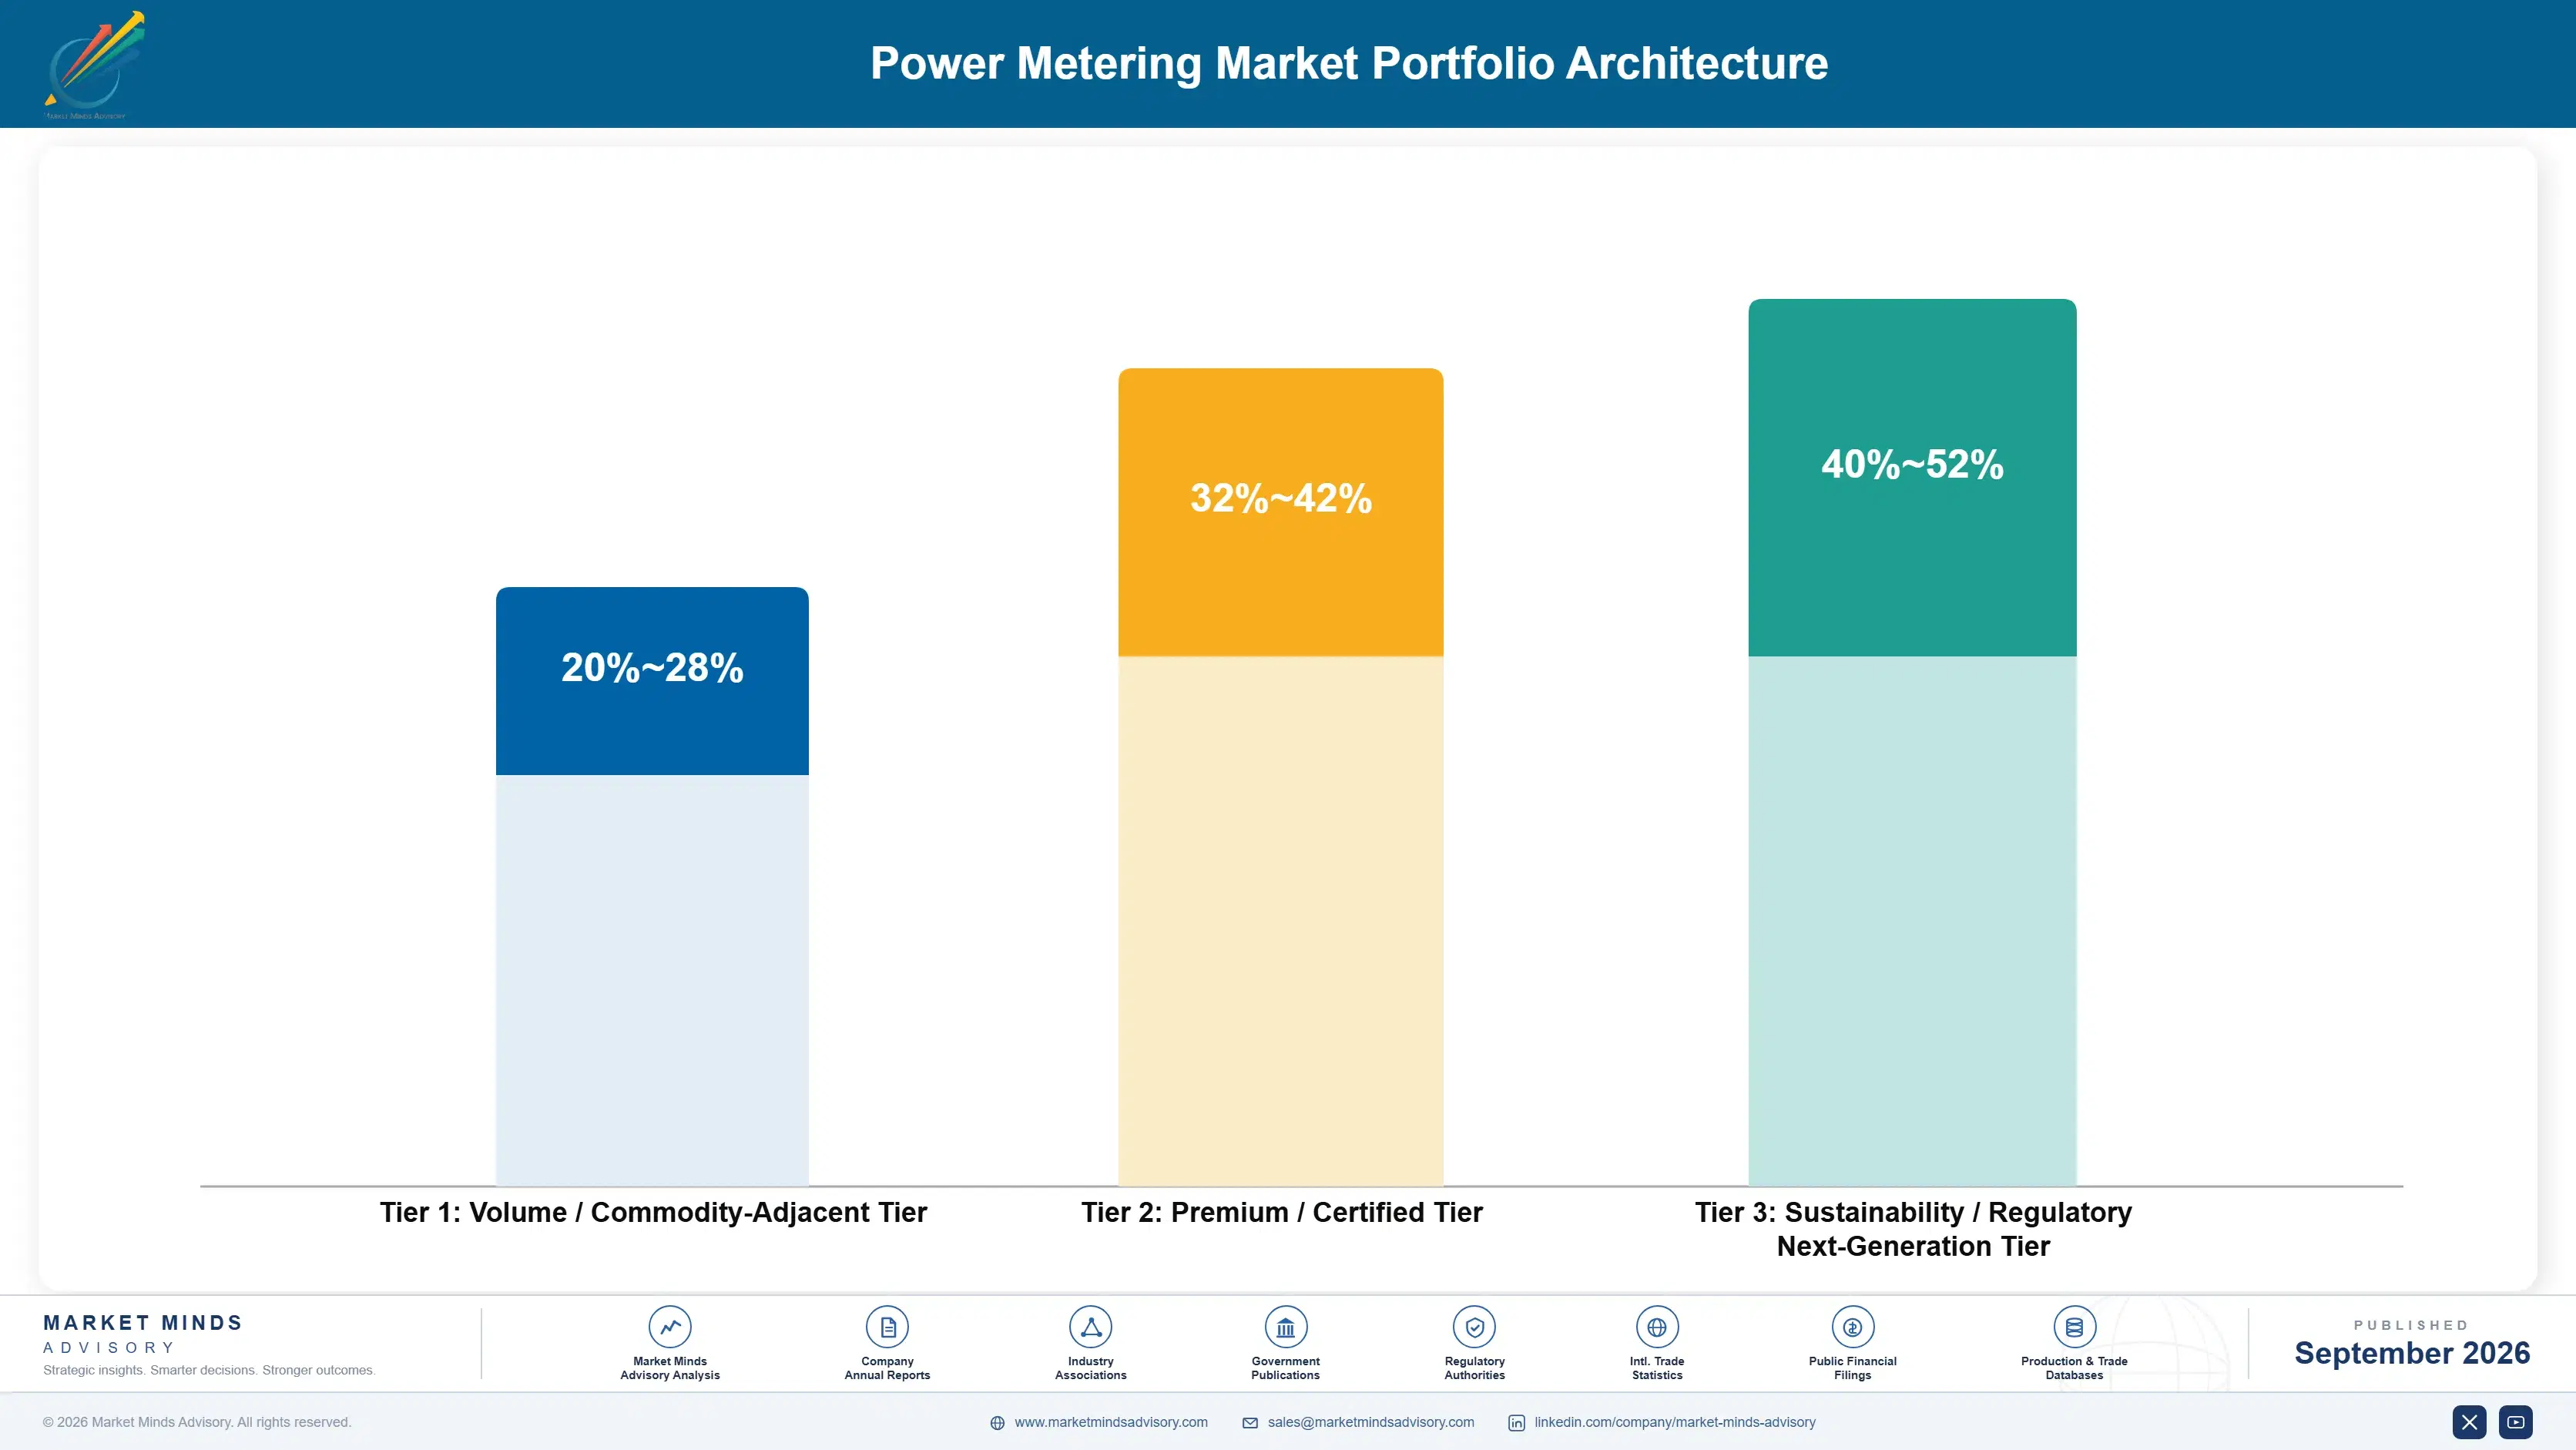
Portfolio Architecture for Margin Defence

Margin architecture in power metering splits sharply along sensing depth and software attachment. Basic communication-only meters hold gross margins around 20 to 28 percent as component cost pressure and utility procurement competition keep pricing tight. Grid-edge sensing meters and attached data management software hold materially higher margins, since documented outage detection accuracy and interval data depth create real switching costs utilities cannot easily walk away from once integrated.
The volume versus premium tension runs through the entire vendor base: hardware-focused suppliers scale on unit count but face relentless component price pressure, while software-attached vendors grow more slowly in unit terms but capture disproportionate revenue per meter. High-value margin pools concentrate almost entirely in grid-edge sensing and data management software rather than basic communication-only meters, and that concentration is where the strongest vendors now direct the bulk of new product investment.

Distributed energy resource driven demand, particularly grid-edge sensing capability utilities increasingly treat as essential infrastructure, is opening a genuinely new premium tier that smaller commodity-focused vendors struggle to enter quickly, since building regulatory certification credibility takes years of accumulated deployment evidence. Vendors positioned early in this category are compounding an advantage that hardware-only competitors will find increasingly hard to close.

Volume / Commodity-Adjacent Tier

Basic single-phase communication-only meters sold at high volume into residential replacement cycles, competing almost entirely on unit price against semiconductor component cost pressure with very limited room for meaningful differentiation.
Gross Margin: 20-28%

Premium / Certified Tier

Three-phase commercial meters and standard advanced metering infrastructure carrying utility regulatory certification, where established procurement relationships and certification credibility give incumbent vendors durable pricing power over most much newer entrants.
Gross Margin: 32-42%

Sustainability / Regulatory / Next-Generation Tier

Grid-edge sensing meters and attached data management software tied to distributed energy resource management programs, the fastest-compounding and highest-margin tier as utilities increasingly treat sensing capability as essential grid infrastructure.
Gross Margin: 40-52%
power-metering-market-portfolio-architecture-1790007368353

High-value Sub-segments and Strategic Watch-out

Grid-Edge Sensing and Outage Detection Meters

The highest-value, fastest-growing pool in the market, converting a standard billing device into essential real-time grid infrastructure as distributed energy resource penetration continues accelerating across most major utility territories tracked closely in this report, a trend MMA expects to persist well through 2036 and beyond.
Gross Margin: 40-52%

Meter Data Management Software

High-value and growing steadily as utilities need increasingly sophisticated analytics to process larger interval data volumes generated by modern meters across their territories, though building the regulatory certification credibility required to compete takes years for newer software-first entrants without established reference deployments to establish credibly.
Gross Margin: 40-52%

Advanced Metering Infrastructure Two-Way Communication

The volume core of the market, generating the bulk of installed deployments as the most widely adopted product category available today across most major utility markets, but facing steady margin normalization as this category matures across most established utility replacement cycles negotiated each passing year nationwide.
Gross Margin: 32-42%

Cloud-Native Grid Analytics Software Entrants

The clearest strategic watch-out for traditional metering hardware vendors, as enterprise software companies build grid analytics capability that threatens to capture the highest-margin data layer independent of any specific metering hardware platform that vendors currently run, support, and continue actively selling into the broader market.
Gross Margin: n/a

Why Power Metering Revenue Compounds

Power metering revenue increasingly behaves like an annuity business in its software-attached segments rather than a one-time hardware sale. Once a utility embeds a meter data management platform into billing and grid operations workflow, switching costs rise sharply, and renewal rates for enterprise metering software contracts now commonly exceed 80 percent, turning what used to be a capital equipment purchase into a durable, multi-year relationship.
Adoption depth varies significantly by end-use vertical. Investor-owned utilities show the deepest stickiness, since large-scale deployments require years of integration work that neither party wants to redo without strong cause. Distributed energy resource operators run nearly as sticky, tied to interval data feeds rarely redesigned once established, while smaller municipal utilities remain more transactional and show comparatively less loyalty to any single meter vendor.

Buyer profiles are shifting generationally as well. Younger utility engineers entering the workforce now expect real-time grid visibility as a baseline expectation rather than a novel feature, while procurement has moved from pure billing accuracy evaluation toward grid modernization and resilience planning teams, who evaluate vendors on sensing capability rather than unit price alone. This buyer shift is steadily raising the evidentiary bar every vendor must clear.
power-metering-market-end-use-penetration-index-1790007368844

Where Power Metering Value Concentrates

These are among the four positions where our research anticipates prominent divergence between winners and laggards over the coming forecast period. Each is grounded in the demand model, the regulatory perimeter, and the announced capacity pipeline.
01 / GRID-EDGE SENSING INVESTMENT

Build autonomous outage detection capability into every meter product line

Utilities increasingly treat grid-edge sensing as essential infrastructure rather than an optional upgrade, and vendors without this capability are losing replacement cycle contracts to competitors who can demonstrate documented outage detection accuracy above 90 percent consistently. Building this sensing capability requires meaningful engineering investment, meaning vendors that start now hold a genuine head start over slower-moving competitors still relying on standard two-way communication meters alone. This capability is becoming the clearest differentiator separating premium vendors from commodity hardware suppliers industry-wide today.
02 / SOFTWARE ATTACHMENT GROWTH

Prioritize data management software attachment over standalone hardware sales

Itron and Landis+Gyr's success in achieving software attachment rates above 60 percent demonstrates that recurring subscription revenue now matters more than one-time hardware sales for durable vendor economics going forward across the industry. Vendors selling meters without an attached software platform are converting a durable, multi-year customer relationship into a purely transactional hardware sale with no recurring revenue upside whatsoever to speak of. Building genuine software capability now, before competitors close the gap, protects margin against continued hardware commoditization pressure.
03 / REGULATORY SUPPORT SERVICES

Offer rate case support services to accelerate utility procurement decisions

Metering capital expenditure typically requires regulatory rate case approval before utilities can recover costs, and this approval process regularly extends procurement timelines by twelve to eighteen months across most regulated jurisdictions nationwide. Vendors offering pre-packaged cost justification data and regulatory filing support are closing enterprise deals meaningfully faster than competitors leaving all regulatory navigation entirely to the utility's own limited internal team to manage alone. Building this capability now positions vendors well ahead of slower-moving competitors still relying on generic sales pitches.
04 / SUPPLY CHAIN DIVERSIFICATION

Diversify semiconductor sourcing before the next capacity cycle turns

The 2021 to 2022 semiconductor shortage exposed how exposed vendors without diversified, multi-sourced component supply chains were to capacity reallocation toward higher-margin automotive and consumer electronics categories, a risk that has not disappeared even though the acute shortage has passed. Multi-source qualification and longer-term capacity agreements are the clearest defenses against a repeat scenario, and larger vendors have already moved decisively on both fronts while many smaller vendors remain exposed to spot-market volatility. Building this resilience now is materially cheaper than reacting during a genuine shortage.

Engagement Snapshot From the Field

A live engagement with an industry participant carrying material or product regulatory and market exposure ahead of a defining policy shift, showing how our research translates into a defensible multi-year portfolio strategy.
MARKET MINDS ADVISORY · CLIENT ENGAGEMENT SUMMARY
Power Metering Producer Strategic Portfolio Review and Transition Roadmap 2026·Investment Scenario on Power Metering Exposure Evaluation 2025-26
CLIENT PROFILE
A regional electric utility serving roughly 1.2 million customers across a Midwestern service territory engaged MMA to evaluate power metering vendors ahead of a first-generation smart meter fleet replacement program. The client's original deployment, installed under federal stimulus incentives fifteen years earlier, was approaching end of service life and needed to be replaced with grid-edge sensing capable infrastructure.
STRATEGIC CHALLENGE
Leadership needed to replace the aging fleet without disrupting billing operations for 1.2 million active customer accounts while securing regulatory rate case approval for the substantial capital expenditure required. Rising distributed solar interconnection requests across the service territory added urgency, since existing meters could not support the real-time visibility distributed generation increasingly required.
MMA APPROACH
MMA benchmarked five candidate meter vendors against a weighted scorecard covering grid-edge sensing capability, documented outage detection accuracy, rate case support services, and total cost of ownership over a fifteen-year deployment horizon. The team conducted structured interviews with each vendor's regulatory affairs team and cross-referenced disclosed client references against MMA's primary survey dataset covering comparable regional utility deployments.
KEY FINDINGS
  1. The lowest-priced meter hardware ranked last once software licensing costs and rate case support value were fully factored into the fifteen-year total cost of ownership scoring.
  2. Vendors with dedicated rate case support services cut projected regulatory approval timelines by roughly five months compared with vendors offering no comparable regulatory support.
  3. Documented outage detection accuracy varied significantly across candidate vendors, directly affecting projected customer service improvement and regulatory commission satisfaction with the program.
  4. Phased territory rollout sequencing, prioritizing highest-density urban areas first, secured meaningful vendor financing terms that a simultaneous full territory rollout could not have negotiated.
CLIENT PROFILE
A regional electric utility serving roughly 1.2 million customers across a Midwestern service territory engaged MMA to evaluate power metering vendors ahead of a first-generation smart meter fleet replacement program. The client's original deployment, installed under federal stimulus incentives fifteen years earlier, was approaching end of service life and needed to be replaced with grid-edge sensing capable infrastructure.
STRATEGIC CHALLENGE
Leadership needed to replace the aging fleet without disrupting billing operations for 1.2 million active customer accounts while securing regulatory rate case approval for the substantial capital expenditure required. Rising distributed solar interconnection requests across the service territory added urgency, since existing meters could not support the real-time visibility distributed generation increasingly required.
MMA APPROACH
MMA benchmarked five candidate meter vendors against a weighted scorecard covering grid-edge sensing capability, documented outage detection accuracy, rate case support services, and total cost of ownership over a fifteen-year deployment horizon. The team conducted structured interviews with each vendor's regulatory affairs team and cross-referenced disclosed client references against MMA's primary survey dataset covering comparable regional utility deployments.
KEY FINDINGS
  1. The lowest-priced meter hardware ranked last once software licensing costs and rate case support value were fully factored into the fifteen-year total cost of ownership scoring.
  2. Vendors with dedicated rate case support services cut projected regulatory approval timelines by roughly five months compared with vendors offering no comparable regulatory support.
  3. Documented outage detection accuracy varied significantly across candidate vendors, directly affecting projected customer service improvement and regulatory commission satisfaction with the program.
  4. Phased territory rollout sequencing, prioritizing highest-density urban areas first, secured meaningful vendor financing terms that a simultaneous full territory rollout could not have negotiated.
RECOMMENDED STRATEGY
Phase 1: Phase one replaced meters across the highest-density urban service areas and secured regulatory rate case approval within the first year. Phase 2: Phase two extended replacement to suburban and rural service areas over an eighteen-month rollout window with dedicated vendor field support. Phase 3: Phase three completed fleet replacement territory-wide and launched a distributed energy resource management program using the new interval data collected.
OUTCOME
The utility reported a 31 percent reduction in average outage detection time within the first year following deployment, alongside a 22 percent increase in distributed solar interconnection processing speed across the territory (client-reported, unverified by MMA). Customer satisfaction scores related to outage communication improved measurably following the rollout.

Frequently Asked Questions

Foundational context covering the market sizes, CAGR, scope, country, region and competition that inform every finding below. This section is provided to cover basics and most often pre-purchase conversations, answered from the MMA Primary Research Dataset.

What is the current size of the Power Metering Market?

The global power metering market reached 28.6 billion dollars in 2025. Growth is concentrated in grid-edge sensing meters rather than standard two-way communication devices alone.

How large will the Power Metering Market be by 2036?

MMA projects the market will reach 68.07 billion dollars by 2036, up from 30.95 billion dollars in 2026. That represents a 2.20 times expansion over the ten-year forecast window.

What is the CAGR for the Power Metering Market 2026 to 2036?

The base case compound annual growth rate is 8.2 percent. MMA's bull scenario projects 9.5 percent, while the bear scenario projects 7.0 percent over the same forecast period.

Which segment is growing fastest?

Grid-Edge Sensing and Outage Detection Meters is the fastest-growing segment at a 12.4 percent CAGR, roughly 1.51 times the overall market rate, driven by distributed energy resource growth.

Who are the major companies in the Power Metering Market?

Landis+Gyr, Itron, Honeywell, Sensus, and Kamstrup lead the competitive landscape. The top five hold roughly 48 percent of global category revenue combined across all products.

Which country is growing fastest?

India leads country-level growth at a 11.6 percent CAGR, helped by a massive national smart metering program targeting hundreds of millions of household connections nationwide.

Report Segmentation Architecture

The full report scope spans multiple orthogonal segmentation dimensions, with cross-tabulated demand data provided for each dimension pair. Coverage extends further to regional breakdowns, trend trajectories, and the competitive detail needed to support segment-level decision-making.

By Product Type

  • Single-Phase Residential Meters
  • Three-Phase Commercial and Industrial Meters
  • Grid-Edge Sensing and Outage Detection Meters
  • Water and Gas Metering Hardware
  • Meter Data Management Software

By End-Use Industry

  • Investor-Owned Utilities
  • Municipal and Cooperative Utilities
  • Commercial and Industrial Facilities
  • Distributed Energy Resource Operators
  • Government and Public Infrastructure

By Commercial Dimension

  • Direct Utility Procurement
  • Meter-as-a-Service Financing
  • Systems Integrator Channel
  • Regulatory Rate Case Recovery
  • Multi-Utility Framework Agreements

By Region

  • East Asia
  • Western Europe
  • North America
  • South Asia and Pacific
  • Latin America
  • Middle East and Africa
  • Eastern Europe

Scope, Methodology, and Coverage

Every figure in this report is reproducible from documented input assumptions. The scope below maps the historical period, the forecast horizon, the segmentation dimensions, and the countries covered, alongside the underlying primary and qualitative methodology.
Historical Period
2020 to 2025
Forecast Period
2026 to 2036
Base Year
2025 (USD billions; MMA Primary Research Dataset, September 2026)
Market Definition
The power metering market covers hardware and software used to measure, communicate, and manage electricity consumption and grid conditions at the point of connection, including advanced metering infrastructure and grid-edge sensing devices. It excludes generation and transmission monitoring equipment not tied to point-of-connection metering, and generic building energy management software sold without a metering hardware link.
Quantitative Units
USD Billion
Segmentation Dimensions
By Product Type, By End-Use Industry, By Commercial Dimension, By Region
Regions Covered
East Asia, Western Europe, North America, South Asia and Pacific, Latin America, Middle East and Africa, Eastern Europe
Countries Covered
United States, China, Germany, Japan, India, United Kingdom, Brazil, Saudi Arabia, Poland, South Korea
Key Companies Profiled
Landis+Gyr Group AG, Itron Inc, Honeywell International Inc, Sensus USA Inc, Kamstrup A/S, Aclara Technologies LLC, Wasion Group Holdings Limited, Ningbo Sanxing Electric Co Ltd, Holley Technology Ltd, Iskraemeco doo, Elster Group GmbH, Diehl Metering GmbH, Genus Power Infrastructures Limited, Secure Meters Limited, Apator SA, EDMI Limited, Zenner International GmbH, Chint Group Co Ltd, L and G Corporation, Contact Metering Group Limited
Quantitative Methodology
Primary survey, n=3,800 respondents, Q4 2025, six countries; demand-side model with trade association cross-validation
Qualitative Methodology
47 expert interviews, Q4 2025; applied to validate demand model assumptions, identify emerging dynamics, and assess competitive positioning
Report Format
PDF and XLSX data workbook (Word format preview document)
Publisher
Market Minds Advisory
Report Code
MMA-2026-ENE-405
Published
September 2026
Contact
sales@marketmindsadvisory.com | www.marketmindsadvisory.com

Purchase the full Power Metering Market Report (2026 to 2036).

This report provides a comprehensive analysis of the global power metering market, covering historical performance from 2020 to 2025 and a detailed forecast through 2036. It examines segmentation by product type, end-use industry, and commercial model, alongside regional demand dynamics across all seven MMA-tracked geographies. The analysis includes competitive benchmarking of twenty leading vendors, input cost exposure, portfolio margin architecture, and strategic recommendations grounded in primary survey data. Findings draw on MMA's proprietary quantitative survey and expert interview programs conducted in the fourth quarter of 2025.
Segment-level revenue forecasts through the year 2036
Competitive benchmarking of twenty leading market vendors
Regional demand analysis across all seven geographies
Input cost exposure and mitigation strategy review
Portfolio margin architecture and pricing tier analysis
Strategic verdict with actionable commercial recommendations included

Built For The People Who Decide

From boardroom strategy to bench-side execution, this report is read cover-to-cover by leaders shaping the next decade of their industry, turning demand scenarios, market dynamics and valuation benchmarks into decisions.
CXOs/ Presidents/ VPs/ Managers
M&A and Corporate Development
Strategy Teams and R&D Heads
Procurement and Product Directors
Regulatory and Compliance Leaders
Investor Relations and Equity Analysts