Market Minds Advisory
Powdered Beverage Market

Powdered Beverage Market: Functional Reformulation and Retail Listing Analysis 2026 to 2036

Powdered beverage manufacturers are scaling protein and electrolyte drink mix capacity as fitness-focused consumers demand documented functional claims, while sugar-reduction pressure on legacy coffee and flavored-water powders is reshaping which brands qualify for premium placement.

Lead Analyst

Lisa Gevelber

Published

September 2026

Make Smarter Decisions with Customized Research Insights

Request a free sample report and evaluate market opportunities, growth trends, and competitive dynamics relevant to your business needs.

2025 MARKET VALUE$24.0BMarket Size 2025
2036 FORECAST VALUE$47.5BBase Case , 2026 to 2036
CAGR 2026 TO 20366.4 %Bull 7.7% / Bear 5.1%
INCREMENTAL OPPORTUNITY$21.9BNet 10- year value creation
EXPANSION MULTIPLE1.86x2036 value over 2026 base
Strategic Levers
M&A Pipeline
Regional Outlook
Country Rankings
Competitive Intelligence
Segmental Deep-dive
Call-Us : 91 93563 13602

Executive Snapshot and Market Trajectory

Powdered beverage demand is shifting toward protein and electrolyte drink mixes, as fitness-focused consumers and retailers increasingly require documented functional claims and clean-label compliance data that conventional sweetened coffee and tea powders cannot supply, pushing manufacturers to invest in formulation and quality capability that smaller regional brands cannot easily fund.
Protein and meal replacement powders and flavored water enhancers capture the fastest growth as fitness-focused consumers and specialty retailers increasingly require documented functional claims before approving new listing contracts. North America leads demand given its concentration of sports nutrition brand density and instant coffee consumption volume, supplying roughly three in ten units sold, while South Asia and Pacific grows fastest as expanding retail distribution and awareness broaden powdered beverage demand beyond mature developed-market replacement volume.
Competitive intensity centers on five manufacturers holding roughly a third of unit volume, most having built franchises through formulation depth and retailer relationships. Documented functional claims and clean-label performance separate manufacturers positioned for premium specialty-retail contracts from competitors dependent on conventional sweetened-only configurations. Protein and hydration formats are opening a smaller but fast-growing niche that established coffee and tea manufacturers are only beginning to pursue.
Market Definition
This report covers powdered and instant beverage mixes reconstituted with water or other liquids for consumption, including powdered coffee and coffee mix products, powdered tea and tea mix products, powdered sports and electrolyte drink mixes, powdered protein and meal replacement beverages, powdered flavored water enhancers and drink mixes, and powdered beverage processing equipment and services. It excludes ready-to-drink liquid beverages and finished dairy-based powders sold as infant formula. Scope covers global sales revenue of powdered beverage products sold through retail and foodservice channels.
Base Year Value
$24.0B in 2025 (MMA Primary Research Dataset, August 2026)
Forecast Period
2026 to 2036, eleven discrete annual values
CAGR
6.4% base case. Bull 7.7%. Bear 5.1%.
Fastest Growth Segment
Powdered Protein and Meal Replacement Beverages: 10.8% CAGR
Fastest Growth Country
Mexico: 9.4% CAGR
Fastest Growth Region
South Asia and Pacific: 8.4% CAGR
Largest Region
North America: 31% of 2025 global value
Market Leaders
Nestlé, PepsiCo, The Coca-Cola Company, Mondelez International, and Glanbia. Source: MMA Analysis based on company annual reports and investor filings.
Primary Survey
n=3,800 procurement and R&D decision-makers, Q4 2025, six countries
Methodology
Demand-side build-up, cross-validated against public data, 47 expert interviews

Powdered Beverage Market Forecast Scenarios

powdered-beverage-market-trends-size-forecast-scenario-1787335512830
Powdered beverage demand grew through 2020 and 2021 as pandemic-driven at-home consumption accelerated instant coffee and drink mix purchasing, then moderated through 2022 and 2023 as retailers absorbed elevated inventory before accelerating on sports nutrition reformulation. Shipments grew at a 5.8% historical rate, with protein powder formats accelerating fastest as consumers sought documented functional claims. This shift has accelerated since 2023.
The base case assumes 6.4% growth through 2036, anchored by three mechanisms. First, expanding sports nutrition reformulation is pulling demand toward protein and electrolyte drink mixes and away from standard sweetened-only formats that dominated pre-wellness-era supply. Second, growing specialty retailer differentiation is expanding selling price as brands prefer documented functional claims over coffee and tea powders. Third, expanding flavored water enhancer capacity across emerging markets is broadening the addressable base beyond the coffee-only demand that dominated powdered beverage volume.
The bull case rests on faster sports nutrition adoption and accelerated flavored water enhancer expansion, which could pull forward premium beverage demand and push growth toward 7.7%. The bear case centers on retailer budget discipline: if brand owners delay ingredient capital spending amid cost tightening, orders could soften and drag growth toward 5.1% as brands extend existing coffee protocols instead.

Functional Reformulation and Retail Listing Economics

Powdered beverage demand sits at the intersection of two forces: a functional reformulation shift that keeps pulling fitness-focused consumers and specialty retailers from standard sweetened-only formats toward documented protein and traceability-integrated formats faster than conventional manufacturers were designed to convert, and a clean-label scrutiny expansion that pulls demand into electrolyte-sourced formats previously served by standard sugar-only infrastructure. Manufacturers that invest in formulation engineering and documented functional data early capture a retailer trust advantage over competitors dependent on conventional sweetened-only product lines.
CR5 CONCENTRATION34%Top five manufacturers hold roughly a third of units
AVERAGE UNIT PRICE$0.42 per servingProtein and electrolyte formats command a premium over coffee
TOP PRODUCING COUNTRY SHARE24%United States accounts for the largest single manufacturing share
FUNCTIONAL CLAIM COMPLIANCE RATE51%Share of shipments meeting documented functional labeling specifications
PROTEIN POWDER ADOPTION RATE19%Volume using functional protein formulation rather than sweetened processing
SPORTS NUTRITION COST SHARE23%Share of volume from sports nutrition and hydration applications
Commercial character is defined by functionality-driven procurement: manufacturers with strong formulation depth and retailer validation reach capture disproportionate customer trust as purchasing decisions standardize around beverages proven against documented functional benchmarks. Standard sweetened-only products remain a large but slower-growing volume base, priced across established distribution channels, while protein and electrolyte platforms command premium pricing tied to functional data smaller entrants struggle to match.
Over the next decade, expect procurement to keep consolidating around manufacturers with proven formulation and documented functional capability, rewarding early movers in engineering investment. Consolidation among smaller sweetened-only manufacturers is likely as reformulation conversion costs outpace what niche vendors can fund alone across most retailer markets.
"Nobody wants a powder that just makes water taste like sugar anymore, they want a documented functional claim they can put on the front of the pouch. That's a completely different formulation standard than the industry was built for."
Director, Beverage Innovation and Functional Nutrition Practice · MMA Functional and Instant Beverage Formats Practice · August 2026

Market Trends

Protein Powder Enters Mainstream Retail Distribution

Specialty retailers are increasingly requiring protein-fortified powdered beverages that support documented functional claims, beyond what conventional sweetened-only mixes historically provided. Manufacturers have expanded protein formulation and blending capability significantly over the past several years, and grocery retailers increasingly specify protein-fortified powders by default when producing premium or fitness-focused product lines. Major powdered beverage manufacturers report protein adoption now covers close to a fifth of premium volume, up sharply from a small base less than a decade ago. This shift has accelerated markedly since 2023. This pattern is strengthening across most fitness markets.
Market Impact: Adds 1,200 new retailer listings
Electrolyte Hydration Formulation Reshapes Purity Standards

Consumers are increasingly requiring documented electrolyte formulation data that withstands scrutiny at retailer listing approval, rather than the general sweetened-mix testing that historically anchored powdered beverage quality claims. Manufacturers have expanded electrolyte formulation and documentation capability significantly over the past two years, letting brands specify functional-grade beverages without requiring the separate testing processes that slowed approval historically. Premium hydration programs report the fastest uptake, since documented functional data removes the retailer rejection risk that limited shelf access. Several major manufacturers expanded formulation laboratory capacity further in late 2025. Adoption keeps rising.
Market Impact: Adds 11-18% ASP premium overall

Market Opportunities and Growth Drivers

Sports Nutrition Growth Broadens Protein Powder Demand

Expanding sports nutrition participation across developed and emerging markets is broadening the addressable protein powder base beyond the historically sweetened-only demand that relied on conventional coffee economics for limited-scope refreshment. Several major fitness associations have expanded nutrition guideline investment meaningfully across markets over the past few years, and each new guideline increasingly specifies protein powder alongside other functional beverage technology rather than standard coffee alone. Manufacturers that built strong retailer education and rapid-deployment support networks early are winning most new listings signed across the past two years. This pace keeps accelerating.
Market Impact: Limits broader adoption to 19 percent

Clean-Label Certification Sustains Brand Investment Confidence

Retail brand procurement decisions increasingly specify documented clean-label certification that conventional sweetened-only powders cannot always demonstrate without a supplementary formulation investment. Several major manufacturers have expanded certification scope meaningfully over the past several years, and each new beverage generation increasingly treats documented functionality as a retailer-trust compliance requirement rather than an optional add-on. Manufacturers with the strongest certification platforms are winning the large majority of new premium retailer contracts, since procurement teams treat documented functionality as a near-mandatory requirement across most premium categories nationwide today. This expectation keeps strengthening steadily.
Market Impact: Limits reformulation pace to 24 percent

Market Restraints and Challenges

Formulation Cost Limits Smaller Manufacturer Adoption

Functional formulation carries meaningfully higher cost than conventional sweetened-only manufacturing, putting full adoption out of reach for smaller manufacturers even where documented functional capability already justifies the premium in higher-volume settings. The root cause is that functional formulation requires specialized ingredient and testing investment that conventional coffee and tea manufacturers never needed to fund. This restricts adoption to well-funded beverage companies and established formulation networks even where functional reformulation offers clear retailer-listing advantages. Manufacturers mitigate the gap by pursuing co-manufacturing partnerships. This gap is widest across smaller regional manufacturers with limited capital budgets.
Market Impact: Lifts protein powder adoption to 19%

Ingredient Cost Volatility Slows Reformulation Pace

Powdered beverage adoption varies meaningfully across manufacturers, and the root cause is that whey protein and electrolyte mineral costs remain volatile across major sourcing regions without stable supply protocols. This restricts reformulation pace even where alternative sourcing already demonstrates measurable stability improvement over conventional sweetener-only supply. Manufacturers report ingredient volatility as their single largest constraint on expanding reformulation volume further. Manufacturers mitigate the gap by pursuing multi-supplier sourcing diversification. This gap is widest across smaller manufacturers with limited sourcing-diversification budgets. Manufacturers exporting into multiple regions absorb the largest sourcing burden each year.
Market Impact: Cuts retailer rejection incidents by 14%
4 additional market trends, 4 additional growth drivers, and 4 additional restraints and challenges are covered in the full report. Contact sales@marketmindsadvisory.com to access the complete intelligence.

Segment CAGR and Growth Architecture

Segmentation follows beverage product type, the primary driver of functional profile, flavor delivery, and price point across coffee, tea, sports, protein, water-enhancer, and equipment service formats. Powdered protein and meal replacement beverages and flavored water enhancers carry the fastest growth as retailers increasingly prioritize documented functional capability over the coffee products that dominated powdered beverage supply for decades.
powdered-beverage-market-trends-market-share-analysis-1787335513369

Powdered Protein and Meal Replacement Beverages

Powdered protein and meal replacement beverages are the fastest-growing segment as fitness-focused consumers increasingly require documented functional capability that conventional sweetened-only mixes alone cannot fully deliver given rising demand for muscle-recovery formulation and weight-management economics. Manufacturers have expanded protein formulation and blending capability significantly over the past two years, letting retailers select beverages with documented functional verification data rather than relying on sweetened-only assumptions under increasing consumer scrutiny. Premium fitness and meal-replacement programs report the fastest uptake among consumers where documented functional capability directly affects purchasing and repeat-buy decisions. Pricing carries a substantial premium over conventional coffee and tea powders, reflecting the formulation engineering and blending investment built into new protein product lines across most major markets today.
CAGR 10.8%

Powdered Flavored Water Enhancers and Drink Mixes

Flavored water enhancers rank second-fastest as hydration-focused consumers increasingly require documented functional validation that conventional sweetened-mix testing alone cannot provide without accredited laboratory support. Water enhancer formats give retailers a listing pathway that reduces reformulation risk while maintaining the flavor consistency that sweetened-only claims cannot always match, a capability increasingly valued as retailers scale hydration-adjacent volume across most grocery and specialty programs. Manufacturers report the fastest adoption among mid-size retailer categories where documented flavor accreditation directly affects shelf placement decisions. Average contract value is rising modestly as formulation platforms expand from basic sweetening to full-featured functional documentation support. Brand owners increasingly treat this accreditation as a baseline procurement requirement. Retailers value this consistently.
CAGR 9.6%
Full segment breakdown across 6 segments available in the complete report.

Regional Architecture and Country Demand Map

Demand concentrates where sports nutrition brand density and instant coffee consumption volume diverge most sharply. North America leads on its concentration of sports nutrition brand activity, East Asia follows on established beverage manufacturing capacity, and South Asia and Pacific posts the fastest growth as expanding retail distribution broadens demand.

North America

The United States' concentration of sports nutrition brand density and instant coffee consumption volume anchors North American demand, as retailers standardize purchasing around protein and traceability-integrated formats ahead of most other regions given sophisticated fitness retail infrastructure and favorable consumer wellness trends. Major brands are converting sweetened-only installed bases into protein and electrolyte product lines, replacing conventional sugar-based formulations with documented functional recipes. Specialty retailer network expansion adds a second demand pool, since fitness programs increasingly incorporate functional powders into broader wellness standardization programs. Distributors report growing interest in formulation service bundles, since retailer procurement committees increasingly require documented functional accreditation before approving new product listings. Canadian brands show a similar conversion trajectory across most secondary markets.
Share: 31% | CAGR: 7.1% (2026 to 2036)

East Asia

China's concentration of beverage manufacturing capacity anchors East Asian demand, as the region's processing scale gives regional manufacturers cost advantages that few competitors can match ahead of most other markets. Chinese manufacturers are scaling standardized formulation protocols that increasingly meet export-market functional requirements, a manufacturing practice pattern more established than in most other regions. South Korean and Japanese manufacturers maintain sophisticated protein-powder adoption patterns closer to premium fitness practice, contributing a fast-growing demand pool distinct from China's manufacturing-driven export base. Southeast Asian beverage manufacturing infrastructure is expanding steadily as regional consumer investment grows, adding a further demand pool across newly built formulation facilities. Taiwan follows a similar adoption trajectory. Adoption continues steadily.
Share: 23% | CAGR: 7.4% (2026 to 2036)
Regional intelligence for 5 additional markets available in the complete report: Western Europe, South Asia and Pacific, Latin America, Middle East and Africa, Eastern Europe. Contact sales@marketmindsadvisory.com.
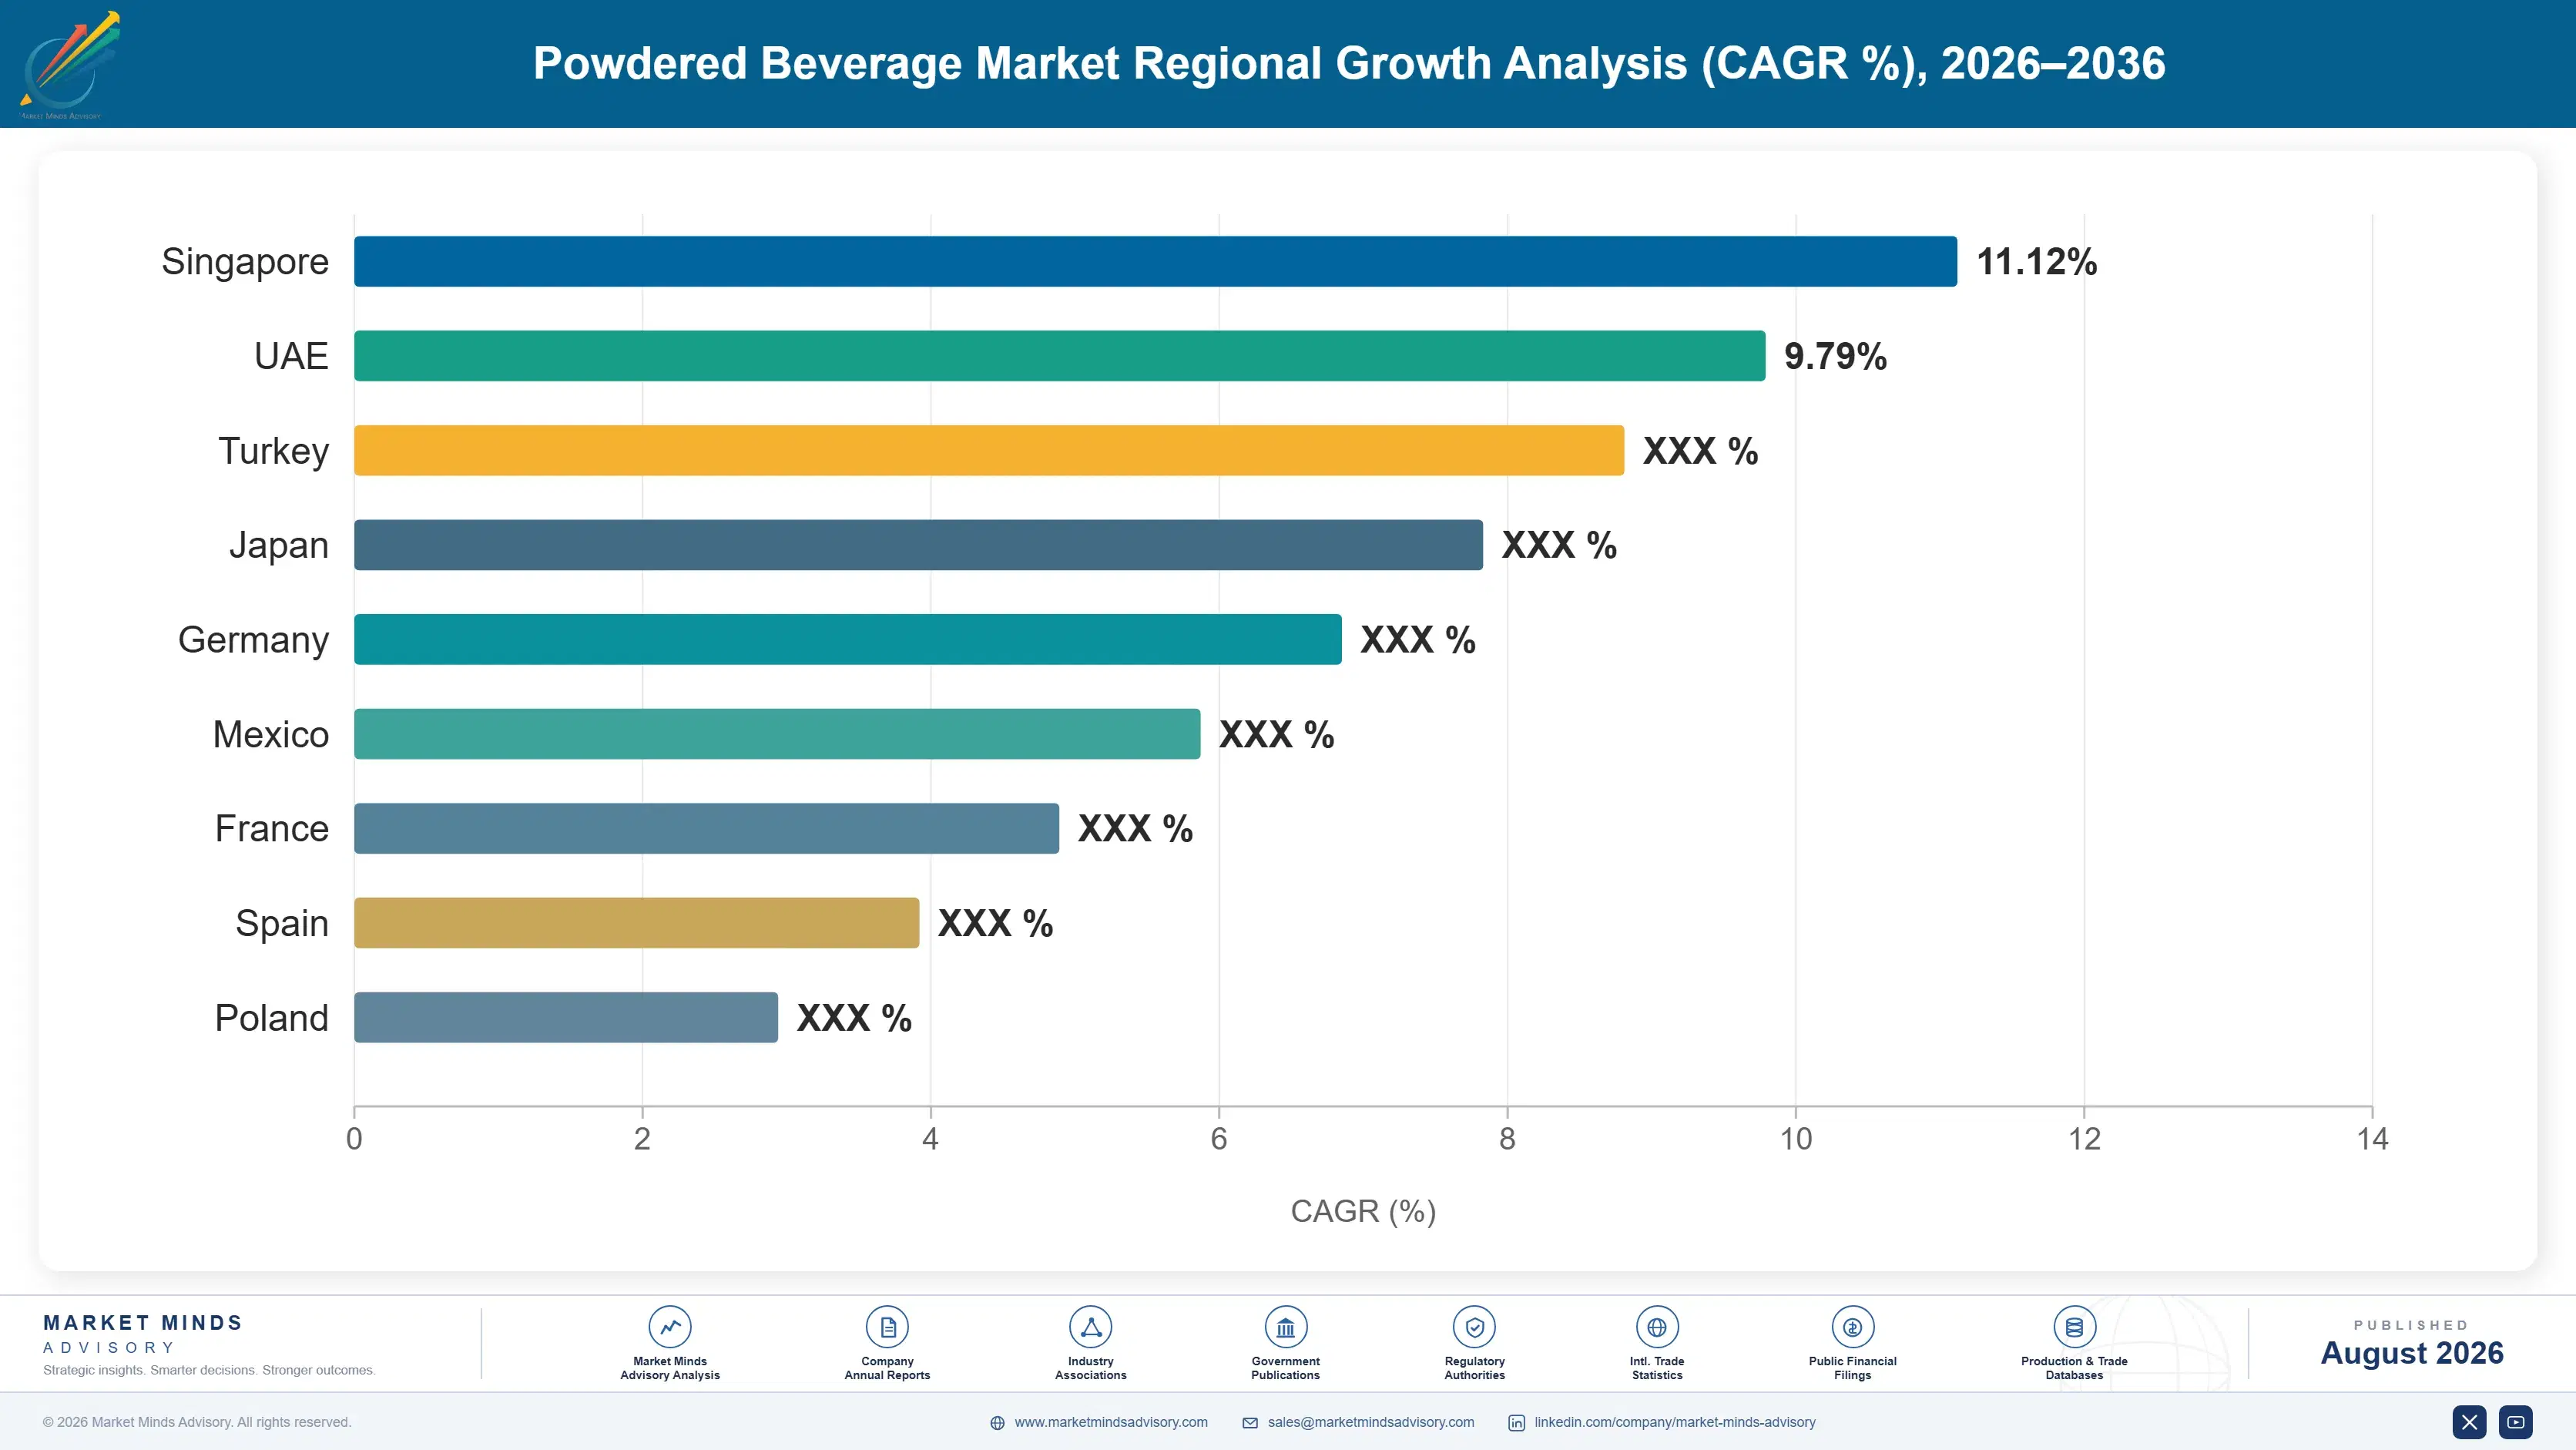
powdered-beverage-market-trends-country-cagr-analysis-1787335513878

Where Powdered Beverage Manufacturers Can Expand Margin

Powdered beverage manufacturers face a choice: compete on price for commodity sweetened mixes, or build defensible margin through formulation engineering leadership, clean-label certification depth, and retailer contracting reach. The levers below clearly identify where manufacturers are converting the functionality-driven demand shift into durable pricing power rather than treating powdered beverages as an undifferentiated commodity further.

Lead Formulation Engineering Ahead of Demand

Manufacturers that develop and validate formulation engineering 12 to 18 months ahead of major retailer purchasing cycles win first access to premium listing placement before competitors catch up, since retailer procurement decisions typically finalize product selection a year or more before contract renewal dates. Early engineering leadership also lets manufacturers charge an 11 to 18 percent premium over conventional sweetened mixes, since documented functional capability directly reduces retailer inventory exposure and delisting risk. Manufacturers that under-invested in formulation engineering during the prior demand cycle are now losing retailer listings to competitors with proven validated platforms.
Market Impact: Captures an 11-18% price premium each listing cycle

Expand Clean-Label Certification and Traceability Capability

Dedicated clean-label certification and traceability programs that document actual formulation verification and long-term supply-chain reliability convert a commodity sweetened relationship into a differentiated trusted platform worth roughly 10 to 17 percent more per unit than standard sweetened-grade alternatives. Retail and fitness brands increasingly require documented functional data as a purchasing condition, since undocumented formulation gaps create reputational exposure that quality teams actively scrutinize during supplier review. Manufacturers that invest in certification capability early are converting standard sweetened volume into premium functional relationships that competitors without comparable capability cannot easily replicate. This advantage compounds further as regulatory scrutiny increases.
Market Impact: Adds a 10-17% premium for certified-functional beverages sold

Expand Emerging-Market Retail Distribution Reach Fast

Building dedicated retailer education and consumer training capability across South Asia and Latin America, rather than treating those markets as a secondary outlet for developed-market beverage export surplus, captures a demand pool growing roughly 19 percent even as developed-market volume growth moderates. Beverage manufacturers in expanding retail markets increasingly favor formulators with established local training and compliance support, since functional reliability and local regulatory alignment outweigh brand recognition for budget-constrained procurement decisions. Manufacturers committed to this distribution depth are capturing multi-year retailer relationships that competitors focused on developed markets cannot easily replicate without local investment.
Market Impact: Captures an emerging-market segment growing 19 percent yearly

Expand Manufacturing Precision and Formulation Quality Systems

Building dedicated high-precision formulation and quality control capability, rather than requiring manual calibration and inspection between production runs, lifts average retailer contract retention by roughly 14 percent through the functional consistency reliability that manual processes cannot deliver. Retailers increasingly favor manufacturers who can support consistent beverage performance directly, since inconsistent products translate into the functional-failure incidents that quality teams actively work to avoid. Manufacturers already committed to this precision investment are winning multi-year retailer agreements with major fitness networks ahead of manual-process competitors. This advantage compounds further as retailer network consolidation continues nationwide overall.
Market Impact: Lifts average retailer contract retention by 14 percent

Who Controls the Margin Pool

The top five manufacturers, Nestlé, PepsiCo, The Coca-Cola Company, Mondelez International, and Glanbia, hold roughly thirty-four percent of unit volume, leaving a fragmented tail of regional and specialized manufacturers to compete for the remainder. The gap between the leading two manufacturers and the next tier is widening as formulation engineering costs outpace what smaller manufacturers can currently justify funding.
Current activity centers on three fronts: formulation engineering development aimed at retailer purchasing cycles, clean-label certification expansion aimed at capturing functionality-driven demand, and emerging-market distribution capability aimed at capturing retail growth ahead of undertrained competitors. Swiss and American manufacturers are also expanding export capacity as domestic production scales past what local emerging-market demand alone can absorb.

Emerging pressure comes from two directions. Well-funded protein specialists with strong formulation and blending capability are gaining retailer share from diversified coffee-focused manufacturers slower to build documented functional technology. At the premium end, hydration specialists with strong regulatory consulting relationships are winning large multi-country distribution contracts that established coffee-focused manufacturers have historically held, and rankings among the top ten manufacturers could shift within three to four years if that trend continues.
powdered-beverage-market-trends-company-positioning-matrix-1787335514398

Competitive Moat and Risk Dimensions

NESTLÉ

Moat: Broad Formulation Manufacturing Scale

Nestlé's decades of formulation manufacturing scale and retailer distribution relationships give the company a product portfolio spanning conventional through fully-protein-integrated formats that few competitors can match in breadth. That scale lets the company fund formulation engineering and clean-label certification investment that smaller specialized manufacturers cannot service alone.
NESTLÉ

Risk: Slower Niche Hydration Innovation Pace

Nestlé's broad formulation portfolio approach means specialized hydration innovation moves more slowly than at focused hydration-technology competitors, a gap that specialized providers could exploit as retailers increasingly favor deep application-specific expertise over general formulation breadth. Competitors that built dedicated hydration capability earlier are capturing premium retailer placement faster than the company's broader model currently allows.
PEPSICO

Moat: Deep Sports Nutrition Engineering Expertise

PepsiCo built sports nutrition engineering expertise over years that translates directly into retailer trust few generalist competitors can replicate quickly. That engineering depth lets the company win high-volume functionality-driven decisions based on documented formulation reliability, positioning it well for the segment of demand prioritizing sports specialization over broad formulation portfolio breadth.
PEPSICO

Risk: Narrower Emerging-Market Distribution Reach

PepsiCo's comparatively narrow emerging-market distribution reach limits its ability to offer expanding retail customers a fully local training support relationship spanning beverage and certification service categories in a single procurement relationship. As retailers increasingly prefer integrated vendor relationships, this narrower reach could become a bigger competitive disadvantage than it represents today.

Players Tracked

Prominent Players

Nestlé
PepsiCo
The Coca-Cola Company
Mondelez International
Glanbia

Other Key Players

Unilever
Herbalife Nutrition
Post Holdings
Abbott Laboratories
Danone
GNC Holdings
MusclePharm
BellRing Brands
Vital Proteins
Nuun
Liquid I.V.
Orgain
AJE Group
Jumex
Britvic

Recent Developments

MARCH 2025

Nestlé Expands Formulation Engineering Manufacturing Capacity

Nestlé expanded manufacturing capacity for its existing protein powder product line, adding capability aimed at retailers specifying documented functional claims for procurement decisions. The move is an organic capacity expansion, not an acquisition, following rising retailer demand for validated protein options. Fitness-focused brands requested this capability.
Signal: Signals retailer demand for protein powder is now large enough to justify dedicated new manufacturing investment.
JULY 2025

PepsiCo Acquires Electrolyte Formulation Technology Specialist

PepsiCo acquired a small company specializing in electrolyte formulation and blending technology for powdered hydration applications, folding it into its existing nutrition division. The acquisition brings electrolyte formulation capability in-house rather than continuing to partner externally, and the deal closed for an undisclosed sum. Terms were not otherwise disclosed.
Signal: Confirms leading beverage manufacturers are acquiring electrolyte formulation capability directly rather than partnering with outside firms.
NOVEMBER 2025

The Coca-Cola Company Signs Distribution Agreement With Mexican Hydration Retail Network

The Coca-Cola Company signed a multi-year distribution agreement with a major Mexican hydration retail network to supply powdered drink mixes across several regional facilities. The arrangement is a distribution agreement, not a joint venture or equity stake, and covers several years of beverage supply activity. Financial terms were not disclosed.
Signal: Indicates global beverage manufacturers are winning large Mexican hydration retail network contracts directly rather than through intermediary distributors.

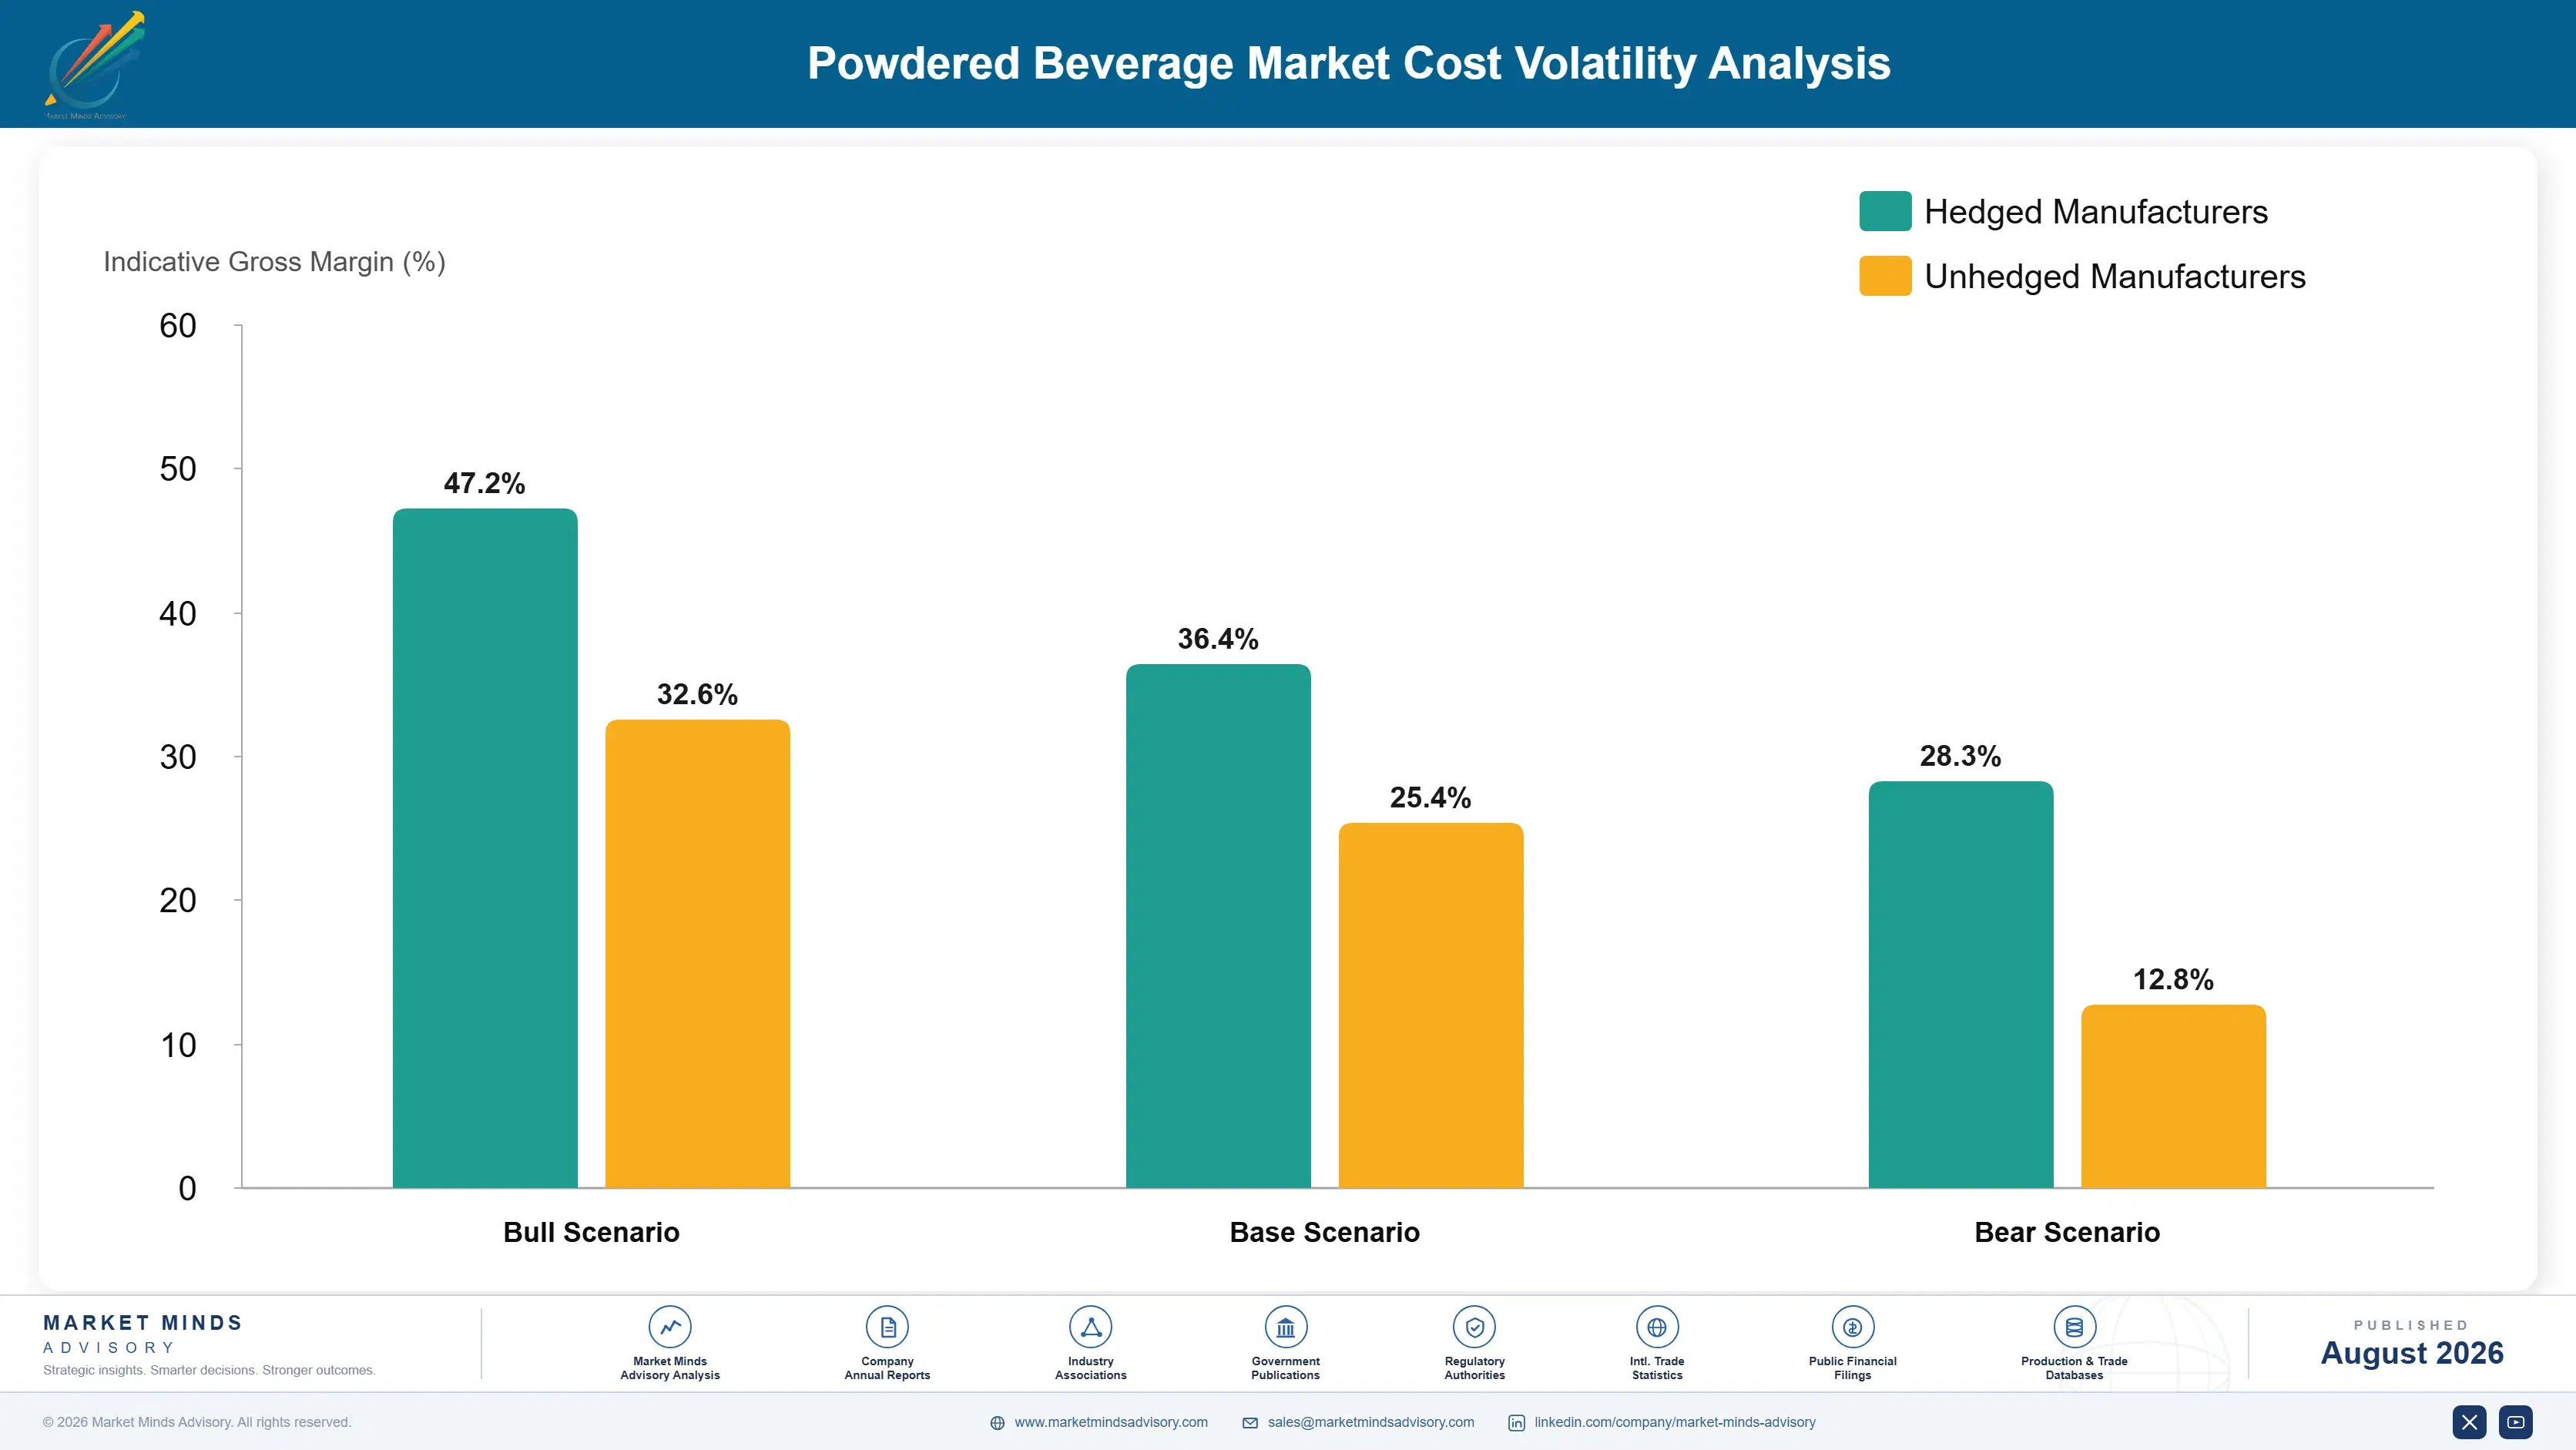
Whey Protein and Coffee Bean Cost Exposure

Whey protein and coffee bean feedstock account for roughly thirty-five percent of powdered beverage production cost, flavoring and formulation processing another twenty-seven percent, and packaging and finishing manufacturing eighteen percent depending on beverage format and functional capability scope. Feedstock sources from American, European, and Brazilian agricultural processors, while formulation capacity remains concentrated among specialized manufacturers.
Whey protein and coffee bean costs swung in 2024, with USDA and European Commission noting agricultural commodity supply volatility tied to competitive raw material demand that pushed component costs higher across the beverage formulation manufacturing industry. Manufacturers with long-term feedstock supply contracts locked in before the volatility absorbed quarters of stable cost before facing higher sourcing costs, while competitors relying on spot-market purchasing faced cost pass-through, showing how contract structure determines which manufacturers protect margin during a volatility cycle.

Smaller specialized manufacturers without long-term feedstock supply contracts absorb cost volatility into gross margin, while the top five use multi-year supplier agreements and sourcing to smooth exposure. Geography compounds the gap: manufacturers with American or European feedstock supply bases sit closer to component supply and cost-competitive sourcing markets, giving them a cost advantage over competitors sourcing through additional channels.
powdered-beverage-market-trends-cost-volatility-analysis-1787335514592

Lock In Multi-Year Feedstock Supply Contracts

Manufacturers with balance sheet capacity to lock in multi-year feedstock supply contracts two to three years forward smooth raw material cost volatility far better than competitors relying on reactive spot-market purchasing. This requires capital commitment smaller specialized manufacturers often lack, but it is close to standard practice among the top five manufacturers protecting production schedules reliably.

Diversify Feedstock Sourcing Across Regions

Sourcing whey protein and coffee beans from more than one qualified agricultural processor reduces exposure to single-region supply allocation shortfalls, though qualifying alternate feedstock sources requires additional validation investment and carries its own consistency tradeoffs manufacturers must confirm before deploying diversified sourcing across multiple regional supply relationships each year. Larger manufacturers manage this tradeoff more easily than smaller competitors.

Invest in Domestic Formulation Manufacturing Capacity

Domestic formulation manufacturing capacity reduces exposure to single-region supply cost volatility directly, while also improving production continuity during periods of regional feedstock market tightness that have disrupted smaller competitors. This requires meaningful upfront capital investment, but manufacturers that made this shift early are largely insulated from the feedstock cost spikes squeezing single-region-dependent competitors across the industry today.

Portfolio Architecture for Margin Defence

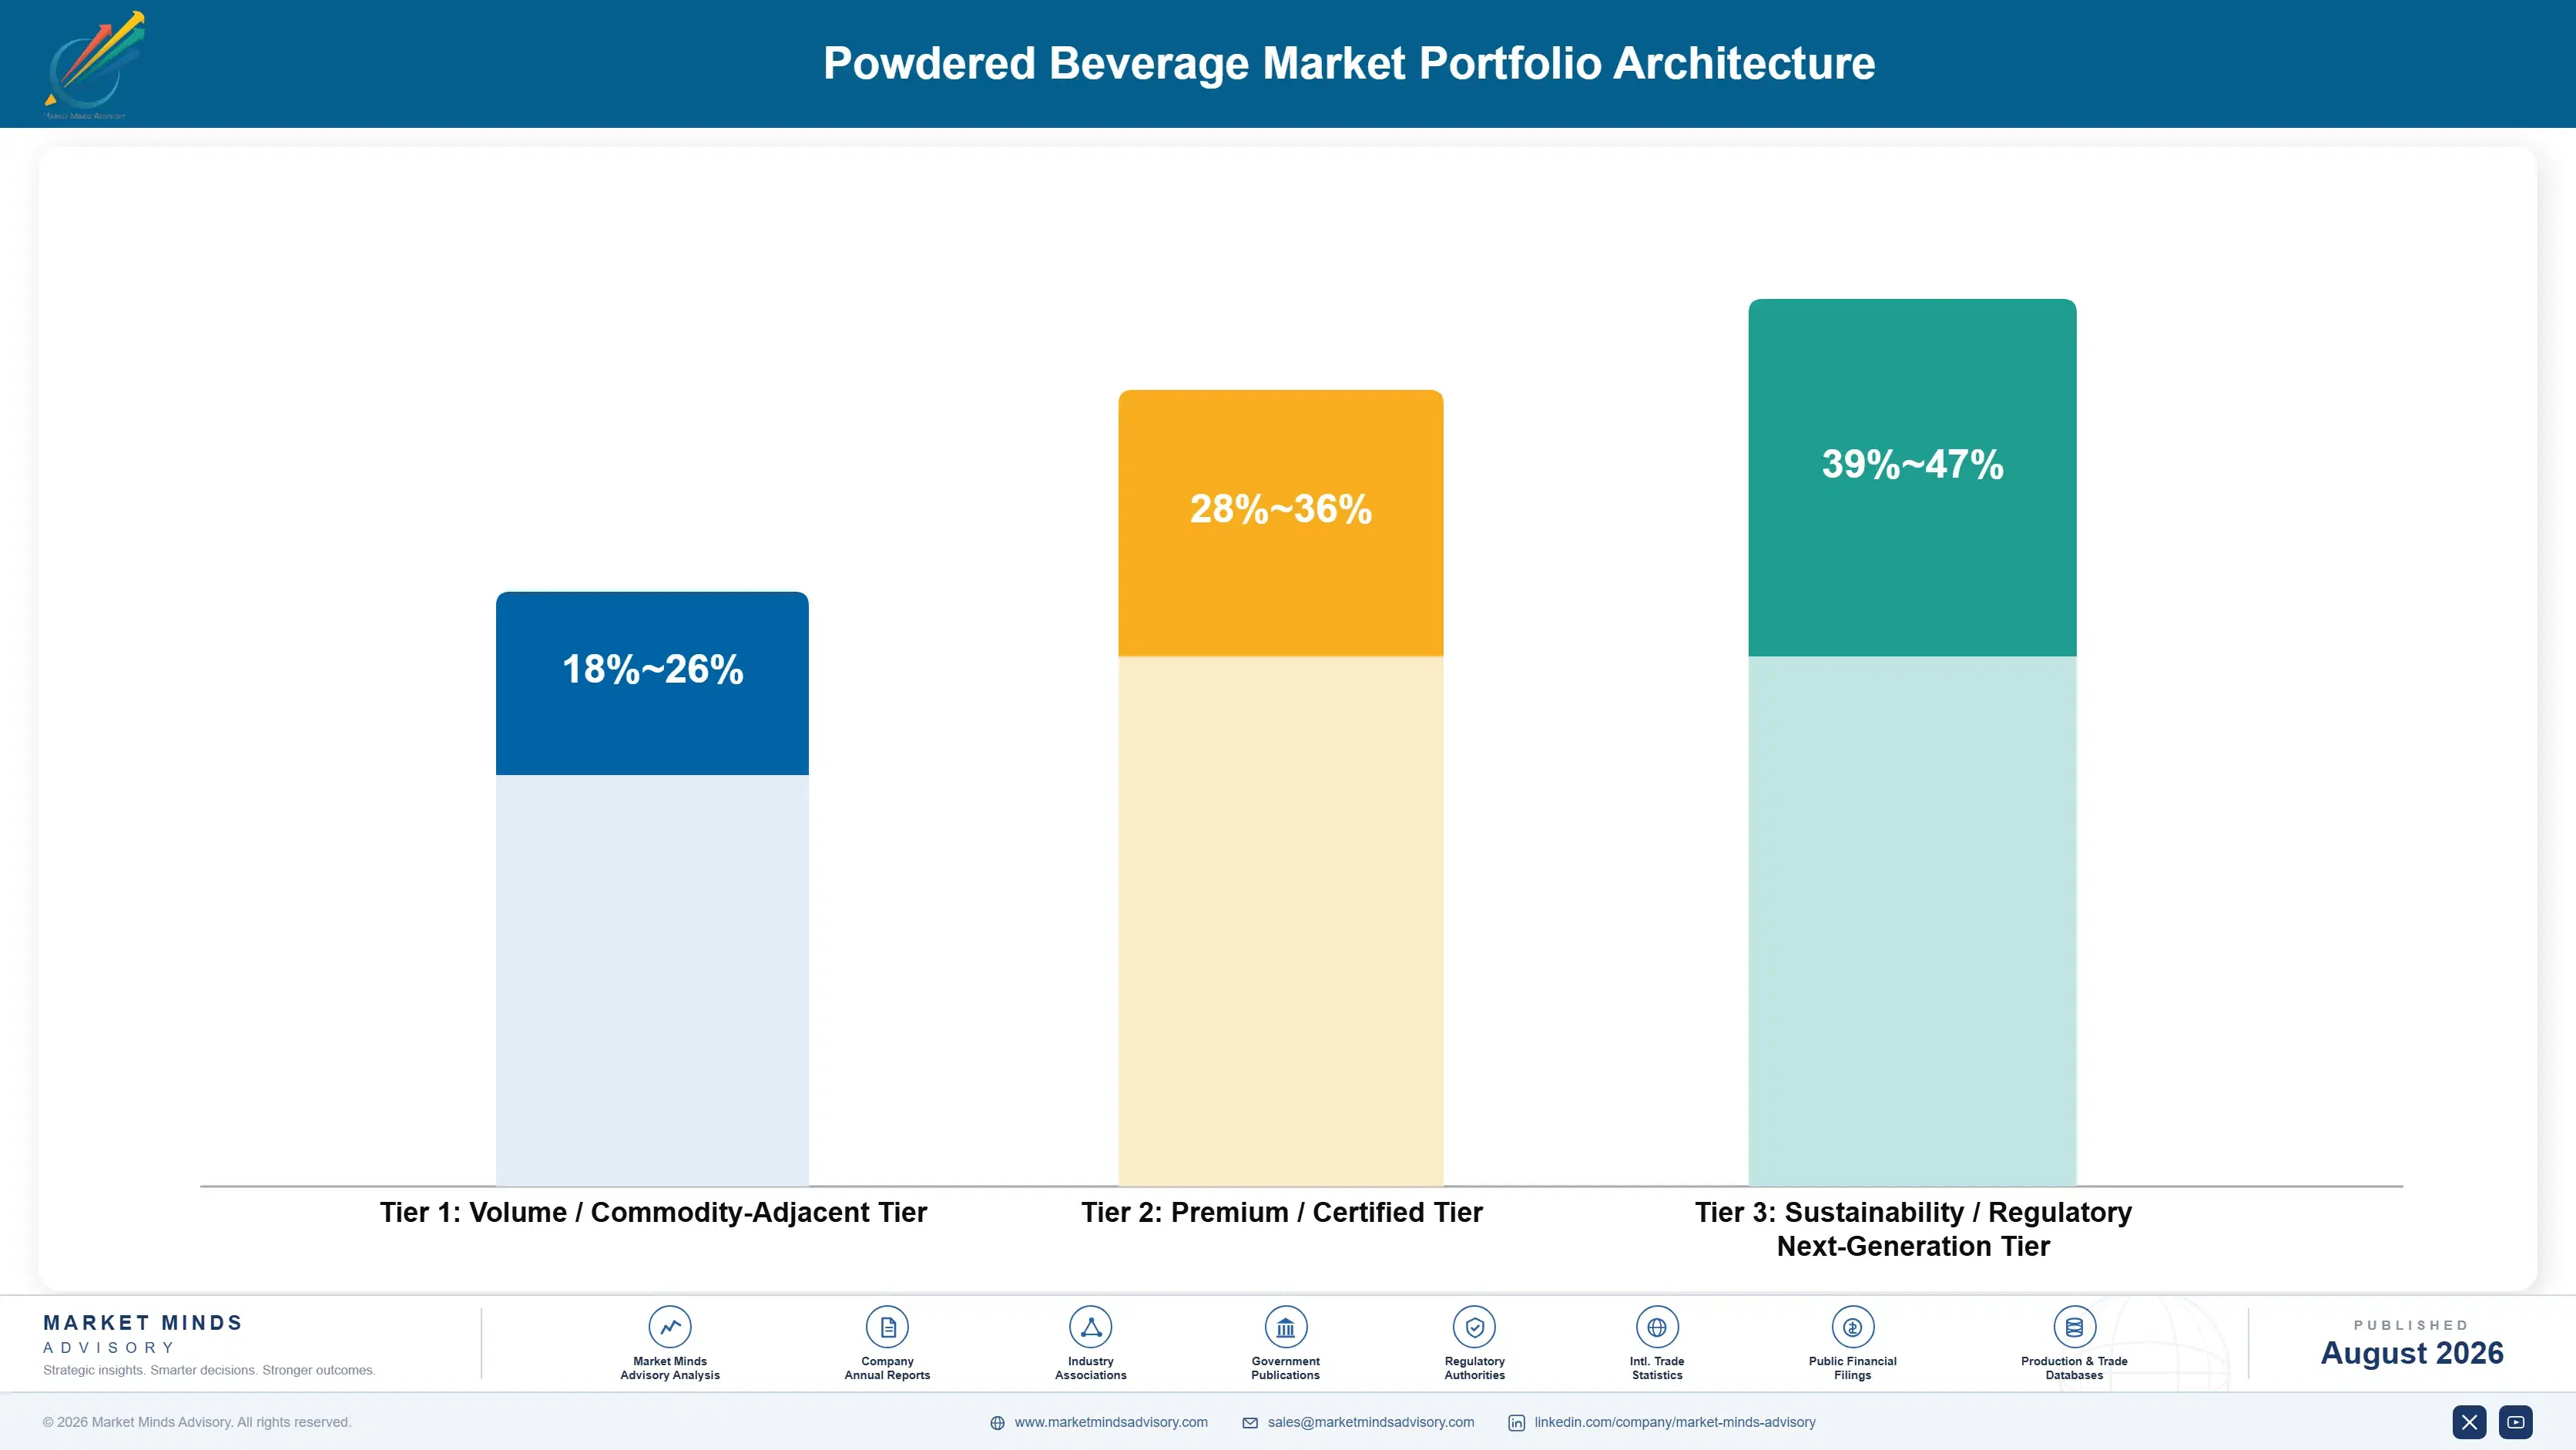
Beverage portfolios split into three margin tiers. Standard sweetened-only mixes compete on price with gross margins in the high teens to twenties given established manufacturer competition, mid-tier sports and hydration formats command higher margins in the low to mid-thirties, and protein and functional premium platforms sit at the top of the stack as the smallest but fastest-expanding tier.
The volume-premium tension plays out most visibly in standard sweetened-only categories, where established manufacturers keep pushing prices down even as formulation investment costs rise across the category, squeezing mid-tier competitors that lack scale to compete on engineering cost. Premium protein categories face a different tension: manufacturers must recoup formulation and blending investment through volume before technology becomes commoditized, a window narrowing as more competitors launch comparable validated platforms.

High-value margin pools concentrate in two places: protein systems sold into retailers managing high-volume functionality-driven decisions, and electrolyte platforms that command premium pricing regardless of the broader standard sweetened-only pricing pressure cycle. Both pools reward manufacturers willing to invest in formulation and clean-label capability ahead of demand rather than reacting once retailer requirements become standard practice across a procurement segment.

Volume / Commodity-Adjacent Tier

Standard sweetened-only mixes sold primarily on price into cost-sensitive grocery and general retail channels, where established manufacturers compete aggressively on price and functional requirements remain comparatively modest across most account types, reflecting the category's largely commoditized manufacturing dynamics.
Gross Margin: 18-26%

Premium / Certified Tier

Mid-tier sports and hydration formats sold to retailers requiring documented functional performance and manufacturing reliability as increasingly standard procurement terms across most specialty programs. These buyers increasingly weigh formulation capability alongside price when comparing manufacturers.
Gross Margin: 28-36%

Sustainability / Regulatory / Next-Generation Tier

Protein and functional premium platforms sold into retailers that prioritize documented functional capability and clean-label performance over near-term beverage cost savings, reflecting where regulatory policy is steering long-term formulation investment.
Gross Margin: 39-47%
powdered-beverage-market-trends-portfolio-architecture-1787335515091

High-value Sub-segments and Strategic Watch-out

Protein Systems for High-Volume Functionality-Driven Decisions

Retailers are standardizing on protein systems for high-volume functionality-driven decisions, and this segment combines the fastest unit growth with a high margin tier, making it the single most attractive pool for manufacturers with strong formulation capability already in place right now. Demand shows no sign of slowing.
Gross Margin: 40-48%

Electrolyte Platforms for Hydration-Driven Brand Demand

Fitness brands are steadily expanding electrolyte platform adoption for hydration-driven demand, a segment growing faster than standard sweetened demand but from a smaller base, commanding premium pricing well above standard beverage sales across most account types, with adoption accelerating steadily each fiscal year across most regional markets.
Gross Margin: 34-42%

Standard Coffee Powders for Core Volume Demand

The largest segment by unit volume remains standard sweetened-only coffee and tea powders sold into established grocery channels, where major manufacturers compete primarily on price and functional requirements stay comparatively predictable across most channels worldwide today. This volume base anchors most manufacturers' recurring revenue even as growth moderates.
Gross Margin: 18-26%

Legacy Sugar-Heavy Mixes Facing Displacement

Legacy sugar-heavy mixes without documented functional or clean-label capability face a shrinking addressable retailer market as consumers increasingly require documented functional data, and manufacturers that fail to diversify into protein and electrolyte categories risk losing retailer listings within the next several years. Some manufacturers are moving quickly.
Gross Margin: 10-16%

Retailer Listing Economics

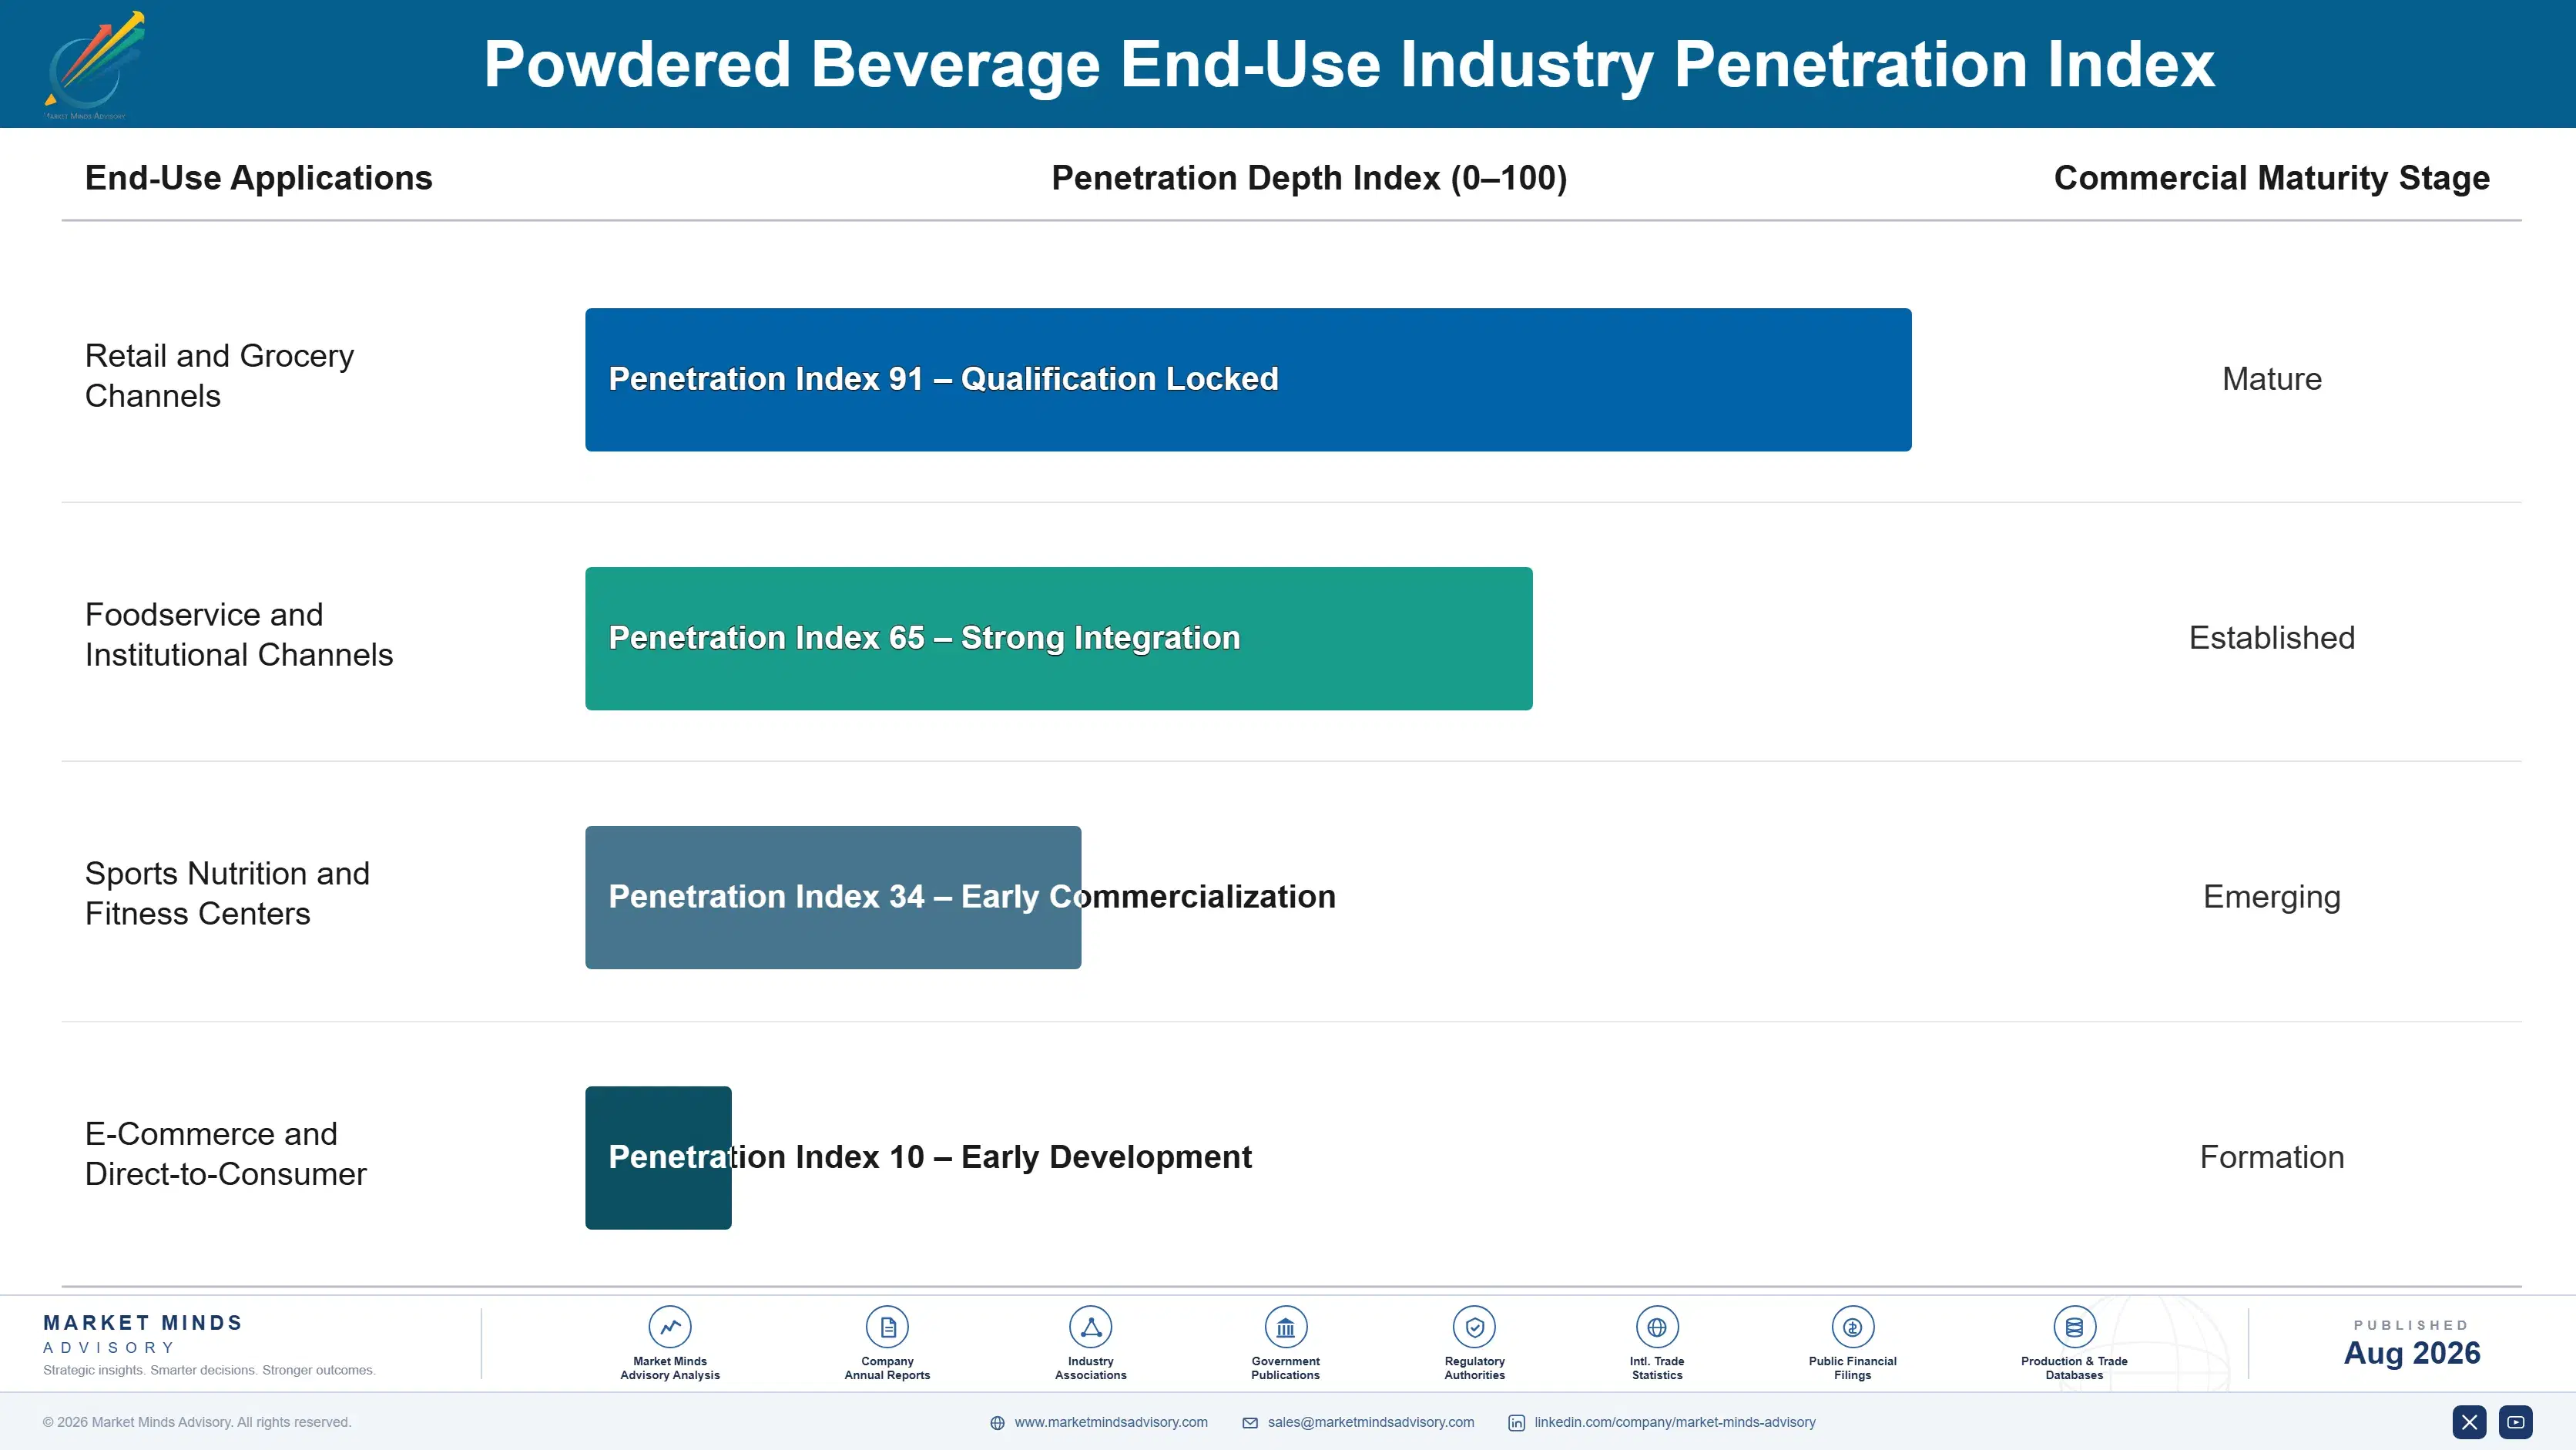
Powdered beverage revenue behaves like a long annuity once a manufacturer wins placement on a retailer's standard planogram listing agreement: a placement decision can generate repeat product, promotional, and adjacent-category revenue across years of shelf coverage over a relationship spanning many years, plus renewal demand as formulation and clean-label requirements tighten with each product refresh cycle. This annuity quality is what makes retailer relationships and engineering depth valuable.
Adoption depth varies by end-use vertical. Retailers managing high-volume, functionality-heavy sports nutrition portfolios adopt protein and electrolyte platforms fastest because functional accuracy and delisting-risk metrics threaten retailer reputation, making product upgrades an easy budget justification. Mid-size regional grocery chains follow behind on cost efficiency requirements. Legacy commodity-only applications without high-volume complexity adopt more slowly, continuing with conventional sweetened sourcing rather than upgrading, stretching adoption timing beyond the technology transition.

Buyer profiles are shifting as purchasing moves from individual-store decisions toward centralized, evidence-based corporate procurement planning. Younger category-management buyers expect documented formulation and functional validation as a default requirement rather than an optional upgrade, and purchasing decisions are shifting from individual budgets toward centralized corporate procurement platforms, changing who beverage manufacturers need to sell to.
powdered-beverage-market-trends-end-use-penetration-index-1787335515578

Where Functional Claims Win Retailer Placement

These are among the four positions where our research anticipates prominent divergence between winners and laggards over the coming forecast period. Each is grounded in the demand model, the regulatory perimeter, and the announced capacity pipeline.
01 / FORMULATION ENGINEERING INVESTMENT

Validate formulation engineering ahead of retailer purchasing cycles

Manufacturers that develop and validate formulation engineering 12 to 18 months ahead of major retailer purchasing cycles capture a meaningful pricing premium during the transition window before competitors catch up. This is not a marginal advantage. Companies that under-invest in engineering speed risk losing listing placements entirely once retailers standardize purchasing around already-validated suppliers, a mistake that took years for some legacy manufacturers to recover from during prior demand transitions, and retailer procurement committees have not forgotten that lesson at all.
02 / CLEAN-LABEL CERTIFICATION INVESTMENT STRATEGY

Build certification capability before competitors lock in premium listings

Clean-label certification capability is shifting from an optional differentiator to a strategic requirement as more retailers standardize purchasing around manufacturers offering verified formulation data, and manufacturers that build capability early capture disproportionate remaining share as competitors wait for reactive certification decisions instead while supplier loyalty across multi-year contracts keeps strengthening steadily. This is not a marginal advantage. Companies still treating clean-label certification as secondary to standard sweetened sales are already behind competitors actively winning listings on this basis today, and the gap is widening each quarter.
03 / MANUFACTURING PRECISION INVESTMENT PRIORITY

Build precision capacity before rivals lock in retailer relationships

Precision investment captures the functional consistency advantage that manual-process manufacturers cannot match once retailers concentrate purchasing decisions around fewer preferred, reliably consistent manufacturers, and retailer networks increasingly specify consistency guarantees by default in new product partnership agreements. This growing preference is only strengthening across every major regional market today. Manufacturers without precision capability are locked out of the most reliable retailer relationships entirely, and specialists that moved early are securing partnerships that manual-process competitors will find difficult to unwind once established.
04 / REGIONAL DISTRIBUTION FOOTPRINT

Localize retail distribution in South Asia before rivals lock in access

India and South Asia are generating the fastest unit growth in the entire ten-year forecast, and manufacturers without local retail distribution face meaningful market access delays plus technical training gaps that grocery networks in faster-moving markets will not tolerate for long. Regional retailer networks are already signing multi-year product agreements with whichever manufacturers can deliver reliably at scale. Waiting for demand to fully mature before committing capital risks ceding these valuable relationships permanently to competitors willing to invest well ahead of confirmed volume growth today.

Engagement Snapshot From the Field

A live engagement with an industry participant carrying material or product regulatory and market exposure ahead of a defining policy shift, showing how our research translates into a defensible multi-year portfolio strategy.
MARKET MINDS ADVISORY · CLIENT ENGAGEMENT SUMMARY
Powdered Beverage Producer Strategic Portfolio Review and Transition Roadmap 2026·Investment Scenario on Powdered Beverage Exposure Evaluation 2025-26
CLIENT PROFILE
The client operates a regional grocery retail network spanning six hundred stores across North America, generating an annual powdered beverage category revenue exceeding 340 million dollars (client-reported, unverified by MMA). Facing rising consumer demand for documented functional claims and constrained shelf space, the client's category management team sought an independent assessment of protein powder assortment strategy before committing to a category-wide reset.
STRATEGIC CHALLENGE
The client's existing assortment relied predominantly on conventional sweetened-only mixes with limited functional documentation, creating credibility gaps during category performance reviews. Category leadership needed to select among competing protein powder vendors, determine which store formats to prioritize for reset first, and justify the assortment cost increase to a board concerned about margin exposure.
MMA APPROACH
MMA benchmarked candidate protein powder vendors against functional claims and supply reliability capability, modeling reset cost and margin impact by store format. The engagement combined primary interviews with four powdered beverage manufacturers, review of eighteen months of the client's sales and category performance data, and a store-format-by-store-format prioritization framework ranking reset readiness against expected margin impact.
KEY FINDINGS
  1. Protein powder reset increased category revenue growth by eighteen percent across the client's highest-volume store format, exceeding what the client's internal category team had modeled (client-reported, unverified by MMA).
  2. The client's existing sweetened-only assortment lacked adequate functional documentation, since limited protein adoption was already driving category performance friction across several store formats each quarter.
  3. Standardizing on a validated protein powder vendor reduced projected out-of-stock risk by roughly twelve percent across the client's highest-priority store formats (client-reported, unverified by MMA).
  4. A phased one-year reset program prioritizing highest-volume store formats first freed enough category capacity to fund broader network reset in its second year overall.
CLIENT PROFILE
The client operates a regional grocery retail network spanning six hundred stores across North America, generating an annual powdered beverage category revenue exceeding 340 million dollars (client-reported, unverified by MMA). Facing rising consumer demand for documented functional claims and constrained shelf space, the client's category management team sought an independent assessment of protein powder assortment strategy before committing to a category-wide reset.
STRATEGIC CHALLENGE
The client's existing assortment relied predominantly on conventional sweetened-only mixes with limited functional documentation, creating credibility gaps during category performance reviews. Category leadership needed to select among competing protein powder vendors, determine which store formats to prioritize for reset first, and justify the assortment cost increase to a board concerned about margin exposure.
MMA APPROACH
MMA benchmarked candidate protein powder vendors against functional claims and supply reliability capability, modeling reset cost and margin impact by store format. The engagement combined primary interviews with four powdered beverage manufacturers, review of eighteen months of the client's sales and category performance data, and a store-format-by-store-format prioritization framework ranking reset readiness against expected margin impact.
KEY FINDINGS
  1. Protein powder reset increased category revenue growth by eighteen percent across the client's highest-volume store format, exceeding what the client's internal category team had modeled (client-reported, unverified by MMA).
  2. The client's existing sweetened-only assortment lacked adequate functional documentation, since limited protein adoption was already driving category performance friction across several store formats each quarter.
  3. Standardizing on a validated protein powder vendor reduced projected out-of-stock risk by roughly twelve percent across the client's highest-priority store formats (client-reported, unverified by MMA).
  4. A phased one-year reset program prioritizing highest-volume store formats first freed enough category capacity to fund broader network reset in its second year overall.
RECOMMENDED STRATEGY
Phase 1: Phase 1 (Months 1-6): Reset the two highest-volume store formats with expanded protein powder assortment, prioritizing formats with the most acute category performance exposure. Phase 2: Phase 2 (Months 7-12): Roll out the standardized protein powder assortment across the full store network, formalizing functional documentation requirements for all formats. Phase 3: Phase 3 (Months 13-18): Complete remaining store format reset and formalize a rolling annual vendor performance review tied to category and supply metrics.
OUTCOME
Within twelve months of the phased rollout beginning, the client reported a sixteen percent improvement in category revenue growth across reset store formats and reduced out-of-stock incidents by an estimated nine percent (client-reported, unverified by MMA). The client has since extended the MMA-designed prioritization framework to two additional grocery retail networks.

Frequently Asked Questions

Foundational context covering the market sizes, CAGR, scope, country, region and competition that inform every finding below. This section is provided to cover basics and most often pre-purchase conversations, answered from the MMA Primary Research Dataset.

What is the current size of the Powdered Beverage Market?

The powdered beverage market reached an estimated $24.0 billion in 2025. This figure covers coffee, tea, sports, protein, water-enhancer, and equipment service formats globally across all channels.

How large will the Powdered Beverage Market be by 2036?

MMA projects the market will reach approximately $47.48 billion by 2036, roughly 1.86 times its 2026 value. Growth is driven primarily by protein powder adoption and expanding sports nutrition demand.

What is the CAGR for the Powdered Beverage Market 2026 to 2036?

The base case CAGR is 6.4% annually through 2036. Bull and bear scenarios range from 7.7% to 5.1% depending on sports nutrition adoption pace and retailer budget discipline.

Which segment is growing fastest?

Powdered protein and meal replacement beverages are the fastest-growing segment at a 10.8% CAGR, roughly 1.7 times the overall market rate. Flavored water enhancers follow closely as the second-fastest segment at 9.6%.

Who are the major companies in the Powdered Beverage Market?

Nestlé, PepsiCo, The Coca-Cola Company, Mondelez International, and Glanbia are the five leading manufacturers by unit volume. Together they hold roughly thirty-four percent of global market share.

Which country is growing fastest?

Mexico is the fastest-growing major market, with a CAGR near 9.4%, driven by strong hydration drink mix culture and expanding retail distribution investment. Strong consumer demand for affordable flavored powders is supporting continued expansion there.

Report Segmentation Architecture

The full report scope spans multiple orthogonal segmentation dimensions, with cross-tabulated demand data provided for each dimension pair. Coverage extends further to regional breakdowns, trend trajectories, and the competitive detail needed to support segment-level decision-making.

By Beverage Product Type

  • Powdered Coffee and Coffee Mix Products
  • Powdered Tea and Tea Mix Products
  • Powdered Sports and Electrolyte Drink Mixes
  • Powdered Protein and Meal Replacement Beverages
  • Powdered Flavored Water Enhancers and Drink Mixes
  • Powdered Beverage Processing Equipment and Services

By End-Use Industry

  • Retail and Grocery Channels
  • Foodservice and Institutional Channels
  • Sports Nutrition and Fitness Centers
  • E-Commerce and Direct-to-Consumer

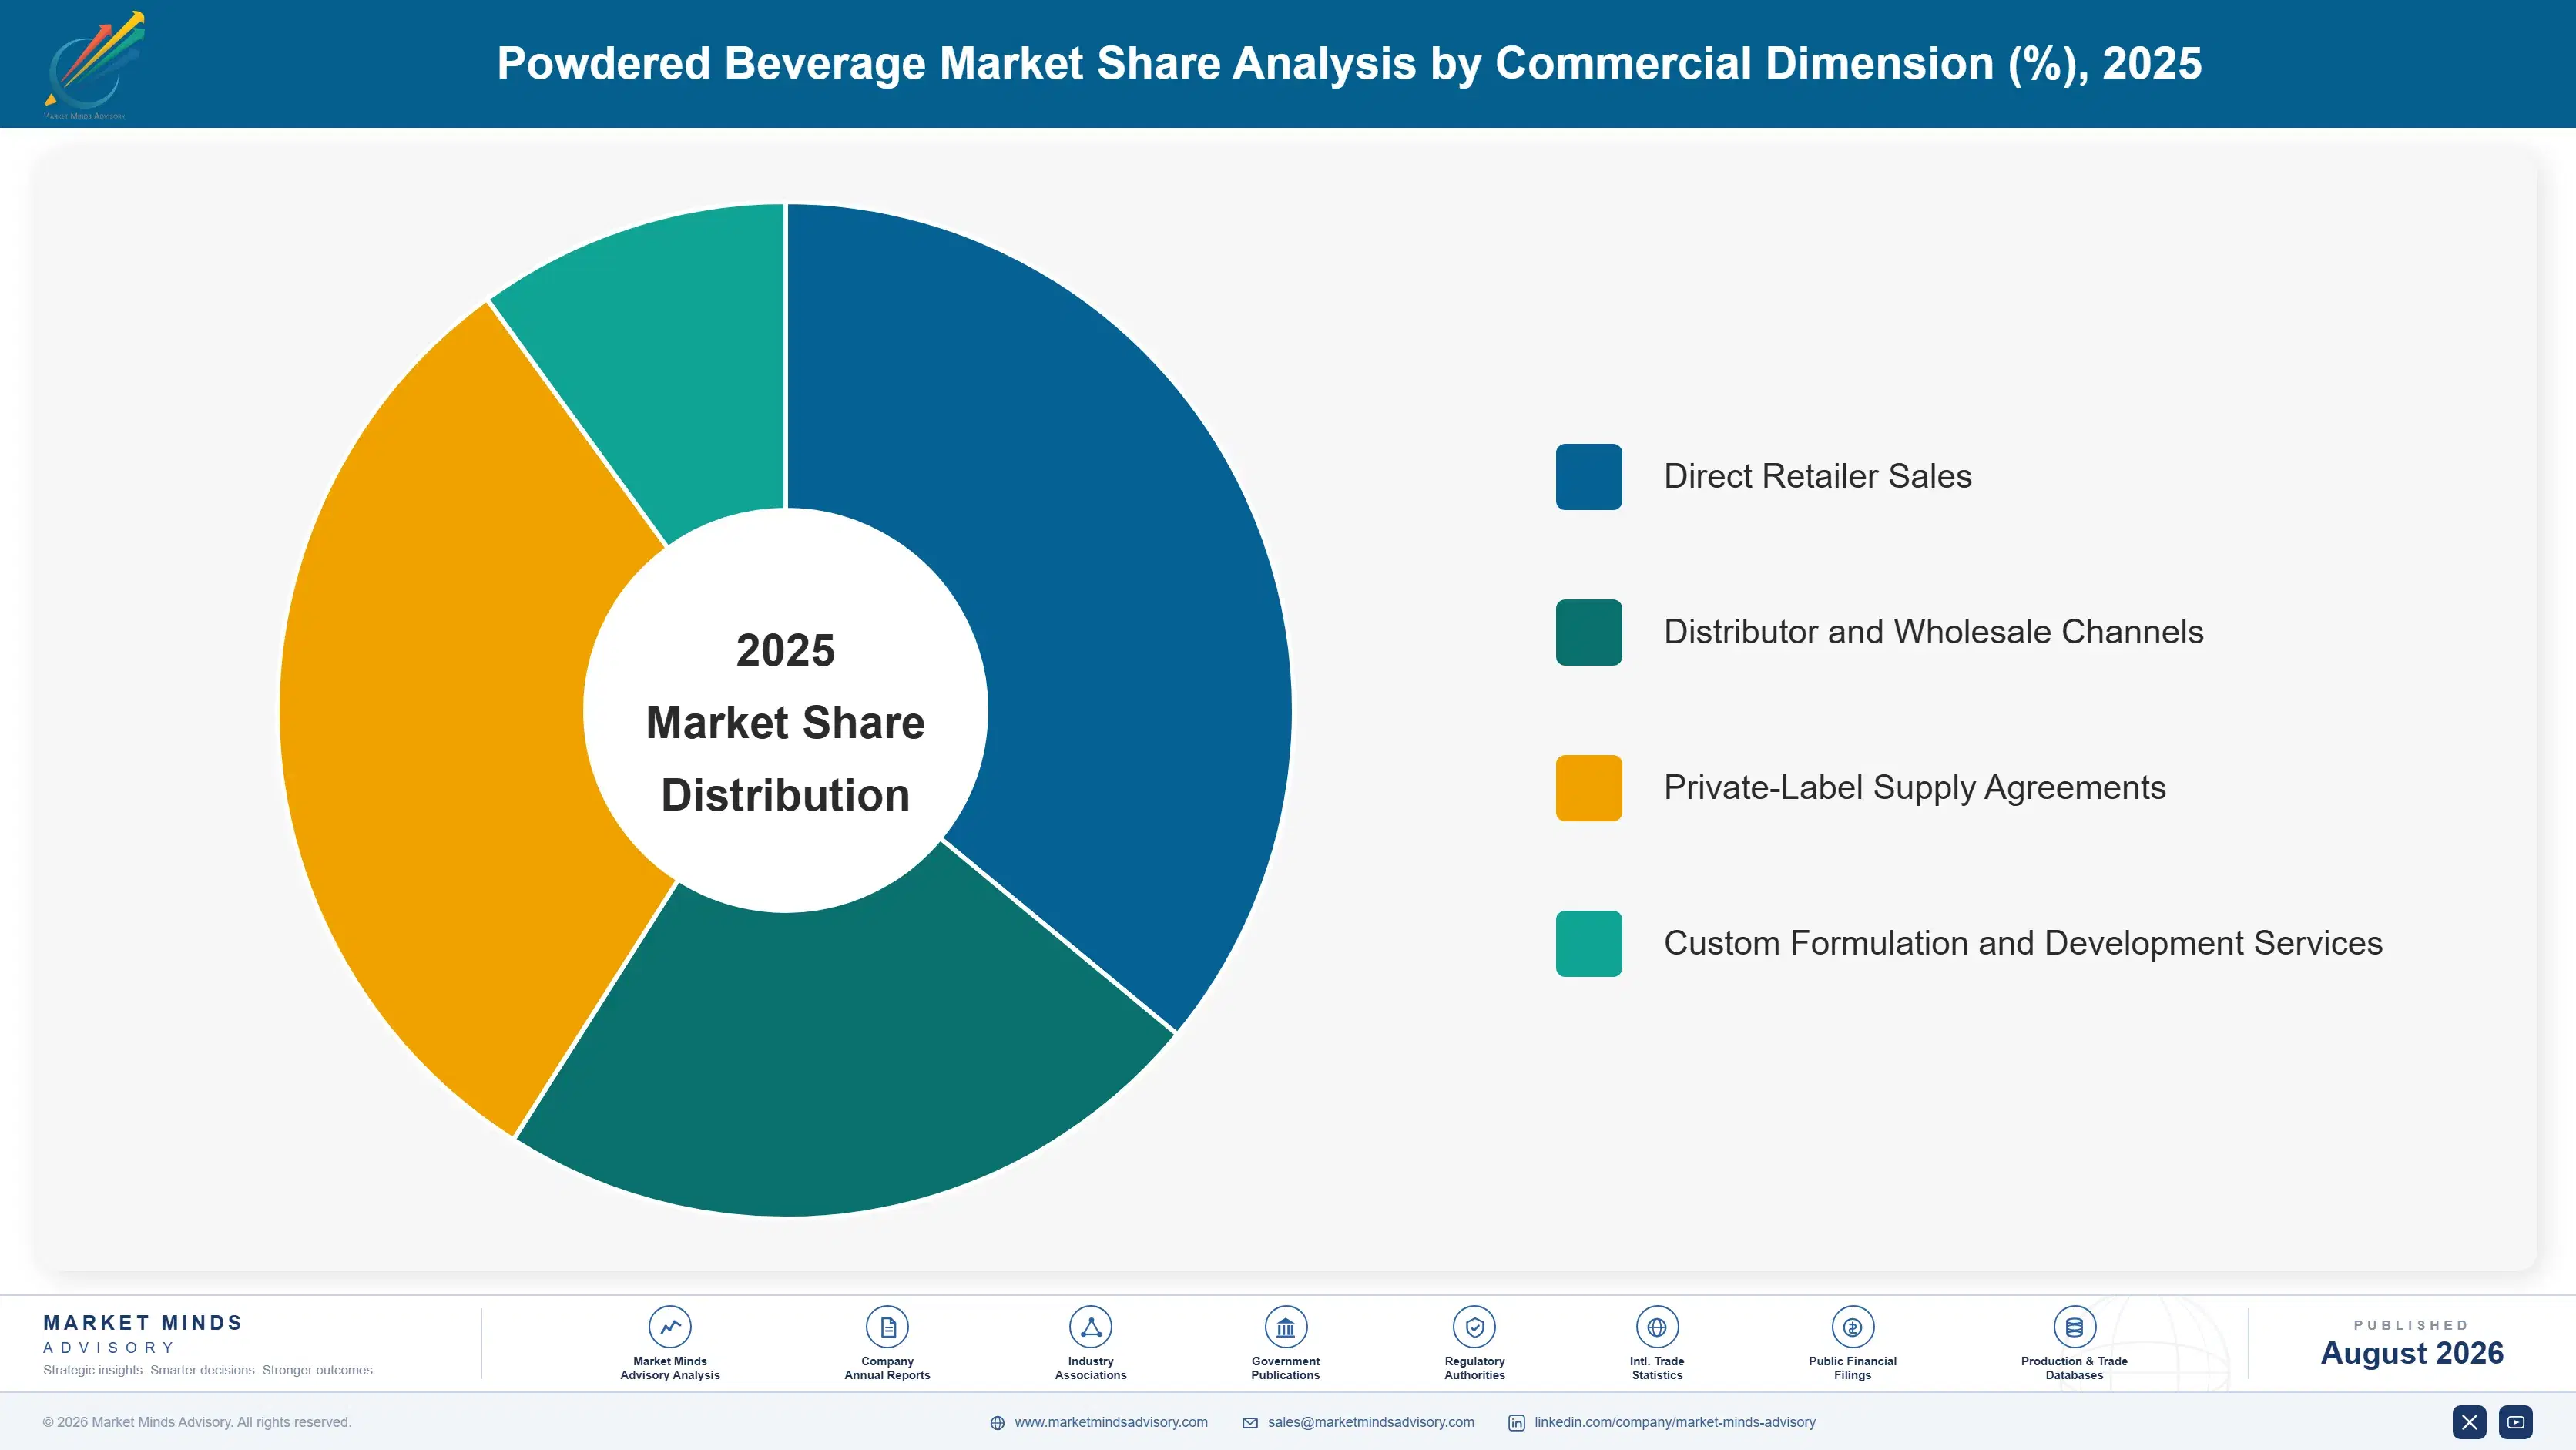
By Commercial Dimension

  • Direct Retailer Sales
  • Distributor and Wholesale Channels
  • Private-Label Supply Agreements
  • Custom Formulation and Development Services

By Region

  • North America
  • Western Europe
  • East Asia
  • South Asia and Pacific
  • Latin America
  • Middle East and Africa
  • Eastern Europe

Scope, Methodology, and Coverage

Every figure in this report is reproducible from documented input assumptions. The scope below maps the historical period, the forecast horizon, the segmentation dimensions, and the countries covered, alongside the underlying primary and qualitative methodology.
Historical Period
2020 to 2025
Forecast Period
2026 to 2036
Base Year
2025 (USD billions; MMA Primary Research Dataset, August 2026)
Market Definition
This report covers powdered and instant beverage mixes reconstituted with water or other liquids for consumption, including powdered coffee and coffee mix products, powdered tea and tea mix products, powdered sports and electrolyte drink mixes, powdered protein and meal replacement beverages, powdered flavored water enhancers and drink mixes, and powdered beverage processing equipment and services. It excludes ready-to-drink liquid beverages and finished dairy-based powders sold as infant formula. Scope covers global sales revenue of powdered beverage products sold through retail and foodservice channels.
Quantitative Units
USD billions (current prices); metric tons where disclosed
Segmentation Dimensions
By Beverage Product Type; By End-Use Industry; By Commercial Dimension; By Region
Regions Covered
North America, Western Europe, East Asia, South Asia and Pacific, Latin America, Middle East and Africa, Eastern Europe
Countries Covered
USA, Canada, Germany, UK, France, Netherlands, China, Japan, South Korea, India, Vietnam, Indonesia, Australia, Mexico, Brazil, Colombia, Argentina, Chile, Peru, Saudi Arabia, UAE, South Africa, Egypt, Poland, Czech Republic, Hungary, Romania, and additional markets relevant to this sector
Key Companies Profiled
Nestlé, PepsiCo, The Coca-Cola Company, Mondelez International, Glanbia, Unilever, Herbalife Nutrition, Post Holdings, Abbott Laboratories, Danone, GNC Holdings, MusclePharm, BellRing Brands, Vital Proteins, Nuun, Liquid I.V., Orgain, AJE Group, Jumex, Britvic
Quantitative Methodology
Primary survey, n=3,800 respondents, Q4 2025, six countries; demand-side model with trade association cross-validation
Qualitative Methodology
47 expert interviews, Q4 2025; applied to validate demand model assumptions, identify emerging dynamics, and assess competitive positioning
Report Format
PDF and XLSX data workbook (Word format preview document)
Publisher
Market Minds Advisory
Report Code
MMA-2026-AGR-106
Published
August 2026
Contact
sales@marketmindsadvisory.com | www.marketmindsadvisory.com

Purchase the full Powdered Beverage Market Report (2026 to 2036).

The full report delivers a complete market model spanning 2020 through 2036, with detailed segmentation by beverage product type, end-use industry, and commercial dimension across all seven global regions. It includes company profiles for the top twenty manufacturers, covering formulation engineering capability, clean-label certification technology, and recent corporate developments. Buyers receive access to MMA's underlying primary survey dataset of 3,800 respondents and 47 expert interviews conducted in the fourth quarter of 2025. The report also includes a dedicated whey protein and coffee bean input cost assessment, plus a case study illustrating a real-world protein powder assortment engagement.
Full segmentation model across six beverage product types
Company profiles for twenty manufacturers with development tracking
Full regional coverage across all seven global markets
Protein and electrolyte adoption trend assessment
Whey protein and coffee bean cost analysis
Ten-year forecast with bull, base, and bear scenarios

Built For The People Who Decide

From boardroom strategy to bench-side execution, this report is read cover-to-cover by leaders shaping the next decade of their industry, turning demand scenarios, market dynamics and valuation benchmarks into decisions.
CXOs/ Presidents/ VPs/ Managers
M&A and Corporate Development
Strategy Teams and R&D Heads
Procurement and Product Directors
Regulatory and Compliance Leaders
Investor Relations and Equity Analysts