Market Minds Advisory
Potassium Sulfate Market

Potassium Sulfate Market: Chloride-Sensitive Crop Demand and Feedstock Economics

Premium fruit and vegetable acreage expansion and chloride-sensitive crop specification are pulling potassium sulfate demand ahead of general potash fertilizer consumption, even as sulfuric acid and potassium chloride feedstock volatility squeezes producer margins worldwide.

Lead Analyst

Bilal Shaikh

Published

September 2026

Make Smarter Decisions with Customized Research Insights

Request a free sample report and evaluate market opportunities, growth trends, and competitive dynamics relevant to your business needs.

2025 MARKET VALUE$8.5BMarket Size 2025
2036 FORECAST VALUE$15.8BBase Case , 2026 to 2036
CAGR 2026 TO 20365.8 %Bull 7.0% / Bear 4.5%
INCREMENTAL OPPORTUNITY$6.8BNet 10- year value creation
EXPANSION MULTIPLE1.76x2036 value over 2026 base
Strategic Levers
M&A Pipeline
Regional Outlook
Country Rankings
Competitive Intelligence
Segmental Deep-dive
Call-Us : 91 93563 13602

Executive Snapshot and Market Trajectory

Premium fruit and vegetable acreage expansion and chloride-sensitive crop specification are pulling potassium sulfate demand ahead of general potash fertilizer consumption, forcing producers to rebuild capacity around tighter purity specifications faster than legacy Mannheim process production was originally designed to support, a shift reshaping capital allocation industry-wide right now.
Greenhouse and specialty crop applications are pulling category growth fastest as controlled-environment agriculture scales globally, closely followed by fruits and vegetables on rising premium produce export demand. East Asia leads global demand on China's dominant chloride-sensitive crop cultivation and domestic manufacturing base, while South Asia and Pacific expands fastest as India's horticulture sector scales rapidly across newly organized agricultural corridors nationwide, a shift already underway across major producing regions, pressures intensifying as documentation expectations rise.
Competitive intensity remains moderately consolidated among a group of integrated producers that control sulfuric acid, potassium chloride, and Mannheim process capacity together, leaving smaller regional producers to compete mainly on regional delivery speed and blend flexibility. Sulfuric acid and potassium chloride feedstock cost volatility is squeezing producer margins, while premium crop buyer purity specifications force suppliers to defend share through certified quality documentation and technical service investment simultaneously.
Market Definition
The potassium sulfate market covers sulfate of potash fertilizer products manufactured via the Mannheim process, glaserite conversion, and Great Salt Lake or Mannheim-derived brine processing, sold to agricultural, horticultural, and specialty crop growers. It excludes muriate of potash, potassium nitrate, and other potassium fertilizer chemistries formulated without sulfate content.
Base Year Value
$8.5B in 2025 (MMA Primary Research Dataset, August 2026)
Forecast Period
2026 to 2036, eleven discrete annual values
CAGR
5.8% base case. Bull 7.0%. Bear 4.5%.
Fastest Growth Segment
Greenhouse and Specialty Crops: 8.1% CAGR
Fastest Growth Country
China: 7.4% CAGR
Fastest Growth Region
South Asia and Pacific: 7.8% CAGR
Largest Region
East Asia: 28% of 2025 global value
Market Leaders
SQM, Compass Minerals, K+S Group, Tessenderlo Group, ICL Group. Source: MMA Analysis based on company annual reports.
Primary Survey
n=3,800 procurement and R&D decision-makers, Q4 2025, six countries
Methodology
Demand-side build-up, cross-validated against public data, 47 expert interviews

Potassium Sulfate Market Forecast Scenarios

potassium-sulfate-market-trends-size-forecast-scenario-1787581575990
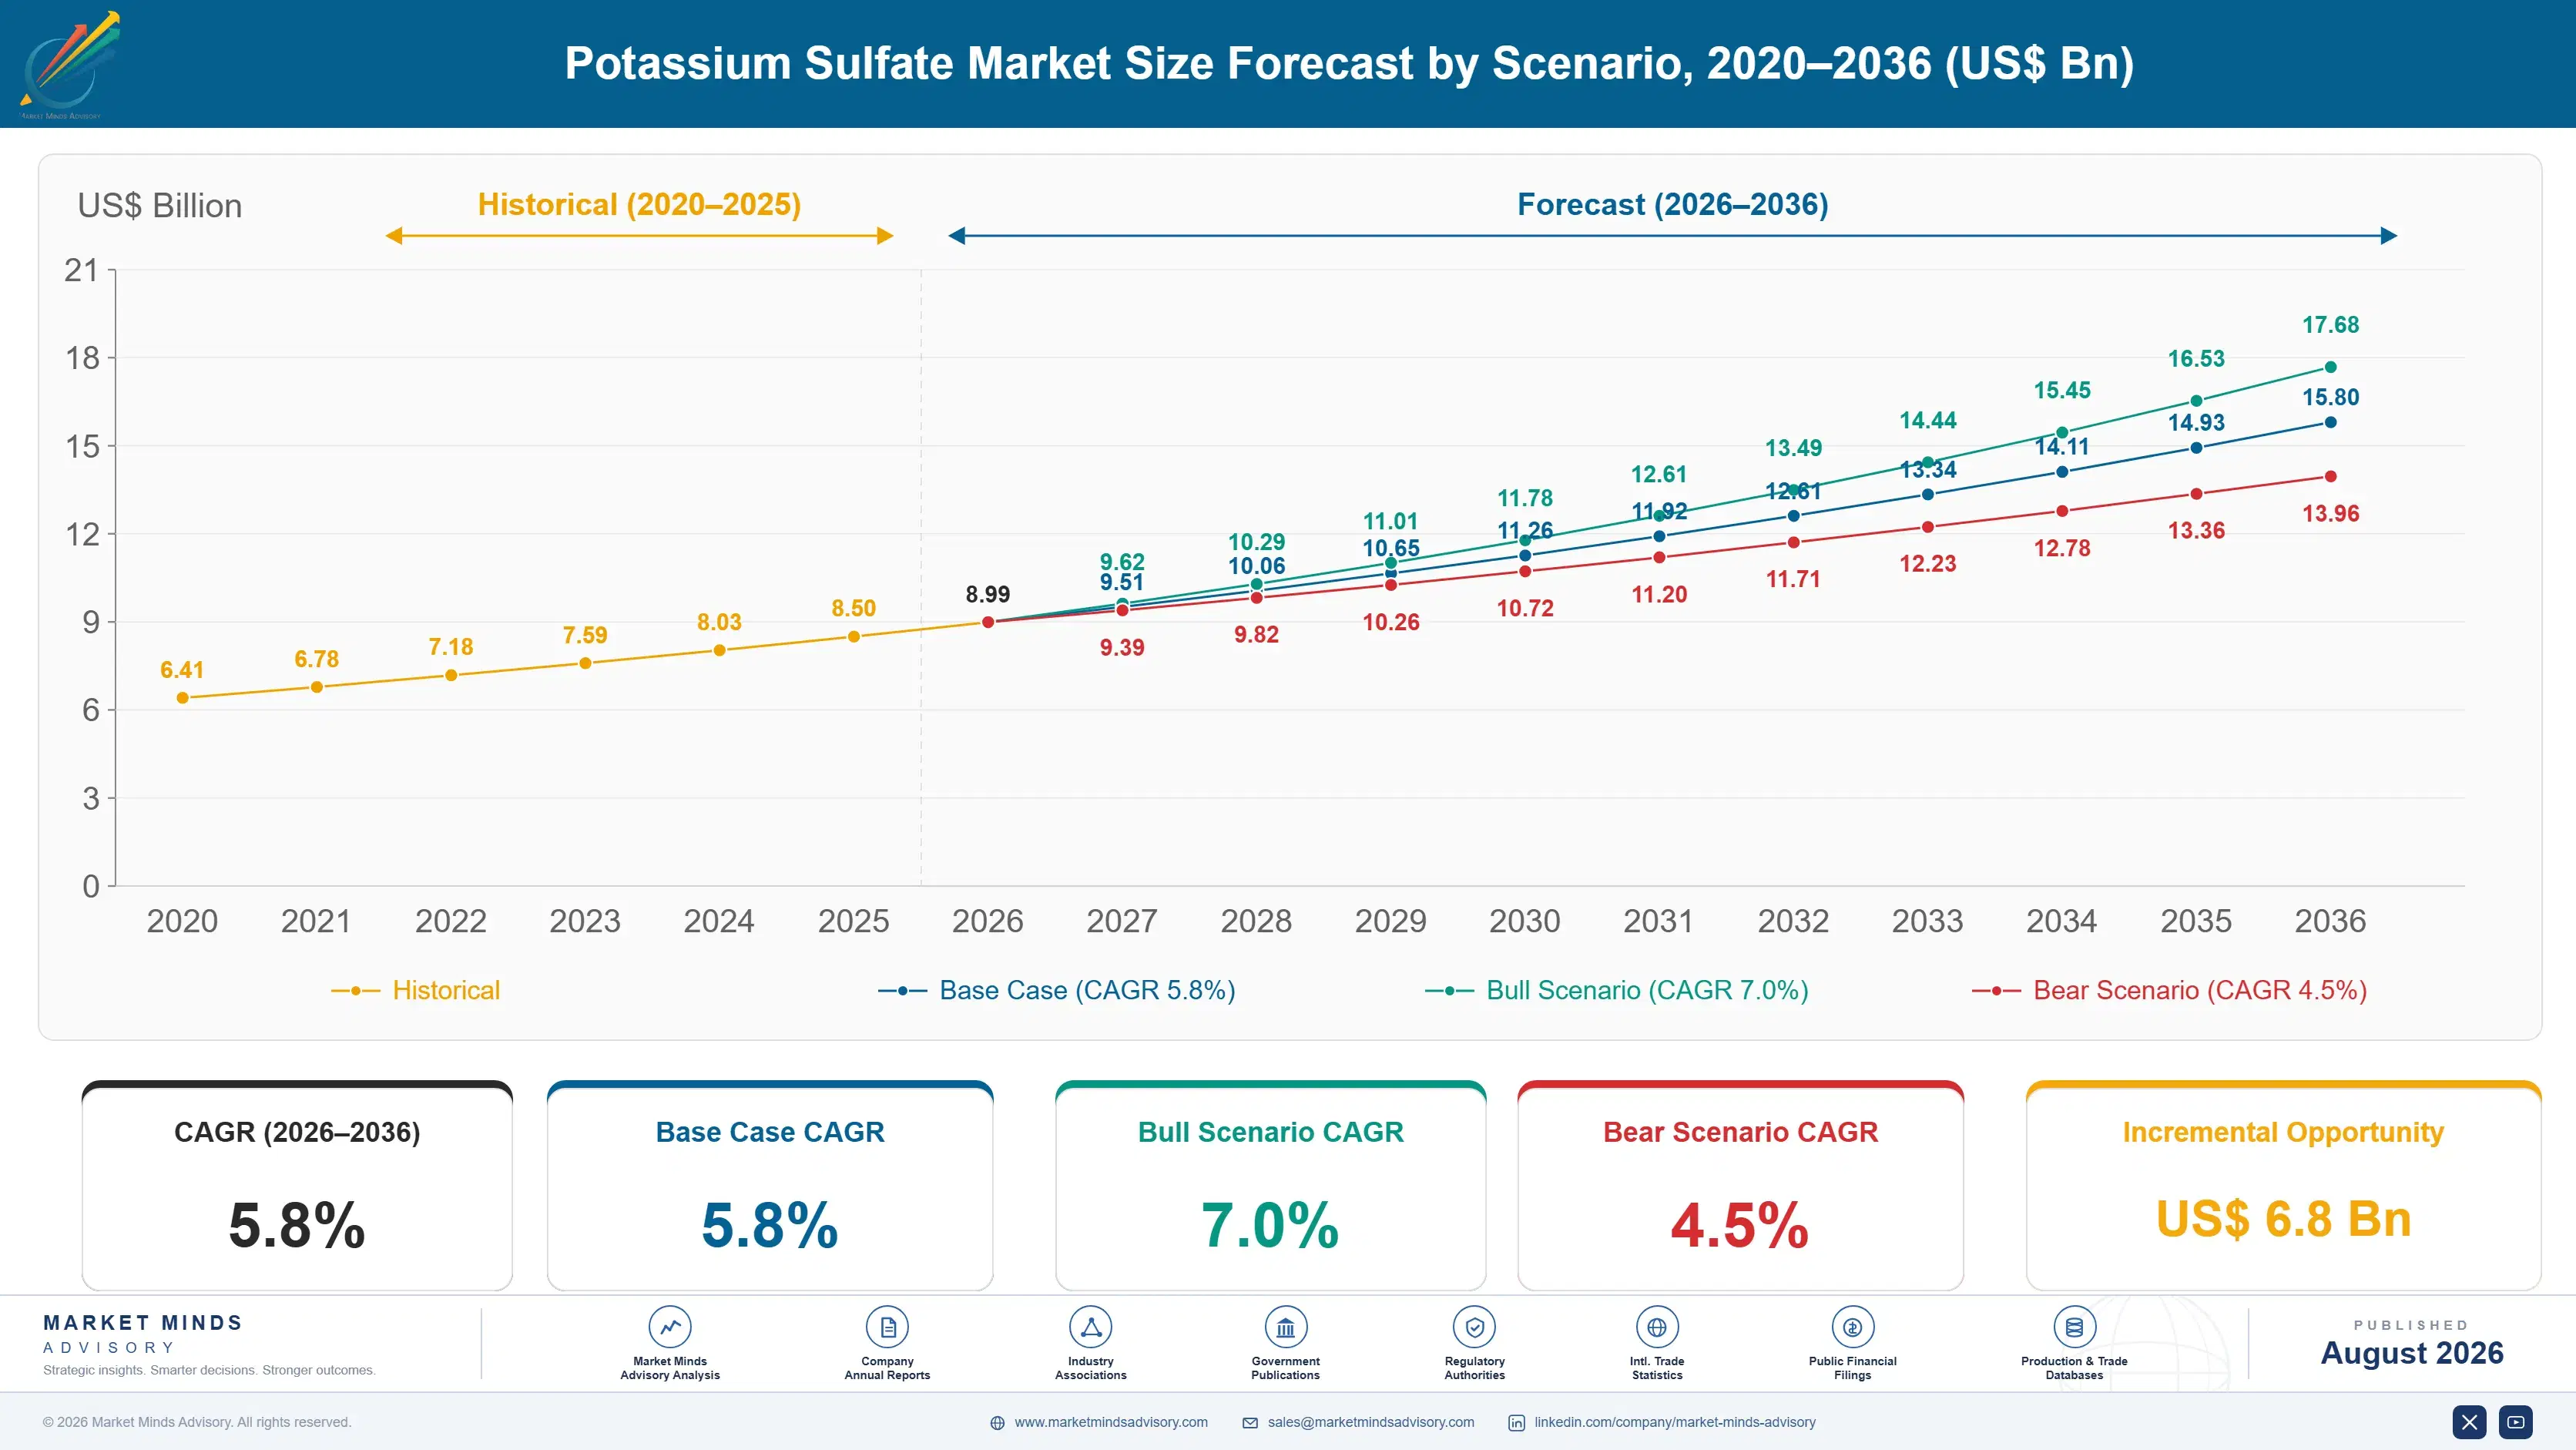
Between 2020 and 2025 the market grew at an estimated 4.9% historical CAGR, held back early by pandemic-era agricultural supply chain disruption and 2021 sulfuric acid price spikes, before premium produce export growth and chloride-sensitive crop expansion restored steadier momentum through 2024 into 2025, a pace consistent with growth-specialty agricultural chemical trends broadly across most regions.
The base case assumes 5.8% CAGR through 2036, driven by three mechanisms: continued premium fruit and vegetable acreage expansion across major export-oriented agricultural regions requiring chloride-free fertilization, sustained controlled-environment agriculture growth from greenhouse and specialty crop operations favoring documented purity over lower-grade potash alternatives, and expanding tobacco and cash crop cultivation in Asian and African markets favoring sulfate-based nutrition over chloride-containing formulations, with producers calibrating capacity investment against these converging demand mechanisms directly.
The bull case, at 7.0%, hinges on faster premium produce export growth across major agricultural regions alongside accelerated controlled-environment agriculture adoption. The bear case, at 4.5%, reflects a scenario where sulfuric acid and potassium chloride feedstock cost volatility persists, forcing producers to defer capacity investment and slowing conversion momentum among cost-sensitive regional growers unable to absorb sustained input price pressure.

Feedstock Cost Economics and Chloride-Free Crop Demand

Potassium sulfate demand now converges around three forces: premium fruit and vegetable acreage expansion across major export-oriented agricultural regions requiring chloride-free fertilization, controlled-environment agriculture growth from greenhouse and specialty crop operations favoring documented purity, and expanding tobacco and cash crop cultivation in Asian and African markets favoring sulfate-based nutrition over chloride-containing formulations. Producers that can guarantee purity consistency and rapid order turnaround are capturing premium grower contracts fastest across major regional accounts.
CR5 CONCENTRATION46%top five producers hold a moderately consolidated integrated production base
AVERAGE SELLING PRICEUSD 520/tonnegreenhouse and specialty-grade formulations command materially higher blended pricing
TOP PRODUCING COUNTRY SHAREChina, 24%leads global production scale on integrated Mannheim process manufacturing capacity
CAPACITY UTILISATION77%reflects steady demand from horticultural and specialty end markets
TRADE INTENSITY32%cross-border trade supports multinational agricultural and horticultural supply chains
FEEDSTOCK COST SHARE47%sulfuric acid and potassium chloride inputs dominate manufacturing cost structure
Commercially, the category behaves less like a commodity fertilizer sale and more like a purity-certified agronomic partnership. Premium fruit, vegetable, and greenhouse growers qualify producers through extensive chloride-content testing and agronomic trial review before committing to fertilization specification, which is why the largest producers embed dedicated agronomic support teams directly inside major grower and cooperative relationships. Switching producers mid-season is costly given crop cycle disruption risk.
Over the next decade, feedstock supply security, purity-grade innovation, and continued premium produce export growth will determine which producers can defend margin as sulfuric acid cost volatility squeezes companies already absorbing capacity investment, rewarding producers with diversified feedstock sourcing and agronomic documentation depth across every major regional grower account currently operating worldwide, a dynamic already reshaping capital allocation priorities across the sector.
"A grower doesn't switch to potassium sulfate because a salesperson asks nicely. They switch because a chloride-sensitive crop showed leaf scorch one season, and that single agronomic lesson sticks with a farm operation for a decade."
Director, Specialty Fertilizers and Crop Nutrition Practice · MMA Sulfate of Potash Fertilizer Products Practice · August 2026

Market Trends

Controlled-Environment Agriculture Expansion Drives Purity Specification

Greenhouse and controlled-environment agriculture capacity expansion has accelerated rapidly since 2023, driving demand for high-purity potassium sulfate with tighter chloride and heavy metal impurity limits than conventional field-grade formulations can reliably deliver for hydroponic and fertigation nutrient systems. More than a dozen major greenhouse operators expanded controlled-environment capacity since 2023, each requiring extensive purity qualification before committing to full-scale nutrient program specification. Producers offering documented, fertigation-grade purity are capturing greenhouse contracts fastest, while producers without validated purity documentation face growing exclusion from premium horticultural supply chains entirely across affected operations. Analysts expect this qualification gap to widen further.
Market Impact: Adds 8 percent cash crop growth
Premium Produce Export Growth Expands Chloride-Free Demand

Export-oriented fruit and vegetable growers have increasingly standardized chloride-free fertilization programs to meet international quality and shelf-life standards rather than relying entirely on conventional potash blends alone as was common a decade ago. More than a dozen major export-oriented growing regions expanded chloride-free specification since 2023, pulling demand toward producers with dedicated export-quality documentation rather than standard domestic catalogs alone. This export-driven demand is reshaping producer selection criteria, favoring companies offering documented crop quality outcomes over those competing purely on unit pricing alone. Producers slow to adapt risk losing this growing channel entirely to faster-moving competitors.
Market Impact: Shifts 6 percent turf segment volume

Market Opportunities and Growth Drivers

Tobacco and Cash Crop Cultivation Sustains Sulfate Demand

Rising tobacco and other chloride-sensitive cash crop cultivation across Asian and African markets has pulled growers toward potassium sulfate capable of meeting stricter leaf quality and burn characteristic standards that chloride-containing potash formulations cannot reliably satisfy for premium tobacco and cash crop production. Producers report cash crop volume growth of roughly 8% since 2022 across markets expanding tobacco and specialty cultivation. This crop-driven demand is reshaping producer volume economics, rewarding producers with dedicated cash crop agronomic capability over smaller regional houses still producing standard-grade product at commodity pricing nationwide. Adoption is accelerating steadily across every major tobacco-growing region today.
Market Impact: Raises input cost 13 to 20%

Turf and Ornamental Demand Expands Specialty Specification

Rising turf management and ornamental horticulture demand has pulled landscape buyers toward potassium sulfate capable of meeting stricter salt-index and chloride tolerance standards that conventional potash formulations cannot satisfy for salt-sensitive turf and ornamental plant applications. Several major turf management companies expanded specialty sulfate specification across golf course and landscape programs since 2023, reshaping which producers win turf contracts. This specification-driven demand favors producers with dedicated turf-grade documentation over smaller regional houses still focused primarily on field-crop production. Landscape managers increasingly treat salt-index documentation as a core procurement requirement industry-wide.
Market Impact: Adds 9 to 16 percent cost

Market Restraints and Challenges

Sulfuric Acid and Potassium Chloride Feedstock Cost Volatility Risk

Sulfuric acid and potassium chloride inputs together represent close to half of manufacturing cost for a typical potassium sulfate product, and prices for both have swung sharply since 2021 amid broader mining and petrochemical commodity market disruption tied to potash mine capacity shifts and rising competing demand from other fertilizer producers for comparable potassium chloride feedstock supply. The root cause: producers sit downstream of globally traded sulfur and potash markets with limited forward pricing visibility, leaving production cost exposed to macro mining and energy shocks. This volatility compresses producer margin on fixed-price grower contracts.
Market Impact: Adds 210,000 tonnes greenhouse-grade demand

Mannheim Process Energy Intensity Restrains Margin

Potassium sulfate production via the Mannheim process requires substantial thermal energy input per tonne, a limitation rooted in the fundamental chemistry of the high-temperature reaction between potassium chloride and sulfuric acid that requires sustained furnace operation rather than incremental process adjustment to reduce energy demand meaningfully. This creates genuine commercial friction for producers whose regional energy costs directly determine competitiveness against lower-energy-cost rivals in other producing regions. Producers are mitigating the exposure through dedicated process efficiency investment and alternative production route development, though fully closing the energy cost gap remains difficult given the chemistry this production process inherently requires.
Market Impact: Adds 34 new export certification programs
3 additional market trends, 2 additional growth drivers, and 4 additional restraints and challenges are covered in the full report. Contact sales@marketmindsadvisory.com to access the complete intelligence.

Segment CAGR and Growth Architecture

Segmentation follows end-use application within the potassium sulfate market, the classification producers and growers both use for specification and capacity planning, spanning fruits and vegetables, cash crops, cereals and grains, turf and ornamental, greenhouse and specialty crops, and industrial applications across six categories, each tracked separately in producer and grower reporting. Packaging format remains a separate commercial consideration.
potassium-sulfate-market-trends-market-share-analysis-1787581576555

Greenhouse and Specialty Crops

Greenhouse and specialty crops represent the fastest-growing segment as controlled-environment agriculture operators scale hydroponic and fertigation systems that require potassium sulfate with tighter chloride and heavy metal impurity limits than conventional field-grade formulations can reliably deliver. Formulation complexity is meaningful, since solubility, purity thresholds, and nutrient release rate requirements vary across hydroponic, fertigation, and soil-based greenhouse applications, requiring producers to maintain extensive purity qualification capability tailored to individual grower specifications. Producers with dedicated greenhouse-grade depth are capturing disproportionate contract share, commanding average selling prices above standard field-grade alternatives. Demand concentrates among East Asian and European greenhouse operator accounts first, with adoption spreading rapidly into North American controlled-environment agriculture worldwide today.
CAGR 8.1%

Fruits and Vegetables

Fruits and vegetables remain a fast-growing segment as export-oriented growers continue adopting chloride-free fertilization programs that conventional potash blends cannot reliably match for premium produce quality and shelf-life standards demanded by international buyers. This segment overlaps functionally with greenhouse and specialty crops in shared chloride-sensitivity chemistry but is defined specifically by its field and orchard cultivation role rather than controlled-environment production, since buyers qualify producers on measurable crop quality outcomes rather than hydroponic solubility alone. Producers with established field-crop production scale continue capturing volume from export-oriented accounts across mature markets. Growth is fastest in East Asia and Latin America, where premium produce export activity concentrates most heavily today. Suppliers with proven export credentials win renewal contracts steadily.
CAGR 6.5%
Full segment breakdown across 6 segments available in the complete report.

Regional Architecture and Country Demand Map

East Asia leads global consumption on China's dominant chloride-sensitive crop cultivation and domestic manufacturing base, followed by North America and Western Europe on organized horticultural distribution infrastructure, with South Asia and Pacific expanding fastest as India's horticulture sector formalizes rapidly. Latin America contributes meaningful additional volume through steady export growth.

North America

United States premium produce growers and greenhouse operators drive the bulk of regional demand, with producers expanding greenhouse-grade capacity as controlled-environment agriculture investment scales across most major growing regions nationwide today. Canada's smaller but steadily growing greenhouse sector mirrors United States specification trends closely, with a modest adoption lag concentrated mainly in field-crop applications. Export-oriented produce demand continues driving a rising share of regional procurement as growers expand chloride-free fertilization programs. Group purchasing arrangements among regional grower cooperatives increasingly standardize producer qualification criteria across affiliated distribution networks, further concentrating regional demand among suppliers carrying validated purity documentation. Retailers and cooperatives increasingly favor producers that can demonstrate consistent audit performance across multiple purchasing cycles nationwide.
Share: 24% | CAGR: 5.3% (2026 to 2036)

Western Europe

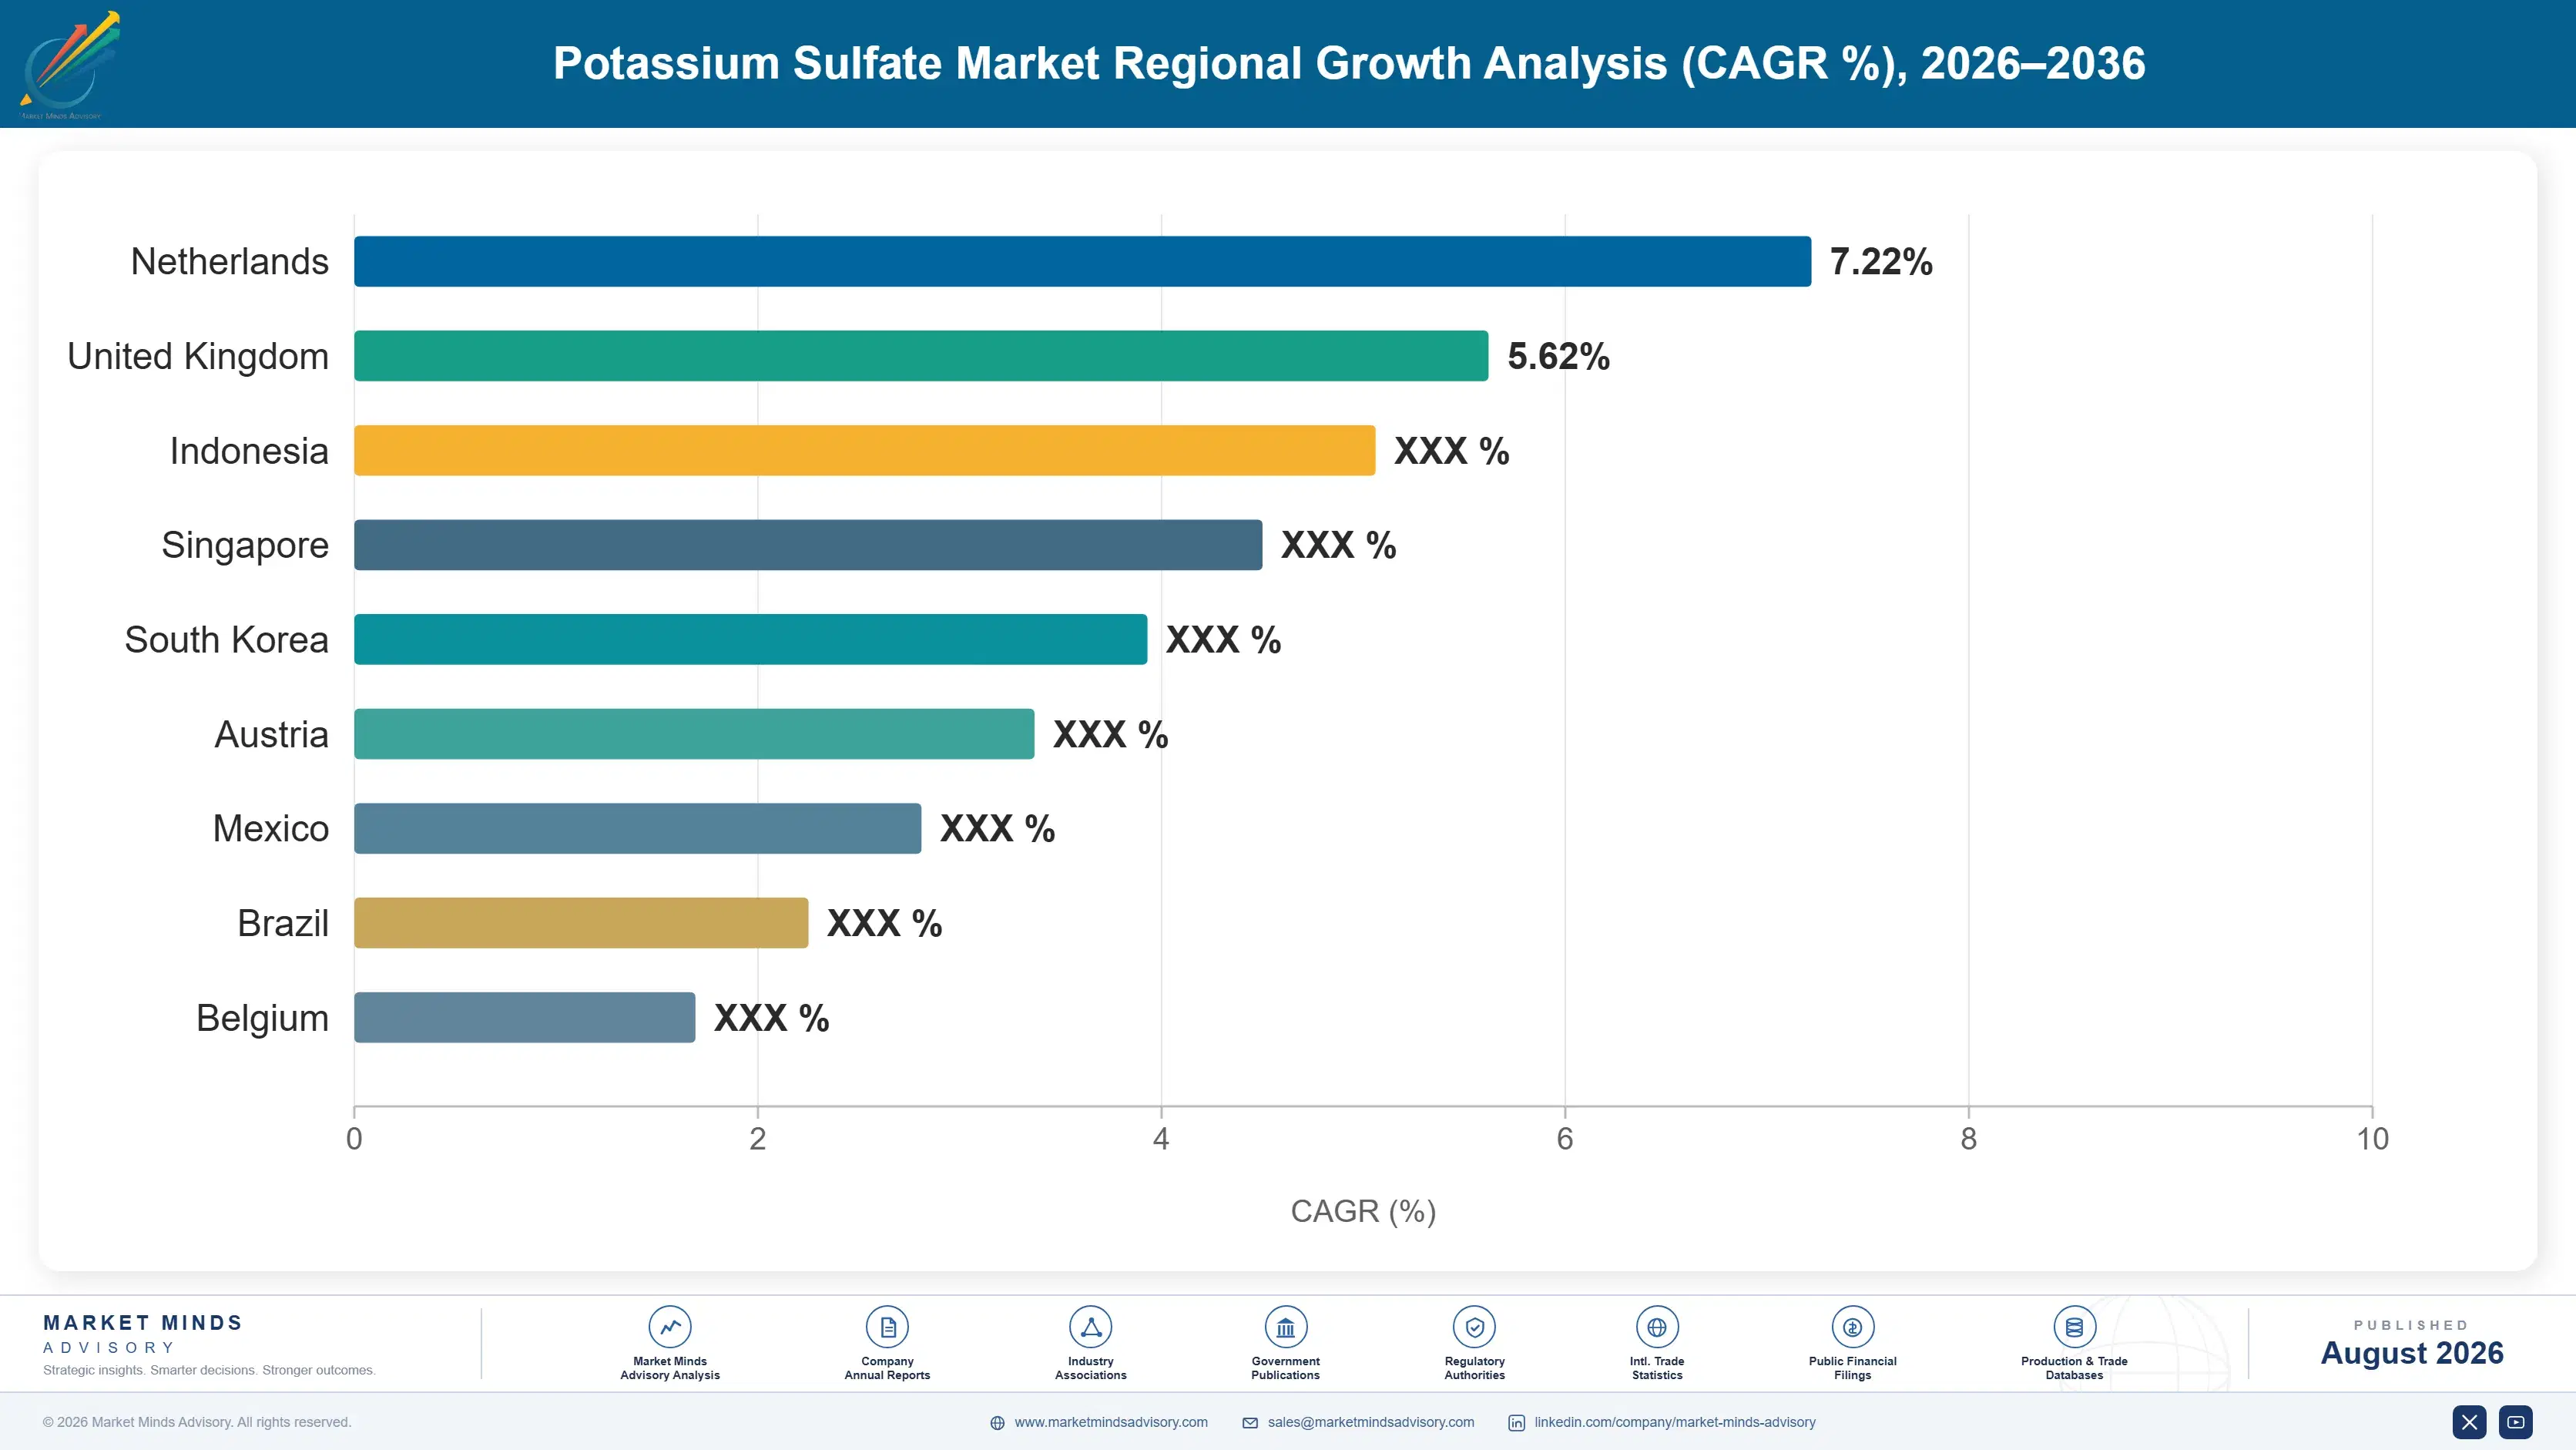
Germany and France anchor regional demand through well-established horticultural and greenhouse sectors that adopted structured purity qualification early given stringent European Union fertilizer regulation, giving regional producers deep certification expertise other markets are only now developing. The Netherlands' greenhouse sector continues expanding fertigation-grade specification targeting major controlled-environment operators willing to invest in documented nutrient purity outcomes. Nordic markets show disproportionate demand for greenhouse-optimized formulations tied to regional controlled-environment agriculture investment. Producer qualification cycles in the region run longer than in North America given stricter European Union chemical regulation and REACH documentation requirements. Manufacturers investing early in regulatory dossier preparation gain a meaningful timing advantage over competitors still navigating slower approval pathways across the bloc, a gap that continues widening.
Share: 20% | CAGR: 4.3% (2026 to 2036)
Regional intelligence for 5 additional markets available in the complete report: East Asia, South Asia and Pacific, Latin America, Middle East and Africa, Eastern Europe. Contact sales@marketmindsadvisory.com.
potassium-sulfate-market-trends-country-cagr-analysis-1787581577082

Where Potassium Sulfate Producers Defend Margin

Producers are shifting from selling commodity fertilizer volume to selling documented agronomic partnership and purity certification, bundling crop trial data, agronomic support, and long-term supply agreements into contracts that command materially higher margin than standard fertilizer supply alone, a transition rewarding formulation depth over raw production scale. Four levers stand out as the clearest paths to margin defense.

Agronomic Trial Data as a Bundled Grower Service

Producers that package dedicated crop trial and agronomic outcome data alongside fertilizer supply are capturing 14 to 21% higher account-level margin than those selling commodity potash alone, since premium growers increasingly require documented yield and quality validation before approving nutrient program specification. This shift favors producers with dedicated agronomic research teams over smaller regional producers lacking trial infrastructure. SQM and K+S have both expanded dedicated agronomic research teams since 2023 specifically to capture this validation-driven premium across major grower accounts. Smaller producers without comparable research infrastructure increasingly struggle to compete for these agronomically-validated contracts.
Market Impact: Lifts account-level margin by 14 to 21 percent

Purity Certification Support for Greenhouse Retention

Offering dedicated purity certification and fertigation compatibility testing lets producers compress greenhouse operator evaluation cycles from a lengthy independent testing process to a bundled certification partnership, directly winning greenhouse contracts ahead of competitors selling standard field-grade product without certification support. This lever works because controlled-environment operators increasingly value ongoing purity validation, making certification depth a commercial differentiator rather than simply a supply relationship. Producers offering this support report contract retention rates roughly 23% higher than those quoting standard supply relationships alone, a gap that widens further with each successive growing season completed.
Market Impact: Lifts contract retention rates by roughly 23 percent

Vertical Integration Into Sulfuric Acid and Potash Sourcing

Producers developing in-house sulfuric acid and potassium chloride sourcing capability are winning premium grower and greenhouse contracts from buyers seeking supply security amid feedstock volatility, capturing account-level pricing 12 to 18% above producers dependent entirely on external feedstock purchasing. This approach requires meaningful capital investment that most smaller regional producers cannot easily fund, concentrating adoption among the largest, best-capitalized potassium sulfate producers currently operating in the category. Early movers report contract renewal rates meaningfully higher than producers still relying entirely on external procurement across major accounts. This gap is expected to widen further as feedstock volatility persists.
Market Impact: Commands a 12 to 18 percent integration premium

Regional Production Co-Location Near Growing Corridors

Establishing potassium sulfate production capacity directly adjacent to fast-growing agricultural corridors in India, Southeast Asia, or Latin America cuts logistics lead time from roughly 4 weeks to 6 days, a decisive advantage for growers running time-sensitive fertigation and seasonal application schedules that cannot absorb supply interruption. Producers with co-located capacity also reduce exposure to the freight cost volatility that periodically disrupts long-haul fertilizer distribution. This lever requires meaningful capital investment, concentrating adoption among the largest global producers rather than mid-sized regional players still serving customers through centralized distribution. That gap continues widening steadily across major accounts.
Market Impact: Cuts lead time from 4 weeks to 6 days

Who Controls the Margin Pool

The top five producers hold an estimated 46% combined share on a production capacity basis, a moderately consolidated market shaped by the Mannheim process infrastructure required to produce sulfate of potash and the decades-long relationships accumulated with major grower cooperatives and horticultural distributors. The gap between established leaders and mid-sized regional challengers is substantial, since agronomic credibility and grower relationship depth typically require years of accumulated investment that newer entrants cannot easily compress.
Current competitive activity centers on three dimensions: racing to expand greenhouse-grade purity capability ahead of rising controlled-environment agriculture demand, building agronomic support depth to win grower loyalty, and establishing regional production capacity closer to Asian and Latin American growing corridors to compress lead times against import-dependent competitors, a race shaping which producers win multi-year grower agreements.

Pressure is building from Chinese regional producers developing lower-cost potassium sulfate formulations that could let smaller, more focused producers challenge established players on price without matching their decades of accumulated agronomic credibility. Regional producers are also gaining share in domestic specification contracts where local delivery reliability and feedstock sourcing proximity matter more than global brand reputation, eroding the advantage multinational producers once held on technical scale alone.
potassium-sulfate-market-trends-company-positioning-matrix-1787581577607

Competitive Moat and Risk Dimensions

SQM

Moat: Dominant integrated brine resource base

SQM's decades-old integrated brine resource and Mannheim process infrastructure across South America give it cost and purity credibility that smaller producers cannot easily replicate, particularly for complex greenhouse-grade projects requiring extensive multi-year agronomic validation across varying regional grower specifications nationwide. This accumulated resource advantage compounds further with every new production cycle completed.
SQM

Risk: High fixed processing-cost base

SQM's extensive integrated processing infrastructure creates a high fixed cost base that smaller, more focused regional competitors do not carry, a constraint that periodically compresses margin when fertilizer volume growth fails to keep pace with the capital investment required to maintain integrated production capacity. Competitors moving faster could exploit this cost gap.
COMPASS MINERALS

Moat: Deep North American distribution depth

Compass Minerals' decades-old integration relationships across North American agricultural distribution networks give it grower relationship and logistics advantages that newer entrants cannot replicate quickly, letting it command premium pricing on documented products at technical depth regional producers cannot consistently match at comparable scale. This accumulated distribution depth remains difficult for competitors to replicate quickly.
COMPASS MINERALS

Risk: Slower Asian expansion pace

Compass Minerals' concentrated North American focus creates organizational inertia that slows its response to fast-moving Asian controlled-environment agriculture trends, leaving openings for more Asia-focused competitors to capture premium accounts before it fully commits regional expansion resources at comparable scale. Competitors moving faster could lock in key accounts first.

Players Tracked

Prominent Players

SQM
Compass Minerals
K+S Group
Tessenderlo Group
ICL Group

Other Key Players

Haifa Group
Yara International
Uralkali
Belaruskali
Migao Corporation
Shandong Nanhua Industry
Ercros SA
Anglo American
Kalium Lakes
EuroChem Group
OCI Nitrogen
Duslo
Yunnan Yuntianhua
Sichuan Chuanheng Chemical
Shandong Kaifeng Chemical

Recent Developments

APRIL 2025

SQM Expands Greenhouse-Grade Capacity in Antofagasta

SQM completed an expansion of its Antofagasta potassium sulfate manufacturing facility, adding dedicated greenhouse-grade purification lines to serve growing global controlled-environment agriculture demand and shorten regional lead times for horticultural customers, with the expanded facility reaching full operational capacity during 2026 across multiple parallel production trains.
Signal: Signals producers increasingly prioritizing greenhouse-grade manufacturing capacity ahead of expanding controlled-environment agriculture investment nationwide across affected regions.
OCTOBER 2024

K+S Group Divests Non-Core Industrial Salt Assets

K+S Group divested a portfolio of non-core industrial salt assets to a specialty minerals buyer as part of portfolio rationalization, redirecting capital toward its core sulfate of potash and specialty fertilizer platforms following several years of broader portfolio expansion that diluted focus on core fertilizer strengths, under tightening capital discipline.
Signal: Indicates continued producer focus toward higher-margin specialty fertilizer capability over diversified industrial salt exposure amid tightening capital discipline industry-wide.
JANUARY 2026

Tessenderlo Group Signs Long-Term Potassium Chloride Supply Agreement

Tessenderlo Group signed a multi-year potassium chloride supply agreement with a major potash mining cooperative, locking in volume and partially insulating input pricing from spot market volatility tied to broader potash commodity market disruption affecting sulfate of potash production across several major European manufacturing sites worldwide.
Signal: Indicates producers favoring long-term feedstock supply agreements over spot purchasing to stabilize input cost exposure across multi-year grower contracts.

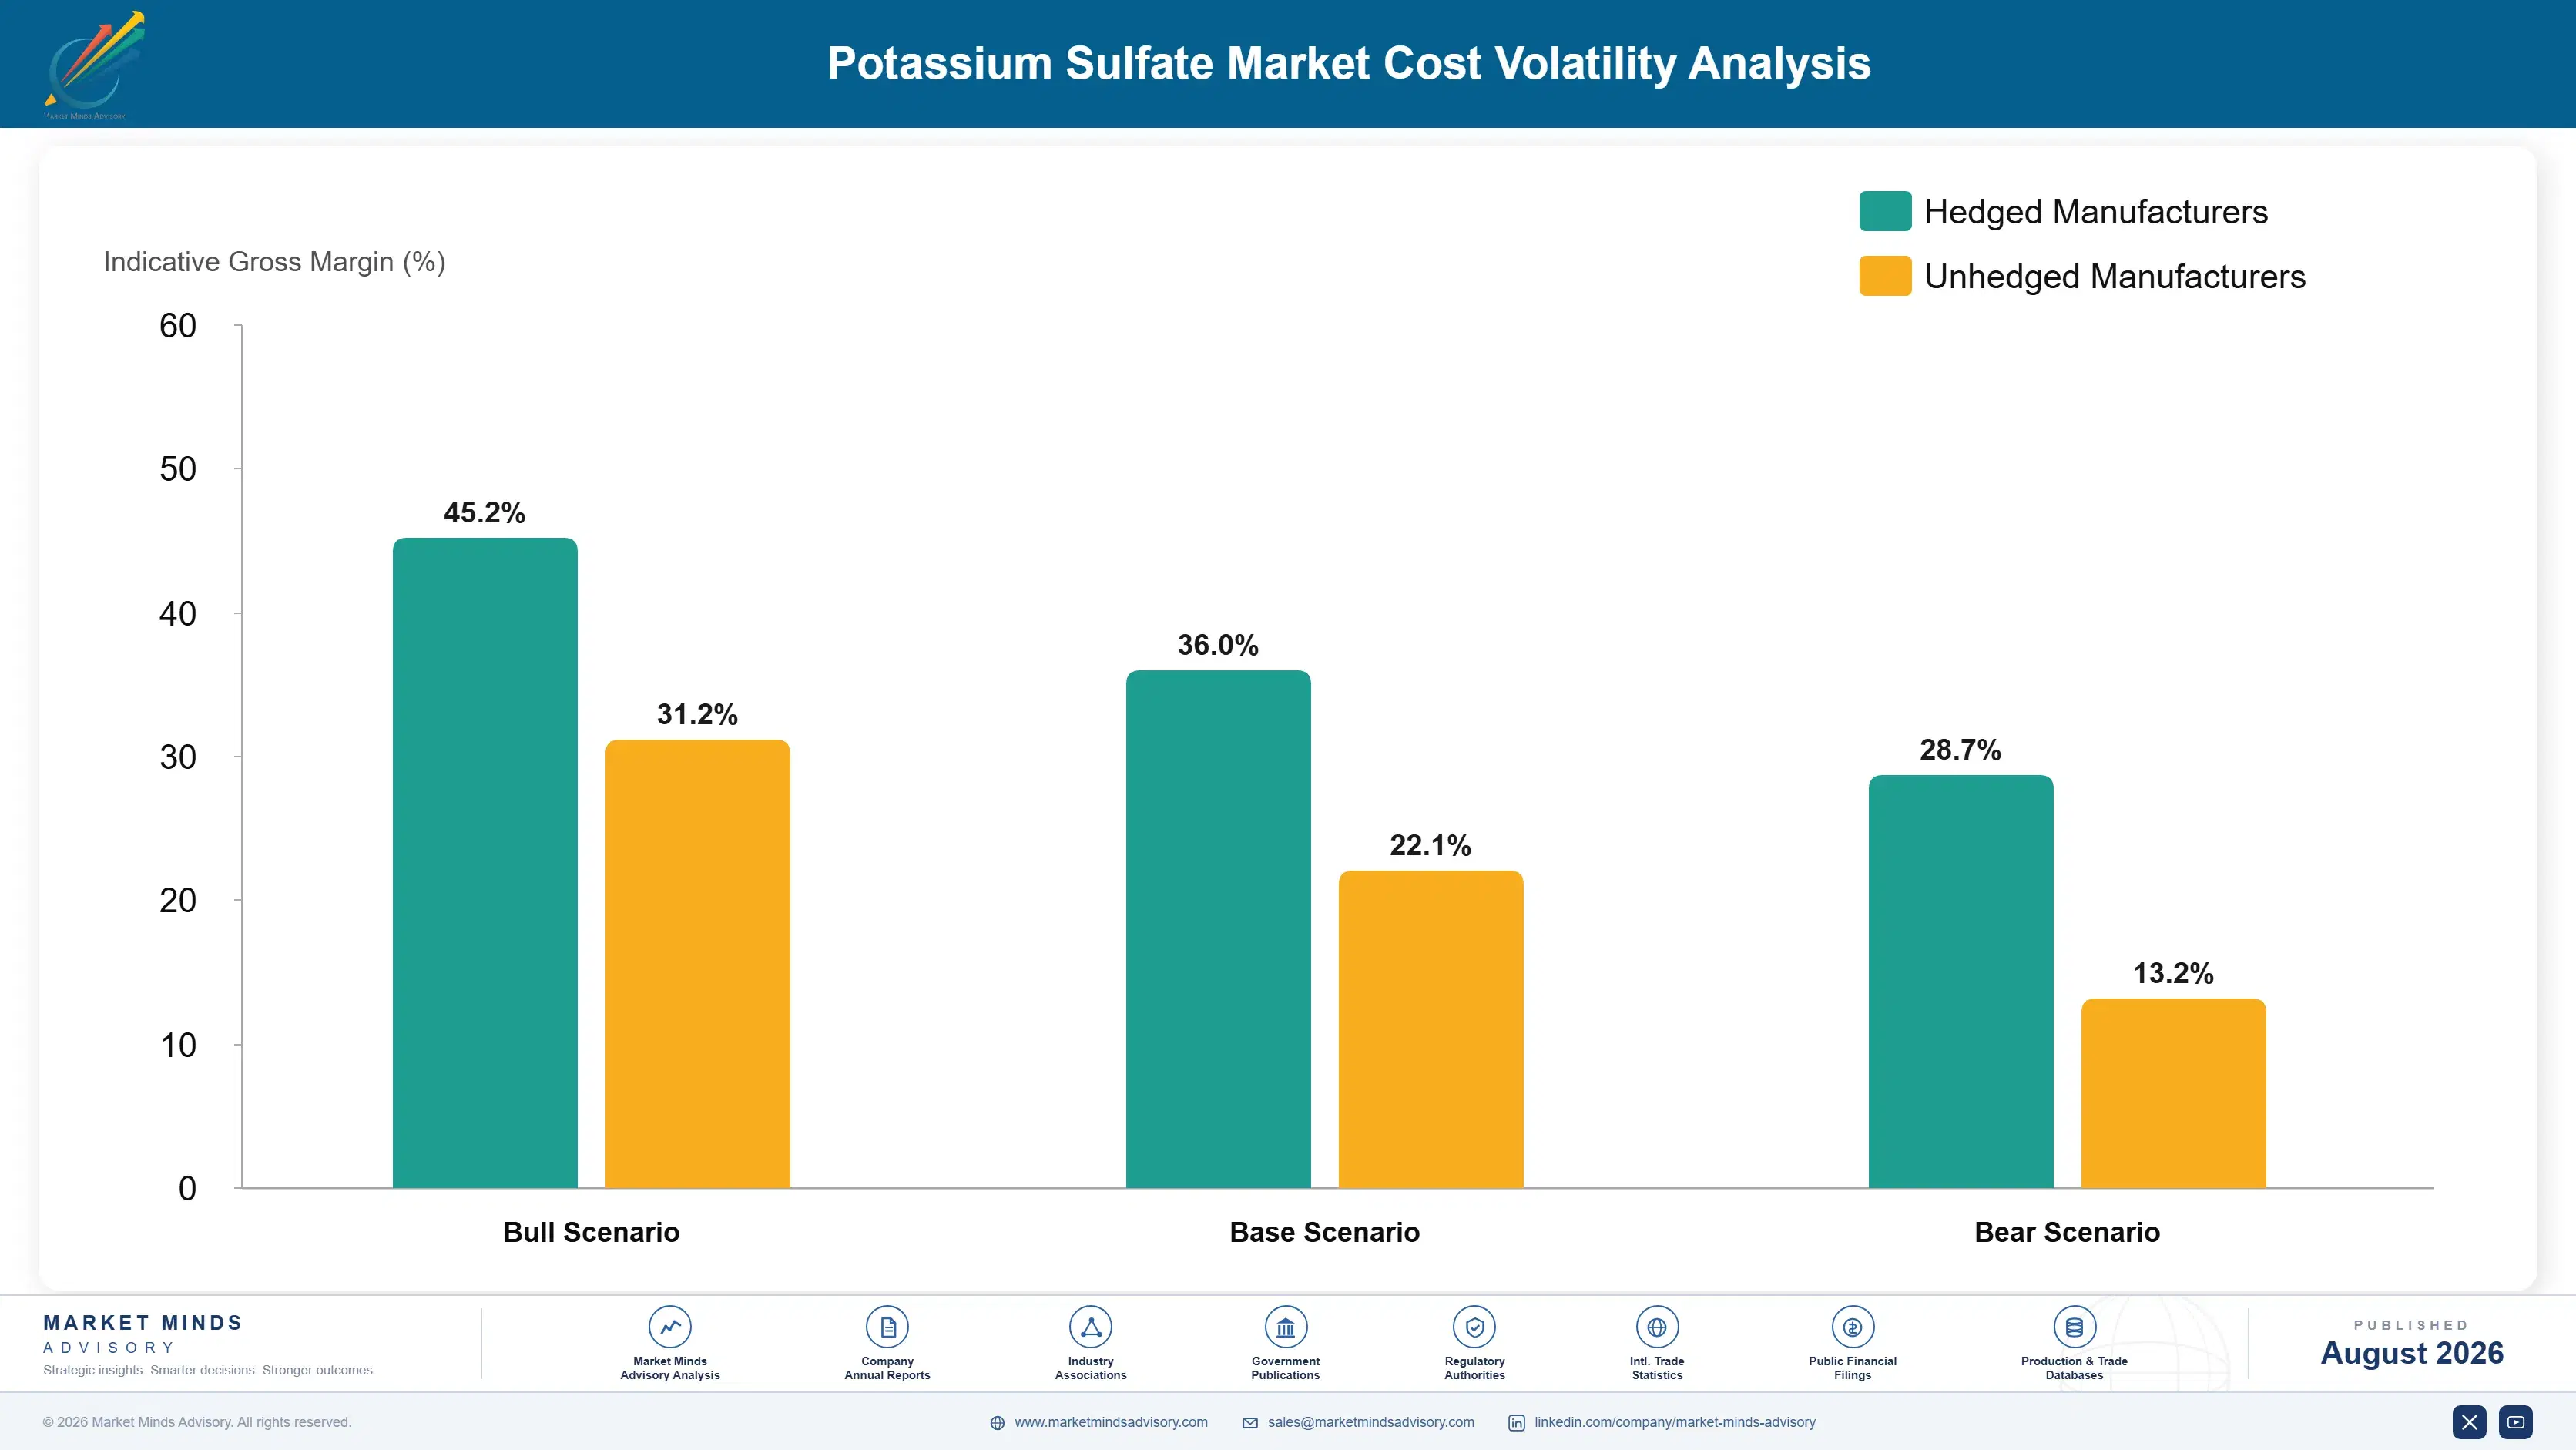
Sulfuric Acid and Potassium Chloride Feedstock Exposure

Sulfuric acid and potassium chloride inputs together represent roughly 47% of cost of goods sold for a typical potassium sulfate product, with potassium chloride alone accounting for close to a quarter of total input cost given its role as the primary Mannheim process feedstock. Producers with narrower feedstock diversification face heightened exposure during tightened supply periods and currency swings.
Potassium chloride prices rose an estimated 26% between 2021 and 2022 following broader potash commodity market disruption tied to mine capacity constraints and geopolitical supply disruption from major producing regions, according to trade data tracked through the US Department of Agriculture and corroborated by manufacturer annual report commentary on input cost pressure during the period, with several producers citing the disruption explicitly in investor communications as a material margin headwind.

Larger producers with diversified feedstock sourcing across multiple regions absorb volatility more effectively than smaller regional producers dependent on single-origin supply contracts. This creates a lasting cost disadvantage for smaller players during disruption periods, pushing some toward increased use of alternative potassium sourcing despite the technical qualification work those alternatives require across affected production lines, widening the gap during acute disruption cycles.
potassium-sulfate-market-trends-cost-volatility-analysis-1787581577802

Multi-Origin Feedstock Sourcing Diversification

Producers are qualifying sulfuric acid and potassium chloride origins across North America, Europe, and Asia alongside traditional supply relationships, reducing single-region concentration risk even though full substitution remains limited by purity requirements, a process several major producers accelerated significantly following the 2021 to 2022 potash price disruption that first exposed the category's sourcing vulnerability clearly.

Alternative Production Route Development

Several producers are investing in glaserite conversion and Great Salt Lake brine processing technology to reduce dependency on volatile Mannheim process economics entirely, offering long-term energy cost stability once conversion capacity scales, though current alternative routes remain meaningfully more capital-intensive than traditional Mannheim production at present commercial volumes across most facilities. Adoption is accelerating steadily among larger producers.

Long-Term Supply Contracts With Potash Producers

Several producers have signed multi-year supply agreements directly with sulfuric acid and potassium chloride producers, locking in volume and partially insulating pricing from spot market volatility during acute disruption periods tied to mine capacity shocks or competing fertilizer industry demand shifts, giving contracted producers materially more predictable input costs than competitors relying on spot purchasing alone.

Portfolio Architecture for Margin Defence

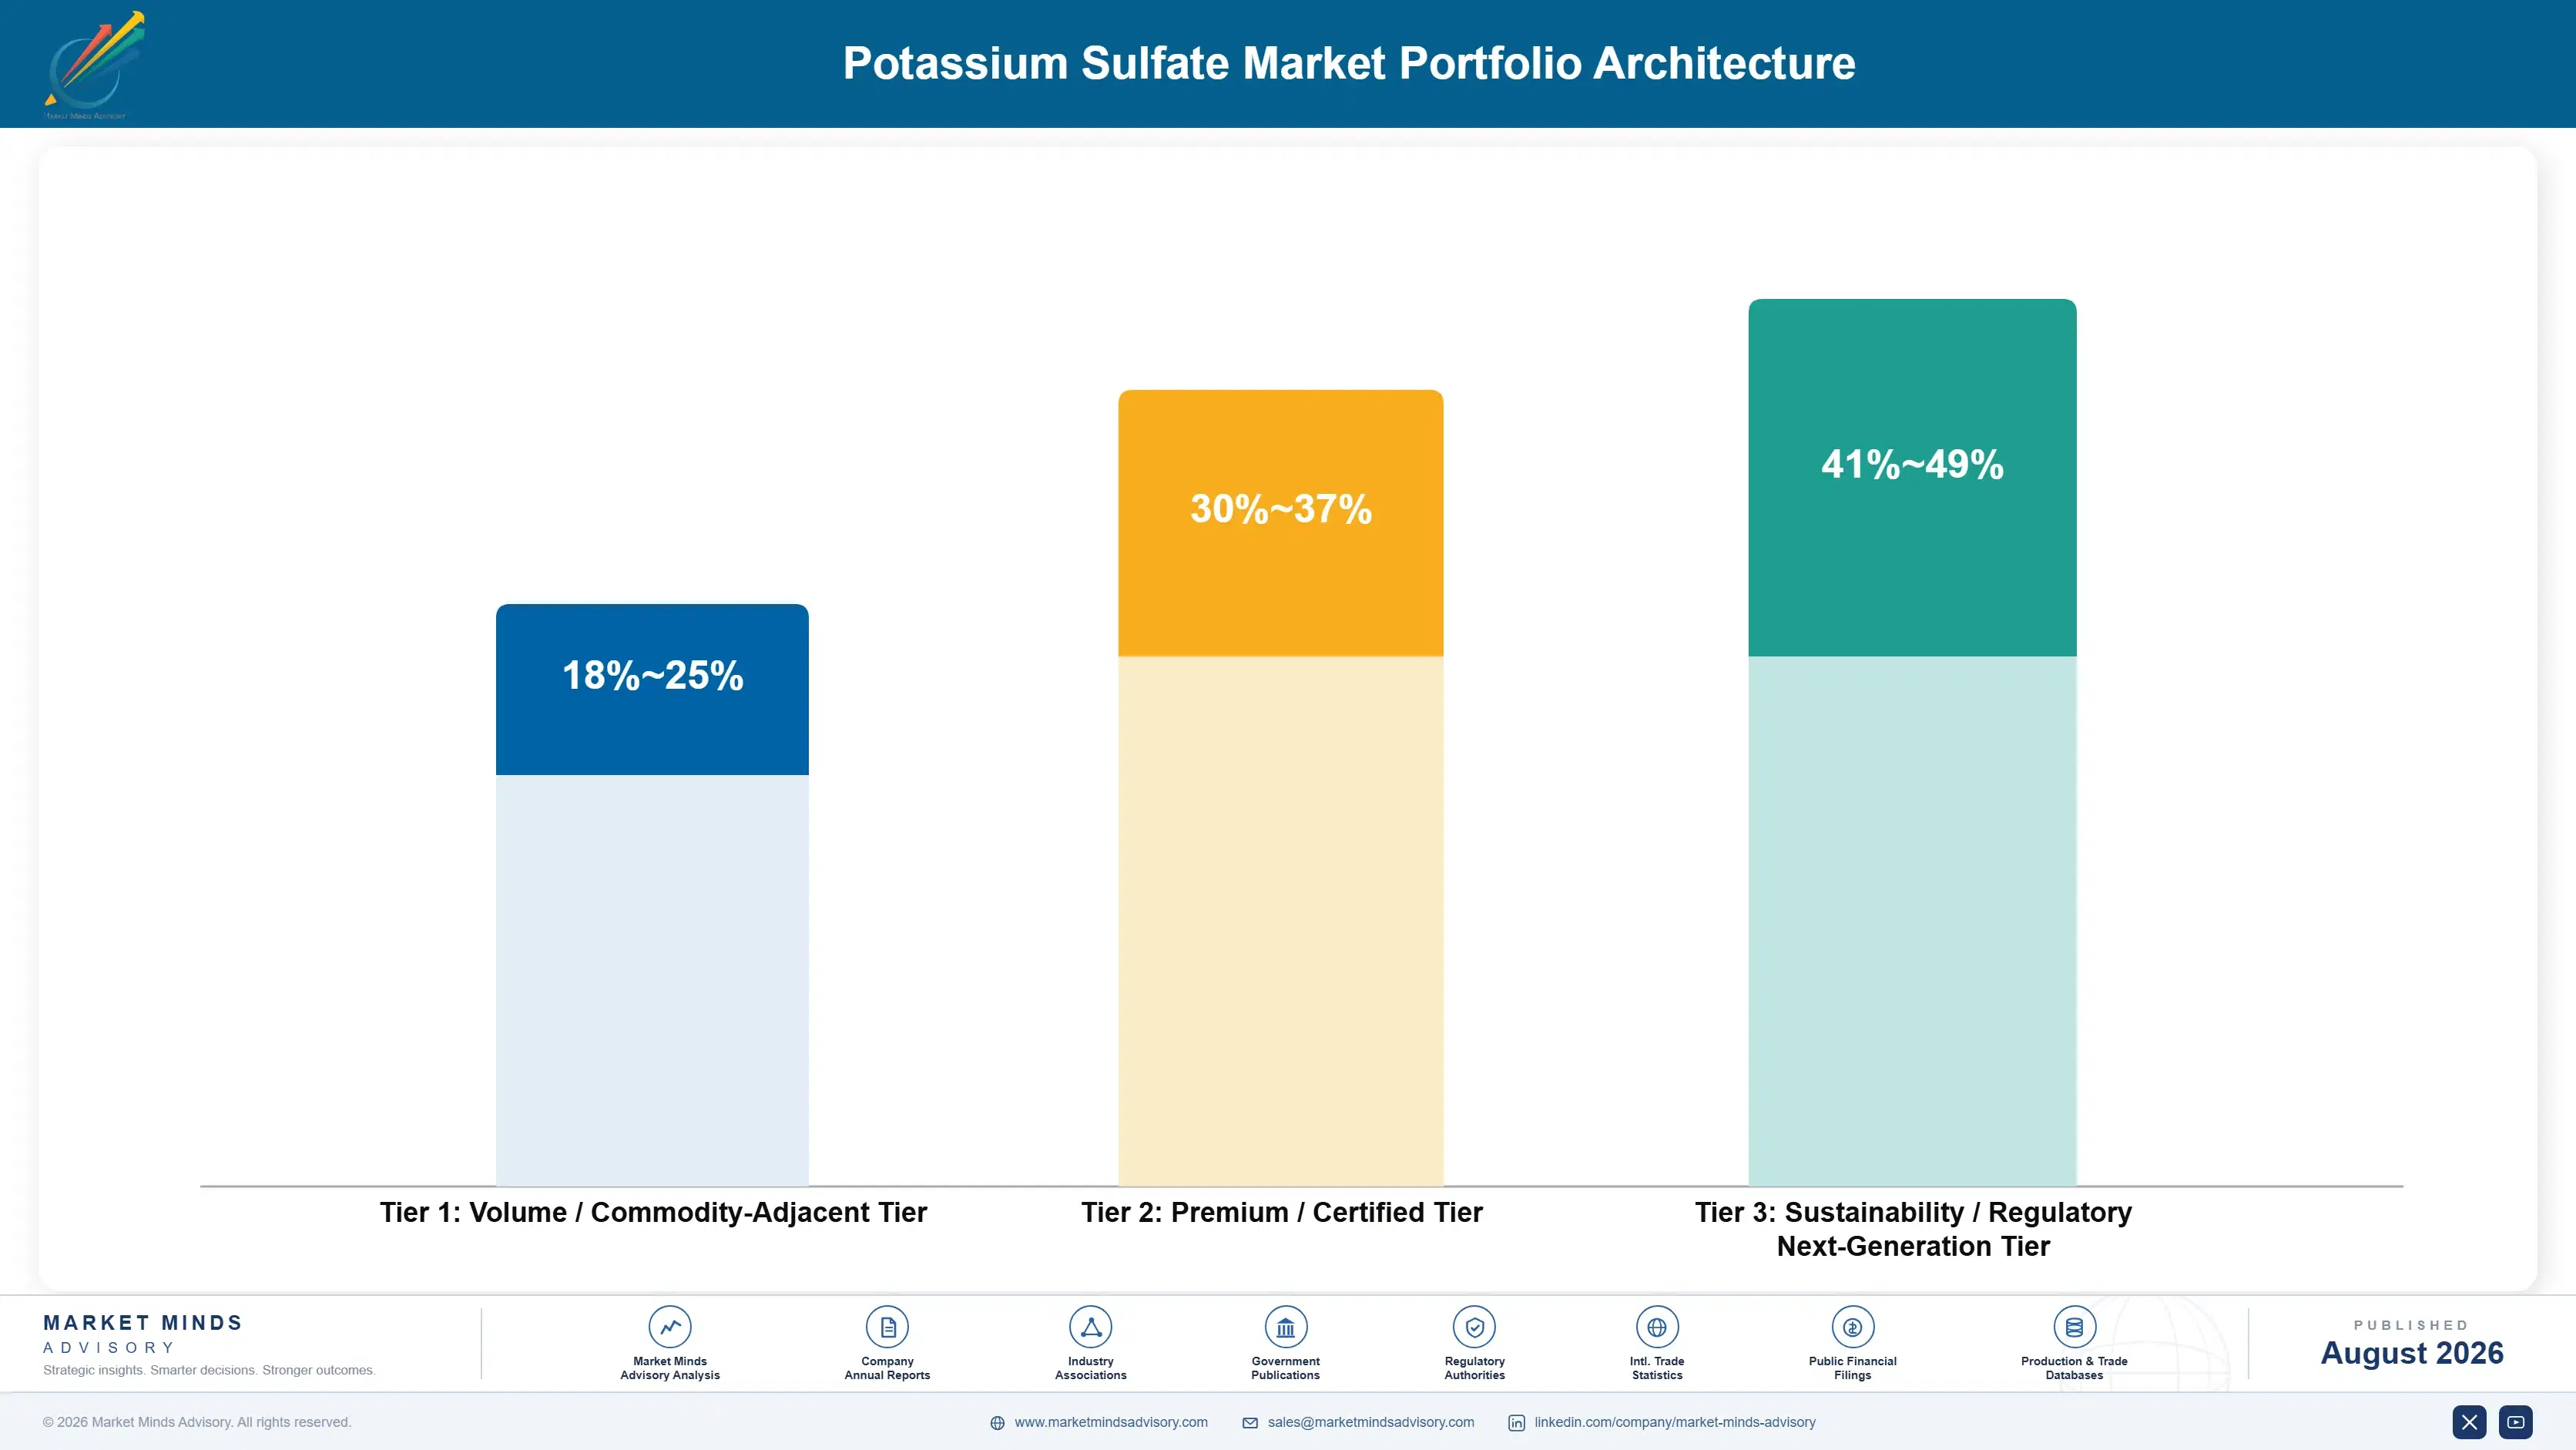
The portfolio splits across three tiers with materially different margin economics: volume-grade standard field-crop potassium sulfate carrying thin margins under intense price competition, certified premium export-grade and turf formulations commanding a meaningful premium, and next-generation greenhouse and fertigation-grade systems capturing the highest margins currently available in the category, a spread wide enough that purity investment strategy now matters more to producer profitability than raw production volume, a squeeze intensifying as buyers demand ever-tighter documentation from every qualified supplier.
The volume versus premium tension is acute right now because premium growers and greenhouse operators increasingly demand documented purity and agronomic credentials, compressing the addressable market for standard field-grade product faster than producers can shift capacity toward higher-value alternatives, leaving some producers holding underutilized legacy production lines across several manufacturing regions, a squeeze intensifying as buyers demand ever-tighter documentation from every qualified supplier.

High-value margin pools concentrate specifically in greenhouse fertigation-grade formulations and export-certified premium produce systems carrying multi-grower certification, both of which command premium pricing tied to purity complexity and agronomic documentation depth rather than raw material cost alone, rewarding producers with diversified feedstock sourcing that invested early in purity technology over those competing purely on scale.

Volume / Commodity-Adjacent Tier

Standard field-crop potassium sulfate sold primarily on price into mainstream agricultural applications, facing intense competitive pressure from regional producers and carrying thin, increasingly squeezed margins as buyers shift toward certified, higher-value systems.
Gross Margin: 18%-25%

Premium / Certified Tier

Export-grade and turf formulations commanding premium pricing tied to documentation, regulatory compliance support, and validated crop quality performance across demanding export and landscape applications that commodity potash cannot reliably match at comparable manufacturing scale.
Gross Margin: 30%-37%

Sustainability / Regulatory / Next-Generation Tier

Greenhouse and fertigation-grade systems serving premium controlled-environment and food security applications at the highest technical complexity, commanding premium pricing tied to purity engineering few competitors currently possess at meaningful commercial scale today worldwide.
Gross Margin: 41%-49%
potassium-sulfate-market-trends-portfolio-architecture-1787581578301

High-value Sub-segments and Strategic Watch-out

Greenhouse Fertigation-Grade Systems

Highest-value, fastest-growing segment driven by expanding controlled-environment agriculture demand, commanding premium pricing on purity qualification technology competitors cannot easily replicate, since building comparable agronomic credibility typically requires several more years of dedicated trial investment across multiple grower accounts. Early movers hold a durable edge. Regulatory credibility compounds steadily.
Gross Margin: 43%-51%

Export-Certified Premium Produce Formulations

High-value segment growing steadily as export buyers extend quality compliance into documented chloride-free targets, with margin supported by agronomic engineering rather than raw technical complexity alone, favoring producers with strong documentation capability. Momentum is expected to broaden across categories. Early adoption concentrates among leading export-focused growers currently.
Gross Margin: 34%-42%

Standard Field-Crop Potassium Sulfate

Volume core of the category, serving mainstream agricultural applications with stable but thin margins under sustained price competition among producers, where production scale and distribution efficiency matter more than technical sophistication for winning large-volume contracts across mature and expanding export markets today. Margins remain steady but thin.
Gross Margin: 19%-26%

Legacy Non-Certified Commodity Grades

Strategic watch-out segment facing steady, accelerating decline as purity and export quality requirements both favor higher-value certified alternatives, leaving producers reliant on this tier exposed to shrinking addressable volume and thinning margin over time as growers complete their fertilization upgrade programs across every major agricultural market worldwide.
Gross Margin: 9%-15%

Grower Relationships and Producer Loyalty

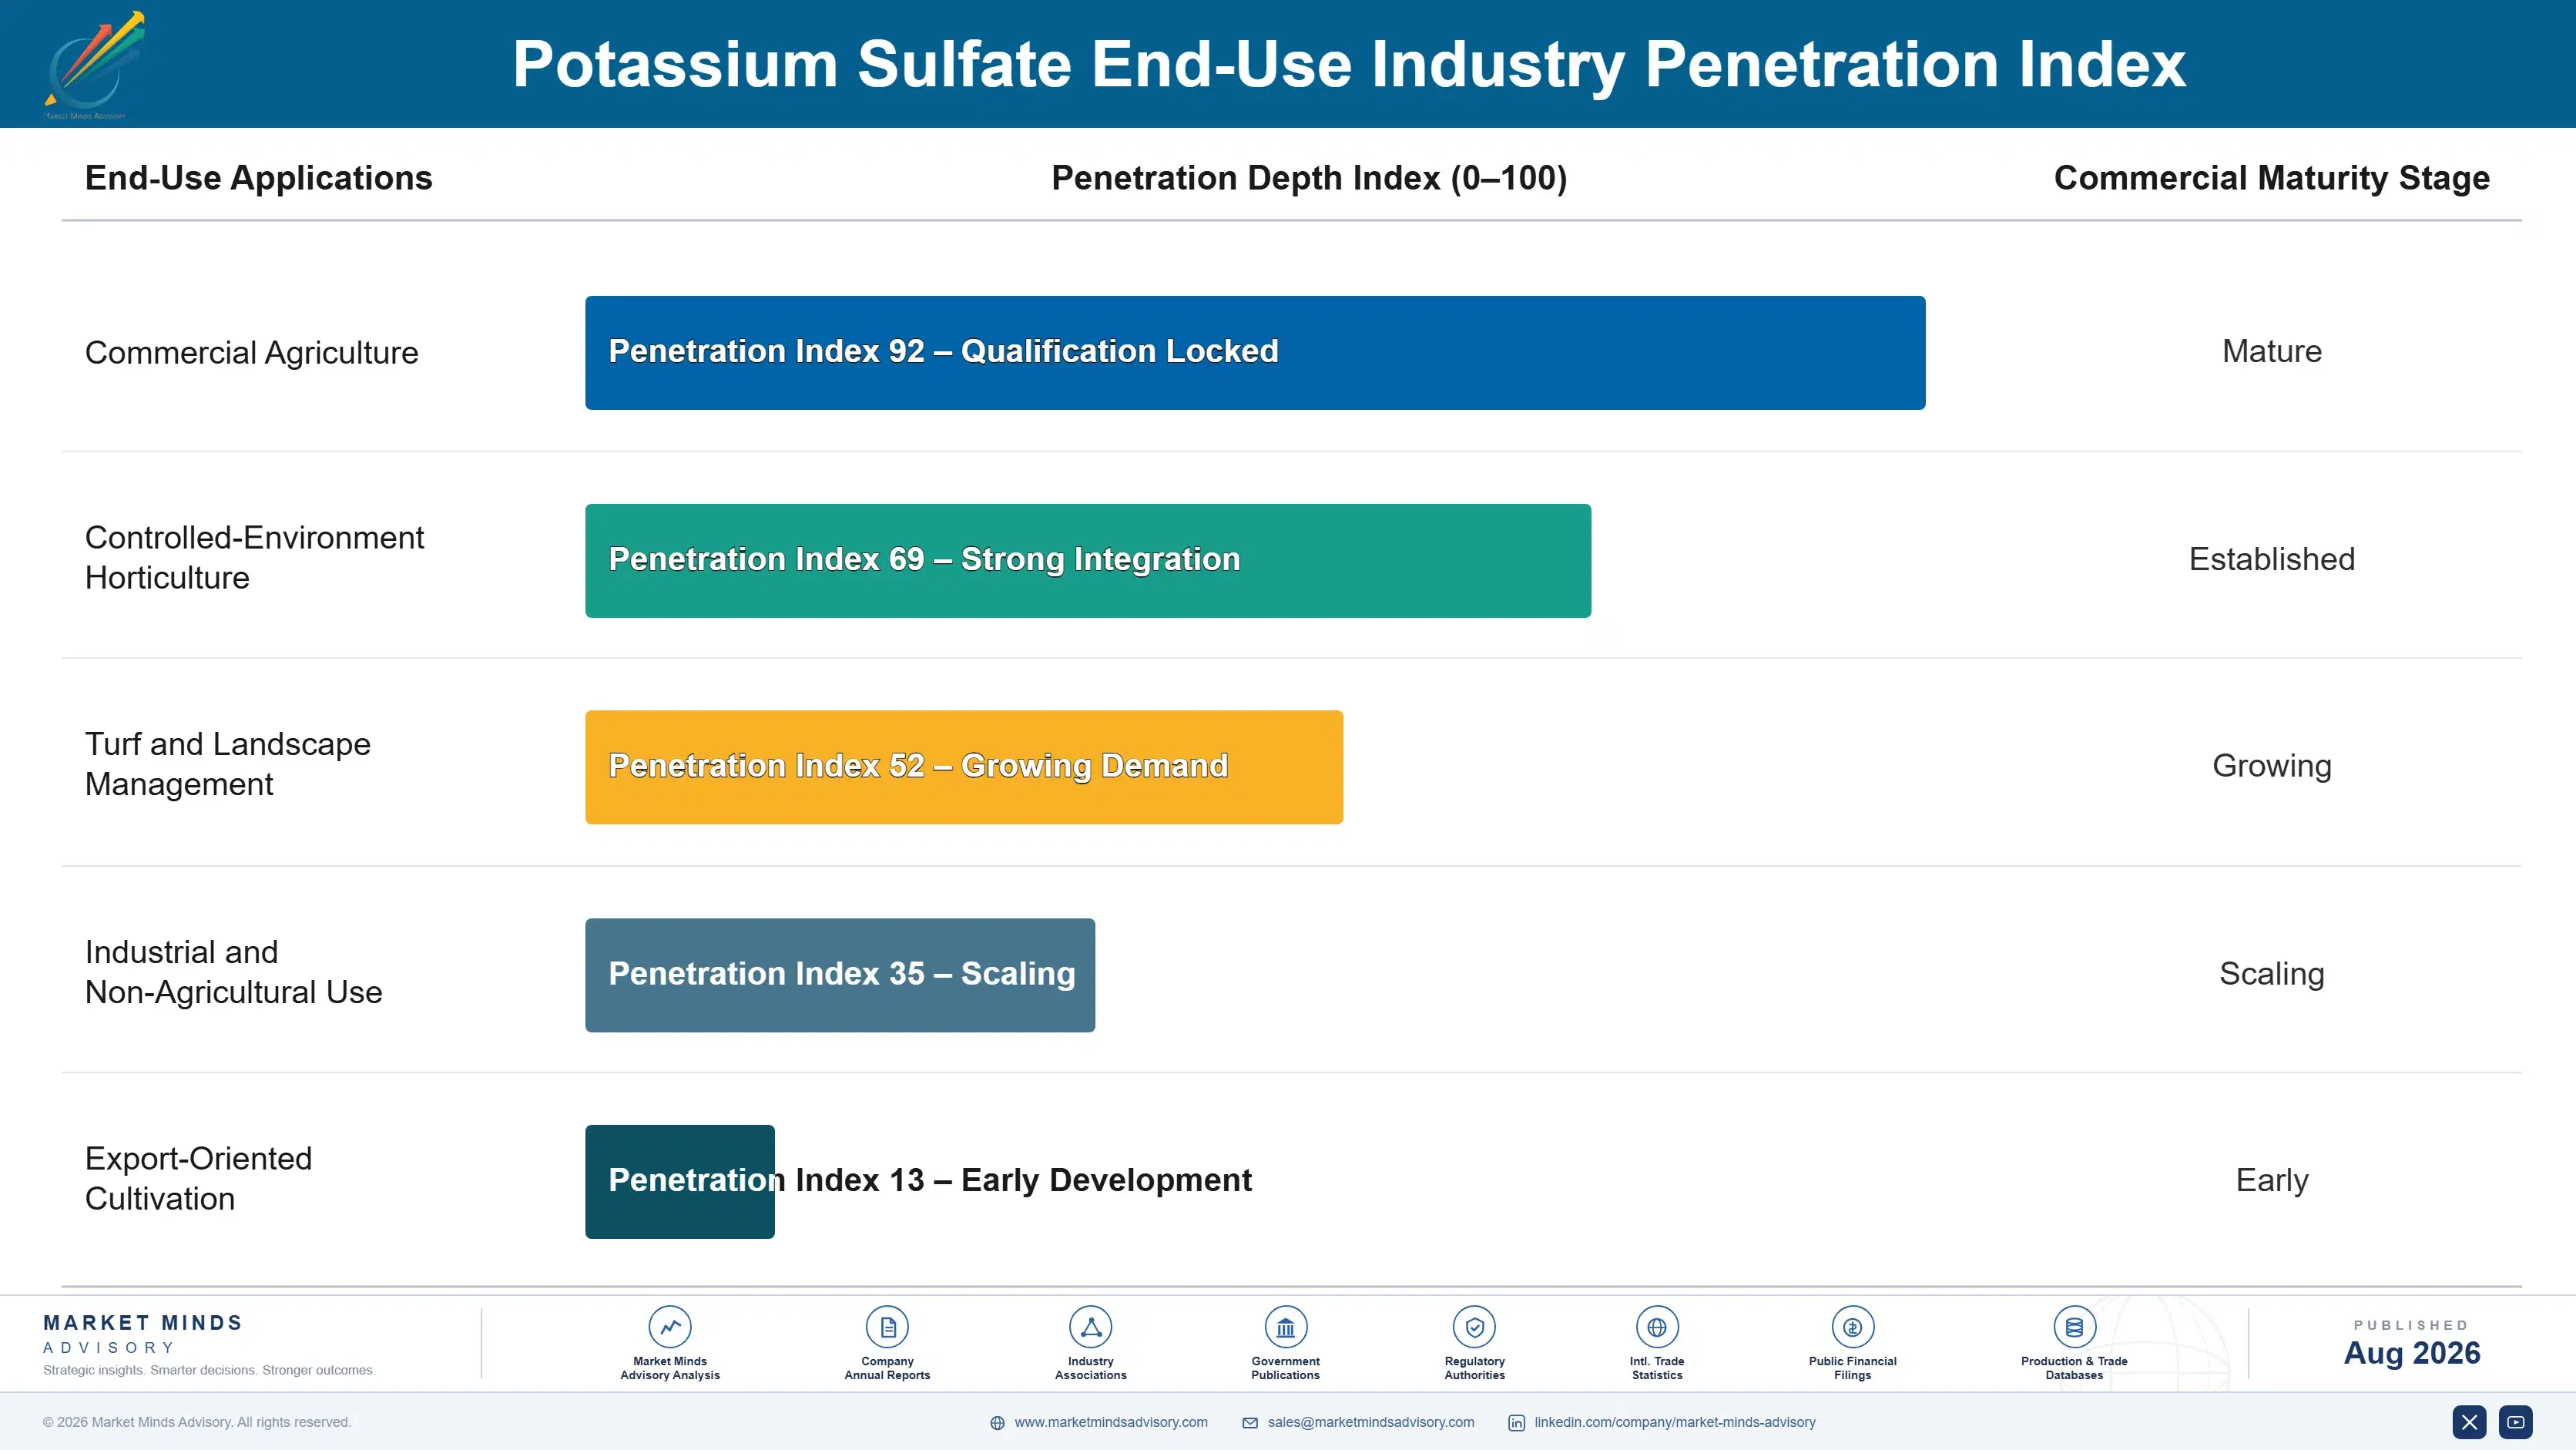
Potassium sulfate demand behaves like an annuity once a producer wins a grower's fertilization program specification, since growers rarely re-qualify producers mid-season given the cost and risk of crop disruption and agronomic revalidation, giving incumbent producers multi-year revenue visibility on won accounts, a dynamic that makes initial specification wins disproportionately valuable relative to their first-year revenue alone. Renewal cycles typically span two to four years tied to crop rotation planning.
Adoption depth varies sharply by end-use vertical: established North American and European greenhouse and export produce relationships show the deepest, most entrenched producer relationships given decades-long purity stability, while emerging Indian and Southeast Asian horticultural categories remain more contestable as grower cooperatives actively experiment with new producers during early modernization phases, when switching costs remain low and specifications have not yet been finalized.

A generational shift in buyer profiles is underway as younger, precision-agriculture and export-quality-focused procurement teams at grower cooperatives, increasingly focused on documented crop outcomes and agronomic data, prioritize documented purity transparency and diversified feedstock sourcing over the decades-long supplier relationships and standard-grade specifications that defined procurement at legacy growers still relying on outdated fertilization practices.
potassium-sulfate-market-trends-end-use-penetration-index-1787581578791

Priorities for Potassium Sulfate Producers

These are among the four positions where our research anticipates prominent divergence between winners and laggards over the coming forecast period. Each is grounded in the demand model, the regulatory perimeter, and the announced capacity pipeline.
01 / PURITY CERTIFICATION PRIORITY

Accelerate greenhouse-grade documentation ahead of demand

Producers still lacking documented greenhouse-grade purity evidence face a shrinking addressable market as controlled-environment agriculture expectations and export quality standards tighten simultaneously across major growing regions nationwide and internationally today. The window to pre-build purity portfolios against expanding grower benchmarks is narrowing quickly as faster-moving competitors capture premium contracts ahead of producers still completing internal purity validation. Producers that delay risk losing multi-year grower relationships to faster-moving rivals carrying validated purity documentation into every specification renewal, a gap that compounds steadily with every cycle missed.
02 / FEEDSTOCK SOURCING DIVERSIFICATION

Reduce single-origin concentration risk across regions

Single-region feedstock dependency has produced repeated price shocks tied to sulfuric acid and potassium chloride market volatility over the past several years, directly compressing margins for producers without diversified sourcing across North America, Europe, and Asia. Qualifying multiple feedstock origins reduces exposure meaningfully, though full substitution requires purity validation since composition differs across sources. Producers that fail to diversify remain persistently vulnerable to the next feedstock disruption event affecting their primary supply base without a diversified strategy already in place.
03 / GREENHOUSE INVESTMENT PRIORITY

Build fertigation expertise ahead of specialty demand

Greenhouse fertigation-grade systems represent the fastest-growing and highest-margin segment, but require purity qualification infrastructure and solubility validation that most commodity-focused producers currently lack entirely, particularly around multi-grower certification work. Building this capability now positions producers to capture premium controlled-environment accounts before the segment fully matures and margins inevitably compress under intensifying competitive pressure from new entrants entering the category. Late entrants will face steeper technical catch-up costs, arriving after early movers have already locked in the accounts that matter most.
04 / REGIONAL CAPACITY PLACEMENT

Prioritize South Asian and East Asian production co-location

Rapid horticultural growth in India and Southeast Asia alongside expanding East Asian premium produce cultivation make co-located production increasingly decisive for lead time performance and overall cost competitiveness. Producers still serving these markets through centralized export face a growing cost and speed disadvantage against regionally established competitors already operating co-located capacity closer to major growing corridors. Capital committed to regional capacity now compounds advantage steadily as horticultural volume continues expanding through the forecast period, an edge that deepens meaningfully across successive renewal cycles ahead.

Engagement Snapshot From the Field

A live engagement with an industry participant carrying material or product regulatory and market exposure ahead of a defining policy shift, showing how our research translates into a defensible multi-year portfolio strategy.
MARKET MINDS ADVISORY · CLIENT ENGAGEMENT SUMMARY
Potassium Sulfate Producer Strategic Portfolio Review and Transition Roadmap 2026·Investment Scenario on Potassium Sulfate Exposure Evaluation 2025-26
CLIENT PROFILE
The client is a mid-sized regional grower cooperative operating several thousand acres of premium produce cultivation across California's Central Valley, with reported annual fertilizer procurement spend exceeding 14 million dollars (client-reported, unverified by MMA) across its full membership base prior to engaging MMA for producer selection support ahead of a chloride-free transition initiative spanning multiple crop categories.
STRATEGIC CHALLENGE
Facing rising export buyer quality audit pressure with a nine-month transition deadline, the cooperative's fragmented supplier relationships across five different regional producers created inconsistent purity documentation, risking export disqualification across its largest member accounts if a consolidated sourcing strategy could not be established quickly. Internal agronomic leadership lacked the bandwidth to evaluate competing producer proposals independently within the available window.
MMA APPROACH
MMA conducted a producer capability assessment across six candidate potassium sulfate suppliers, benchmarking purity documentation depth, agronomic support capability, and regional delivery reliability, then facilitated a structured consolidation process that compressed the cooperative's typical procurement evaluation timeline substantially against historical cycles, drawing on MMA's primary survey and expert interview data throughout the engagement.
KEY FINDINGS
  1. Only three of six evaluated producers had export-grade documentation covering all crop categories the cooperative's membership required, a gap the cooperative had not previously quantified.
  2. Consolidating to three primary producers reduced projected export quality flags from an estimated 15% to under 6% across affected crop categories, exceeding the cooperative's initial improvement target.
  3. Feedstock sourcing diversification among finalist producers correlated strongly with the pricing stability commitments the cooperative required for multi-year contract terms, a factor weighted heavily during final scoring.
  4. Bundled agronomic support and purity documentation services materially reduced the cooperative's internal quality assurance burden during the entire transition period, freeing staff for higher-value agronomic planning tasks.
CLIENT PROFILE
The client is a mid-sized regional grower cooperative operating several thousand acres of premium produce cultivation across California's Central Valley, with reported annual fertilizer procurement spend exceeding 14 million dollars (client-reported, unverified by MMA) across its full membership base prior to engaging MMA for producer selection support ahead of a chloride-free transition initiative spanning multiple crop categories.
STRATEGIC CHALLENGE
Facing rising export buyer quality audit pressure with a nine-month transition deadline, the cooperative's fragmented supplier relationships across five different regional producers created inconsistent purity documentation, risking export disqualification across its largest member accounts if a consolidated sourcing strategy could not be established quickly. Internal agronomic leadership lacked the bandwidth to evaluate competing producer proposals independently within the available window.
MMA APPROACH
MMA conducted a producer capability assessment across six candidate potassium sulfate suppliers, benchmarking purity documentation depth, agronomic support capability, and regional delivery reliability, then facilitated a structured consolidation process that compressed the cooperative's typical procurement evaluation timeline substantially against historical cycles, drawing on MMA's primary survey and expert interview data throughout the engagement.
KEY FINDINGS
  1. Only three of six evaluated producers had export-grade documentation covering all crop categories the cooperative's membership required, a gap the cooperative had not previously quantified.
  2. Consolidating to three primary producers reduced projected export quality flags from an estimated 15% to under 6% across affected crop categories, exceeding the cooperative's initial improvement target.
  3. Feedstock sourcing diversification among finalist producers correlated strongly with the pricing stability commitments the cooperative required for multi-year contract terms, a factor weighted heavily during final scoring.
  4. Bundled agronomic support and purity documentation services materially reduced the cooperative's internal quality assurance burden during the entire transition period, freeing staff for higher-value agronomic planning tasks.
RECOMMENDED STRATEGY
Phase 1: Phase 1 (Months 1 to 2): Complete producer capability benchmarking and shortlist finalists based on purity depth and sourcing diversification. Phase 2: Phase 2 (Months 3 to 6): Run parallel field trials and staff training against export quality benchmarks for finalist producers. Phase 3: Phase 3 (Months 7 to 9): Execute phased crop-by-crop transition and finalize long-term supply agreement with selected producers across the cooperative's full membership base.
OUTCOME
The client completed chloride-free transition across its full membership base within the deadline, achieving quality improvements reported to represent a majority of the cooperative's total target improvement (client-reported, unverified by MMA), while establishing a diversified three-supplier sourcing structure reducing future disruption risk across its full membership base going forward.

Frequently Asked Questions

Foundational context covering the market sizes, CAGR, scope, country, region and competition that inform every finding below. This section is provided to cover basics and most often pre-purchase conversations, answered from the MMA Primary Research Dataset.

What is the current size of the Potassium Sulfate Market?

The global potassium sulfate market is valued at approximately USD 8.5 billion in 2025. This figure covers fruits and vegetables, cash crops, cereals, turf, greenhouse, and industrial applications.

How large will the Potassium Sulfate Market be by 2036?

The market is projected to reach approximately USD 15.8 billion by 2036 under the base case scenario. This reflects sustained premium produce export growth and controlled-environment agriculture demand.

What is the CAGR for the Potassium Sulfate Market 2026 to 2036?

The base case CAGR is 5.8% across the 2026 to 2036 forecast period, reflecting steady chloride-free demand momentum. Bull and bear scenarios range from 4.5% to 7.0% depending on feedstock price stability.

Which segment is growing fastest?

Greenhouse and specialty crops are the fastest-growing segment at an 8.1% CAGR. This reflects controlled-environment agriculture operators scaling hydroponic and fertigation systems across every major growing region worldwide.

Who are the major companies in the Potassium Sulfate Market?

Leading producers include SQM, Compass Minerals, K+S Group, Tessenderlo Group, and ICL Group. These five companies hold an estimated 46% combined market share on a production capacity basis.

Which country is growing fastest?

China leads growth at an estimated 7.4% CAGR, driven by expanding tobacco and premium produce cultivation. Rising chloride-free specification is the primary growth engine nationwide.

Report Segmentation Architecture

The full report scope spans multiple orthogonal segmentation dimensions, with cross-tabulated demand data provided for each dimension pair. Coverage extends further to regional breakdowns, trend trajectories, and the competitive detail needed to support segment-level decision-making.

By End-Use Application

  • Fruits and Vegetables
  • Cash Crops
  • Cereals and Grains
  • Turf and Ornamental
  • Greenhouse and Specialty Crops
  • Industrial Applications

By End-Use Industry

  • Commercial Agriculture
  • Controlled-Environment Horticulture
  • Turf and Landscape Management
  • Industrial and Non-Agricultural Use
  • Export-Oriented Cultivation

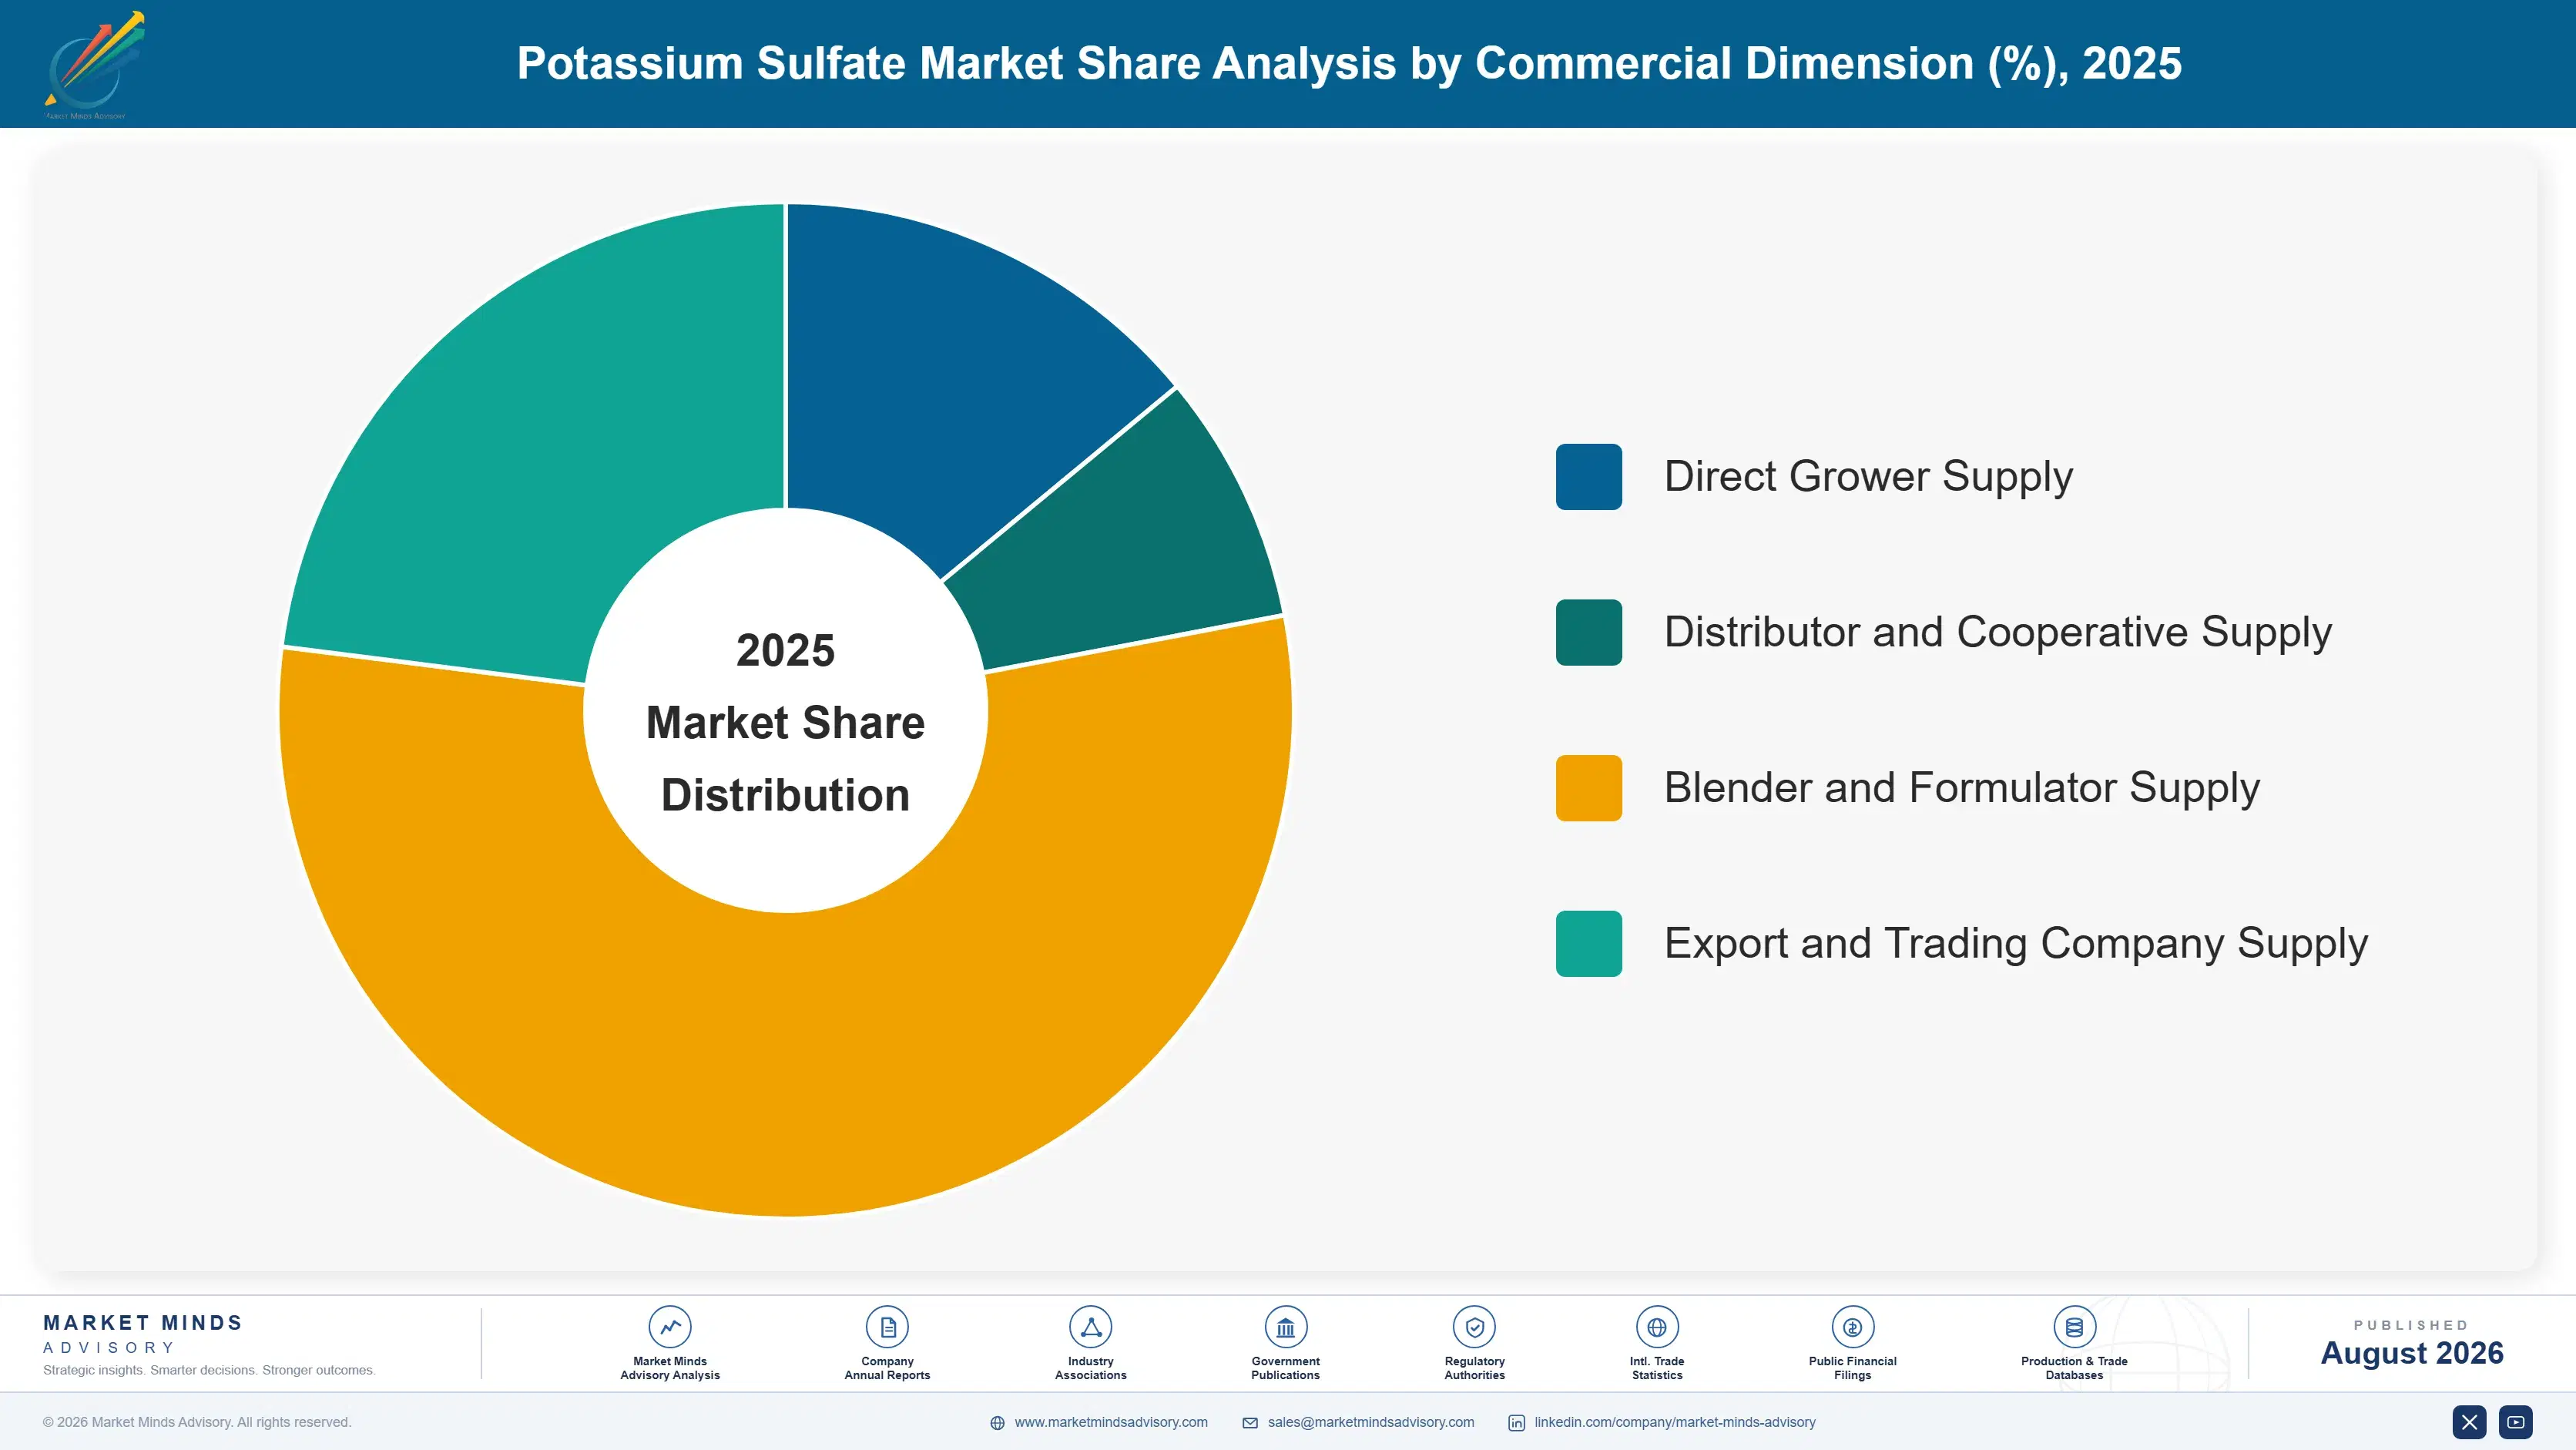
By Commercial Dimension

  • Direct Grower Supply
  • Distributor and Cooperative Supply
  • Blender and Formulator Supply
  • Export and Trading Company Supply

By Region

  • North America
  • Western Europe
  • East Asia
  • South Asia and Pacific
  • Latin America
  • Middle East and Africa
  • Eastern Europe

Scope, Methodology, and Coverage

Every figure in this report is reproducible from documented input assumptions. The scope below maps the historical period, the forecast horizon, the segmentation dimensions, and the countries covered, alongside the underlying primary and qualitative methodology.
Historical Period
2020 to 2025
Forecast Period
2026 to 2036
Base Year
2025 (USD billions; MMA Primary Research Dataset, August 2026)
Market Definition
This report covers sulfate of potash fertilizer products manufactured via the Mannheim process, glaserite conversion, and Great Salt Lake or Mannheim-derived brine processing, sold to agricultural, horticultural, and specialty crop growers. It excludes muriate of potash, potassium nitrate, and other potassium fertilizer chemistries formulated without sulfate content.
Quantitative Units
USD billions (current prices); tonnage volume for select segment analysis
Segmentation Dimensions
By End-Use Application; By End-Use Industry; By Commercial Dimension; By Region
Regions Covered
North America, Western Europe, East Asia, South Asia and Pacific, Latin America, Middle East and Africa, Eastern Europe
Countries Covered
USA, Canada, Germany, France, Netherlands, UK, China, Japan, South Korea, India, Australia, Vietnam, Thailand, Brazil, Mexico, Saudi Arabia, UAE, South Africa, Kenya, Turkey, Poland, Hungary, Czechia, Romania, and additional markets relevant to this sector
Key Companies Profiled
SQM, Compass Minerals, K+S Group, Tessenderlo Group, ICL Group, Haifa Group, Yara International, Uralkali, Belaruskali, Migao Corporation, Shandong Nanhua Industry, Ercros SA, Anglo American, Kalium Lakes, EuroChem Group, OCI Nitrogen, Duslo, Yunnan Yuntianhua, Sichuan Chuanheng Chemical, Shandong Kaifeng Chemical
Quantitative Methodology
Primary survey, n=3,800 respondents, Q4 2025, six countries; demand-side model with trade association cross-validation
Qualitative Methodology
47 expert interviews, Q4 2025; applied to validate demand model assumptions, identify emerging dynamics, and assess competitive positioning
Report Format
PDF and XLSX data workbook (Word format preview document)
Publisher
Market Minds Advisory
Report Code
MMA-2026-AGR-885
Published
August 2026
Contact
sales@marketmindsadvisory.com | www.marketmindsadvisory.com

Purchase the full Potassium Sulfate Market Report (2026 to 2036).

The full report delivers a complete quantitative and qualitative assessment of the global potassium sulfate market across all six end-use application segments and seven regions. It includes detailed producer profiles covering purity certification capability, production capacity, and agronomic positioning for the twenty companies profiled. Analysts provide scenario-adjusted forecasts through 2036 alongside input cost sensitivity modeling tied to sulfuric acid and potassium chloride price volatility. Buyers receive access to underlying primary survey and expert interview data supporting all quantitative claims, along with a controlled-environment agriculture expansion tracker across major global growing regions today.
Segment-level forecasts through 2036 across all six application categories
Seven-region demand, pricing, and CAGR breakdown tables
Twenty-company competitive profiling with moat and risk analysis
Sulfuric acid and potash supply risk mitigation pathways
Controlled-environment agriculture expansion tracker across major growing regions
Quarterly market update subscription option for ongoing monitoring

Built For The People Who Decide

From boardroom strategy to bench-side execution, this report is read cover-to-cover by leaders shaping the next decade of their industry, turning demand scenarios, market dynamics and valuation benchmarks into decisions.
CXOs/ Presidents/ VPs/ Managers
M&A and Corporate Development
Strategy Teams and R&D Heads
Procurement and Product Directors
Regulatory and Compliance Leaders
Investor Relations and Equity Analysts