Market Minds Advisory
Potassium Chloride Market

Potassium Chloride Market: Grade Economics, Seaborne Trade Concentration and Supply Realignment, 2026 to 2036

Buyers who spent 2022 discovering how concentrated potash supply really is are now paying for optionality they never previously valued, and that behavioural change is outlasting the price spike that caused it.

Lead Analyst

Bilal Shaikh

Published

September 2026

Make Smarter Decisions with Customized Research Insights

Request a free sample report and evaluate market opportunities, growth trends, and competitive dynamics relevant to your business needs.

2025 MARKET VALUE$32.4BMarket Size 2025
2036 FORECAST VALUE$50.9BBase Case , 2026 to 2036
CAGR 2026 TO 20364.2 %Bull 5.4% / Bear 3.0%
INCREMENTAL OPPORTUNITY$17.2BNet 10- year value creation
EXPANSION MULTIPLE1.51x2036 value over 2026 base
Strategic Levers
M&A Pipeline
Regional Outlook
Country Rankings
Competitive Intelligence
Segmental Deep-dive
Call-Us : 91 93563 13602

Executive Snapshot and Market Trajectory

Supply concentration has become the organising commercial fact of this market. Five producers control 62% of output, three countries hold most of the reserves, and the 2022 disruption taught importing nations exactly what that concentration means when established trade routes close without warning.
Pharmaceutical and food grade potassium chloride grows at 6.3%, a full 1.50 times the market rate, pulled by sodium reduction reformulation across processed food and by expanding pharmaceutical demand. East Asia holds 30% of global value on Chinese agricultural consumption, while Latin America takes an unusually large 13% of the total because Brazilian soybean and maize production imports well over ninety percent of the potash it applies each season.
The competitive picture is set by geology rather than by strategy. Economic potash deposits exist in a handful of basins, mine development costs billions and takes a decade, and that combination has kept the producer field stable for decades. What changed after 2022 is buyer behaviour: importing countries now pay premiums for supply diversity, and several are now funding greenfield projects directly to secure it rather than waiting for established producers to build it.
Market Definition
The market covers potassium chloride, traded as muriate of potash, across standard, compacted granular, soluble fertiliser, industrial chemical and pharmaceutical or food grades. It includes material produced by conventional underground mining, solution mining and brine evaporation. It excludes potassium sulphate, potassium nitrate, langbeinite, polyhalite and other potassium sources, blended NPK fertilisers containing potassium chloride, and downstream potassium chemicals manufactured from it.
Base Year Value
$32.4B in 2025 (MMA Primary Research Dataset, August 2026)
Forecast Period
2026 to 2036, eleven discrete annual values
CAGR
4.2% base case. Bull 5.4%. Bear 3.0%.
Fastest Growth Segment
Pharmaceutical and Food Grade Potassium Chloride: 6.3% CAGR
Fastest Growth Country
Indonesia: 7.2% CAGR
Fastest Growth Region
South Asia and Pacific: 6.5% CAGR
Largest Region
East Asia: 30% of 2025 global value
Market Leaders
Nutrien, Uralkali, Belaruskali, Mosaic, ICL. Source: MMA Primary Research Dataset, July 2026.
Primary Survey
n=3,800 procurement and R&D decision-makers, Q4 2025, six countries
Methodology
Demand-side build-up, cross-validated against public data, 47 expert interviews

Potassium Chloride Market Forecast Scenarios

potassium-chloride-market-trends-size-forecast-scenario-1787311403563
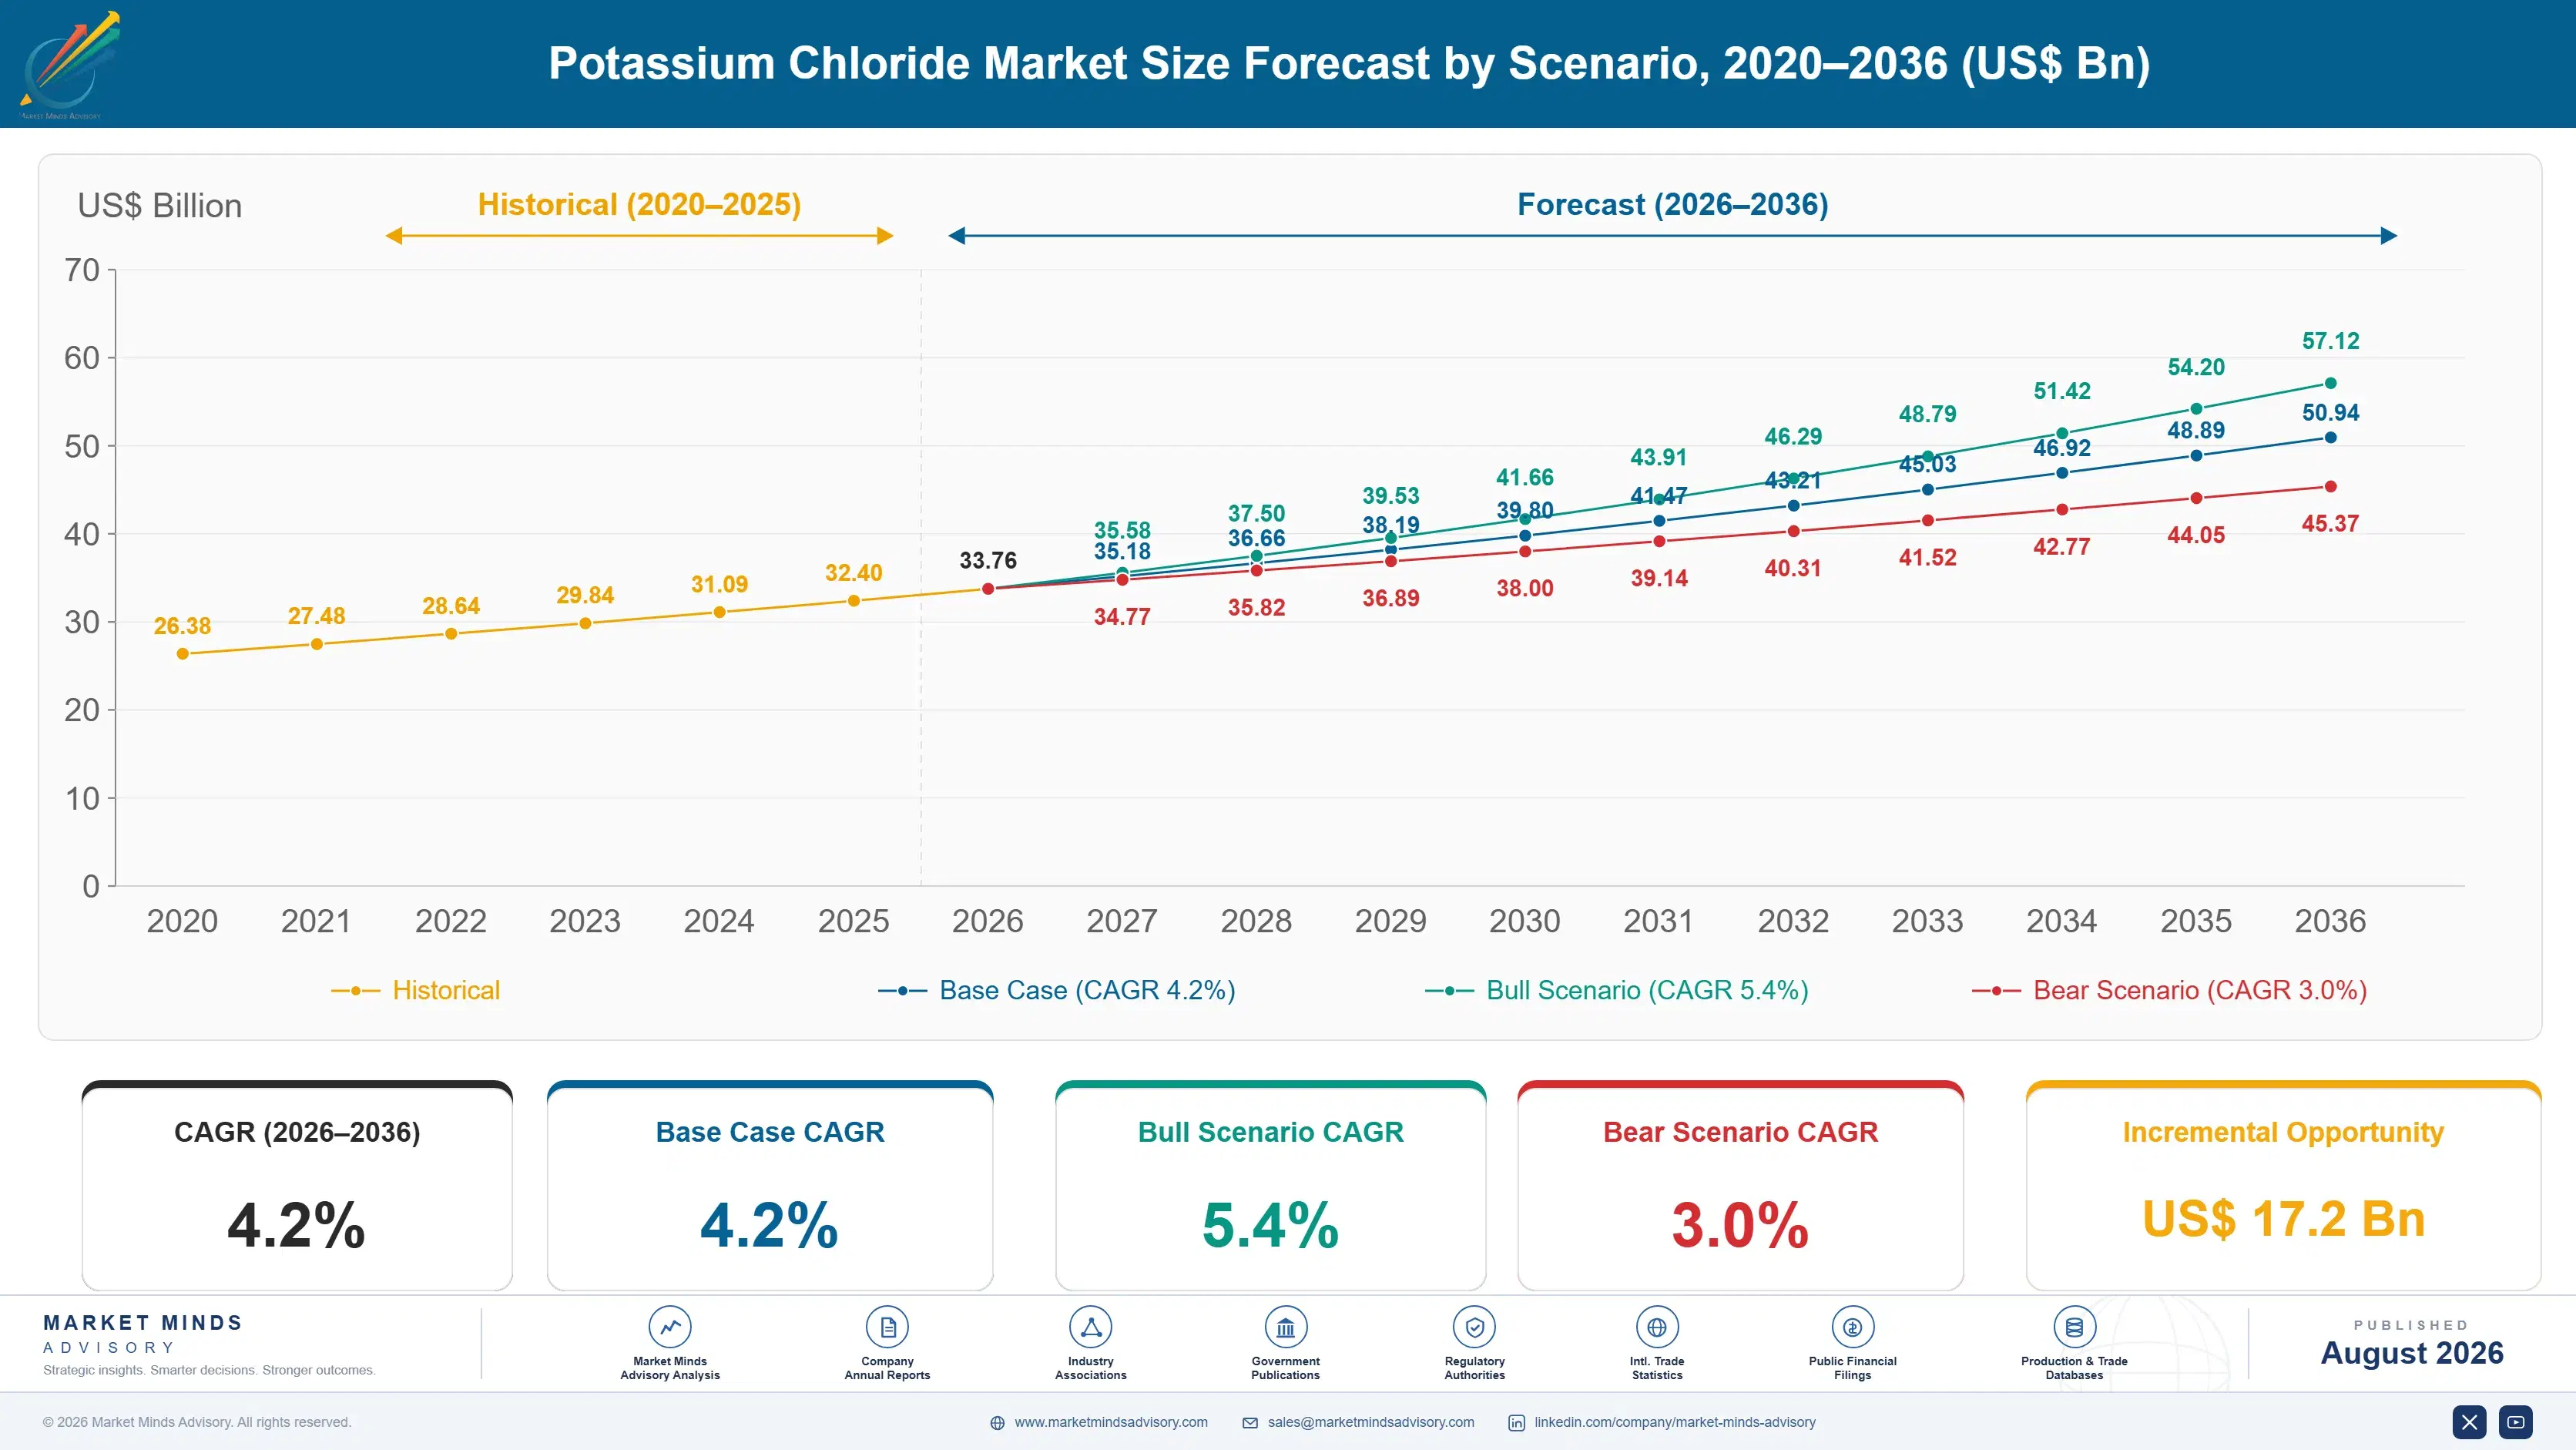
The 2020 to 2025 period compounded at 3.4% in value terms, which conceals violent movement underneath. Prices tripled through 2021 and 2022 as sanctions and export restrictions removed Belarusian and Russian material from ordinary trade, then fell hard through 2023 and 2024 as volumes rerouted and demand destruction worked through. Volume growth over the whole period was modest and steady.
The 4.2% base case rests on three mechanisms. First, application rates in Brazil, India and Southeast Asia remain well below agronomic optimum, and closing part of that gap adds volume regardless of price. Second, grade mix shifts upward as soluble and specialty grades take share from standard granular material in high-value horticulture. Third, food grade demand grows independently of agriculture as sodium reduction targets tighten across processed food manufacturing in most developed markets.
The bull case at 5.4% assumes further supply disruption or delayed greenfield capacity keeps pricing above trend through the second half of the decade. The bear case at 3.0% assumes the reverse: Canadian and Russian brownfield expansions arrive on schedule alongside a Laos and Belarus recovery, pushing utilisation down and pricing toward marginal cost for an extended period.

Why Geology Still Sets The Competitive Order

Potash is the most geographically concentrated of the three major nutrients, and that single fact explains most of its commercial behaviour. Canada, Russia and Belarus hold the bulk of economic reserves. Everyone else either imports or works deposits that are deeper, thinner or more remote than those three.
TOP FIVE CONCENTRATION62%Combined position of the five largest potash producing companies
AVERAGE SELLING PRICE$310 per tonneTypical realised granular price at major export terminals
TOP PRODUCING COUNTRY SHARE27%Canadian share of global potassium chloride production capacity
CAPACITY UTILISATION76%Average operating rate across global potash mining operations
ENERGY INPUT SHARE18% of COGSNatural gas and electricity share of delivered mining cost
SEABORNE TRADE INTENSITY81%Share of global output crossing an international border
The consequence is a market where cost position is inherited rather than earned. A Saskatchewan mine working a thick, shallow, high-grade seam produces at a cash cost that a Chinese brine operation or a European deep mine cannot approach regardless of operational excellence. Producers at the wrong end of that curve survive on freight protection, government support or by serving domestic markets that would otherwise import. When prices fall toward marginal cost, the curve does the sorting rather than management does.
What the 2022 disruption changed was the value buyers place on optionality. Importing countries that had run lean inventory and single-origin sourcing discovered how quickly both assumptions fail. India, Brazil and Indonesia have since diversified origins deliberately, accepted higher landed costs for that diversity, and in several cases taken equity positions in greenfield projects. That behaviour has persisted well past the price normalisation that supposedly ended the crisis.
"Potash producers spent thirty years telling everyone that supply discipline was permanent and reserves were scarce. Then 2022 proved them right in the most damaging way possible, because buyers finally believed it and started building alternatives. The industry won the argument and lost the customer relationship at the same time."
Principal Analyst, Fertiliser and Crop Nutrition Practice · MMA Agriculture Prac

Market Trends

Import Dependent Nations Fund Greenfield Capacity Directly

India, Brazil and several Southeast Asian governments have moved from buying potash to financing its production. Indian state enterprises hold offtake-linked positions in Canadian and African projects, and Brazilian development finance has backed domestic Amazonas and Sergipe work despite marginal economics. The commercial logic is not cost but availability: paying above market to guarantee tonnage looks rational after 2022. Roughly $4 billion of committed capital now sits behind projects that conventional producer economics would never have sanctioned, and that capital is largely indifferent to the return thresholds established incumbent producers apply to their own projects.
Market Impact: Runs at 25% of recommended rates
Sodium Reduction Targets Expand Food Grade Consumption

Potassium chloride is the principal salt substitute in processed food reformulation, and regulatory sodium targets across the United Kingdom, Canada, Australia and increasingly the United States have made reformulation compulsory in practice. Food manufacturers replacing 25% to 30% of sodium chloride in bread, processed meat and prepared meals consume food grade potassium chloride at volumes that were negligible a decade ago. The grade sells at four to six times fertiliser pricing and it requires purity control that most potash operations simply cannot deliver without dedicated crystallisation, drying and packaging capability built for the purpose.
Market Impact: Grows irrigated area 5% annually

Market Opportunities and Growth Drivers

Application Rate Gaps Persist Across Major Growing Regions

Potassium application in Brazil, India and Southeast Asia runs well below agronomic recommendation, and soil potassium depletion has become measurable across intensively cropped areas. Indian application sits at roughly a quarter of the nitrogen rate against an agronomic ideal closer to half, largely because subsidy structures favour urea. Correcting even part of that imbalance adds several million tonnes of annual demand. Government subsidy reform, when it arrives, tends to move volume quickly rather than gradually, which is precisely why demand across these markets tends to move in steps rather than in smooth trends.
Market Impact: Requires 12 years to first producti

Soluble Grade Demand Rises With Precision Irrigation

Fertigation and drip irrigation systems require potassium sources that dissolve completely without residue, and standard granular muriate cannot serve them. Irrigated horticulture area has grown around 5% annually across Spain, Mexico, Israel and increasingly China, and every hectare converted moves demand from standard grade toward soluble material at roughly double the realised price. The technical requirement is low insolubles and controlled particle size, which requires additional crystallisation and screening capability. Producers holding that capability capture the mix improvement directly, while those without it simply watch their volume shift across to competitors.
Market Impact: Adds $60 per tonne in freight

Market Restraints and Challenges

Greenfield Mine Development Takes A Full Decade

A new conventional potash mine takes seven to twelve years from discovery to first production and costs between $3 billion and $6 billion. The root cause is depth and water: economic seams sit hundreds of metres down, shaft sinking through water-bearing strata is slow and dangerous, and freezing techniques add years. Commercially this means supply cannot respond to price signals within any useful timeframe, which is why the market overshoots in both directions. Participants are pursuing solution mining and selective dissolution to cut development time toward four years, though recovery rates remain lower.
Market Impact: Commits $4 billion to greenfield pr

Freight Cost Dominates Delivered Economics For Importers

With 81% of output crossing a border, ocean and inland freight often exceeds mine gate cost by the time material reaches a Brazilian or Indian farm. The root cause is value density: potash sells near $310 per tonne, so a $60 freight movement is a fifth of the delivered price. Inland distribution in Brazil is worse still, with truck haulage from Santos to Mato Grosso adding substantially more. Participants are responding with northern arc port investment in Brazil, larger vessel sizes, and blending closer to consumption rather than at origin.
Market Impact: Replaces 30% of sodium chloride con
3 additional market trends, 2 additional growth drivers, and 4 additional restraints and challenges are covered in the full report. Contact sales@marketmindsadvisory.com to access the complete intelligence.

Segment CAGR and Growth Architecture

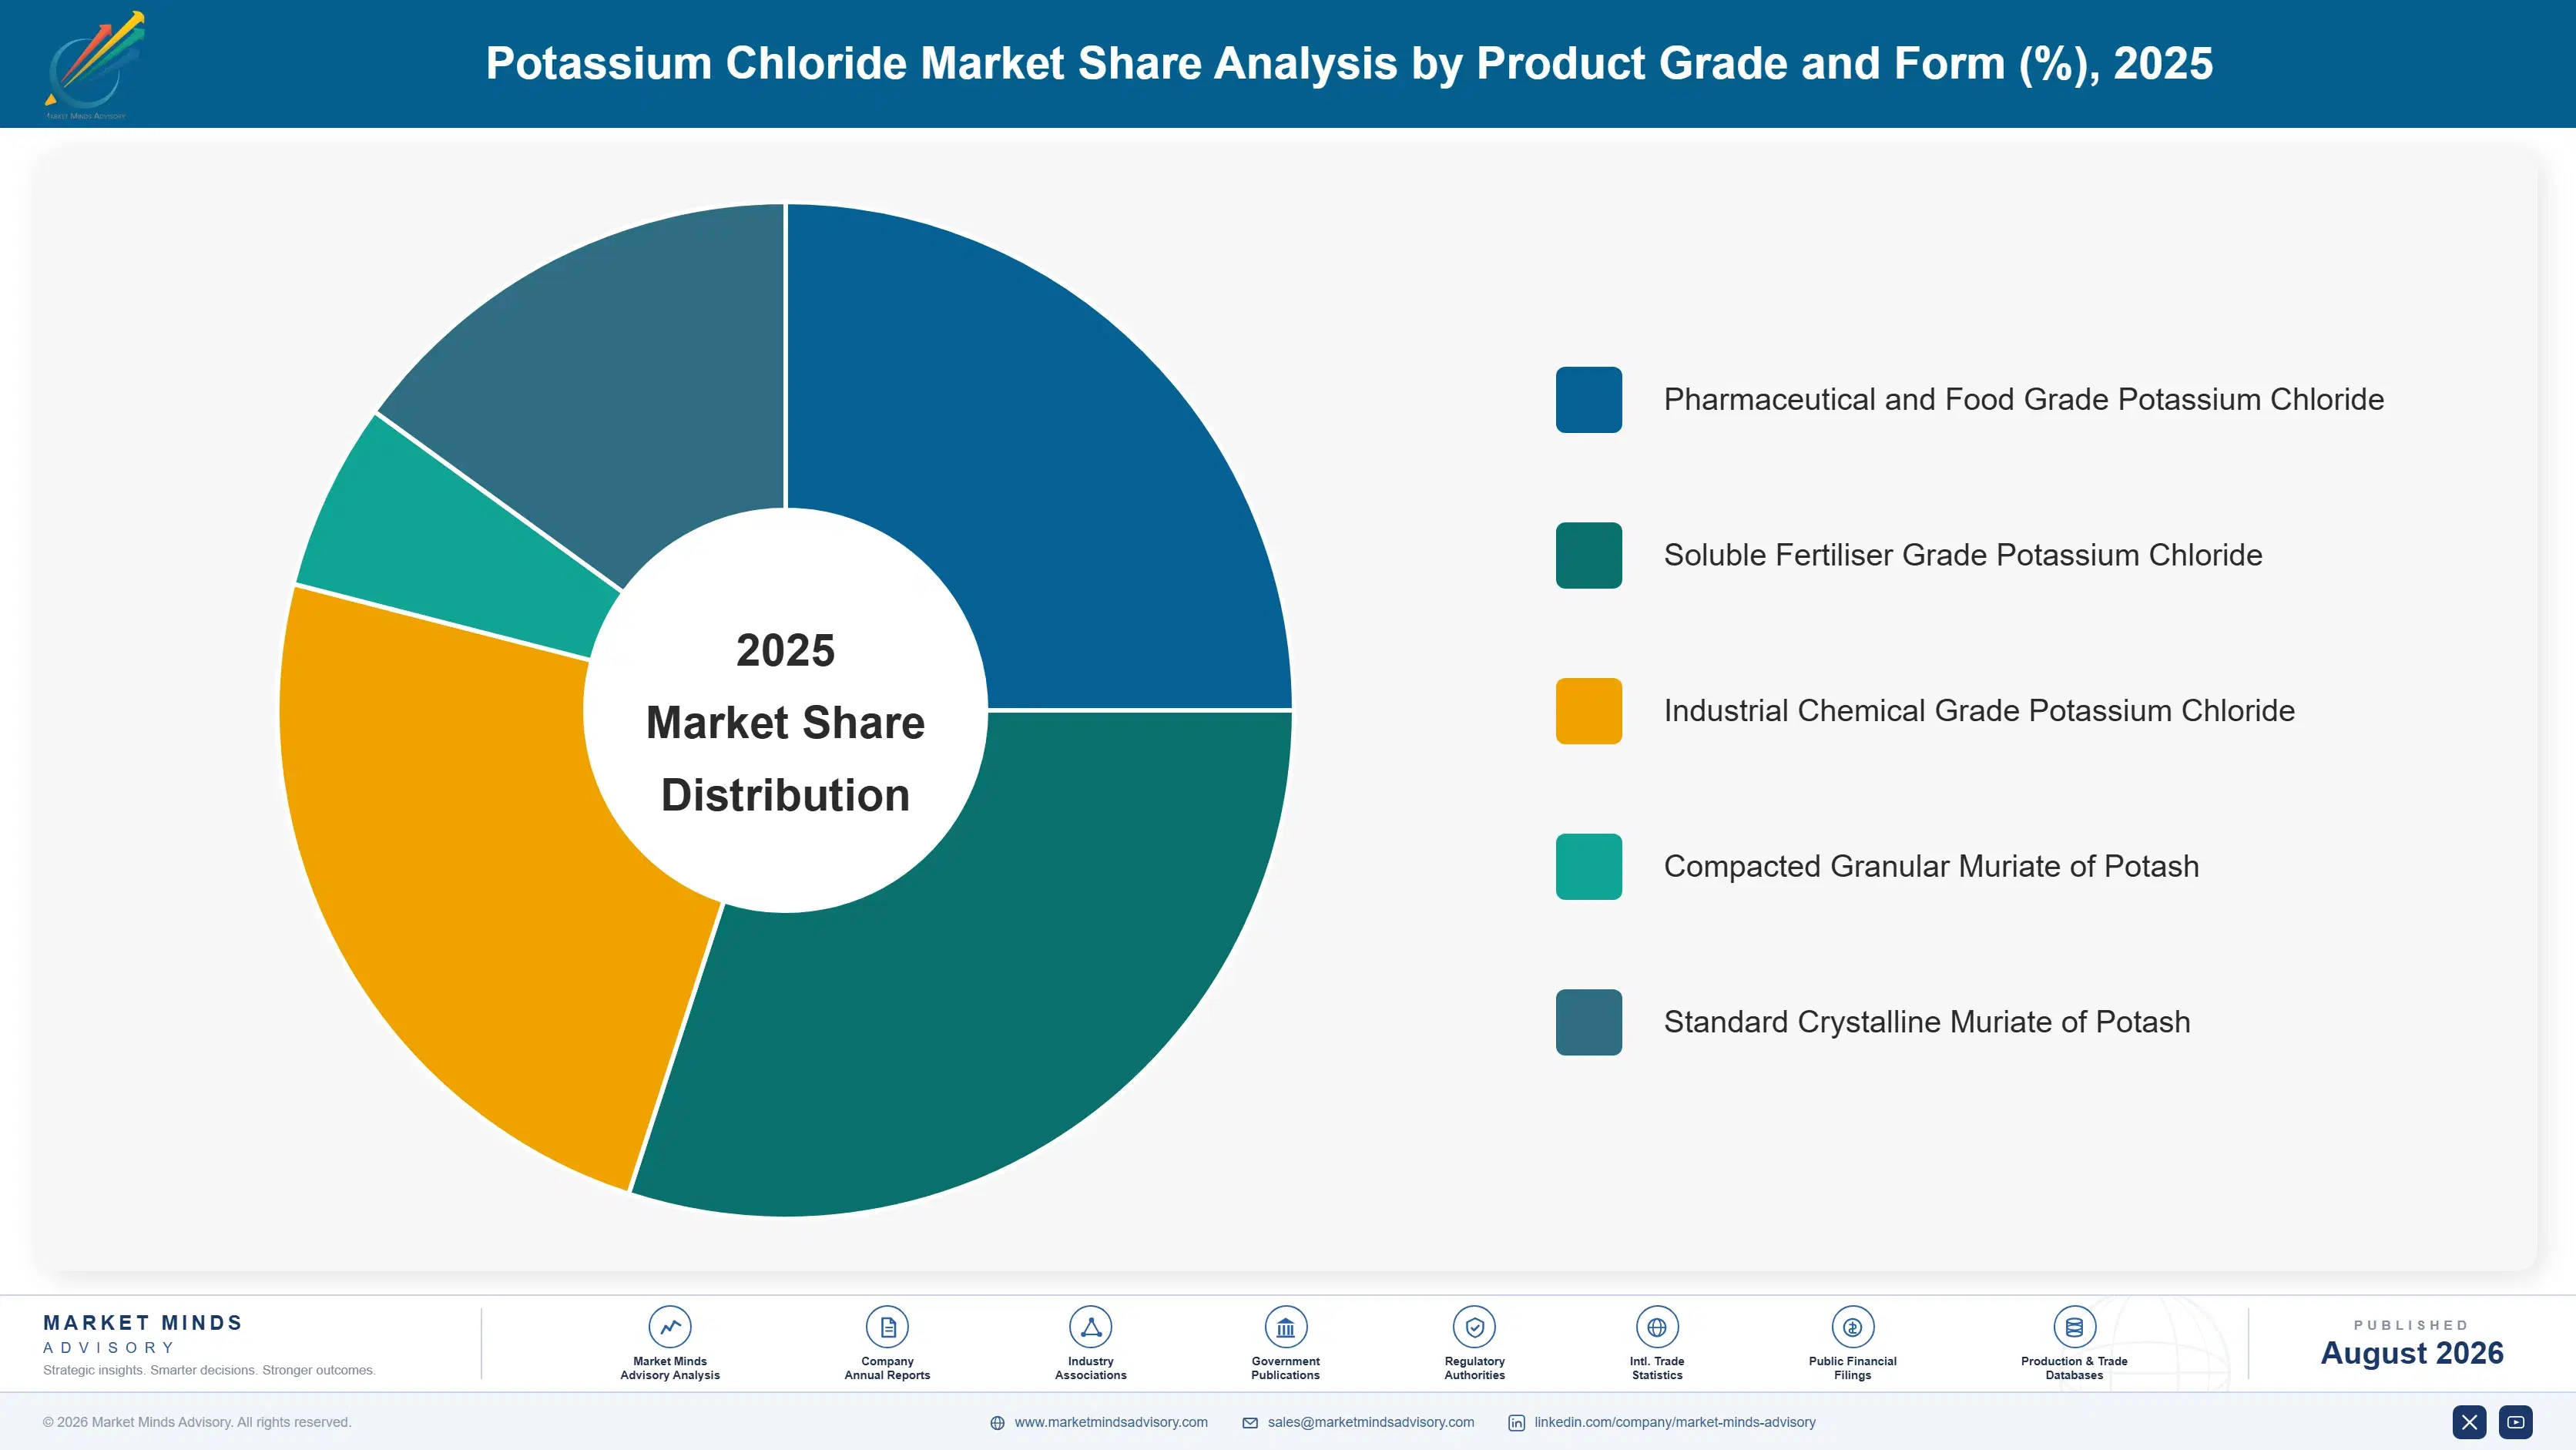
Segmentation follows product grade, defined by purity specification and physical form as delivered. That single dimension determines which processing capability a producer needs beyond the mine itself, which customers it can serve, and nearly the whole of the realised price range across a market that outsiders still tend to treat as one single undifferentiated commodity.
potassium-chloride-market-trends-market-share-analysis-1787311404101

Pharmaceutical and Food Grade Potassium Chloride

The fastest segment at 6.3%, a full 1.50 times the market rate, covering material meeting pharmacopoeial or food purity standards for salt replacement, electrolyte formulation and intravenous solutions. Sodium reduction regulation across processed food manufacturing drives most of the growth, with pharmaceutical and clinical demand adding a smaller but exceptionally stable underlying base. Realised pricing runs four to six times fertiliser grade levels, and the qualified supplier list is short because the purity, heavy metal and microbiological requirements demand dedicated crystallisation, drying and packaging lines. Site-level regulatory compliance, rather than any difficulty in the chemistry itself, is what keeps the great majority of potash producers out of this segment entirely.
CAGR 6.3%

Soluble Fertiliser Grade Potassium Chloride

Growing at 5.4% annually on white soluble material supplied into fertigation, drip irrigation and foliar application systems where standard granular muriate leaves unacceptable residue. Demand tracks irrigated horticulture expansion closely across Spain, Mexico, Israel, China and increasingly the Gulf states under protected cultivation programmes. Specification here centres on low insolubles, controlled particle size and consistent dissolution behaviour, all of which require crystallisation and screening capability well beyond what an ordinary flotation plant provides. Pricing runs at roughly double standard granular levels and holds up considerably better through agricultural downturns, because the growers buying it are producing high-value crops on which nutrient cost represents only a small share of total revenue.
CAGR 5.4%
Full segment breakdown across 5 segments available in the complete report.

Regional Architecture and Country Demand Map

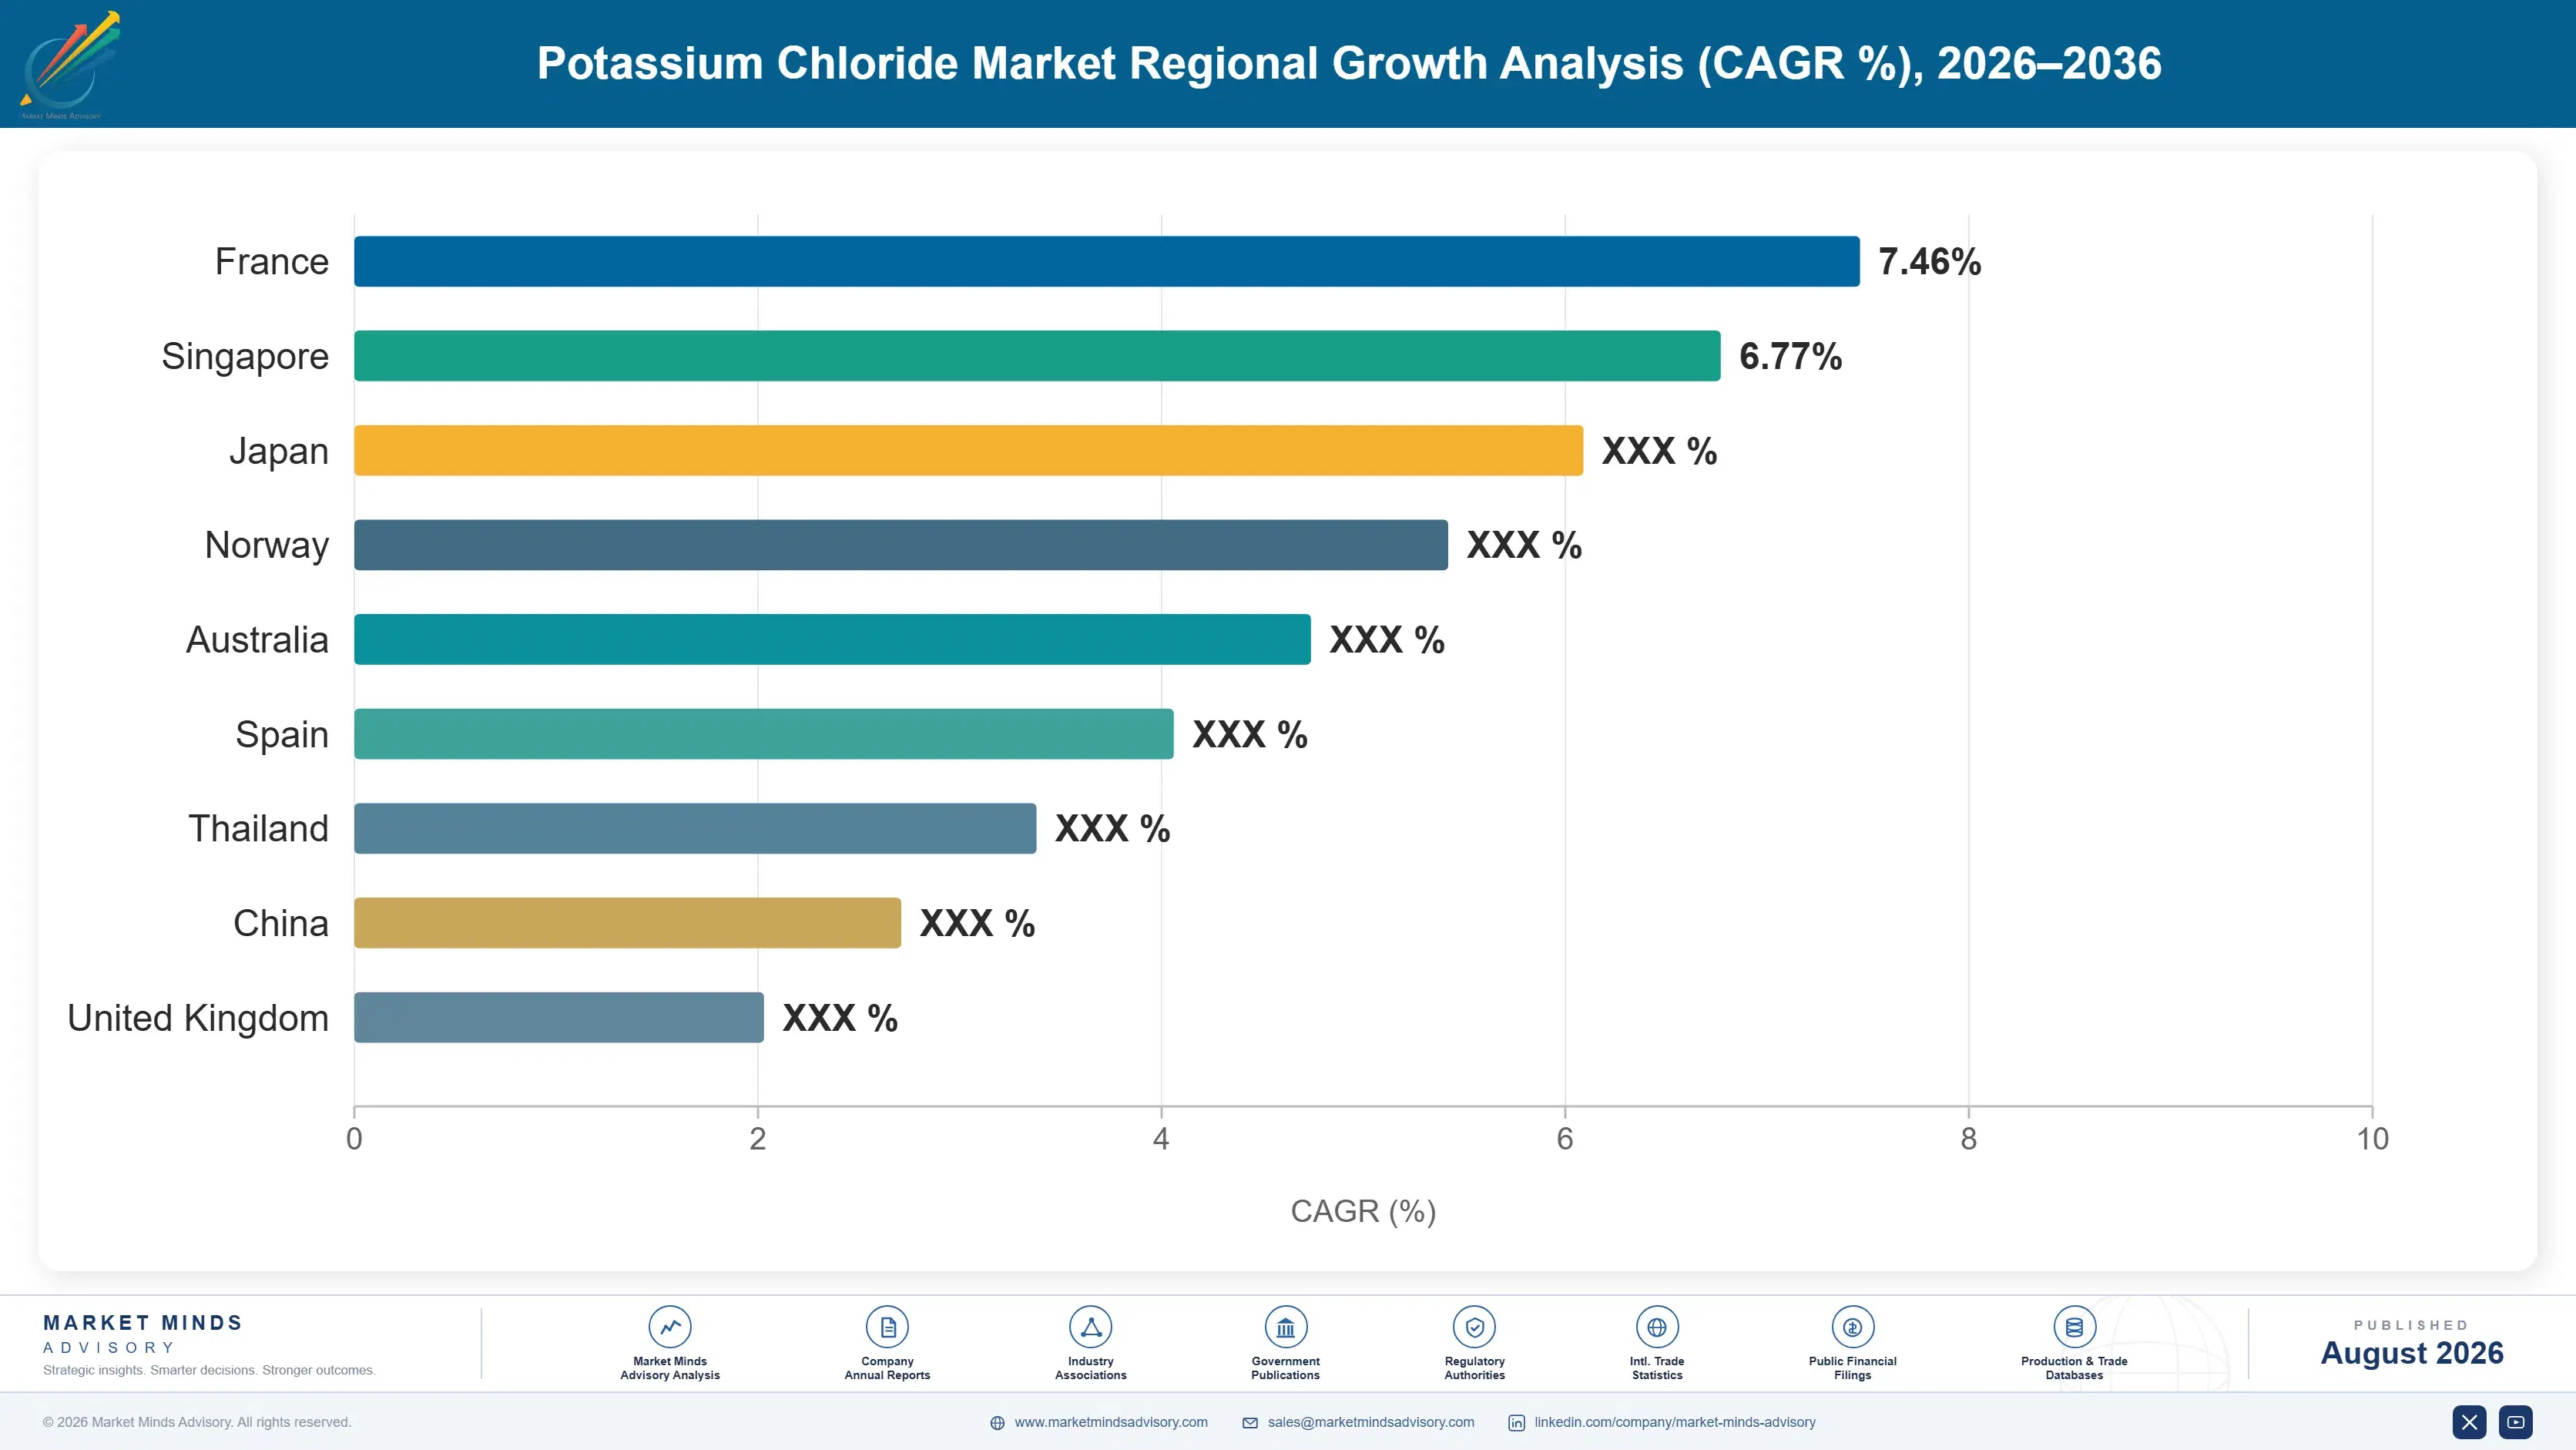
East Asia leads on Chinese agricultural consumption and domestic brine production. Latin America takes an outsized share because Brazilian row crop agriculture imports nearly all its requirement. South Asia and Pacific grows fastest of all as subsidy reform and palm oil demand together lift application rates.

East Asia

Thirty percent of global value sits here, driven by Chinese agricultural consumption on a scale no other single country approaches. Domestic production from Qinghai brine operations covers roughly half of that demand, with the balance imported under annually negotiated contracts that effectively set a global price floor. Japanese and Korean demand is small and stable, weighted toward horticulture and industrial applications. Growth of 5.4% reflects continued application intensity in Chinese grain production alongside expanding soluble grade use in greenhouse horticulture. The commercial dynamic that matters most here is the Chinese contract settlement each year, which the whole seaborne market watches closely and then prices against for the rest of the year.
Share: 30% | CAGR: 5.4% (2026 to 2036)

North America

Twenty-two percent of global value, and the region is far more significant as a producer than these consumption figures suggest. United States demand concentrates in the corn belt, where potassium removal by high-yielding maize is substantial and replacement application is routine agronomic practice rather than a discretionary decision. Growth of 3.6% tracks planted area and yield trends closely. Canadian consumption is modest against a production position that supplies roughly a quarter of world output from Saskatchewan alone. Freight from the prairies to Gulf, Midwest and Pacific export terminals is efficient and long established, which keeps delivered costs competitive against any imported alternative and keeps import penetration low. Mexican demand is smaller and concentrated in irrigated horticulture.
Share: 22% | CAGR: 3.6% (2026 to 2036)
Regional intelligence for 5 additional markets available in the complete report: Western Europe, South Asia and Pacific, Latin America, Middle East and Africa, Eastern Europe. Contact sales@marketmindsadvisory.com.
potassium-chloride-market-trends-country-cagr-analysis-1787311404631

Where Potash Margin Actually Comes From

Four moves separate producers earning above cash cost from those merely surviving the cycle. Each depends on controlling something the marginal tonne cannot access: a low position on the cost curve, grade capability beyond the mine, distribution reach into inland consumption, or contract structures that continue to hold up when spot pricing collapses beneath everyone.

Build Dedicated Food And Pharmaceutical Grade Capability

Food and pharmaceutical grade material sells at four to six times fertiliser pricing and moves on entirely different demand drivers, insulating a producer from agricultural cycles. Dedicated crystallisation, drying and packaging capability costs roughly $40 million to $70 million and requires site-level regulatory qualification taking about two years. Very few potash operations have made that investment, which is why the qualified supplier list stays short and pricing holds through downturns that devastate fertiliser realisations. The scale required is modest relative to a mine, making this among the cheapest diversification available to an existing producer.
Market Impact: Earns up to 6 times fertiliser grad

Invest In Inland Distribution Near Consumption

Delivered cost decides purchasing in import markets, and inland freight frequently exceeds ocean freight. Producers holding blending and warehousing assets in Mato Grosso, Uttar Pradesh or Sumatra capture margin that would otherwise accrue to local traders, and they hold customer relationships through price cycles rather than losing them to whoever quotes lowest. Terminal and blending investment runs $25 million to $60 million per node. Producers running this model report realised prices roughly 9% above pure export parity, and considerably steadier volumes whenever spot markets turn hard against the producer field.
Market Impact: Realises roughly 9% above pure expo

Convert Standard Tonnage Toward Soluble Grade

Soluble grade sells at roughly double standard granular pricing and grows with irrigated horticulture rather than with row crop area. Adding crystallisation and screening capability to an existing operation costs $30 million to $55 million, considerably less than any capacity expansion, and it improves mix on tonnes already being mined. The demand is genuinely there: irrigated area is expanding around 5% annually across Spain, Mexico, Israel and China. Producers who converted early are supply constrained rather than demand constrained, which is a distinctly unusual position for anyone in this industry to occupy.
Market Impact: Doubles realised pricing on roughly

Write Multi-Year Contracts With Volume Floors

Spot exposure destroyed producer economics through 2023 and 2024 as prices fell faster than costs could follow. Multi-year agreements carrying volume floors and price collars sacrifice upside in spike years but hold realisations 20% to 30% above spot through troughs. Import-dependent buyers now accept such terms readily, because supply security has become worth more to them than squeezing the last few dollars per tonne. The producers who signed these agreements during the 2022 anxiety are collecting the benefit now, while those who held out for spot exposure are very plainly not.
Market Impact: Holds realisations up to 30% above

Who Controls the Margin Pool

Concentration is high and durable. The five largest producers hold 62% of global output, measured on potassium chloride production volume across all participants, and the ranking has changed remarkably little across decades. Nutrien leads on Saskatchewan capacity and cost position, and the gap to the next tier is widest in cost curve placement rather than in tonnage.
Competition runs on three dimensions, and price is not really one of them. Cost curve position decides who survives a trough, and that position is inherited from geology rather than built. Distribution reach into import markets decides who captures inland margin. Grade capability decides who escapes the agricultural cycle at all. Producers compete hardest for annual contract settlements in China and India, since those benchmarks anchor pricing for everyone else.

Two pressures are building. Buyer-funded greenfield capacity in Africa, Brazil and Laos applies return thresholds that incumbents would reject, which means tonnage may arrive that conventional economics would never have sanctioned. Meanwhile Russian and Belarusian material has largely rerouted to Asia and Brazil rather than leaving the market, compressing the pricing that Western producers had assumed sanctions would protect. Rankings shift where those new tonnes land against existing distribution.
potassium-chloride-market-trends-company-positioning-matrix-1787311405156

Competitive Moat and Risk Dimensions

NUTRIEN

Moat: Lowest cost curve position globally

Saskatchewan seams are thick, shallow and high grade, and the company's mines sit at the bottom of the global cash cost curve as a matter of geology rather than operating skill. That position lets it hold volume through troughs that force higher-cost producers to curtail, and it converts every price recovery into margin faster than competitors manage.
NUTRIEN

Risk: Retail earnings dilute potash exposure

A very large agricultural retail business sits alongside the mining operations, and its earnings behave quite differently through crop input cycles. Investors seeking potash exposure get something considerably more diluted, and capital allocation between the two competes internally. In a trough, retail margin pressure and potash price weakness can arrive together rather than offsetting.
URALKALI

Moat: Scale with domestic energy advantage

Large Perm basin operations combined with domestic energy pricing give the company a cash cost position that few producers outside Canada can match. Rail access to both Baltic and eastern export routes provides genuine flexibility in where tonnage goes, which proved valuable when western trade routes closed and volumes needed rerouting quickly toward Asia.
URALKALI

Risk: Trade access and payment friction

Sanctions, shipping insurance limits and payment channel restrictions constrain which buyers can transact, regardless of cost position. Material reaches Asia and Brazil but at wider discounts than quality justifies. Long-term customer relationships in restricted markets have transferred to competitors, and rebuilding them if conditions ease will take considerably longer than the trade disruption itself did.

Players Tracked

Prominent Players

Nutrien
Uralkali
Belaruskali
Mosaic
ICL

Other Key Players

K+S
Arab Potash Company
Qinghai Salt Lake Industry
SQM
Intrepid Potash
EuroChem
Compass Minerals
Sinofert Holdings
Yara International
Highfield Resources
Verde Agritech
Emmerson
Michigan Potash Company
Gensource Potash
Western Potash

Recent Developments

MARCH 2025

Brazilian development bank backs domestic potash project financing

State development finance was committed to a domestic potassium chloride project in the Sergipe basin, accepting returns well below conventional mining thresholds on the explicit basis that reducing national import dependence carries a strategic value that ordinary commodity market pricing does not otherwise recognise at all.
Signal: Import dependence is now being treated as
JULY 2025

Nutrien expands food grade potassium chloride capacity

Dedicated crystallisation, drying and packaging capacity for food and pharmaceutical grade material entered commercial service at a North American site, targeting the salt replacement demand coming from large processed food manufacturers now facing tightening sodium reduction targets across several developed market regulatory jurisdictions more or less simultaneously.
Signal: Producers are now buying real insulation f
NOVEMBER 2025

Arab Potash Company concludes multi-year Indian supply agreement

A multi-year supply agreement with several Indian importers was concluded covering specified minimum annual tonnage on collared pricing terms, reflecting how import-dependent buyers across Asia now prioritise guaranteed volume and predictable pricing well ahead of extracting the lowest possible spot cost in any given season.
Signal: Multi-year volume commitments are now stea

What Drives Delivered Potash Cost

Energy accounts for roughly 18% of cost of goods, split between natural gas for drying and compaction and electricity for hoisting, milling and flotation. Labour contributes 22%, high because underground mining is people-intensive and Saskatchewan and Perm basin wages are not low. Freight, ocean and inland together, adds a further 26% on delivered terms, the largest single component for any importing market.
The 2022 European energy shock removed marginal capacity outright. IEA data recorded European industrial gas prices at many times their historical range that winter, and German potash operations, deeper and more energy intensive than Canadian equivalents, faced costs that made continued production genuinely questionable. K+S annual reporting documented substantial energy cost pressure and curtailment decisions. Solar evaporation producers in Jordan and Israel gained position without any operational change.

The competitive disadvantage mechanism runs entirely through the cost curve. When prices fall toward marginal cost, deep European mines and higher-cost Chinese brine operations curtail while Saskatchewan and Dead Sea operations run on profitably. That sorting is geological and permanent. Producers in the middle of the curve carry the worst exposure, lacking both the cost protection of the bottom quartile and the domestic market protection the highest-cost operations enjoy.
potassium-chloride-market-trends-cost-volatility-analysis-1787311405352

Shift compaction and drying toward electrified heat

Gas-fired drying and compaction dominate energy cost and expose producers directly to regional gas pricing. Electrification with heat recovery costs roughly $30 million per plant and cuts energy cost of goods by around four percentage points where grid power is cheap and low carbon, with payback improving sharply wherever carbon pricing applies to industrial fuel use.

Hedge freight exposure on multi-year import contracts

Ocean freight has swung more violently than potash pricing itself since 2021, and producers selling delivered terms carry that risk directly. Multi-year contracts of affreightment covering committed tonnage remove most of the volatility at a modest premium, and they matter more than commodity hedging for anyone supplying Brazilian or Indian markets on delivered terms.

Invest in inland logistics ahead of demand

Inland freight in Brazil and India routinely exceeds ocean freight and is the least contested part of the cost chain. Rail terminal and barge investment near consumption removes truck dependence, cutting delivered cost by $18 to $30 per tonne. The capital is modest against mine expansion and the returns are considerably more predictable than commodity price exposure.

Portfolio Architecture for Margin Defence

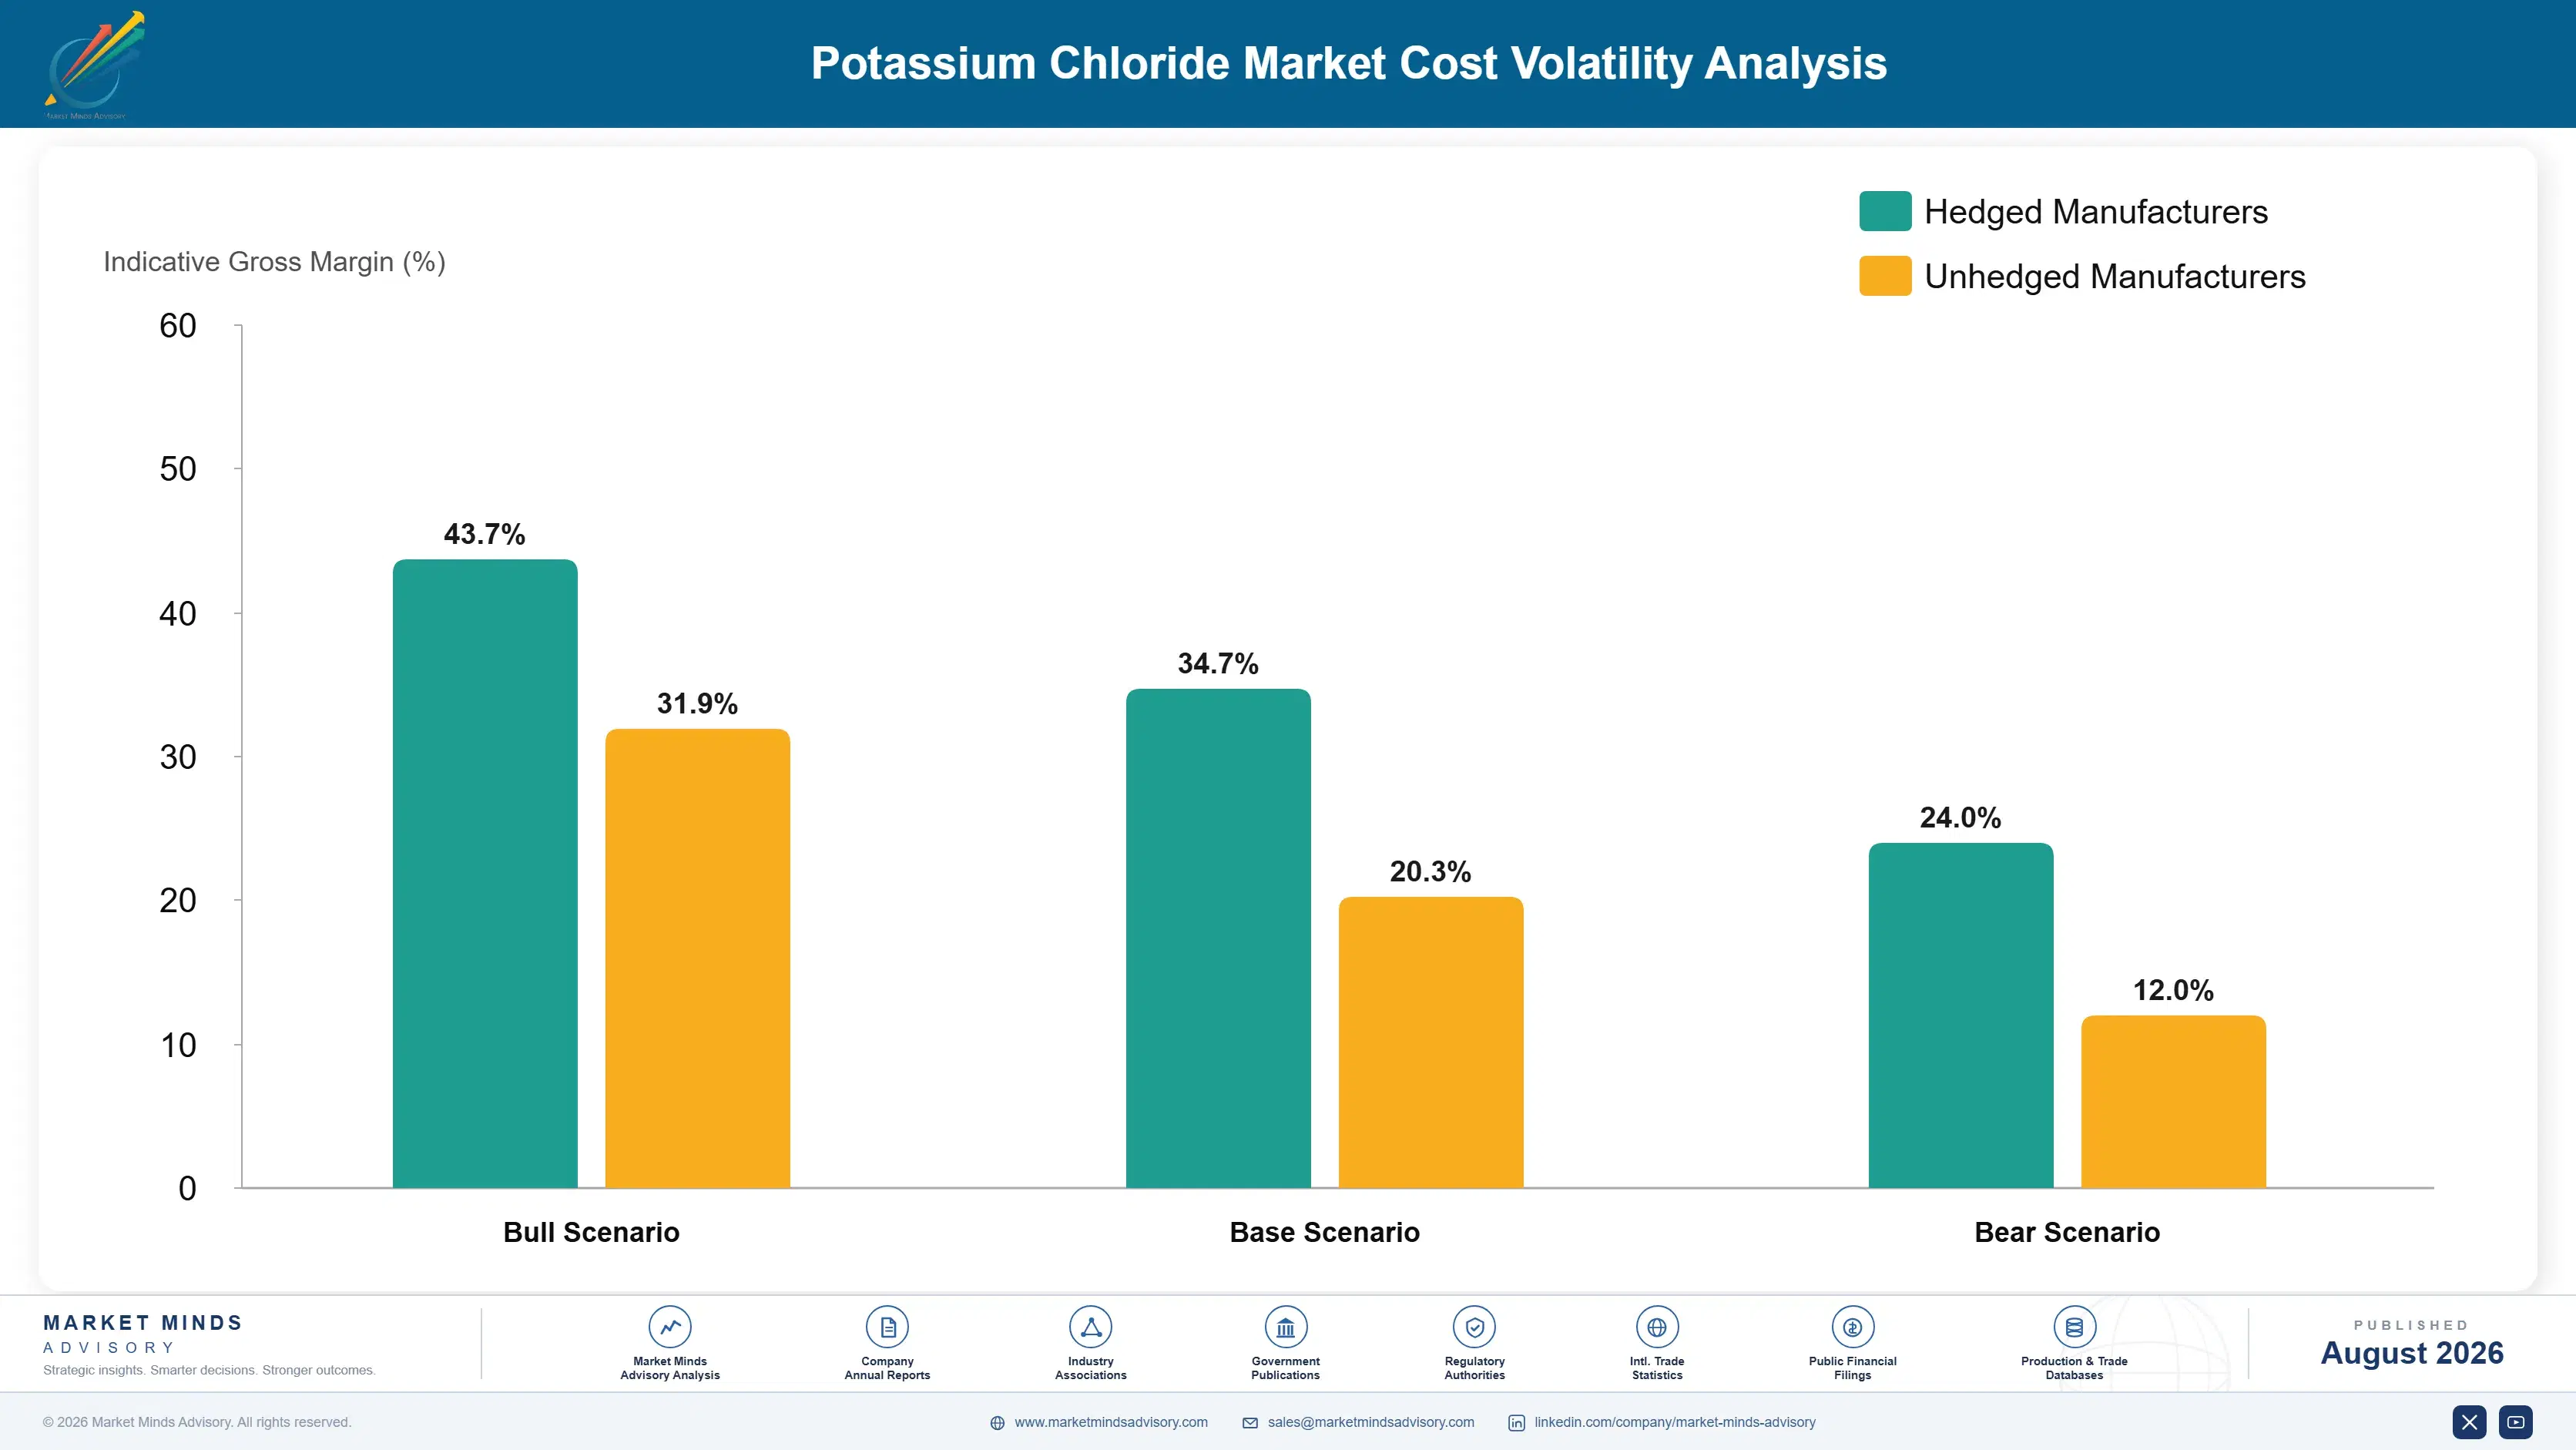
Margin architecture here divides between commodity fertiliser tonnage and everything else. Standard granular muriate sold into row crop agriculture runs at gross margins that swing from below fifteen percent in troughs to well above fifty in spikes, depending entirely on where a producer sits on the cost curve. Specialty grades behave differently.
The volume-versus-premium tension is unusual in this industry because volume is not optional. A potash mine is an enormous fixed cost that must be loaded, and specialty grades cannot absorb more than a small fraction of any operation's output. Producers therefore hold commodity tonnage regardless of its margin, and treat grade capability as a stabiliser on top rather than as a replacement. Nobody escapes the cycle; the question is only how much of the swing they can dampen.

Value pools concentrate where purity requirements exclude ordinary producers. Food and pharmaceutical grade sits at the top, earning four to six times fertiliser realisations on demand that ignores crop cycles entirely. Soluble grade sits below it on similar logic at lower magnitude. Standard granular generates the least margin per tonne yet remains the volume that recovers the mine's capital, which is precisely why nobody exits it.

Volume / Commodity-Adjacent

Standard and compacted granular muriate sold into row crop agriculture through distributors and blenders. Pricing follows global benchmarks with no differentiation available, and margin depends entirely on cost curve position. Range is wide because cycle position moves realisations more than any commercial decision does.
Gross Margin: 14-52%

Premium / Certified

Soluble fertiliser grade and industrial chemical grade sold into fertigation, protected horticulture and chemical manufacture. Specification requirements on insolubles and particle consistency limit the supplier field, and pricing holds better through agricultural troughs than commodity tonnage does.
Gross Margin: 34-46%

Sustainability / Regulatory / Next-Generation

Food and pharmaceutical grade material sold into salt replacement, electrolyte formulation and medical solutions. Site regulatory qualification rather than mining capability justifies the pricing, and demand follows food reformulation rules rather than crop economics or planted area.
Gross Margin: 48-64%
potassium-chloride-market-trends-portfolio-architecture-1787311405848

High-value Sub-segments and Strategic Watch-out

Food and Pharmaceutical Grade

High value on genuinely high growth at 6.3%, and entirely insulated from agricultural cycles because sodium reduction regulation drives it. Site qualification keeps the supplier field small, and the capital required is genuinely modest against almost anything else a potash producer might reasonably choose to build.
Gross Margin: 48-64%

Soluble Fertiliser Grade

Strong margins on steady growth at 5.4%, tracking irrigated horticulture expansion rather than row crop area. Crystallisation and screening capability keeps most competitors well out of it, and the growers buying it treat nutrient cost as a very small share of revenue on the high-value crops they produce.
Gross Margin: 34-46%

Standard Granular Tonnage

The volume that recovers mine capital, unavoidable regardless of margin and entirely dependent on cost curve position. Producers in the bottom quartile earn well through cycles while those in the middle suffer, and no commercial decision available to management changes that inherited geological position at all.
Gross Margin: 14-52%

Buyer-Funded Greenfield Supply

The strategic watch-out in this portfolio. Import-dependent governments are now financing capacity against strategic rather than commercial return thresholds, and several billion dollars of that tonnage could arrive regardless of whether prices justify it, compressing utilisation right across the incumbent producer field for years afterwards.
Gross Margin: 10-30%

How Potash Demand Actually Repeats

Agricultural potash demand behaves as replacement rather than consumption. Every harvest removes potassium from soil, and failing to replace it shows up as yield decline within a few seasons. That biological arithmetic makes demand genuinely recurring, though farmers can defer application for a year or two when prices spike, which is exactly what happened through 2022.
Stickiness varies considerably by end use. Food and pharmaceutical customers are the tightest, locked by site qualification and regulatory documentation that make supplier changes a project rather than a purchase. Protected horticulture using soluble grades sits close behind, since dissolution behaviour varies between suppliers more than specifications suggest. Row crop agriculture is the loosest, with distributors and blenders switching origin freely on delivered price.

Buyer profiles have shifted since 2022. Purchasing once sat with distributors optimising landed cost against a seasonal price view. It increasingly involves agriculture ministries, state trading enterprises and food security functions who value origin diversity above price. Producers whose commercial approach still leads with competitive quotation are negotiating with counterparties for whom supply guarantees, contract duration and political relationships now matter considerably more than the last few dollars.
potassium-chloride-market-trends-end-use-penetration-index-1787311406339

Where To Commit Capital

These are among the four positions where our research anticipates prominent divergence between winners and laggards over the coming forecast period. Each is grounded in the demand model, the regulatory perimeter, and the announced capacity pipeline.
01 / COST CURVE DISCIPLINE

Position on the curve decides trough survival

Potash cost position is inherited from geology rather than earned through operating skill, and when prices fall toward marginal cost the curve does the sorting regardless of management quality. Bottom quartile operations continue running profitably through troughs that force mid-curve producers to curtail output entirely. Capital directed at improving an already-poor cost position rarely pays; capital directed at extending life on a good position almost always does, which is an uncomfortable rule for management teams but a reliable one nonetheless.
02 / SPECIALTY GRADE DIVERSIFICATION

Food grade capability is the cheapest cycle insulation

Dedicated food and pharmaceutical grade capability costs $40 million to $70 million and about two years of regulatory qualification, which is close to trivial against the capital any mine expansion would require. It returns four to six times fertiliser pricing on demand driven by sodium reduction rules rather than by crop economics or planted area. Very few producers anywhere have built it, which is precisely why the qualified supplier list stays short and why pricing holds firm through agricultural downturns that devastate everything else.
03 / INLAND DISTRIBUTION OWNERSHIP

Freight is where importers actually lose money

Inland freight in Brazil and India routinely exceeds ocean freight, and that portion of the chain remains the least contested part of the whole delivered cost structure. Terminal and blending investment sited near consumption runs $25 million to $60 million per node and lifts realisations roughly 9% above bare export parity. It also holds customer relationships through price cycles, which arguably matters more than the margin itself in a market where buyers have now learned to value continuity above cost.
04 / CONTRACT STRUCTURE DESIGN

Trade volatility upside for realisation floors

Spot market exposure destroyed producer economics through 2023 and 2024 as prices fell considerably faster than production costs could possibly follow them down. Multi-year agreements carrying volume floors and price collars hold realisations 20% to 30% above spot through troughs, at the cost of surrendering most of the upside in spike years. Import-dependent buyers now accept those terms quite readily, because supply security has become genuinely worth more to them than squeezing out the last few dollars per tonne ever was.

Engagement Snapshot From the Field

A live engagement with an industry participant carrying material or product regulatory and market exposure ahead of a defining policy shift, showing how our research translates into a defensible multi-year portfolio strategy.
MARKET MINDS ADVISORY · CLIENT ENGAGEMENT SUMMARY
Potassium Chloride Producer Strategic Portfolio Review and Transition Roadmap 2026·Investment Scenario on Potassium Chloride Exposure Evaluation 2025-26
CLIENT PROFILE
An integrated palm oil plantation and milling group with annual revenue near $1.4 billion (client-reported, unverified by MMA), managing roughly 180,000 planted hectares across Indonesia and Malaysia. Potassium chloride represented its single largest fertiliser expenditure, purchased almost entirely on annual tenders from trading houses, with no direct producer relationships and no visibility into the origin of delivered material.
STRATEGIC CHALLENGE
The 2022 disruption left the group unable to secure adequate tonnage at any price for two consecutive application windows, and yield impact appeared in the following harvest. The board wanted to understand whether direct producer contracting, origin diversification or upstream participation would materially reduce that exposure, and what each would cost relative to continuing with tender purchasing.
MMA APPROACH
MMA modelled procurement cost and supply reliability under four sourcing structures, mapped realistic origin options against freight economics and political exposure, and assessed producer willingness to contract multi-year volume with plantation groups directly. Findings were tested against 47 expert interviews covering producer commercial practice, trading house behaviour and Southeast Asian import logistics arrangements.
KEY FINDINGS
  1. Annual tender purchasing had delivered roughly 4% lower average cost across five years but left the group entirely without supply during the two windows that mattered most.
  2. Multi-year direct contracts with two producers across different geopolitical exposures would raise average cost by about 6% (client-reported estimate, unverified by MMA) while effectively removing availability risk.
  3. Deferred application across the 2022 shortage had cost an estimated $31 million in lost yield (client-reported, unverified by MMA), several times the premium that supply security would have required.
  4. Upstream equity participation in a greenfield project offered no meaningful reliability improvement before 2033, making it irrelevant to the exposure the board was actually trying to address.
CLIENT PROFILE
An integrated palm oil plantation and milling group with annual revenue near $1.4 billion (client-reported, unverified by MMA), managing roughly 180,000 planted hectares across Indonesia and Malaysia. Potassium chloride represented its single largest fertiliser expenditure, purchased almost entirely on annual tenders from trading houses, with no direct producer relationships and no visibility into the origin of delivered material.
STRATEGIC CHALLENGE
The 2022 disruption left the group unable to secure adequate tonnage at any price for two consecutive application windows, and yield impact appeared in the following harvest. The board wanted to understand whether direct producer contracting, origin diversification or upstream participation would materially reduce that exposure, and what each would cost relative to continuing with tender purchasing.
MMA APPROACH
MMA modelled procurement cost and supply reliability under four sourcing structures, mapped realistic origin options against freight economics and political exposure, and assessed producer willingness to contract multi-year volume with plantation groups directly. Findings were tested against 47 expert interviews covering producer commercial practice, trading house behaviour and Southeast Asian import logistics arrangements.
KEY FINDINGS
  1. Annual tender purchasing had delivered roughly 4% lower average cost across five years but left the group entirely without supply during the two windows that mattered most.
  2. Multi-year direct contracts with two producers across different geopolitical exposures would raise average cost by about 6% (client-reported estimate, unverified by MMA) while effectively removing availability risk.
  3. Deferred application across the 2022 shortage had cost an estimated $31 million in lost yield (client-reported, unverified by MMA), several times the premium that supply security would have required.
  4. Upstream equity participation in a greenfield project offered no meaningful reliability improvement before 2033, making it irrelevant to the exposure the board was actually trying to address.
RECOMMENDED STRATEGY
Phase 1: Phase one: contract sixty percent of annual requirement directly with two producers on separate continents, using volume floors with collared pricing. Phase 2: Phase two: retain tender purchasing for the balance, so spot pricing benefits are captured without exposing core application volumes to availability risk. Phase 3: Phase three: invest in on-plantation storage sufficient for one full application window, converting a supply problem into a timing problem.
OUTCOME
The group signed two multi-year producer agreements within eight months and completed storage investment covering roughly seventy percent of a single application window. Average delivered cost rose approximately 5% (client-reported, unverified by MMA), while application volumes have since been met in full across every window without recourse to spot purchasing at distressed pricing.

Frequently Asked Questions

Foundational context covering the market sizes, CAGR, scope, country, region and competition that inform every finding below. This section is provided to cover basics and most often pre-purchase conversations, answered from the MMA Primary Research Dataset.

What is the current size of the Potassium Chloride Market?

The market was worth $32.4 billion in 2025 and is forecast to reach $33.76 billion in 2026. Value reflects both application volume and the price cycle potash is currently working through.

How large will the Potassium Chloride Market be by 2036?

MMA forecasts $50.94 billion by 2036, an expansion multiple of 1.51 times the 2026 base. That represents $17.18 billion of incremental value across the forecast period.

What is the CAGR for the Potassium Chloride Market 2026 to 2036?

The base case compound annual growth rate is 4.2%, with a bull case of 5.4% and a bear case of 3.0%. Historical growth from 2020 to 2025 ran at 3.4%.

Which segment is growing fastest?

Pharmaceutical and food grade potassium chloride at 6.3%, a full 1.50 times the market rate. Sodium reduction regulation across processed food manufacturing drives most of that demand.

Who are the major companies in the Potassium Chloride Market?

Nutrien, Uralkali, Belaruskali, Mosaic and ICL lead, holding 62% of global output between them. Fifteen further producers and developers hold meaningful regional or project positions.

Which country is growing fastest?

Indonesia at 7.2%, driven by palm oil cultivation that removes unusually large potassium volumes per hectare. Almost none of that requirement is produced domestically, so the country imports essentially all of it.

Report Segmentation Architecture

The full report scope spans multiple orthogonal segmentation dimensions, with cross-tabulated demand data provided for each dimension pair. Coverage extends further to regional breakdowns, trend trajectories, and the competitive detail needed to support segment-level decision-making.

By Product Grade and Form

  • Pharmaceutical and Food Grade Potassium Chloride
  • Soluble Fertiliser Grade Potassium Chloride
  • Industrial Chemical Grade Potassium Chloride
  • Compacted Granular Muriate of Potash
  • Standard Crystalline Muriate of Potash

By End-Use Industry

  • Row Crop Agriculture
  • Protected and Irrigated Horticulture
  • Plantation and Tree Crops
  • Food Processing and Salt Replacement
  • Pharmaceutical and Medical Solutions
  • Industrial Chemical Manufacture

By Commercial Dimension

  • Annual Contract Supply to State Importers
  • Multi-Year Direct Producer Agreements
  • Distributor and Blender Channel
  • Trading House and Spot Purchasing
  • Direct Supply to Food and Pharmaceutical Manufacturers

By Region

  • North America
  • Western Europe
  • East Asia
  • South Asia and Pacific
  • Latin America
  • Middle East and Africa
  • Eastern Europe

Scope, Methodology, and Coverage

Every figure in this report is reproducible from documented input assumptions. The scope below maps the historical period, the forecast horizon, the segmentation dimensions, and the countries covered, alongside the underlying primary and qualitative methodology.
Historical Period
2020 to 2025
Forecast Period
2026 to 2036
Base Year
2025 (USD billions; MMA Primary Research Dataset, August 2026)
Market Definition
This report covers potassium chloride, traded as muriate of potash, spanning standard crystalline, compacted granular, soluble fertiliser, industrial chemical and pharmaceutical or food grade material. Coverage includes production by conventional underground mining, solution mining and brine evaporation, and traces value through seaborne trade and inland distribution to the point of application or industrial use. Potassium sulphate, potassium nitrate, langbeinite, polyhalite and other potassium sources, blended NPK fertilisers, and downstream potassium chemicals manufactured from potassium chloride are excluded from scope.
Quantitative Units
USD billions at delivered realised prices; volume in million tonnes potassium chloride; gross margin percentages and capacity utilisation by tier.
Segmentation Dimensions
Product grade and form, end-use industry, commercial dimension, region.
Regions Covered
North America, Western Europe, East Asia, South Asia and Pacific, Latin America, Middle East and Africa, Eastern Europe
Countries Covered
Canada, United States, Mexico, Brazil, Chile, Russia, Belarus, Germany, Spain, Poland, Ukraine, China, Japan, South Korea, India, Indonesia, Malaysia, Australia, Jordan, Israel.
Key Companies Profiled
Nutrien, Uralkali, Belaruskali, Mosaic, ICL, K+S, Arab Potash Company, Qinghai Salt Lake Industry, SQM, EuroChem, and ten further producers and developers.
Quantitative Methodology
Primary survey, n=3,800 respondents, Q4 2025, six countries; demand-side model with trade association cross-validation
Qualitative Methodology
47 expert interviews, Q4 2025; applied to validate demand model assumptions, identify emerging dynamics, and assess competitive positioning
Report Format
PDF and XLSX data workbook (Word format preview document)
Publisher
Market Minds Advisory
Report Code
MMA-2026-AGR-704
Published
August 2026
Contact
sales@marketmindsadvisory.com | www.marketmindsadvisory.com

Purchase the full Potassium Chloride Market Report (2026 to 2036).

The full report sets out ten-year forecasts for potassium chloride by product grade, end-use industry and commercial model across seven regions. It maps the global cash cost curve operation by operation and models trough survival under three price scenarios. Competitive assessment covers twenty producers and developers on a consistent production volume basis, with greenfield project timelines and probability weightings applied to each. Delivered cost is broken down separately for the major import markets, isolating ocean and inland freight components. Findings draw on a quantitative survey of 3,800 respondents across six countries and 47 expert interviews conducted during the fourth quarter of 2025.
Ten-year forecasts by product grade and region
Global cash cost curve mapped operation by operation
Greenfield project timelines with probability weightings applied
Twenty-producer assessment on consistent production volume basis
Delivered cost decomposition across major import markets
Grade margin architecture across three commercial tiers

Built For The People Who Decide

From boardroom strategy to bench-side execution, this report is read cover-to-cover by leaders shaping the next decade of their industry, turning demand scenarios, market dynamics and valuation benchmarks into decisions.
CXOs/ Presidents/ VPs/ Managers
M&A and Corporate Development
Strategy Teams and R&D Heads
Procurement and Product Directors
Regulatory and Compliance Leaders
Investor Relations and Equity Analysts