Market Minds Advisory
Potassium Carbonate Market

Potassium Carbonate Market: Specialty Glass Demand and the Battery Electrolyte Opportunity

Potassium carbonate sits between a mature glass and fertilizer feedstock role, and an emerging battery electrolyte and specialty electronics application pulling high-purity grades into a distinctly faster growth lane. today

Lead Analyst

Bilal Shaikh

Published

September 2026

Make Smarter Decisions with Customized Research Insights

Request a free sample report and evaluate market opportunities, growth trends, and competitive dynamics relevant to your business needs.

2025 MARKET VALUE$2.8BMarket Size 2025
2036 FORECAST VALUE$4.4BBase Case , 2026 to 2036
CAGR 2026 TO 20364.2 %Bull 5.4% / Bear 3.0%
INCREMENTAL OPPORTUNITY$1.5BNet 10- year value creation
EXPANSION MULTIPLE1.51x2036 value over 2026 base
Strategic Levers
M&A Pipeline
Regional Outlook
Country Rankings
Competitive Intelligence
Segmental Deep-dive
Call-Us : 91 93563 13602

Executive Snapshot and Market Trajectory

Potassium carbonate built its commercial base on glass manufacturing and fertilizer feedstock roles that still define most of the category's volume today. High-purity grades for electronics and battery electrolytes are now the fastest-growing corner of the business, and that shift is reshaping where new capacity gets built. Momentum keeps building.
Electronics and specialty chemical grades are growing fastest as battery electrolyte formulators and display panel manufacturers specify high-purity potassium carbonate that commodity glass-grade material cannot satisfy. East Asia anchors global demand on China's dominant production base and glass manufacturing scale, while North America follows on specialty chemical manufacturing rather than pure glass volume. That geographic split reflects production economics as much as raw consumer demand. Producers investing early sit ahead of that curve.
Twenty companies compete across a market split between commodity glass and fertilizer-grade potassium carbonate sold largely through established industrial buyer relationships, and high-purity electronics and pharmaceutical grades earning meaningfully more on purification depth and certification documentation. Potash feedstock price volatility genuinely complicates margin planning in ways long-term industrial contracts cannot always fully absorb, and that exposure keeps widening for smaller regional producers over time.
Market Definition
The market covers potassium carbonate produced for glass manufacturing, fertilizer, food additive, pharmaceutical, detergent, and specialty electronics applications. Potassium chloride sold as raw fertilizer feedstock and unrelated potassium hydroxide products are excluded from this scope.
Base Year Value
$2.8B in 2025 (MMA Primary Research Dataset, August 2026)
Forecast Period
2026 to 2036, eleven discrete annual values
CAGR
4.2% base case. Bull 5.4%. Bear 3.0%.
Fastest Growth Segment
Electronics and Specialty Chemicals: 7.8% CAGR
Fastest Growth Country
India: 6.8% CAGR
Fastest Growth Region
South Asia and Pacific: 6.2% CAGR
Largest Region
East Asia: 30% of 2025 global value
Market Leaders
Armand Products Company, Nippon Chemical Industrial Co Ltd, Aditya Birla Chemicals, Merck KGaA, ICL Group. Source: MMA Analysis based on company annual reports.
Primary Survey
n=3,800 procurement and R&D decision-makers, Q4 2025, six countries
Methodology
Demand-side build-up, cross-validated against public data, 47 expert interviews

Potassium Carbonate Market Forecast Scenarios

potassium-carbonate-market-trends-size-forecast-scenario-1787580288157
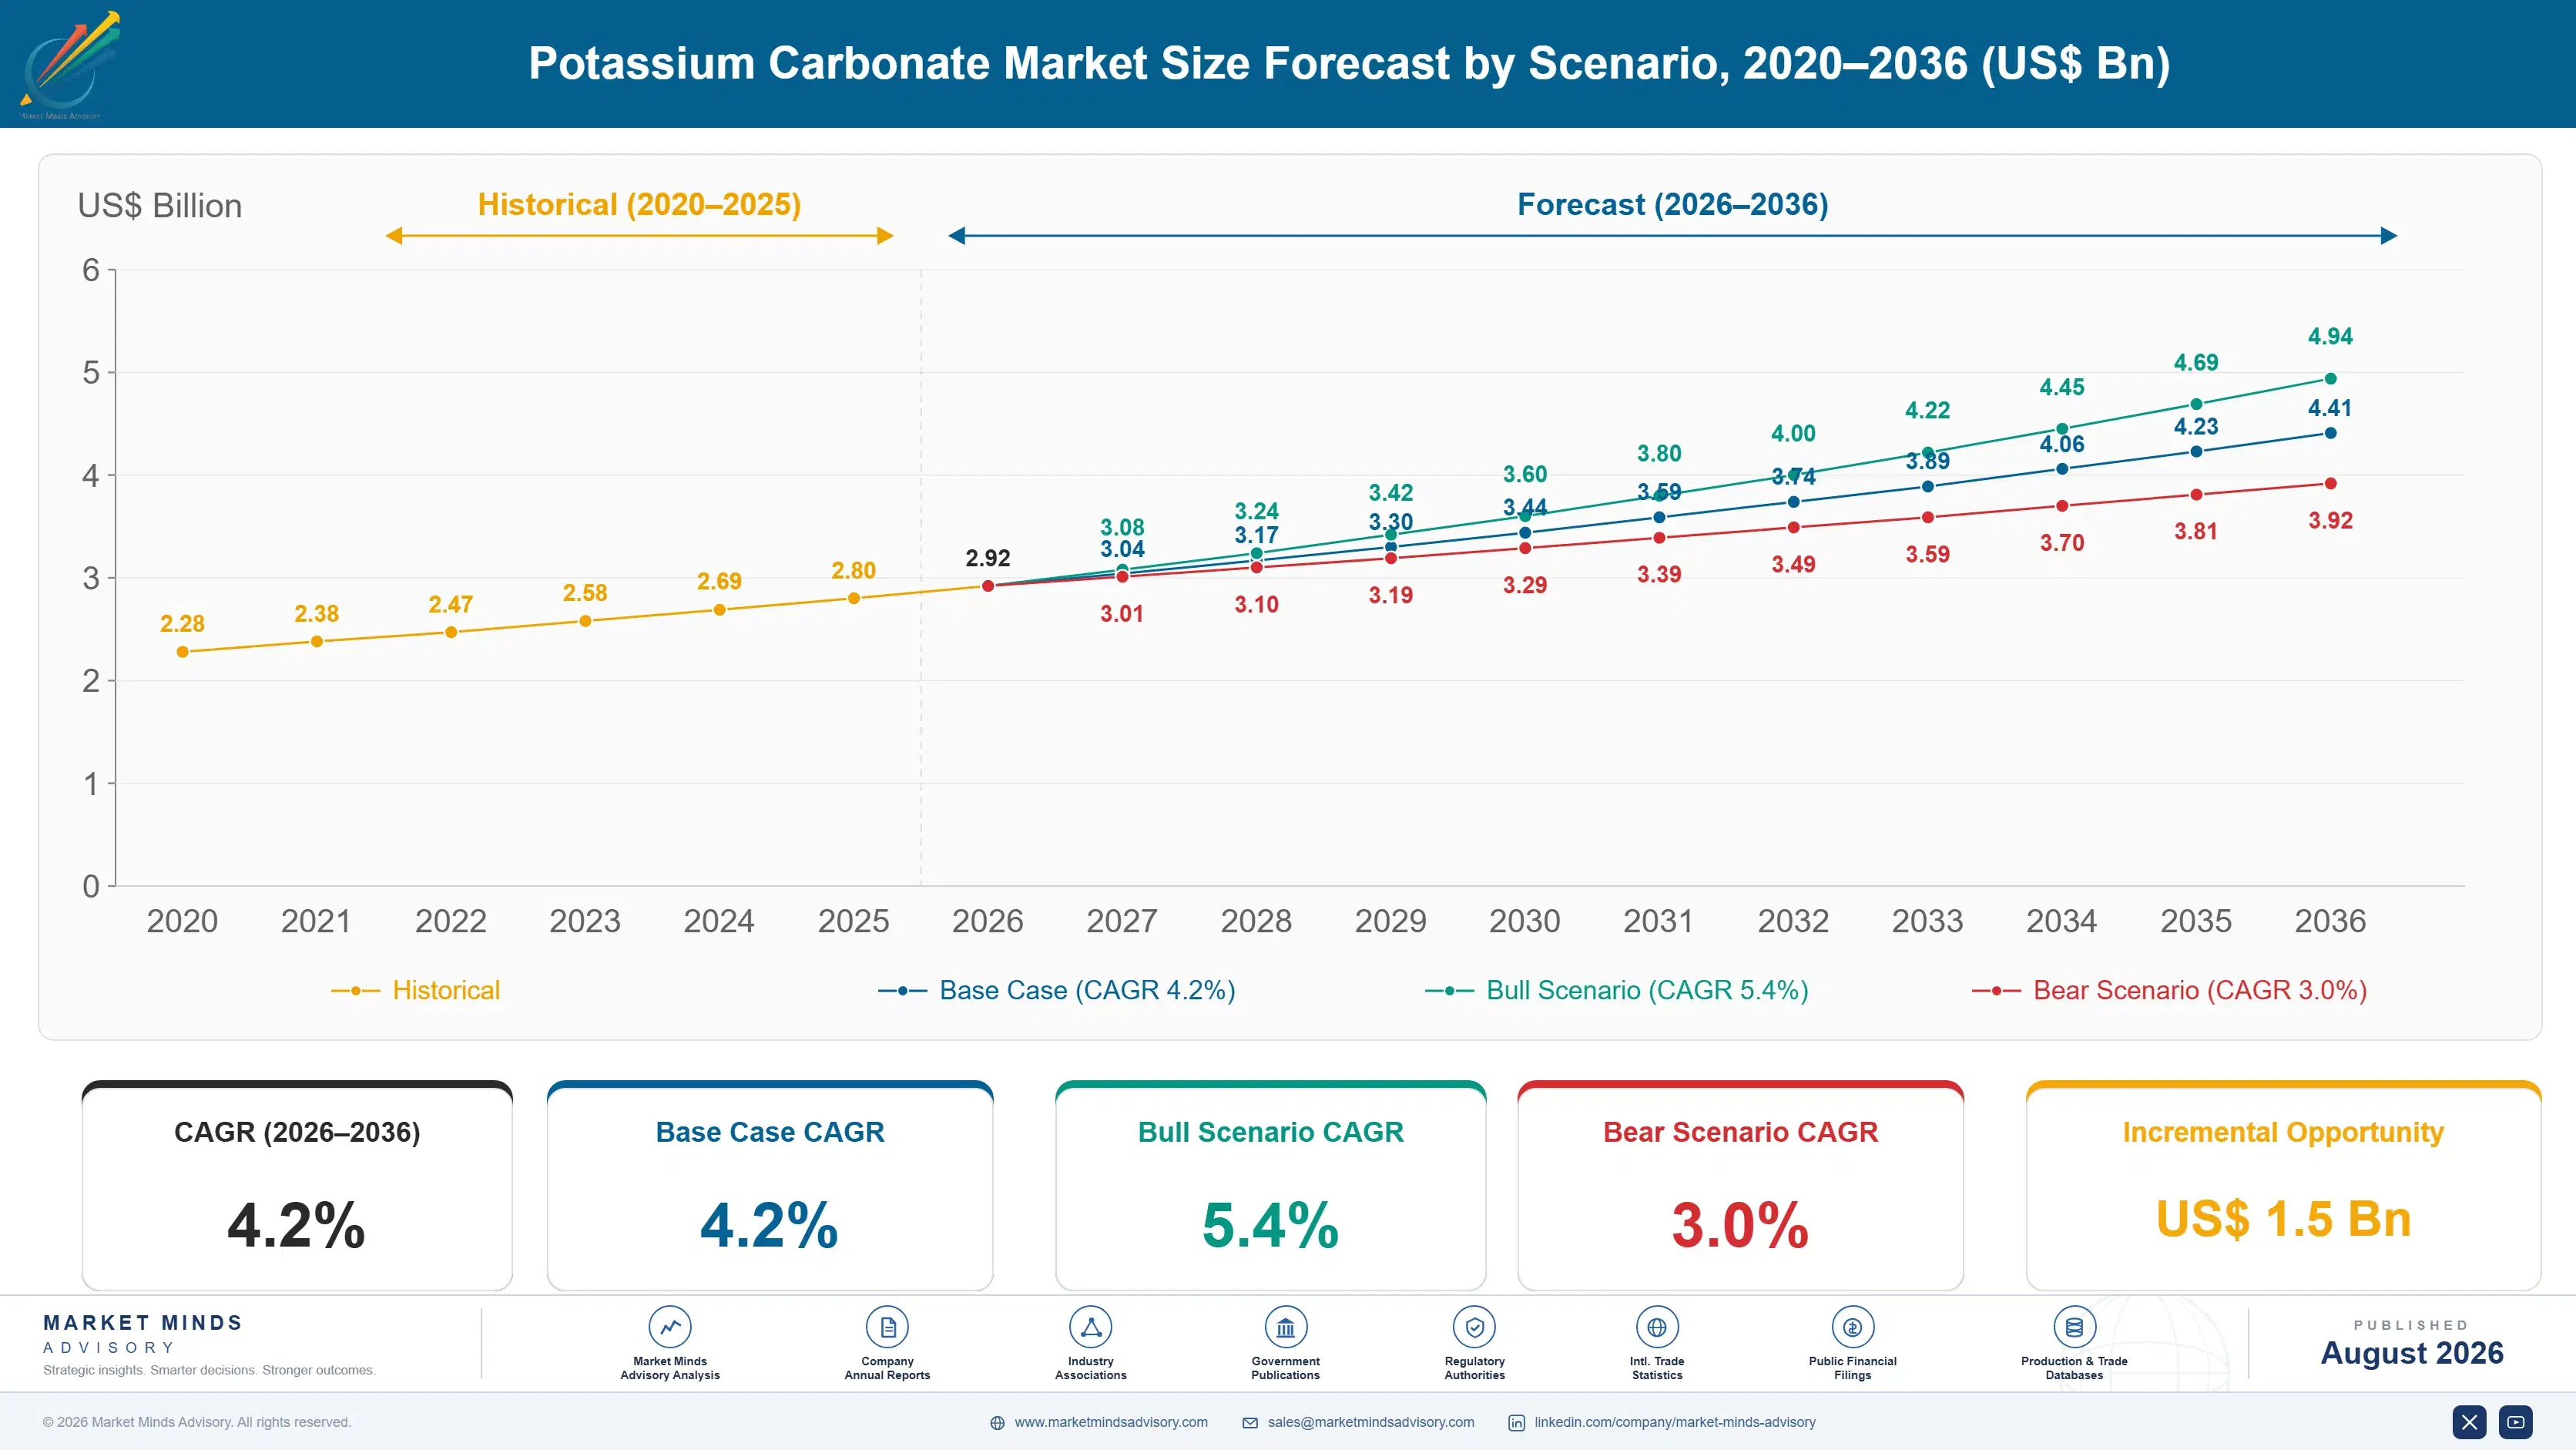
Between 2020 and 2025 the market grew near 3.8% a year, held back by soft construction-linked flat glass demand before specialty electronics and battery electrolyte grade adoption began contributing meaningfully toward the end of the historical period, a shift that only strengthened once battery manufacturers scaled production. Municipal and industrial demand has since stabilised, restoring more predictable annual growth across most developed markets.
The base case carries the market to 4.2% CAGR on three mechanisms: specialty glass and display panel demand expanding across consumer electronics manufacturing, potassium-based fertilizer demand growing alongside food security programs in emerging markets, and battery electrolyte grade adoption accelerating alongside lithium-ion cell production. None of these three mechanisms depends on any single end-use category recovering alone, which is what makes the base case durable across construction cycles. Investors increasingly reward that diversification with steadier valuation.
The bull case at 5.4% assumes faster battery electrolyte grade adoption across major cell manufacturers than currently modelled. The bear case at 3.0% assumes continued soft flat glass demand outweighs specialty grade growth by a wider margin than currently anticipated, leaving overall category volume flatter than the base case projects. Neither scenario depends on any single end-use category alone.

Glass Feedstock Meets the Battery Electrolyte Pull

Three forces shape this market at once, and each moves on its own separate timeline. Glass and fertilizer-grade volume tracks construction and agricultural cycles set years in advance, food and pharmaceutical-grade demand tracks regulatory and consumer health trends largely independent of those industrial cycles, and electronics-grade demand tracks battery and display manufacturing investment disconnected from either commodity driver.
GLASS APPLICATION SHARE34%share of volume consumed by glass manufacturing customers
AVERAGE SELLING PRICEUSD 1,150/tonneblended price across commodity and high-purity grades sold
TOP PRODUCER SHARE16%largest single producer share of category chemical revenue
PURITY SPECIFICATION RANGE99 to 99.9%typical purity range across industrial and electronics grades
POTASH COST SHARE52%share of production cost from potassium feedstock inputs
HHI CONCENTRATION710a moderately concentrated category with regional production scale
Commercially, the market behaves like a specialty electronics materials business wearing a commodity chemical label. Purity genuinely matters, since battery electrolyte and pharmaceutical applications depend on documented trace-metal specification that buyers scrutinise closely during qualification, but adoption still tracks delivered cost and production reliability more than pure chemical formula alone. A producer with proven high-purity capability competes on technical trust long before it competes on price.
Over the next decade, electronics and pharmaceutical-grade demand will decide winners more than glass volume alone, since glass demand already tracks a well-established, predictable construction replacement cycle. Companies investing early in high-purity purification capacity will capture growth that commodity-grade producers cannot easily replicate without significant capital investment. Later movers will find catching up considerably more expensive once that capacity gap compounds.
"This chemical spent decades as a glass industry afterthought. Battery makers are now willing to pay a real premium for purity that glass customers never once asked for."
Director, Specialty Inorganic Chemicals Practice · MMA Chemicals and Materials Practice · August 2026

Market Trends

Battery Electrolyte Demand Pulls High-Purity Grades Into Focus

Lithium-ion battery electrolyte formulators increasingly specify high-purity potassium carbonate with tightly controlled trace-metal content, a specification that commodity glass and fertilizer-grade producers were never designed to satisfy at the required consistency. This application reaches an entirely different buyer base than traditional glass and agriculture customers, spanning battery cell manufacturers and electrolyte formulators investing at a pace industrial chemical demand rarely matches. Producers with dedicated high-purity purification capacity are capturing this demand fastest, since retooling standard production for electronics-grade tolerances requires meaningful capital investment most commodity-focused producers have not committed to.
Market Impact: Adds USD 62 million by 2029
Solar and Display Glass Manufacturing Shifts Specification Standards

Glass manufacturers producing solar panel and display panel substrates increasingly specify low-iron, high-clarity glass formulations that depend on tightly controlled potassium carbonate purity for optical performance, driven by rising demand for higher-efficiency solar cells and premium display products across consumer electronics. Producers sourcing consistent, low-impurity potassium carbonate are capturing this specification shift specifically, since standard glass-grade material carries broader impurity tolerance than these premium applications now require. This shift is gradually changing how glass manufacturers structure long-term chemical supply agreements with producers. Buyers increasingly request documented impurity testing before finalising annual purchase agreements with any single supplier.
Market Impact: Adds USD 48 million by 2030

Market Opportunities and Growth Drivers

Specialty Glass and Display Panel Demand Expands

Consumer electronics manufacturing continues expanding display panel and touch-screen glass production across East Asian manufacturing hubs, and potassium carbonate remains a critical flux agent for the low-melting-point, high-clarity glass formulations these products require. Display manufacturers increasingly favour potassium-based flux chemistry over sodium alternatives given the optical clarity and thermal performance advantage this represents. This electronics-linked demand base provides a stable multi-year foundation even as broader flat glass construction demand fluctuates with interest rates and building activity. Manufacturers increasingly favour suppliers who can demonstrate consistent optical clarity performance across production batches.
Market Impact: Swings margin 3 to 5 points

Food Security Programs Expand Potassium Fertilizer Demand

Government food security programs across several emerging markets have expanded agricultural input subsidies specifically targeting potassium-based fertilizers, directing farmer purchasing toward potassium carbonate and related potassium compounds on a scheduled multi-year basis. This policy-driven demand creates a reasonably predictable demand pipeline that agricultural input distributors can plan around regardless of broader commodity price conditions, since subsidy programs typically carry multi-year budget commitments. Producers with established agricultural-grade certification are positioned to capture this demand ahead of newer market entrants still completing qualification. Producers with early distributor relationships in these markets are positioned to capture disproportionate share once subsidy programs scale further.
Market Impact: Caps addressable share at 58%

Market Restraints and Challenges

Potash Feedstock Price Volatility Complicates Margin Planning

Potassium chloride and other potash feedstock prices fluctuate meaningfully with global fertilizer market conditions and mining production levels, creating margin pressure that fixed-price industrial contracts often cannot fully absorb during periods of sustained feedstock cost increases. The root cause is potassium carbonate producers' direct exposure to global potash mining markets that move independently of chemical demand or manufacturing activity. Producers are responding by negotiating feedstock price escalation clauses into longer-term industrial contracts and by increasing forward potash purchasing to smooth cost volatility across delivery periods. Larger producers with diversified purchasing manage this exposure better.
Market Impact: Adds USD 85 million in demand

Sodium Carbonate Substitution Limits Share in Some Applications

Sodium carbonate remains meaningfully cheaper than potassium carbonate for standard container and flat glass applications where potassium's optical and thermal advantages matter less to production economics, limiting potassium carbonate's addressable share in price-sensitive commodity glass segments. The root cause is sodium carbonate's lower feedstock cost and broader global supply availability compared with potassium carbonate's more concentrated production base. Producers are responding by focusing commercial investment on applications where potassium's technical advantages command real specification preference, rather than competing head-on with sodium carbonate in commodity glass segments. This focus has let producers defend margin.
Market Impact: Lifts specialty glass demand 11%
3 additional market trends, 4 additional growth drivers, and 2 additional restraints and challenges are covered in the full report. Contact sales@marketmindsadvisory.com to access the complete intelligence.

Segment CAGR and Growth Architecture

Segmentation follows end-use application, the single commercial logic determining purity requirement, certification pathway, and buyer relationship structure across the category. Glass manufacturing dominates by volume, while electronics and pharmaceutical grades grow fastest on purification investment and premium buyer reach. Buyers evaluate suppliers against this same lens throughout qualification. That lens shapes procurement decisions broadly.
potassium-carbonate-market-trends-market-share-analysis-1787580288696

Electronics and Specialty Chemicals

Electronics and specialty chemicals grow fastest at 7.8%, about 1.86 times the overall 4.2% rate, as battery electrolyte formulators and display panel manufacturers specify high-purity potassium carbonate with tightly controlled trace-metal content that commodity glass-grade producers were never designed to satisfy. This application reaches an entirely different buyer base than traditional glass and agriculture customers, spanning battery cell manufacturers and electronics producers investing at a pace industrial chemical demand rarely matches. Producers with dedicated high-purity purification capacity are capturing this demand fastest, since retooling standard production for electronics-grade tolerances requires meaningful capital investment most commodity-focused producers have not committed to. Suppliers serving this segment increasingly need dedicated trace-metal testing entirely distinct from standard industrial-grade qualification.
CAGR 7.8%

Pharmaceutical and Personal Care

Pharmaceutical and personal care applications grow second-fastest at 6.5%, driven by potassium carbonate's use as a buffering agent and excipient in oral care, effervescent tablet, and topical formulation manufacturing requiring pharmacopoeia-grade purity documentation. This application has proven particularly valuable as pharmaceutical manufacturers increasingly favour domestic, traceable supply chains over imported commodity-grade material given regulatory scrutiny on excipient sourcing. Manufacturers increasingly combine potassium carbonate sourcing decisions with broader excipient supply chain qualification programs rather than treating it as a standalone commodity purchase. Producers here compete on documentation depth and batch consistency given the specification requirements these products demand. Regulatory scrutiny on excipient traceability continues intensifying across major pharmaceutical markets, reinforcing this sourcing shift further.
CAGR 6.5%
Full segment breakdown across 6 segments available in the complete report.

Regional Architecture and Country Demand Map

East Asia leads on China's dominant production base and glass manufacturing scale, North America follows on specialty chemical manufacturing depth, and South Asia and Pacific posts the fastest regional growth. Reflecting a considerably smaller existing base than East Asia's dominant manufacturing scale offers scale.. overall.

North America

Specialty chemical manufacturing depth, rather than pure glass volume, explains North America's 22% share and its 4.8% growth, anchored by Armand Products and other domestic producers serving pharmaceutical, food, and increasingly electronics-grade demand. Canadian potash mining operations contribute meaningfully to regional feedstock supply, giving North American producers a cost advantage that import-dependent regions cannot match as easily. Battery electrolyte grade demand adds a second major growth vector here as domestic lithium-ion cell manufacturing expands under federal manufacturing incentive programs. Growth here should keep tracking specialty grade adoption more than any independent construction cycle. Retail and industrial distribution partnerships across major chemical distributors also continue expanding the category's reach into smaller manufacturers.
Share: 22% | CAGR: 4.8% (2026 to 2036)

Western Europe

Mature glass and fertilizer application markets already largely saturated explain Western Europe's 20% share and its 2.8% growth, the slowest of any region tracked here, reflecting a market where flat glass and agricultural demand growth has plateaued across most established economies. German and French specialty chemical producers continue steady output for pharmaceutical and food-grade applications, while UK producers pursue niche electronics-grade certification programs. Growth here reflects a genuinely mature demand base rather than any weakening in underlying production capability. Regional producers maintain substantial technical service capacity despite the slower growth outlook. Regional producers increasingly redirect capacity toward export and specialty-grade markets given the domestic demand plateau. A modest number of niche producers continue investing selectively in electronics-grade capability.
Share: 20% | CAGR: 2.8% (2026 to 2036)
Regional intelligence for 5 additional markets available in the complete report: East Asia, South Asia and Pacific, Latin America, Middle East and Africa, Eastern Europe. Contact sales@marketmindsadvisory.com.
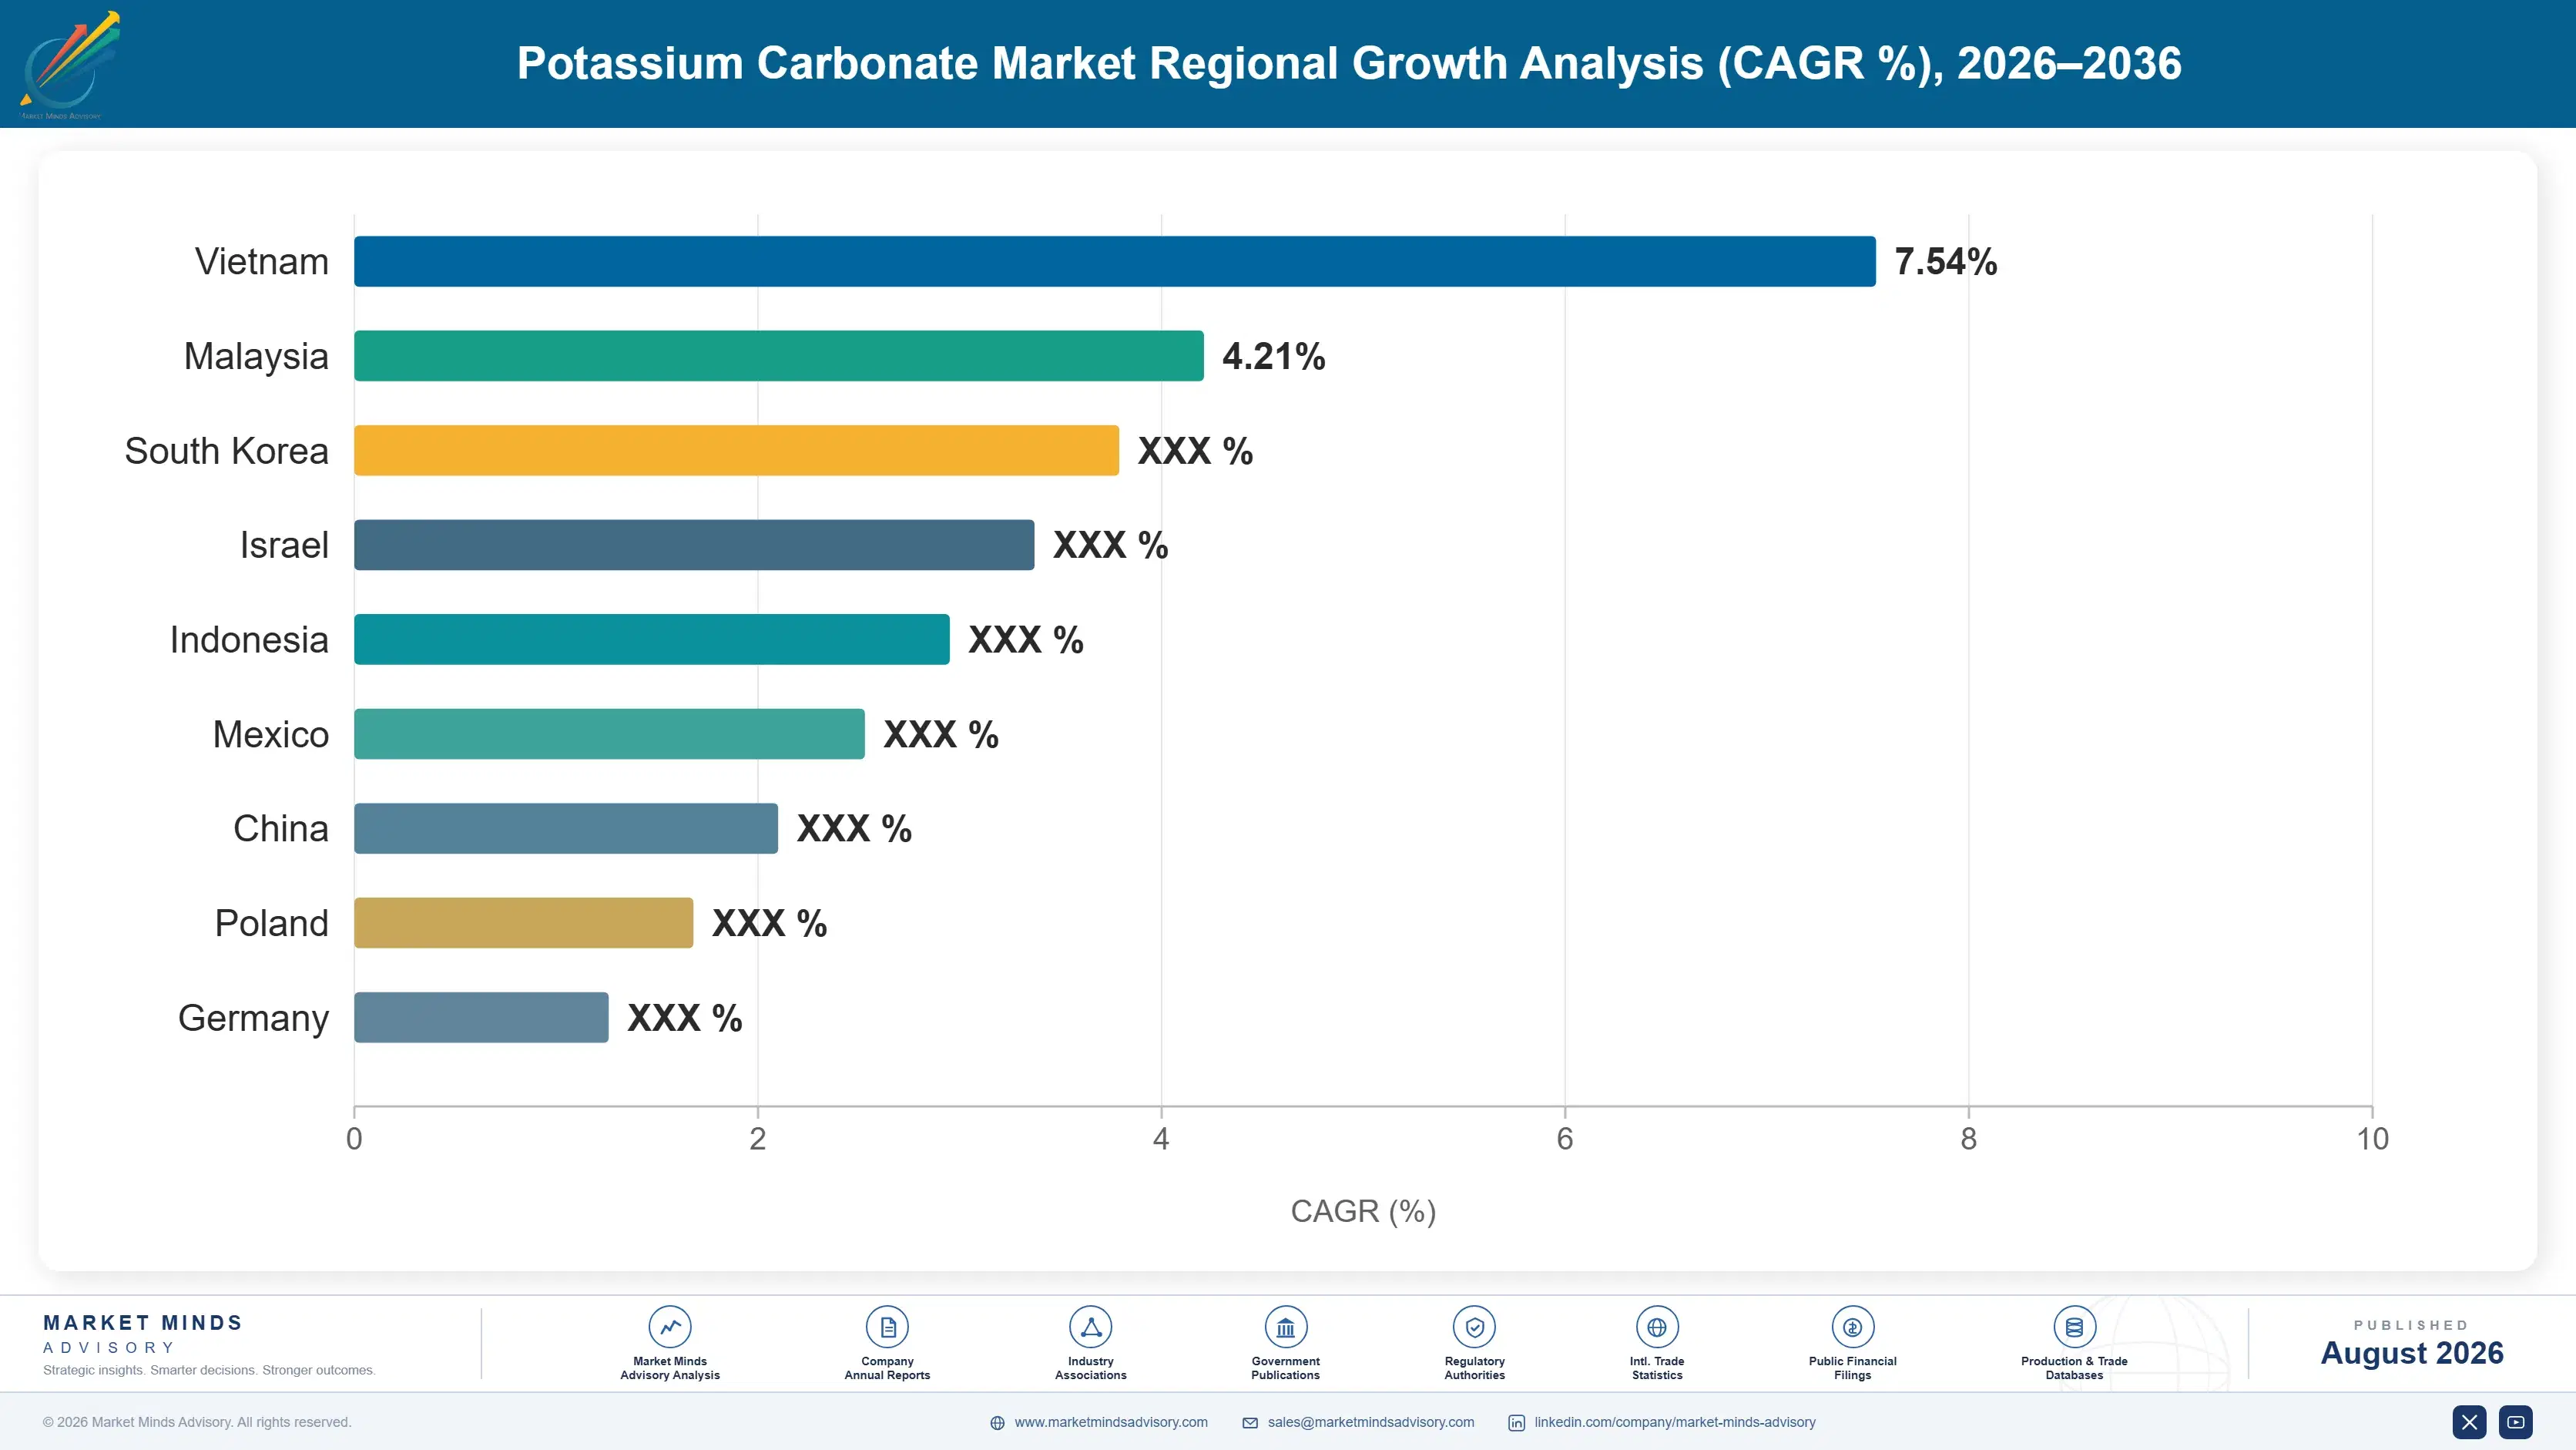
potassium-carbonate-market-trends-country-cagr-analysis-1787580289216

Where Producers Can Defend Category Margin

Glass and fertilizer-grade volume sets a real ceiling on legacy growth in this market, but four commercial moves let producers capture more value above that ceiling regardless of application, and regardless of how quickly electronics-grade demand ultimately reshapes overall category revenue mix across the coming decade of specialty demand growth. Each requires distinct investment ahead of visible demand.

Build purification capacity ahead of demand

Producers investing in high-purity purification capacity ahead of broader industry recognition of battery electrolyte demand's commercial scale capture cell manufacturer contracts that commodity-grade producers cannot service at required trace-metal specification. This investment requires meaningful capital expenditure distinct from standard industrial-grade manufacturing, but electronics-grade material already commands premiums of 35% to 50% over commodity-grade pricing, and early movers are securing multi-year manufacturer relationships that later entrants find considerably harder to displace once qualified. Manufacturers increasingly favour suppliers who can demonstrate proven trace-metal consistency across a range of production batches rather than laboratory results alone.
Market Impact: Captures a 35% to 50% price premium now

Secure pharmacopoeia certification across markets early

Producers securing pharmacopoeia-grade certification across multiple national regulatory jurisdictions capture pharmaceutical excipient contracts that uncertified competitors cannot bid on given the documentation and traceability requirements involved. This investment requires sustained regulatory affairs and quality system investment distinct from standard industrial-grade qualification, but it opens access to a growing, higher-margin demand pipeline that pharmaceutical manufacturers increasingly prefer sourcing domestically, expanding a producer's addressable contract base by roughly 6 to 9 percentage points. Manufacturers increasingly treat certification breadth as a baseline qualification requirement rather than a differentiator once several competitors have secured it.
Market Impact: Expands addressable contracts by 6 to 9 points

Expand specialty glass flux qualification programs

Producers demonstrating consistent, low-impurity potassium carbonate supply for solar and display glass applications are winning specification wins that standard glass-grade material increasingly cannot match on optical performance. This qualification requires dedicated quality control investment spanning one to two years, but it directly addresses a specification preference shift that shows every sign of accelerating rather than reversing across major glass manufacturer customers. Glass manufacturers increasingly request documented optical performance history before shortlisting any supplier for major production contracts. Producers documenting a 10% to 15% optical clarity improvement over standard grade are winning premium glass manufacturer contracts specifically.
Market Impact: Wins about 14% more glass contracts today outright

Lock long-term potash supply contracts with escalation terms

Producers negotiating long-term potash feedstock contracts with defined price escalation terms tied to industrial contract pricing reduce margin exposure to spot-market feedstock volatility that smaller regional competitors absorb directly. This approach requires sustained procurement relationship investment with major potash suppliers, but producers with these arrangements in place have maintained more stable margins through the past several feedstock price cycles than competitors purchasing on spot terms. Producers securing 3 to 5 year fixed-escalation deals report steadier margins than spot-market peers across recent cycles. Producers securing 3 to 5 year fixed-escalation deals report steadier quarterly margins than spot-market peers.
Market Impact: Stabilises margin within 3 to 4 points now

Who Controls the Margin Pool

Concentration is moderate at a CR5 of 48%, measured consistently across all participants on potassium carbonate production capacity. Armand Products Company and Nippon Chemical Industrial lead on purification technology and regional distribution scale respectively, and the gap to Aditya Birla and other established challengers reflects decades of certification and technical service investment rather than any single production advantage a challenger cannot eventually close given sufficient capital commitment.
Competitive activity today runs along three lines: high-purity purification capacity investment targeting battery electrolyte demand, pharmacopoeia-grade certification expansion across new regulatory jurisdictions, and specialty glass flux qualification targeting solar and display panel manufacturers. Smaller regional producers lacking certification breadth increasingly pursue distribution partnerships with established majors rather than building independent regulatory approval pathways from scratch given the capital and time required. That shift favours integrated producers over narrow specialists.

Pressure is building from Chinese producers expanding export capacity specifically to challenge established Western incumbents on delivered cost, while electronics-grade demand reshapes where established majors direct new purification investment. Any producer still relying purely on commodity glass and fertilizer-grade volume without electronics or pharmaceutical-grade diversification faces a widening margin disadvantage that production scale alone cannot offset indefinitely.
potassium-carbonate-market-trends-company-positioning-matrix-1787580289744

Competitive Moat and Risk Dimensions

ARMAND PRODUCTS COMPANY

Moat: Deep North American purification expertise

Armand Products operates established high-purity purification capacity serving pharmaceutical, food, and increasingly electronics-grade customers across North America, giving it technical credibility smaller specialty producers cannot replicate quickly. Its integrated potash feedstock relationships also provide cost stability competitors purchasing on spot terms cannot match. That integration also lets it offer more consistent delivery schedules than competitors purchasing feedstock on spot terms.
ARMAND PRODUCTS COMPANY

Risk: Concentrated regional production footprint

Armand Products' manufacturing remains concentrated in North America specifically, exposing it more directly to regional feedstock and energy cost swings than more geographically diversified competitors with production capacity spread across multiple continents. A prolonged regional feedstock or energy cost spike would weigh more heavily on Armand Products than on globally diversified rivals.
NIPPON CHEMICAL INDUSTRIAL

Moat: Established electronics-grade technical relationships

Nippon Chemical Industrial holds long-standing supply relationships with Japanese and Korean electronics and display panel manufacturers, built over decades of certified supply into demanding quality-controlled procurement programs. This technical trust and installed base gives it renewal advantage that newer entrants cannot replicate without comparable track record.
NIPPON CHEMICAL INDUSTRIAL

Risk: Higher cost base than rivals

Nippon Chemical Industrial's Japanese manufacturing base carries meaningfully higher production cost than Chinese competitors benefiting from domestic potash access and lower labour costs, pressuring margin in price-sensitive commodity-grade segments where technical differentiation matters less. This cost disadvantage limits its ability to compete on price in commodity-grade segments outside Japan and Korea.

Players Tracked

Prominent Players

Armand Products Company
Nippon Chemical Industrial Co Ltd
Aditya Birla Chemicals
Merck KGaA
ICL Group

Other Key Players

K+S Aktiengesellschaft
Tata Chemicals
American Elements
Shandong Haiwang Chemical
Jiangsu Kolod Food Ingredients
Shandong Cathay Chemical
Sichuan Zhonghe Chemical
Weifang Kaifeng Chemical
Anhui Sun Fine Chemical
Nikko Chemicals
Vynova Group
Kemira Oyj
Sinochem International
Solvay SA
Prayon Group

Recent Developments

JANUARY 2025

Armand Products expands high-purity production capacity

Armand Products Company completed a capacity expansion at its domestic production facility, adding high-purity purification lines ahead of rising battery electrolyte and pharmaceutical-grade demand. The project was an organic expansion funded internally, targeting electronics customers specifically. Regulators completed a standard review before the expansion reached full commercial production capacity.
Signal: Established producers keep investing in high-purity capacity rather than defending glass volume alone. That confidence signals demand strength.
SEPTEMBER 2024

ICL Group signs specialty glass supply agreement

ICL Group signed a multi-year supply agreement with a major solar glass manufacturer covering low-impurity potassium carbonate volume across several production facilities. The arrangement was a commercial supply contract, including technical support commitments. Analysts view the deal as confirmation of accelerating solar glass investment across the region.
Signal: Specialty glass manufacturers value integrated technical support alongside supply increasingly. Technical trust increasingly outweighs price in this niche.
MAY 2025

Aditya Birla acquires specialty purification technology company

Aditya Birla Chemicals acquired a smaller specialty purification technology company outright, a genuine acquisition rather than a joint venture or minority stake, adding electronics-grade purification capability to its industrial chemical portfolio. The purchase strengthens Aditya Birla's position in the fast-growing electronics-grade segment considerably. The deal adds electronics-grade purification capability.
Signal: Major industrial chemical companies buy specialty purification technology rather than building it internally. Build versus buy favours buying proven technology.

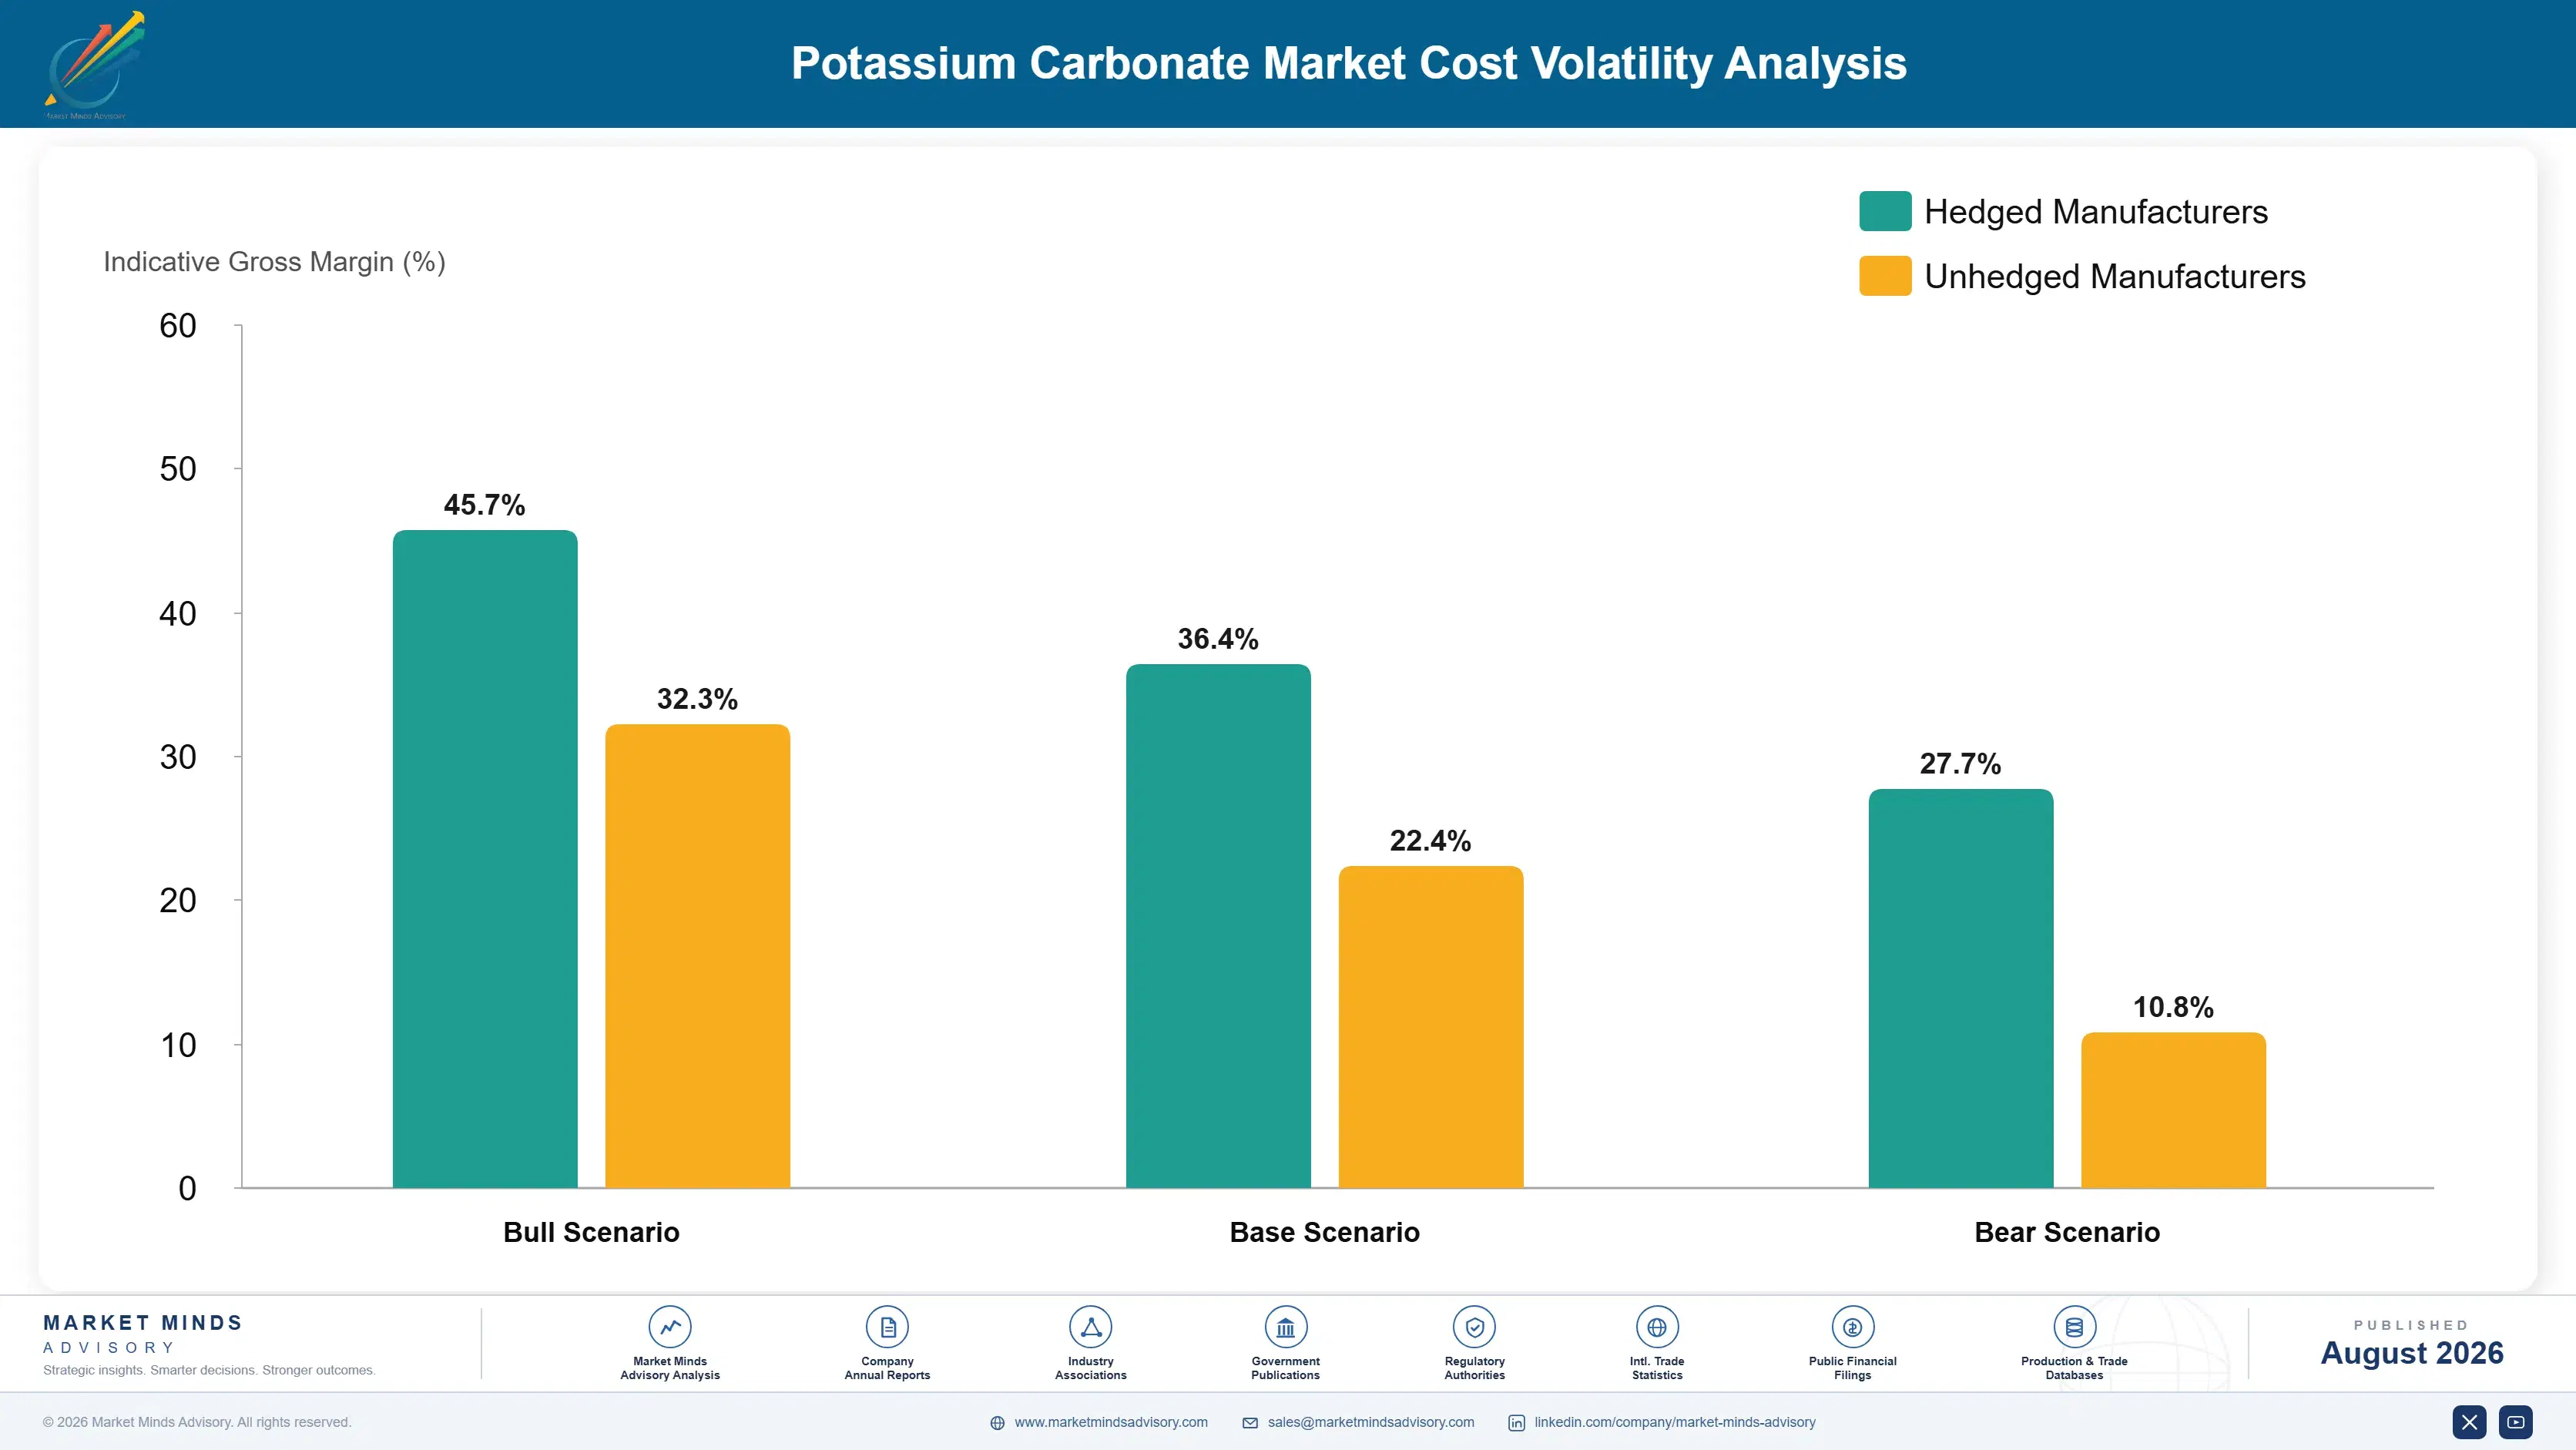
Potash Feedstock Cost

Potassium chloride and other potash feedstock runs 52% of cost of goods sold across potassium carbonate producers, sourced either through integrated mining operations or purchased separately from major potash producers under annual or multi-year contracts. Carbonation processing, purification, and quality testing add a further 20% to 26%, with packaging and logistics making up much of the remainder given the product's bulky, moisture-sensitive nature.
The 2022 global potash price spike showed how directly that exposure translates into margin. Potash prices climbed sharply that year as export restrictions from Belarus and Russia disrupted global fertilizer supply chains following broader geopolitical disruption, and industry data recorded potassium feedstock contract pricing climbing meaningfully across multiple consecutive quarters. Producers without long-term fixed-price potash contracts absorbed a disproportionate share of that increase given the speed of the underlying feedstock cost movement.

Exposure separates producers cleanly by contract structure and purchasing scale. Larger incumbents with long-term potash supply agreements and price escalation clauses tied to industrial contract pricing absorbed that shock more effectively than smaller regional producers purchasing feedstock on spot or short-term terms. That gap has hardened into a durable disadvantage for smaller producers without the purchasing scale to negotiate favourable long-term contracts.
potassium-carbonate-market-trends-cost-volatility-analysis-1787580289941

Negotiate long-term potash contracts with escalation clauses

Producers locking multi-year potassium chloride pricing with defined escalation clauses tied to industrial contract terms remove much of the spot-market volatility that follows any single feedstock price disruption. This approach has become increasingly standard among larger potassium carbonate producers with the purchasing scale to negotiate favourable forward terms with major potash suppliers. Producers without this structure absorb more volatility.

Diversify potash sourcing across multiple suppliers

Producers sourcing potassium chloride from multiple suppliers and geographic regions reduce exposure to localized supply disruption or price spikes affecting any single mining producer. This diversification requires additional supplier relationship management but has proven valuable during recent potash price volatility affecting broader fertilizer markets simultaneously. This approach also reduces reliance on any single mining producer's output schedule or logistics network.

Shift product mix toward higher-margin specialty grades

Producers with greater electronics and pharmaceutical-grade revenue share are less exposed to feedstock volatility relative to revenue, since premium specialty-grade pricing carries more room to absorb input cost increases than thin-margin commodity glass and fertilizer-grade sales. This mix shift provides a genuine cushion during periods of sustained feedstock cost pressure. Investors reward this discipline with better multiples.

Portfolio Architecture for Margin Defence

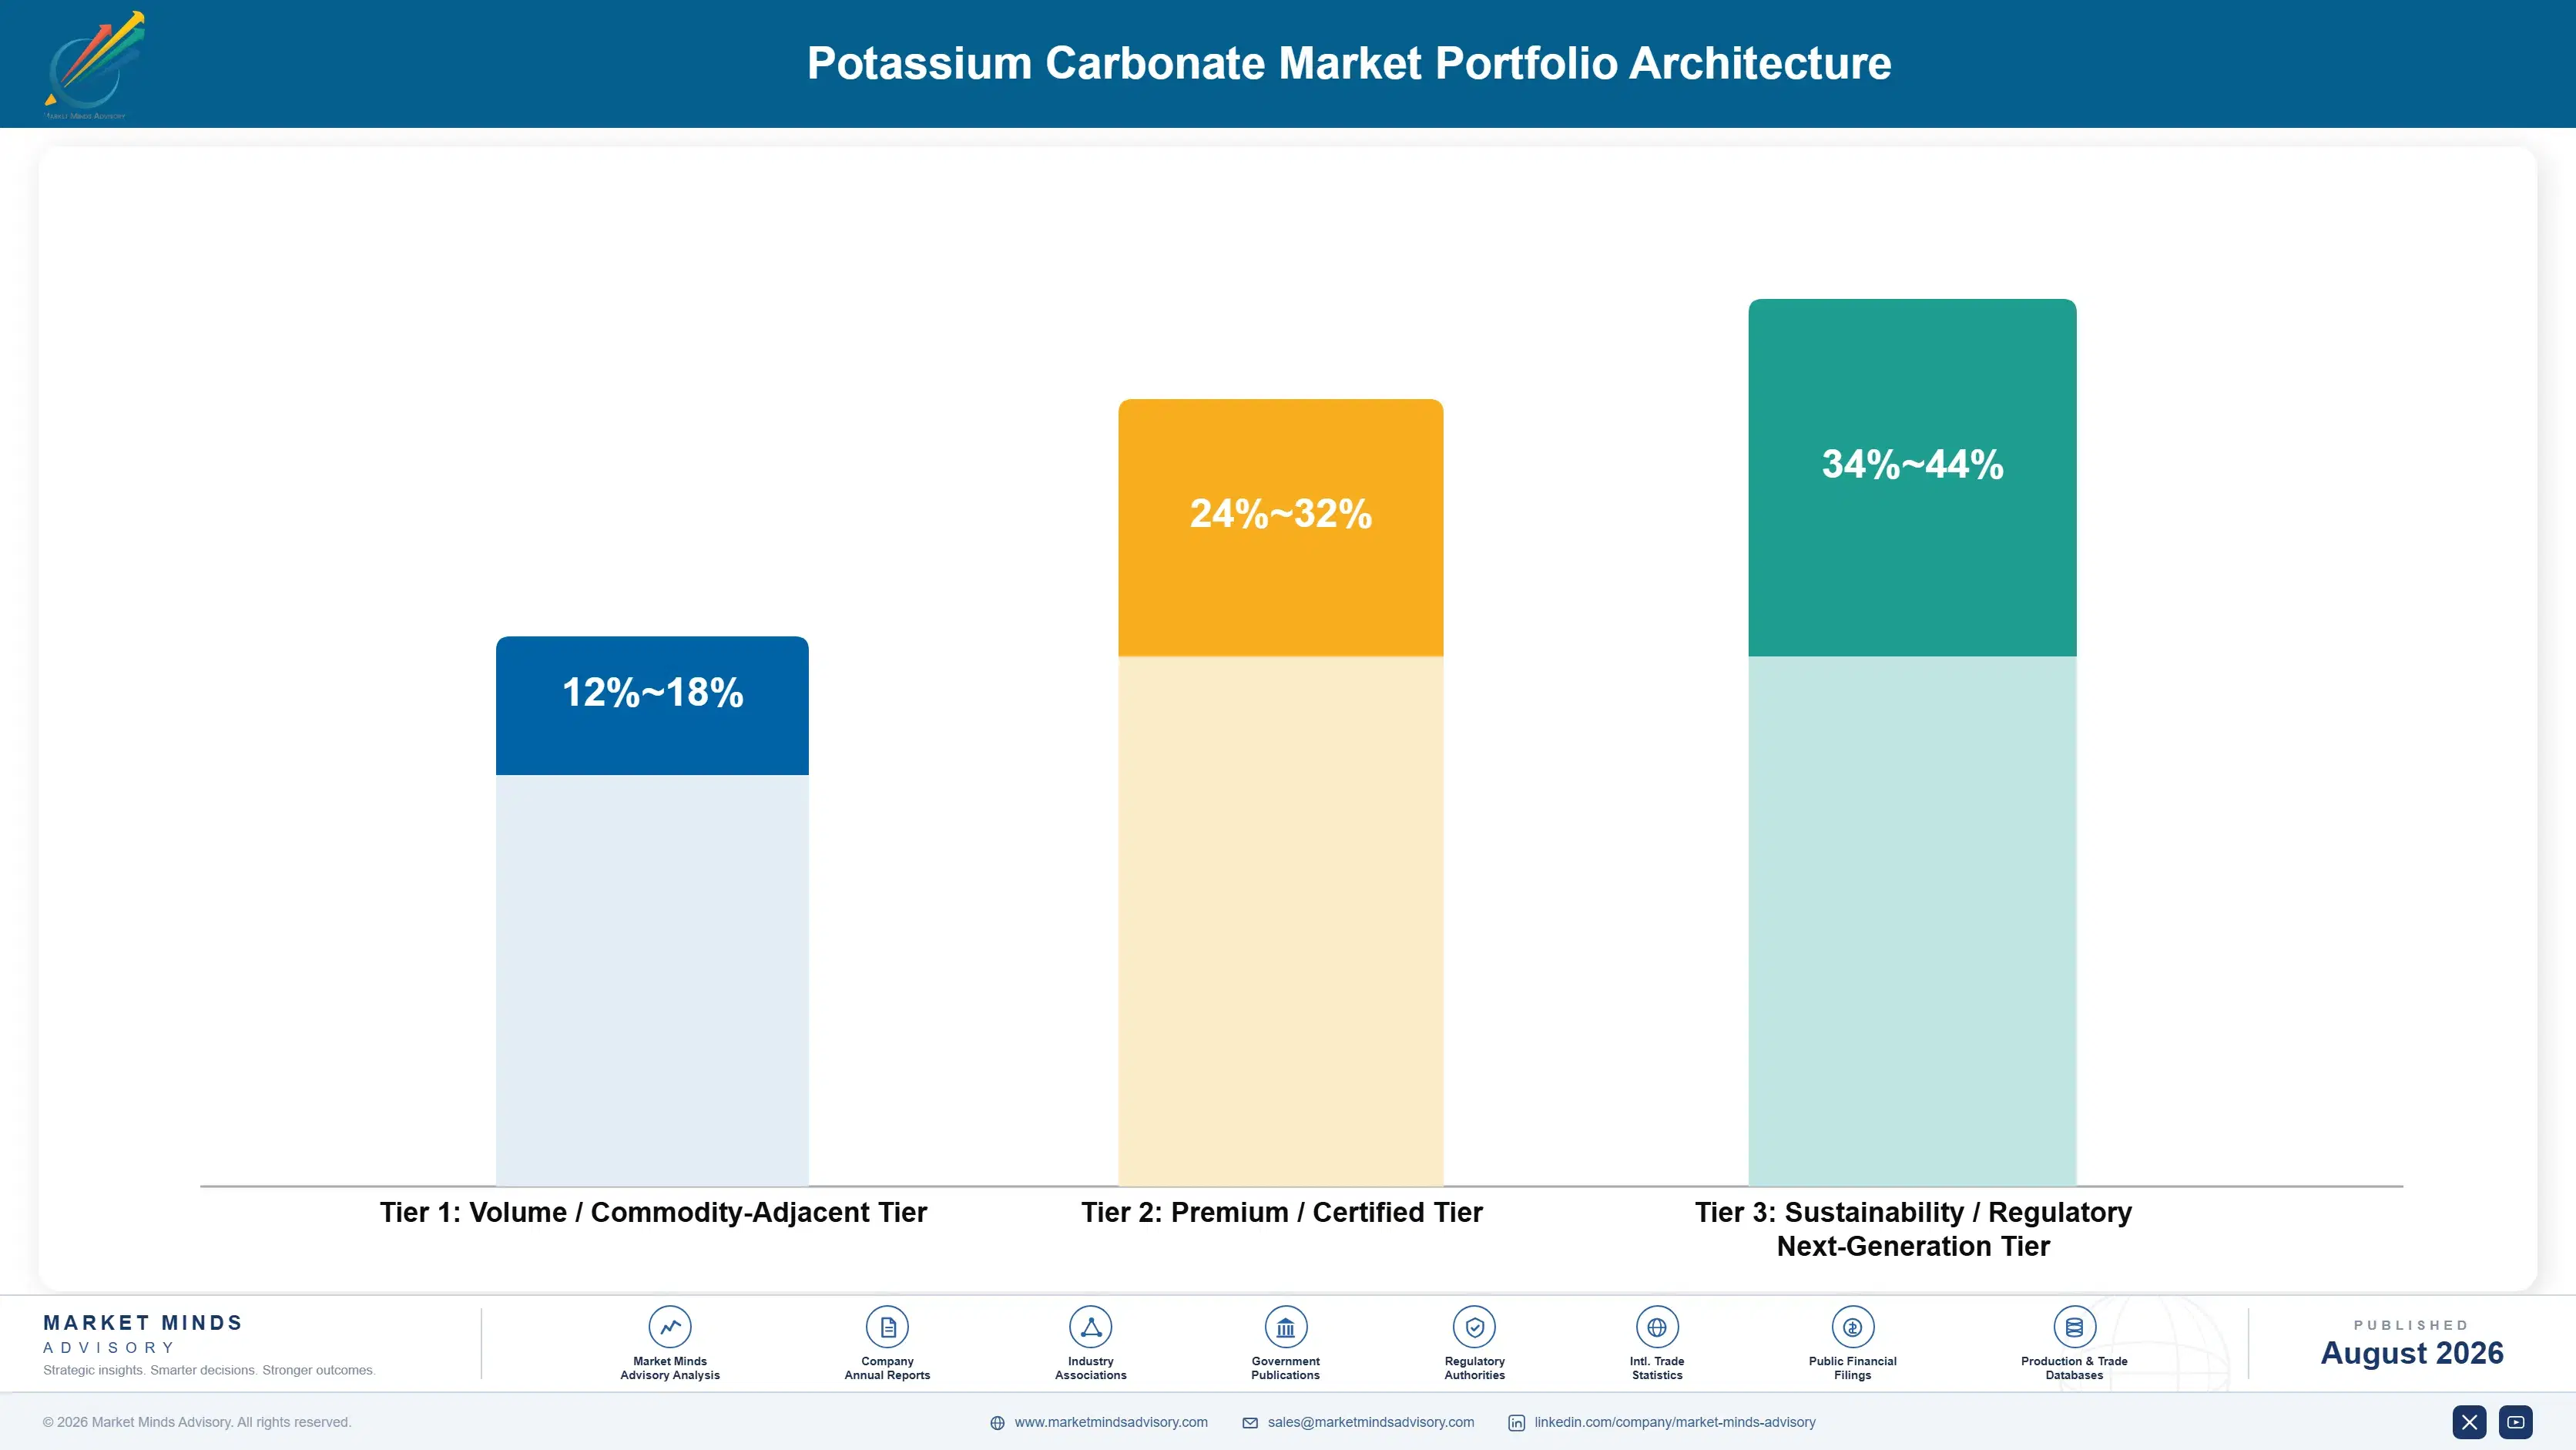
The portfolio splits into three tiers with real margin separation tied to purity requirement and certification depth rather than raw feedstock cost alone. Standard glass and fertilizer-grade potassium carbonate competes largely on delivered cost against benchmark pricing, while pharmaceutical and electronics-grade products earn meaningfully more on purification technology and certification documentation that commodity-grade producers cannot easily replicate. Buyers increasingly specify tier explicitly during supplier qualification rather than treating potassium carbonate as one undifferentiated commodity chemical.
The tension between glass and fertilizer volume and specialty premium runs through every producer's capacity allocation decision each year. Commodity-grade volume still represents the largest share of the market by tonnage despite slower relative growth, yet margin and growth increasingly concentrate in electronics and pharmaceutical grades that require purification investment most commodity-only producers have not built. That purification gap, more than any difference in underlying chemical formula, is what separates the tiers most sharply today.

High-value pools concentrate specifically where technical or regulatory requirements limit substitutable supply: electronics-grade formulations commanding the strictest trace-metal performance premiums, and pharmaceutical grades rewarding producers who invested in certification years ahead of any specific manufacturer partnership.

Volume / Commodity-Adjacent Tier

Standard glass and fertilizer-grade potassium carbonate sold largely on delivered cost against benchmark pricing across major established industrial buyer relationships built over many years. Producers here compete almost entirely on delivered cost and reliability of supply rather than technical differentiation.
Gross Margin: 12-18%

Premium / Certified Tier

Pharmaceutical and specialty glass-grade material commanding real premiums for purification depth and proven certification documentation across regulated buyer applications. Buyers in this tier require documented performance history before committing to any long-term supply contract.
Gross Margin: 24-32%

Sustainability / Regulatory / Next-Generation Tier

Electronics and battery electrolyte-grade formulations meeting emerging trace-metal performance and traceable sourcing requirements that mass-market production was never designed to satisfy. Buyers here increasingly demand full trace-metal traceability before finalising any supply relationship.
Gross Margin: 34-44%
potassium-carbonate-market-trends-portfolio-architecture-1787580290435

High-value Sub-segments and Strategic Watch-out

Electronics and Specialty Chemicals

High value and the fastest-growing segment at 7.8% CAGR, anchored by battery electrolyte formulators reaching an entirely different buyer base than traditional glass customers. Premiums of 35% to 50% reflect genuine trace-metal purification cost rather than brand positioning alone. Manufacturer relationships stay sticky once qualified.
Gross Margin: 34-42%

Pharmaceutical and Personal Care

High value with strong second-fastest growth at 6.5%, driven by buffering agent and excipient demand among formulators requiring pharmacopoeia-grade documentation. Supply remains constrained by certification expertise that generic industrial-grade producers lack, sustaining real pricing power. Buyers rarely switch suppliers once a formulation is validated and proven reliable.
Gross Margin: 26-34%

Standard Glass and Fertilizer Grades

The volume core of the market despite slower relative growth, competing on delivered cost against benchmark pricing with thin margins and intense producer rivalry. Growth tracks a well-documented construction and agricultural cycle with limited differentiation between suppliers. Producers here increasingly diversify into higher-margin grades to offset this segment's slower growth.
Gross Margin: 12-18%

Commodity-Only Legacy Producers

The strategic watch-out. Producers dependent purely on glass and fertilizer-grade volume without electronics or pharmaceutical-grade investment face a widening exposure to margin compression and competitive substitution risk over the coming decade of specialty demand growth. These producers face a widening competitive gap against diversified rivals over the next several years.
Gross Margin: 6-12%

Purification Investment and Buyer Cycles

Demand here runs on multi-year industrial and pharmaceutical procurement contracts rather than transactional sales for the majority of branded volume, since glass, pharmaceutical, and electronics manufacturing projects need consistent, certified chemical performance locked in well before any production line qualifies a new supplier. Contract renewal typically follows manufacturing qualification cycles spanning several years rather than the annual transactional purchasing common in commodity chemical sales.
Adoption depth varies sharply by application. Electronics and pharmaceutical buyers show the strongest supplier loyalty given certification validation cost and the operational risk of switching mid-production given regulatory compliance requirements, while glass and fertilizer buyers switch relatively freely based on price and delivery lead time given the category's mature, standardised procurement processes. Food-grade buyers sit between the two, valuing documentation consistency over transactional pricing given regulatory scrutiny considerations.

Buyer profiles have shifted generationally as chemical procurement moved from purely cost-driven industrial purchasing toward certification-driven, technically demanding qualification programs spanning multiple application categories simultaneously. Younger procurement teams increasingly evaluate lifecycle documentation and supply reliability rather than upfront chemical price alone, a shift that favours producers investing in purification and certification depth over those competing purely on traditional commodity volume.
potassium-carbonate-market-trends-end-use-penetration-index-1787580290928

Where Purification Investment Decides Outcomes

These are among the four positions where our research anticipates prominent divergence between winners and laggards over the coming forecast period. Each is grounded in the demand model, the regulatory perimeter, and the announced capacity pipeline.
01 / ELECTRONICS GRADE INVESTMENT

Early purification capacity will keep capturing the fastest-growing segment

Producers investing in high-purity purification capacity are capturing battery electrolyte and electronics manufacturer contracts that commodity-grade producers cannot service at required trace-metal specification, and that gap will not close quickly given the capital investment involved, since electronics buyers rarely switch suppliers once a formulation is validated against a specific production line. Expect continued investment concentrating among producers who committed to this capability years ahead of the segment's current growth, leaving later entrants a steeper qualification curve to climb. Later entrants must also build comparable testing infrastructure essentially from scratch.
02 / GLASS VOLUME DIVERSIFICATION

Diversified producers will outperform commodity-only legacy competitors

Glass and fertilizer-grade volume growth is a well-documented, predictable industrial demand cycle, and producers dependent purely on commodity-grade production face a steadily compressing margin position regardless of how well they execute operationally, since no amount of operational excellence changes a mature category's growth ceiling. Companies that diversified into electronics and pharmaceutical grades early have already begun offsetting slower commodity volume growth with faster-growing, higher-margin revenue streams. Expect continued consolidation toward diversified producers as commodity-only competitors face an increasingly difficult margin position.
03 / PHARMACEUTICAL CERTIFICATION EXPANSION

Early certification will outcompete uncertified regional incumbents

Pharmaceutical excipient sourcing requirements will keep tightening across additional regulatory jurisdictions. Producers who secured pharmacopoeia-grade certification ahead of that tightening are already winning contracts citing proven compliance track record specifically, since certified capacity remains scarce relative to growing pharmaceutical demand, and that scarcity sustains real advantage for early movers. Broader industry investment should eventually compress this advantage as more producers complete qualification, leaving later movers, facing procurement lists increasingly closed to uncertified bidders across most jurisdictions given typical two to three year certification investment cycles.
04 / SPECIALTY GLASS SPECIFICATION GROWTH

Early qualification will build durable premium market advantage

Solar and display glass manufacturers are increasingly specifying low-impurity potassium carbonate for optical performance, and producers who invested in specialty glass flux qualification now are building specification relationships that later entrants must wait years to replicate given typical manufacturer qualification timelines. This opportunity depends on genuine quality control investment rather than simple product marketing. Expect continued investment concentrating among specialty glass suppliers as adoption advances, with later movers finding specification wins harder to secure and facing a steeper qualification curve once lists close entirely.

Engagement Snapshot From the Field

A live engagement with an industry participant carrying material or product regulatory and market exposure ahead of a defining policy shift, showing how our research translates into a defensible multi-year portfolio strategy.
MARKET MINDS ADVISORY · CLIENT ENGAGEMENT SUMMARY
Potassium Carbonate Producer Strategic Portfolio Review and Transition Roadmap 2026·Investment Scenario on Potassium Carbonate Exposure Evaluation 2025-26
CLIENT PROFILE
A lithium-ion battery electrolyte formulator supplying cell manufacturers across North America approached MMA while planning a supplier qualification program for high-purity potassium carbonate. The client reported annual electrolyte revenue near USD 95 million, with limited prior experience qualifying inorganic chemical suppliers against battery-grade trace-metal specifications (client-reported, unverified by MMA). The formulator had never previously managed a dual-source qualification program at this production scale.
STRATEGIC CHALLENGE
Management wanted to diversify its potassium carbonate supply base beyond a single incumbent supplier to reduce concentration risk, but lacked internal expertise benchmarking alternative producers against its exacting trace-metal purity requirements. The sourcing team worried that qualifying a new supplier too quickly without adequate validation testing could introduce contamination risk into its electrolyte production process.
MMA APPROACH
MMA benchmarked available high-purity potassium carbonate producers against the client's specific trace-metal specification and production reliability requirements, then modelled the qualification testing timeline needed for a credible second-source relationship. We also assessed each candidate producer's feedstock security and capacity expansion plans to identify the most durable long-term partner. Findings were delivered ahead of the client's quarterly supply chain risk review.
KEY FINDINGS
  1. The client's initial supplier shortlist included several producers whose documented trace-metal consistency fell short of battery-grade requirements on closer review (client-reported, unverified by MMA).
  2. A qualified second-source producer with existing electronics-grade purification capacity could compress the client's qualification timeline meaningfully compared with developing a new supplier relationship from scratch.
  3. Feedstock security assessment revealed one leading candidate had considerably more diversified potash sourcing than the client's incumbent supplier. This gap materially influenced the client's final supplier selection decision.
  4. A phased qualification approach reduced production risk considerably compared with the single-batch validation originally proposed. This phased approach also allowed quality control to refine testing protocols before full-scale transition.
CLIENT PROFILE
A lithium-ion battery electrolyte formulator supplying cell manufacturers across North America approached MMA while planning a supplier qualification program for high-purity potassium carbonate. The client reported annual electrolyte revenue near USD 95 million, with limited prior experience qualifying inorganic chemical suppliers against battery-grade trace-metal specifications (client-reported, unverified by MMA). The formulator had never previously managed a dual-source qualification program at this production scale.
STRATEGIC CHALLENGE
Management wanted to diversify its potassium carbonate supply base beyond a single incumbent supplier to reduce concentration risk, but lacked internal expertise benchmarking alternative producers against its exacting trace-metal purity requirements. The sourcing team worried that qualifying a new supplier too quickly without adequate validation testing could introduce contamination risk into its electrolyte production process.
MMA APPROACH
MMA benchmarked available high-purity potassium carbonate producers against the client's specific trace-metal specification and production reliability requirements, then modelled the qualification testing timeline needed for a credible second-source relationship. We also assessed each candidate producer's feedstock security and capacity expansion plans to identify the most durable long-term partner. Findings were delivered ahead of the client's quarterly supply chain risk review.
KEY FINDINGS
  1. The client's initial supplier shortlist included several producers whose documented trace-metal consistency fell short of battery-grade requirements on closer review (client-reported, unverified by MMA).
  2. A qualified second-source producer with existing electronics-grade purification capacity could compress the client's qualification timeline meaningfully compared with developing a new supplier relationship from scratch.
  3. Feedstock security assessment revealed one leading candidate had considerably more diversified potash sourcing than the client's incumbent supplier. This gap materially influenced the client's final supplier selection decision.
  4. A phased qualification approach reduced production risk considerably compared with the single-batch validation originally proposed. This phased approach also allowed quality control to refine testing protocols before full-scale transition.
RECOMMENDED STRATEGY
Phase 1: Phase 1 (0 to 4 months): Complete trace-metal specification testing and feedstock security review for the top three candidate producers. Phase 2: Phase 2 (4 to 10 months): Qualify the selected second-source producer through staged production trial batches. Production teams monitored batch consistency closely throughout each trial run. Phase 3: Phase 3 (10 to 18 months): Transition a defined volume share to the qualified second source while monitoring consistency. Documentation was compiled continuously to support ongoing quality assurance reviews.
OUTCOME
The client completed second-source qualification within the planned timeline following the phased approach, avoiding the contamination risk a faster rollout would likely have introduced. The qualified second source also secured a reported 22% reduction in feedstock cost exposure through more diversified potash sourcing (client-reported, unverified by MMA).

Frequently Asked Questions

Foundational context covering the market sizes, CAGR, scope, country, region and competition that inform every finding below. This section is provided to cover basics and most often pre-purchase conversations, answered from the MMA Primary Research Dataset.

What is the current size of the Potassium Carbonate Market?

The potassium carbonate market reached USD 2.8 billion in 2025, covering glass, fertilizer, food, pharmaceutical, detergent, and electronics applications globally across a growing set of industrial programs.

How large will the Potassium Carbonate Market be by 2036?

The market is projected to reach USD 4.41 billion by 2036 under the base case scenario, representing a 1.51 times expansion over the 2026 starting value.

What is the CAGR for the Potassium Carbonate Market 2026 to 2036?

The base case CAGR is 4.2%, with a bull case of 5.4% and a bear case of 3.0%. Battery electrolyte adoption and glass demand trends drive most of the variance.

Which segment is growing fastest?

Electronics and specialty chemicals grow fastest at 7.8% CAGR, about 1.86 times the overall market rate. Battery electrolyte formulators reaching new buyer segments drive this growth directly.

Who are the major companies in the Potassium Carbonate Market?

Leading companies include Armand Products Company, Nippon Chemical Industrial, Aditya Birla Chemicals, Merck KGaA, and ICL Group, holding roughly 48% combined market share. Armand Products and Nippon Chemical lead on purification technology and regional distribution scale respectively.

Which country is growing fastest?

India posts the fastest national growth at 6.8% CAGR, driven by expanding fertilizer distribution and specialty chemical manufacturing. Growing agricultural investment anchors most of this growth.

Report Segmentation Architecture

The full report scope spans multiple orthogonal segmentation dimensions, with cross-tabulated demand data provided for each dimension pair. Coverage extends further to regional breakdowns, trend trajectories, and the competitive detail needed to support segment-level decision-making.

By Application

  • Glass Manufacturing
  • Fertilizers and Agriculture
  • Food and Beverage Additives
  • Pharmaceutical and Personal Care
  • Detergents and Cleaning Agents
  • Electronics and Specialty Chemicals

By End-Use Industry

  • Glass and Ceramics Manufacturing
  • Agriculture and Fertilizer Distribution
  • Pharmaceutical Manufacturing
  • Electronics and Battery Manufacturing
  • Food and Beverage Processing

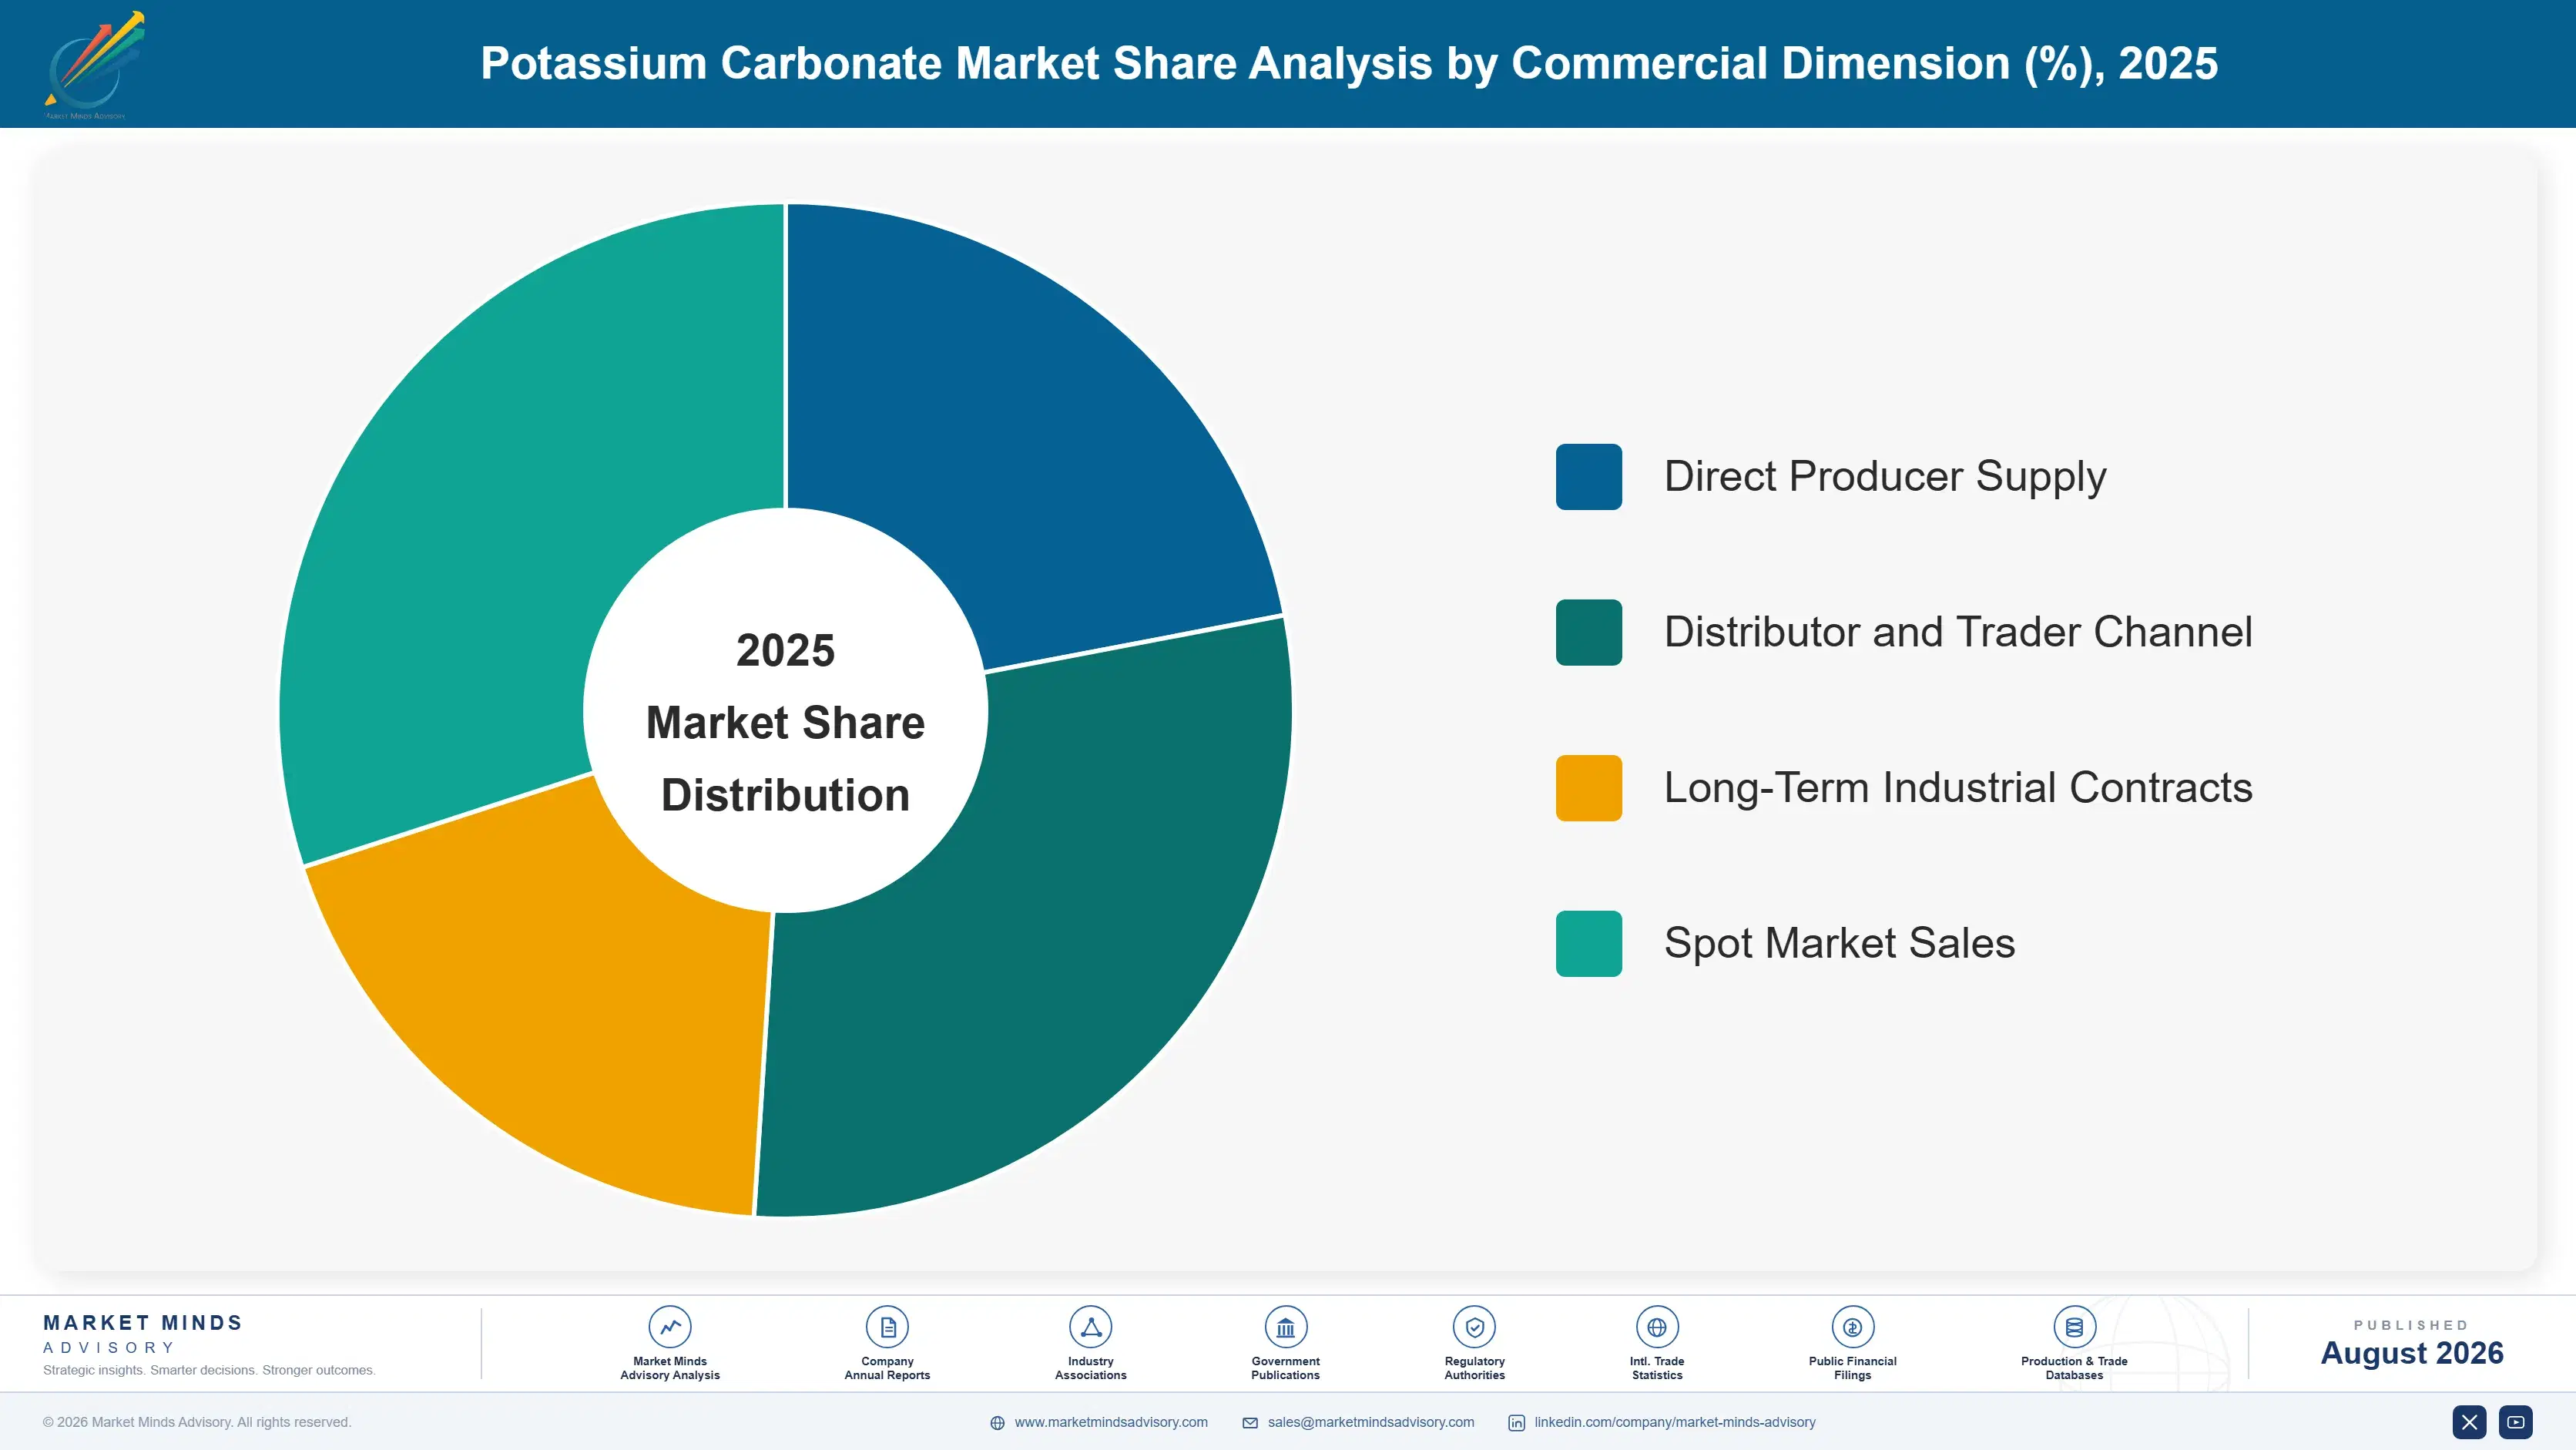
By Commercial Dimension

  • Direct Producer Supply
  • Distributor and Trader Channel
  • Long-Term Industrial Contracts
  • Spot Market Sales

By Region

  • North America
  • Western Europe
  • East Asia
  • South Asia and Pacific
  • Latin America
  • Middle East and Africa
  • Eastern Europe

Scope, Methodology, and Coverage

Every figure in this report is reproducible from documented input assumptions. The scope below maps the historical period, the forecast horizon, the segmentation dimensions, and the countries covered, alongside the underlying primary and qualitative methodology.
Historical Period
2020 to 2025
Forecast Period
2026 to 2036
Base Year
2025 (USD billions; MMA Primary Research Dataset, August 2026)
Market Definition
This market comprises potassium carbonate produced for glass manufacturing, fertilizer, food additive, pharmaceutical, detergent, and specialty electronics applications. Potassium chloride sold as raw fertilizer feedstock and unrelated potassium hydroxide products are excluded from this scope.
Quantitative Units
USD billions (current prices); metric tonnes of potassium carbonate volume where applicable
Segmentation Dimensions
By Application; By End-Use Industry; By Commercial Dimension; By Region
Regions Covered
North America, Western Europe, East Asia, South Asia and Pacific, Latin America, Middle East and Africa, Eastern Europe
Countries Covered
USA, China, Germany, France, UK, Japan, South Korea, India, Australia, Canada, Brazil, Mexico, Indonesia, Vietnam, Thailand, Malaysia, UAE, Saudi Arabia, South Africa, Nigeria, Turkey, Poland, Netherlands, Italy, Spain, Sweden, Switzerland, Argentina, Colombia, Singapore, and additional markets relevant to this sector
Key Companies Profiled
Armand Products Company, Nippon Chemical Industrial Co Ltd, Aditya Birla Chemicals, Merck KGaA, ICL Group, K+S Aktiengesellschaft, Tata Chemicals, American Elements, Shandong Haiwang Chemical, Jiangsu Kolod Food Ingredients, Shandong Cathay Chemical, Sichuan Zhonghe Chemical, Weifang Kaifeng Chemical, Anhui Sun Fine Chemical, Nikko Chemicals, Vynova Group, Kemira Oyj, Sinochem International, Solvay SA, Prayon Group
Quantitative Methodology
Primary survey, n=3,800 respondents, Q4 2025, six countries; demand-side model with trade association cross-validation
Qualitative Methodology
47 expert interviews, Q4 2025; applied to validate demand model assumptions, identify emerging dynamics, and assess competitive positioning
Report Format
PDF and XLSX data workbook (Word format preview document)
Publisher
Market Minds Advisory
Report Code
MMA-2026-CHM-215
Published
August 2026
Contact
sales@marketmindsadvisory.com | www.marketmindsadvisory.com

Purchase the full Potassium Carbonate Market Report (2026 to 2036).

The full MMA Potassium Carbonate report sizes the market across six application segments, five end-use industries, four commercial channels, and seven regions through 2036. It profiles twenty companies on a consistent basis of potassium carbonate production capacity, scoring each on high-purity purification depth, pharmacopoeia certification breadth, and specialty glass qualification. Scenario models quantify how battery electrolyte adoption, glass demand trends, and fertilizer subsidy programs move both demand and realised pricing. The report also includes delivered-cost modelling by feedstock base, a commodity-only exposure screen, and electronics segment economics built for procurement, strategy, and investment teams.
Six-segment application demand breakdown detail view
Potash feedstock delivered-cost bridge model view
Commodity-only exposure screening framework overview detail
Producer purification depth benchmarking review detail
Electronics segment economics deep detail review
Regional production capacity mapping detail review

Built For The People Who Decide

From boardroom strategy to bench-side execution, this report is read cover-to-cover by leaders shaping the next decade of their industry, turning demand scenarios, market dynamics and valuation benchmarks into decisions.
CXOs/ Presidents/ VPs/ Managers
M&A and Corporate Development
Strategy Teams and R&D Heads
Procurement and Product Directors
Regulatory and Compliance Leaders
Investor Relations and Equity Analysts