Market Minds Advisory
Positive Air Pressure Devices Market

Positive Air Pressure Devices Market: Resupply Economics Meet a Pharmaceutical Competitor

The machine sells once every five years and the cushion sells every month, which is the whole business. For the first time a prescription drug is arriving to compete for the same diagnosis.

Lead Analyst

Alice Ballenger

Published

September 2026

Make Smarter Decisions with Customized Research Insights

Request a free sample report and evaluate market opportunities, growth trends, and competitive dynamics relevant to your business needs.

2025 MARKET VALUE$5.8BMarket Size 2025
2036 FORECAST VALUE$12.7BBase Case , 2026 to 2036
CAGR 2026 TO 20367.4 %Bull 8.6% / Bear 6.2%
INCREMENTAL OPPORTUNITY$6.5BNet 10- year value creation
EXPANSION MULTIPLE2.04x2036 value over 2026 base
Strategic Levers
M&A Pipeline
Regional Outlook
Country Rankings
Competitive Intelligence
Segmental Deep-dive
Call-Us : 91 93563 13602

Executive Snapshot and Market Trajectory

Everyone models this as a device market and it is not one. The blower sells once every five years while the cushion touching the patient's face is replaced every four weeks, and resupply carries 63% of category revenue. The machine is the platform; the consumable is the business.
Growth comes from diagnosis rather than from prescription rates, since roughly 80% of affected adults have never been identified. Replacement cushions and consumables grow fastest at 11.1%, exactly 1.50 times the market rate, on installed base expansion and better resupply adherence. Mask systems follow at 9.4%, since fit decides continuation. North America holds well above its normal band because reimbursement there pays for documented adherence in a way no other market does.
Concentration reaches 82% across the top five measured on installed device base, among the most concentrated positions in medical devices anywhere. Two things could disturb it: mask fit, which decides whether a patient continues therapy at all, and the arrival of prescription weight-loss drugs approved for the same diagnosis. Only 62% of patients currently clear the adherence threshold. Neither threat can be answered by building a better blower.
Market Definition
This market covers positive airway pressure therapy systems used to treat obstructive sleep apnoea and related sleep-disordered breathing, including fixed-pressure, auto-adjusting, and bilevel devices, mask systems and interfaces, replacement cushions and consumables, and humidification modules. Scope is measured at manufacturer realised prices across home care and retail channels. Home sleep testing equipment, laboratory polysomnography, hypoglossal nerve stimulation, oral appliances, critical care ventilators, and pharmacological therapies are excluded.
Base Year Value
$5.8B in 2025 (MMA Primary Research Dataset, August 2026)
Forecast Period
2026 to 2036, eleven discrete annual values
CAGR
7.4% base case. Bull 8.6%. Bear 6.2%.
Fastest Growth Segment
Replacement Cushions And Consumables: 11.1% CAGR
Fastest Growth Country
India: 12.4% CAGR
Fastest Growth Region
South Asia and Pacific: 9.6% CAGR
Largest Region
North America: 38% of 2025 global value
Market Leaders
ResMed. Philips. Fisher and Paykel Healthcare. Lowenstein Medical. BMC Medical. Source: MMA Analysis based on company annual reports.
Primary Survey
n=3,800 procurement and R&D decision-makers, Q4 2025, six countries
Methodology
Demand-side build-up, cross-validated against public data, 47 expert interviews

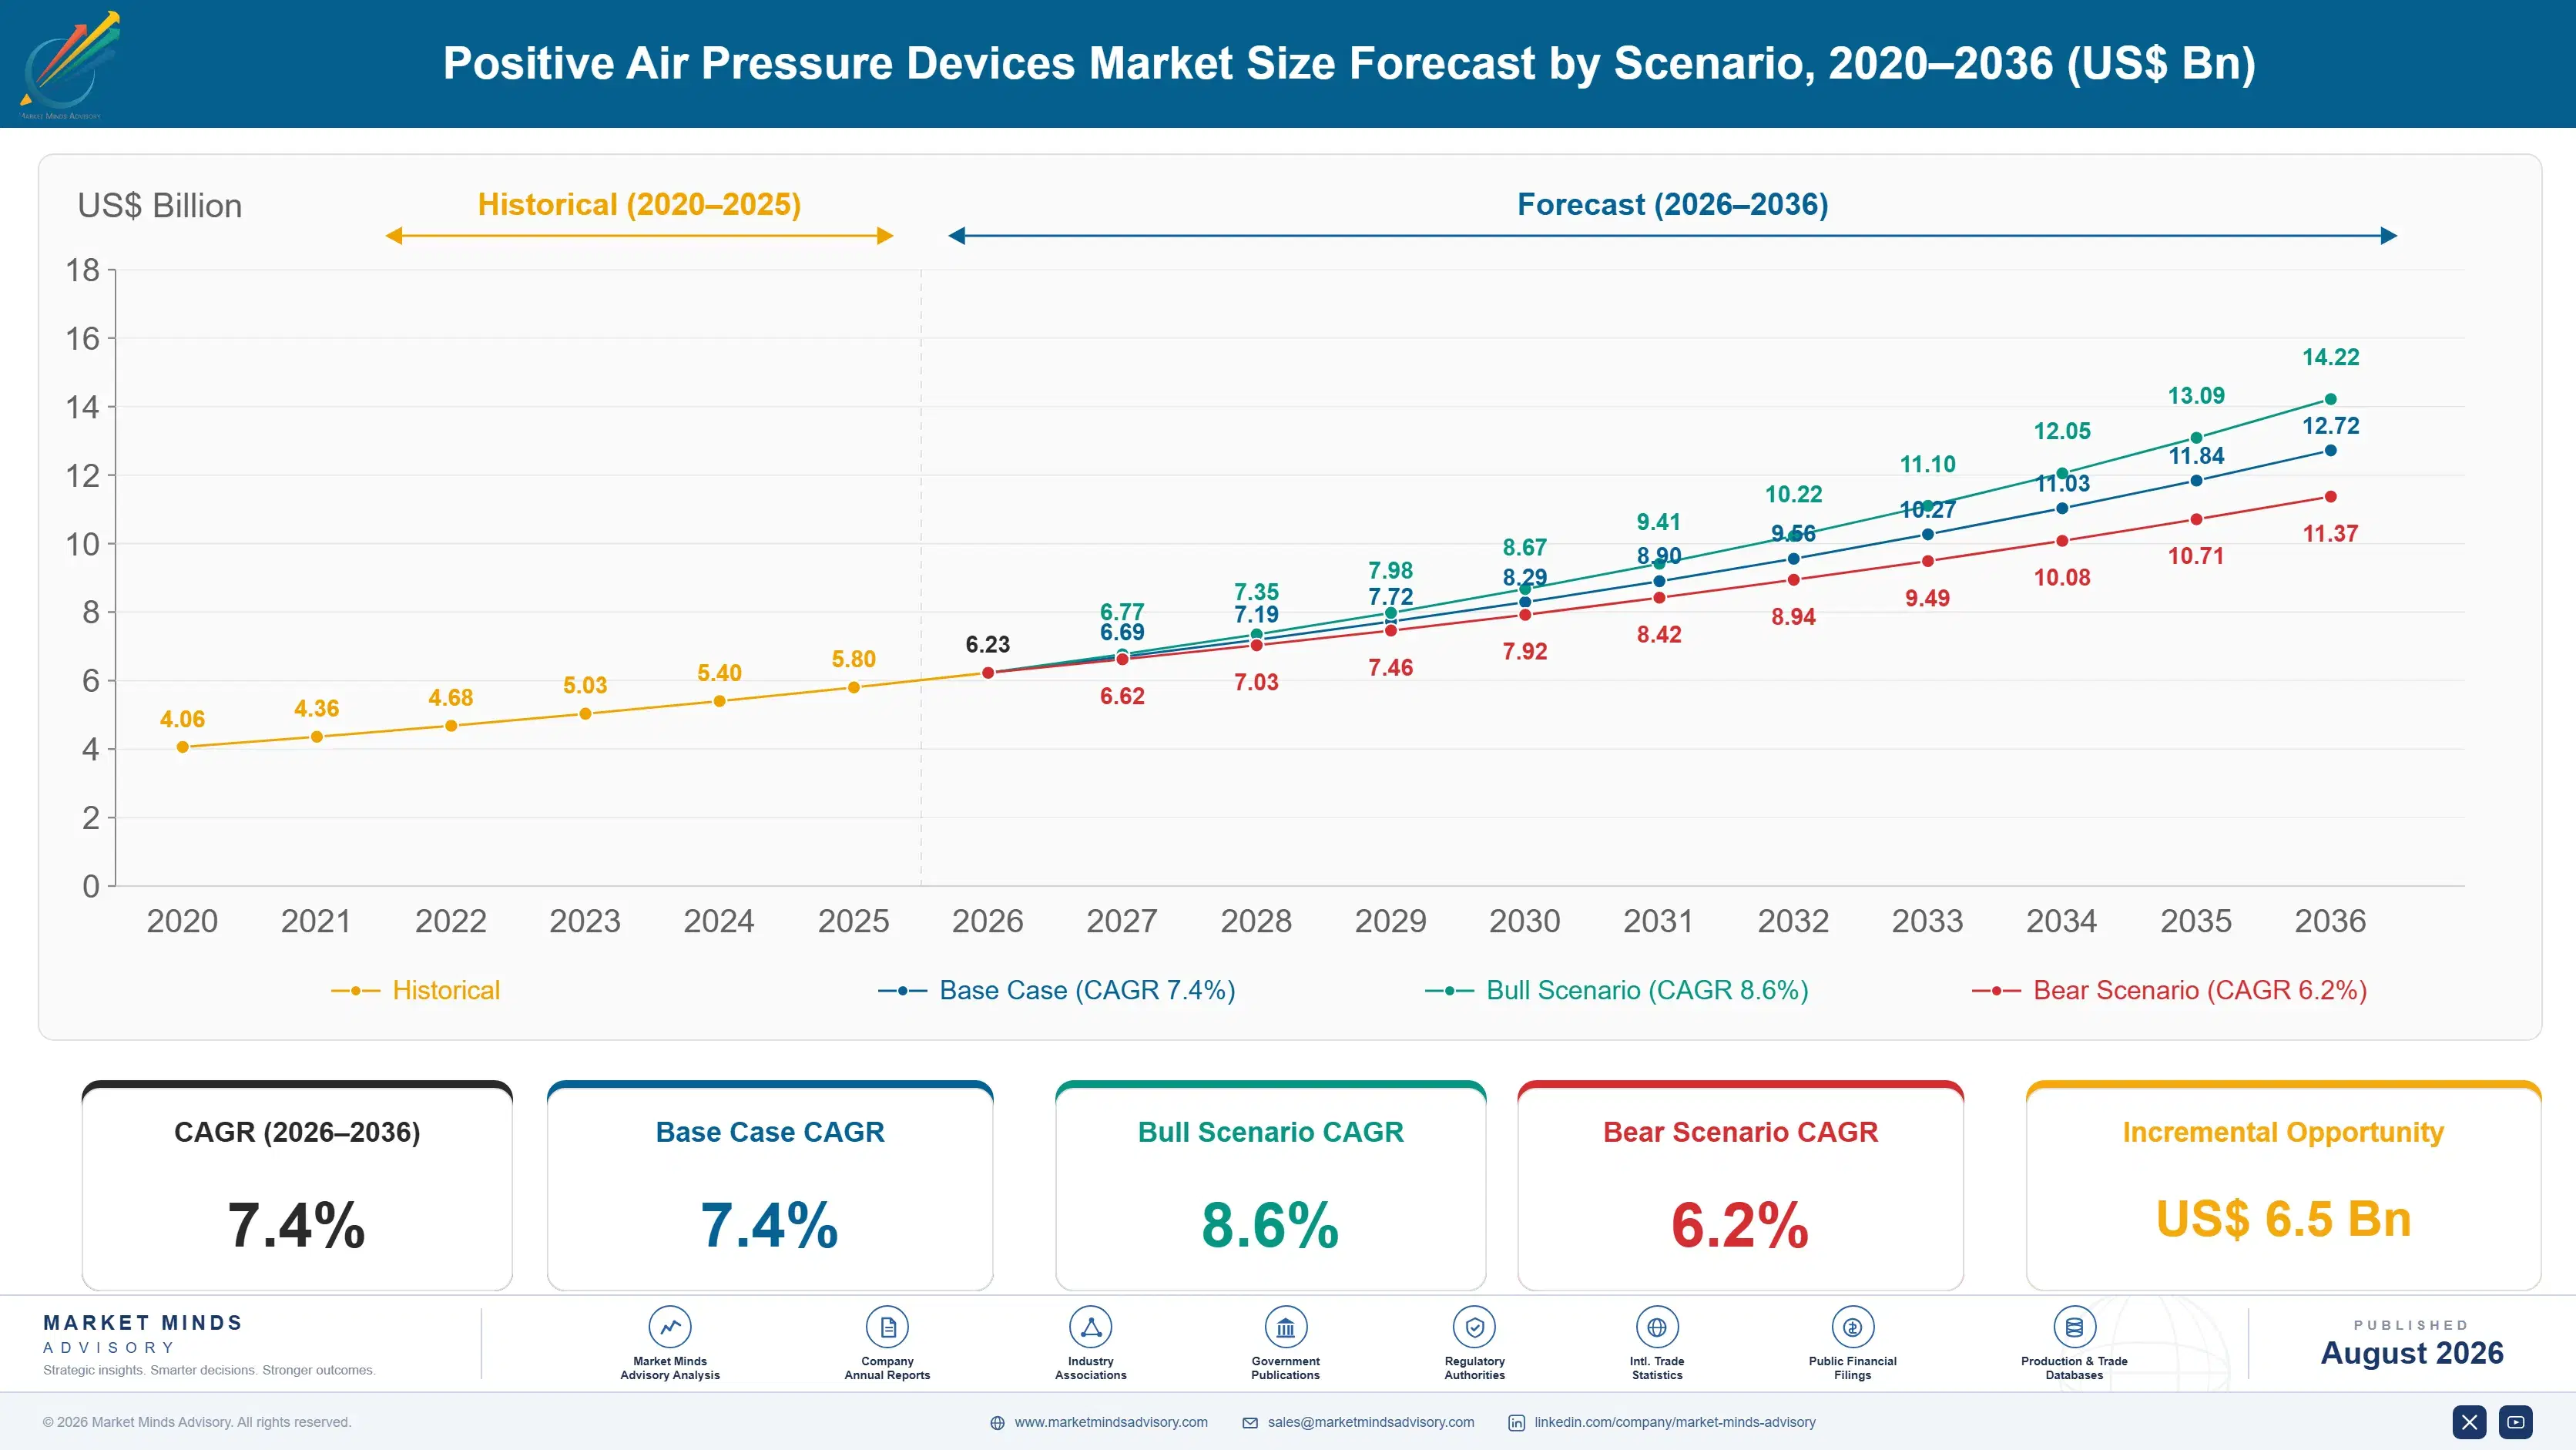
Positive Air Pressure Devices Market Forecast Scenarios

positive-air-pressure-devices-market-size-forecast-scenario-1787299160539
The 2020 to 2025 period was shaped by one company's recall rather than by anything about the therapy. A foam degradation recall removed one of two dominant suppliers from much of the market for years, and the transferred installed base has largely not returned. Semiconductor shortage constrained supply for everybody simultaneously. A 6.1% historical rate averages a supply-limited market against a share redistribution that was permanent rather than temporary.
Three mechanisms carry the 7.4% base case. Diagnosis expansion is the largest, since around 80% of affected adults remain unidentified and home sleep testing is steadily reaching primary care. Resupply programme improvement is the second, as manufacturers and providers get better at keeping patients on scheduled cushion replacement. And Asian market development is the third, where prevalence is high, formal diagnosis is minimal, and domestic manufacturers have finally made devices affordable.
The 8.6% bull case rests on prescription weight-loss therapy proving complementary rather than substitutive, bringing newly diagnosed patients into the sleep pathway who would otherwise never have entered it. The 6.2% bear case is the same drugs displacing device therapy in mild and moderate disease, which would remove the easiest patients and leave the category with the least adherent ones.

The Cushion Is the Product

Two revenue clocks run at completely different speeds here. The blower is reimbursed for replacement roughly every five years, while the silicone cushion pressed against a patient's face is on a four-week schedule and the mask itself on a quarterly one. Resupply carries 63% of category revenue and considerably more of its profit, which means the commercial contest is about consumable capture rather than about device features.
TOP FIVE CONCENTRATION82%Among the most concentrated device categories in healthcare
RESUPPLY REVENUE SHARE63%Masks, cushions, and consumables rather than the machine
UNDIAGNOSED PREVALENCE80%Affected adults never formally identified or treated anywhere
ADHERENCE THRESHOLD COMPLIANCE62%Patients meeting reimbursement documentation requirements in the first quarter
AVERAGE DEVICE LIFE5 yearsBefore reimbursement permits replacement of the therapy platform
CUSHION REPLACEMENT INTERVAL4 weeksScheduled resupply cadence for the mask contact component
The second thing outsiders miss is that the device reports on the patient. Reimbursement in the largest market is conditional on documented usage, typically four hours a night across most nights of a monitoring window, and the machine transmits that record automatically. That makes the device a compliance instrument as much as a therapy, and it puts the adherence data inside the manufacturer's platform rather than the clinician's.
Two forces will shape the next decade. Mask fit rather than machine capability decides whether a patient continues, and only 62% currently clear the adherence threshold. And prescription weight-loss therapy approved for this diagnosis is the first pharmaceutical competitor the category has ever faced. Neither force is something engineering can solve alone, and both are already in play.
"Manufacturers spend their engineering budget on the blower and their marketing budget on quiet operation. Patients quit because a piece of silicone leaves a mark on their nose. The company that solves fit properly will take share from competitors with objectively better machines, and everyone in this industry knows it."
Director. Sleep Therapy and Home Respiratory Practice · MMA Medical Devices and

Market Trends

Prescription Weight-Loss Therapy Enters The Same Diagnosis

Incretin-based weight-loss drugs have obtained approval for obstructive sleep apnoea in adults with obesity, which gives this diagnosis a pharmaceutical option for the first time in its history. Whether that is competition or recruitment remains genuinely open. The pessimistic reading is displacement in mild and moderate disease, leaving devices with the severe and least adherent patients. The optimistic reading is that physicians prescribing these drugs will screen for sleep apnoea far more often, pulling patients out of the roughly 80% who remain undiagnosed and into a pathway that frequently still needs a device.
Market Impact: Reaches 80% currently undiagnosed
Resupply Programmes Move From Passive To Actively Managed

Cushions degrade on a four-week cycle and patients do not reorder unless prompted, which historically left large amounts of revenue uncollected and adherence quietly declining as seals hardened. Manufacturers and providers now run automated resupply outreach driven by the same telemetry that reports compliance, contacting patients when a replacement is due rather than waiting for a call. Resupply already carries 63% of category revenue, and programmes that shifted from passive to managed report materially higher capture. The data enabling it belongs to the device platform, which is precisely why platform position matters.
Market Impact: India grows at 12.4% annually

Market Opportunities and Growth Drivers

Home Sleep Testing Reaches The Undiagnosed Majority

Roughly 80% of adults with obstructive sleep apnoea have never been formally diagnosed, and the historic bottleneck was laboratory polysomnography: scarce, expensive, slow, and unpleasant enough that referrals frequently went unattended. Home sleep apnoea testing removes all four obstacles and is increasingly ordered from primary care rather than requiring specialist referral. Every diagnosis converted becomes a device placement plus a resupply annuity running for years. Manufacturers that fund diagnostic access consistently outgrow those funding consumer advertising to a population that has already been identified. Primary care ordering rather than specialist referral is the change.
Market Impact: Some 38% fail the threshold

Asian Prevalence Is High And Diagnosis Rates Remain Minimal

Obstructive sleep apnoea prevalence across China and India is substantial and rising with obesity, yet formal diagnosis reaches only a small fraction of affected adults and sleep medicine capacity is concentrated in a handful of metropolitan hospitals. Domestic manufacturers have brought device pricing to levels imported systems never reached, which matters enormously in markets where patients pay directly. India contributes the fastest national growth rate in this forecast at 12.4%. Growth here comes from detection and affordability together rather than from any change in underlying disease burden. Sleep medicine capacity concentrates in a handful of hospitals.
Market Impact: Providers control 63% of revenue

Market Restraints and Challenges

Only Sixty-Two Percent Of Patients Clear Adherence Thresholds

Reimbursement in the largest market requires documented usage across a monitoring window, and only about 62% of patients meet it. The root cause is almost always the interface rather than the therapy: a mask that leaks, marks the face, or wakes a partner gets abandoned within weeks regardless of how well the pressure is titrated. Commercial impact is severe because a patient who fails the threshold loses reimbursement, returns the device, and generates no resupply at all. Participants are responding with facial scanning for fit selection, wider cushion ranges, and early intervention triggered by telemetry.
Market Impact: Addresses 80% undiagnosed population

Provider Channel Controls The Resupply Relationship Directly

In the largest market the durable medical equipment provider, not the manufacturer, holds the patient relationship and decides which brand of replacement cushion arrives each month. The root cause is a reimbursement structure that pays the provider rather than the manufacturer, giving them control of a channel worth 63% of category revenue. Commercial impact is that manufacturers compete for provider shelf space rather than for patients. Mitigation runs through direct-to-patient resupply platforms, provider software integration, and cushion designs that fit only the manufacturer's own frame. Manufacturers compete for provider shelf space rather than patients.
Market Impact: Resupply carries 63% of revenue
4 additional market trends, 3 additional growth drivers, and 2 additional restraints and challenges are covered in the full report. Contact sales@marketmindsadvisory.com to access the complete intelligence.

Segment CAGR and Growth Architecture

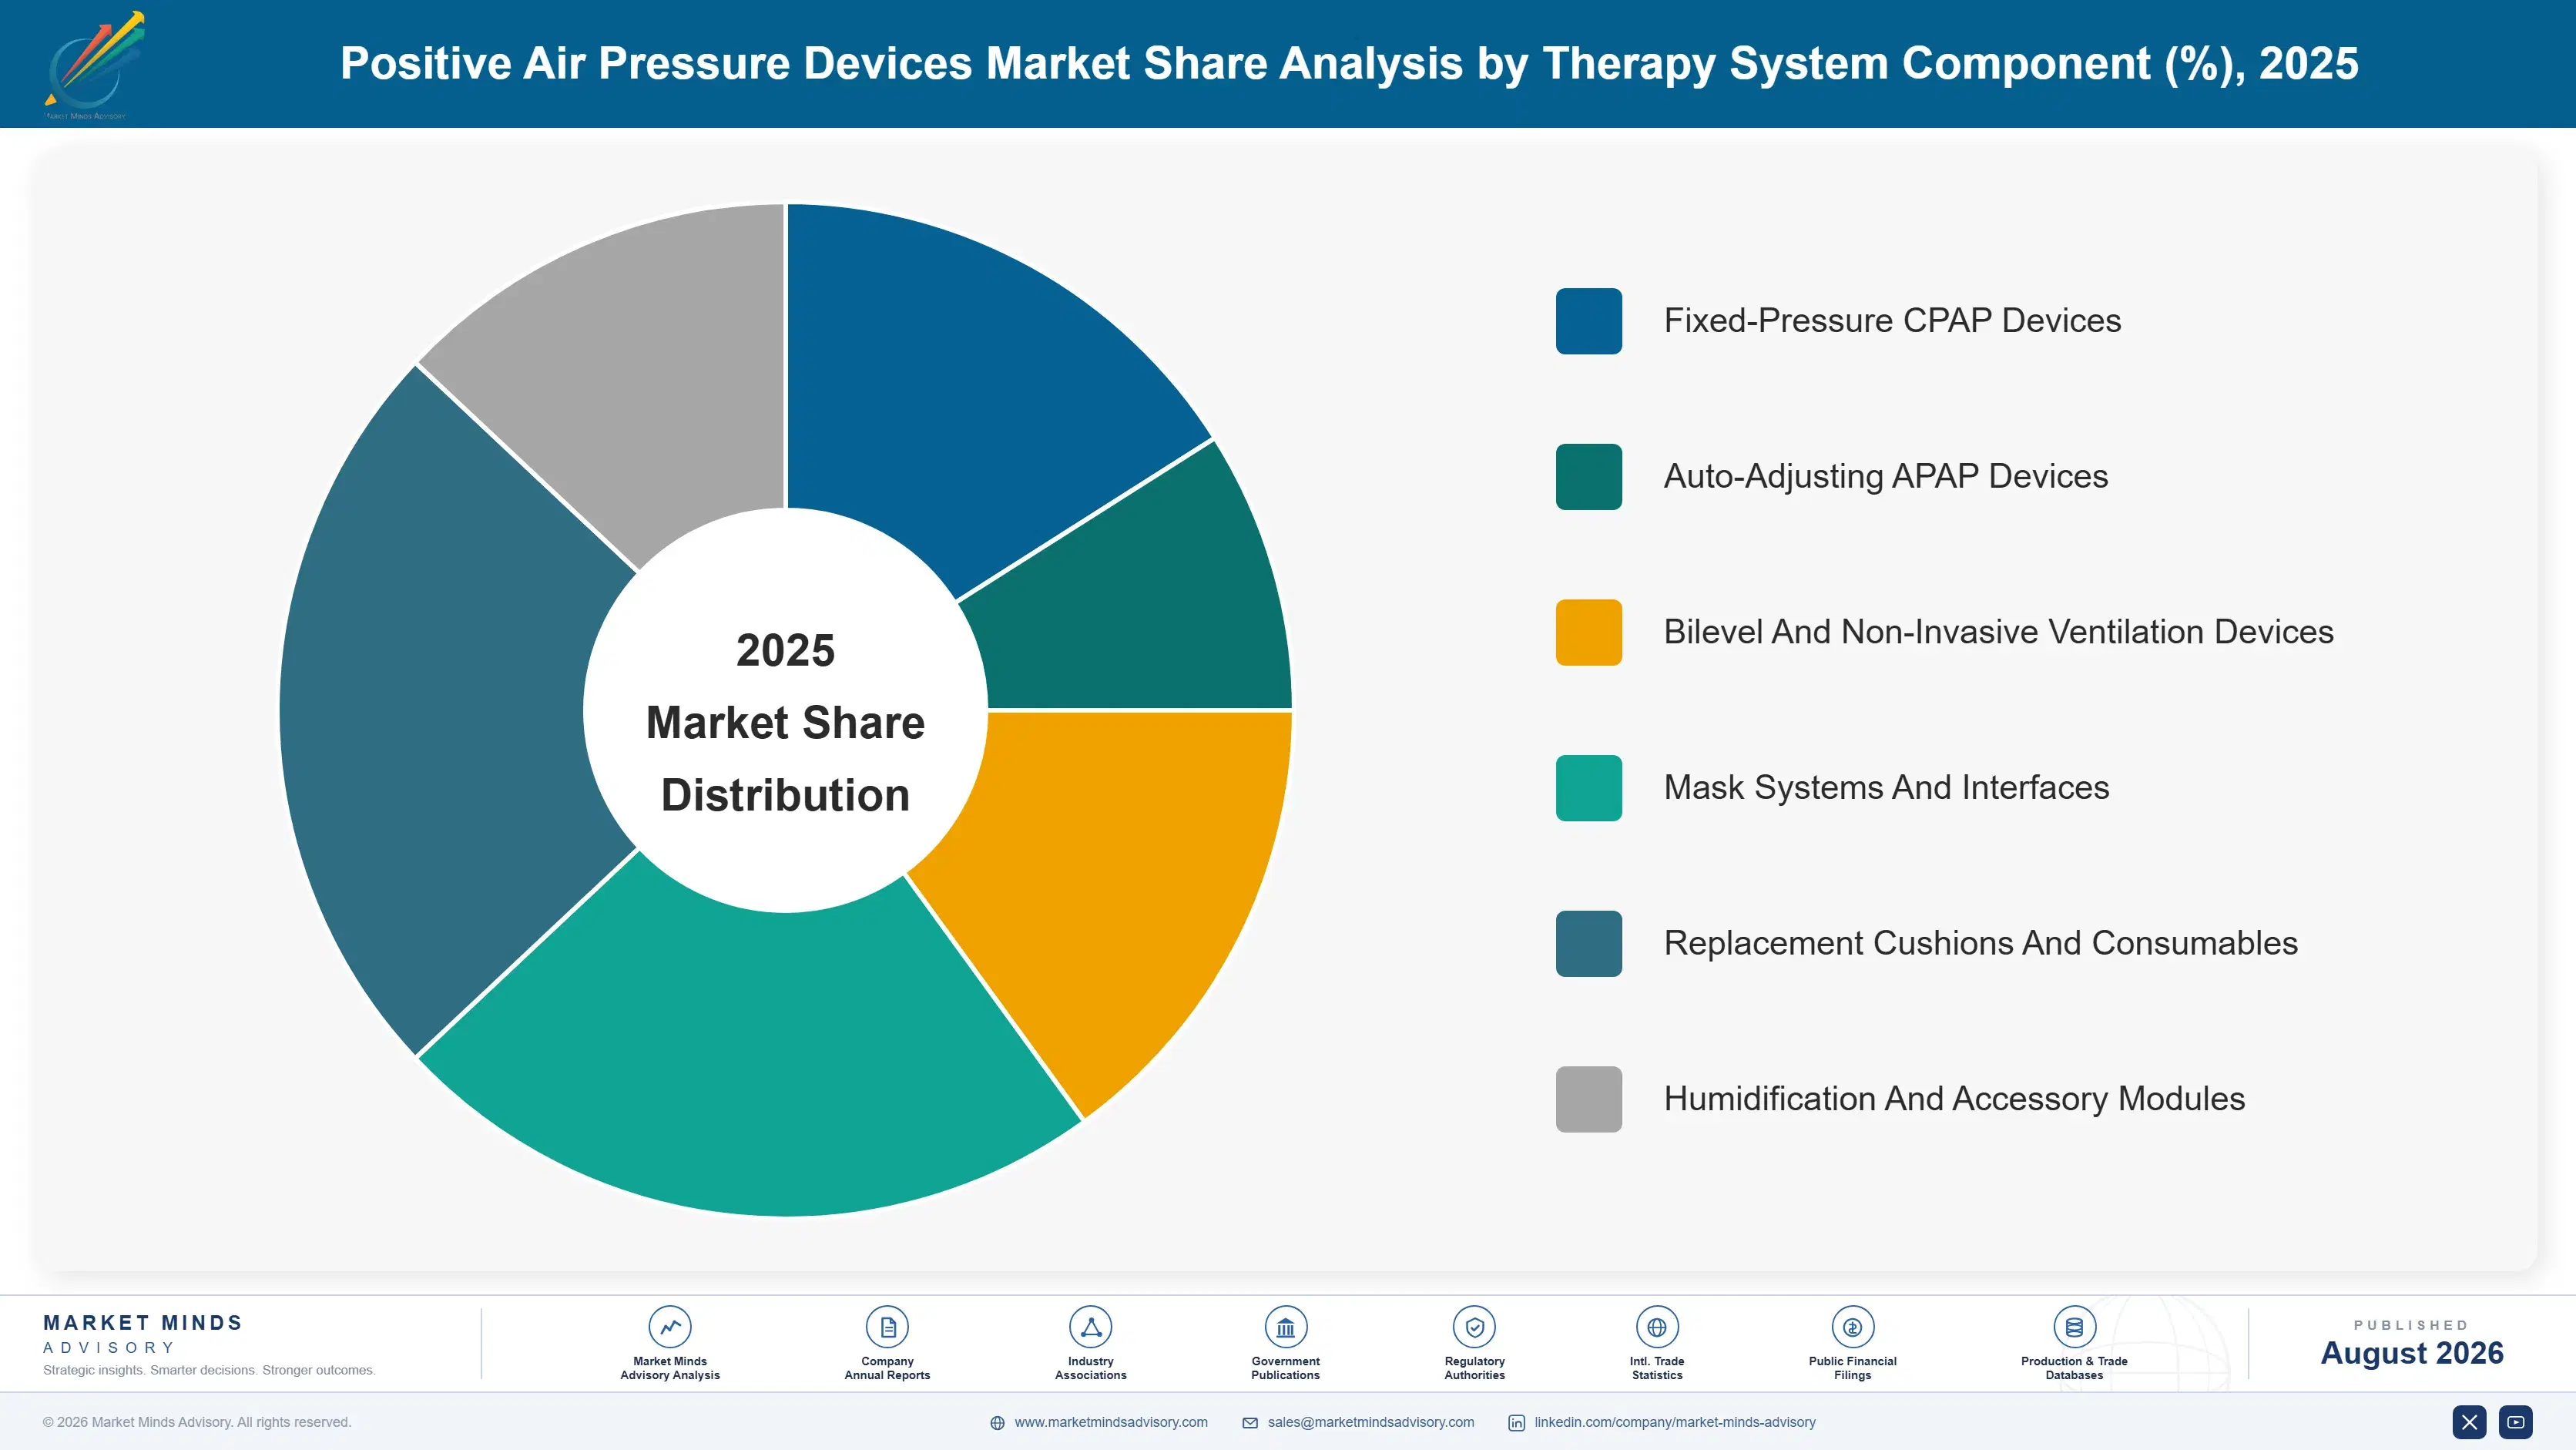
Segmentation here follows the therapy system component, because each component carries its own replacement cycle, its own reimbursement code, and an entirely different margin structure behind it. Patient severity and care setting both cut across every component rather than separating them out cleanly, so neither serves as a workable primary dimension for this market.
positive-air-pressure-devices-market-market-share-analysis-1787299161077

Replacement Cushions And Consumables

The fastest component at 11.1%, exactly 1.50 times the market rate, and the reason this category is more attractive than device shipment figures suggest. A silicone cushion is replaced roughly every four weeks and a full mask quarterly, against a blower replaced once in five years, so the consumable generates dozens of transactions across a single device lifetime. Growth comes from installed base expansion and from resupply programmes moving off passive reordering toward telemetry-driven outreach. Margin is excellent and volumes are predictable. The contest is channel control rather than product, because in the largest market the equipment provider rather than the manufacturer decides which brand arrives each month. Direct platforms capture far more than provider-routed ones.
CAGR 11.1%

Mask Systems And Interfaces

Second fastest at 9.4%, and the component that actually determines whether the therapy succeeds. Pressure titration is straightforward engineering; getting a seal that holds through a night of movement without marking the face or waking a partner is not. Only 62% of patients clear reimbursement adherence thresholds and interface problems account for most of the failures. Nasal pillows, nasal masks, and full face designs each suit different breathing patterns and facial geometries, and matching them correctly is currently done by trial. Facial scanning for fit selection is the obvious answer and remains oddly underdeployed given what adherence failure costs everybody involved. Every abandonment destroys years of consumable revenue behind it, which nobody appears to have costed properly.
CAGR 9.4%
Full segment breakdown across 6 segments available in the complete report.

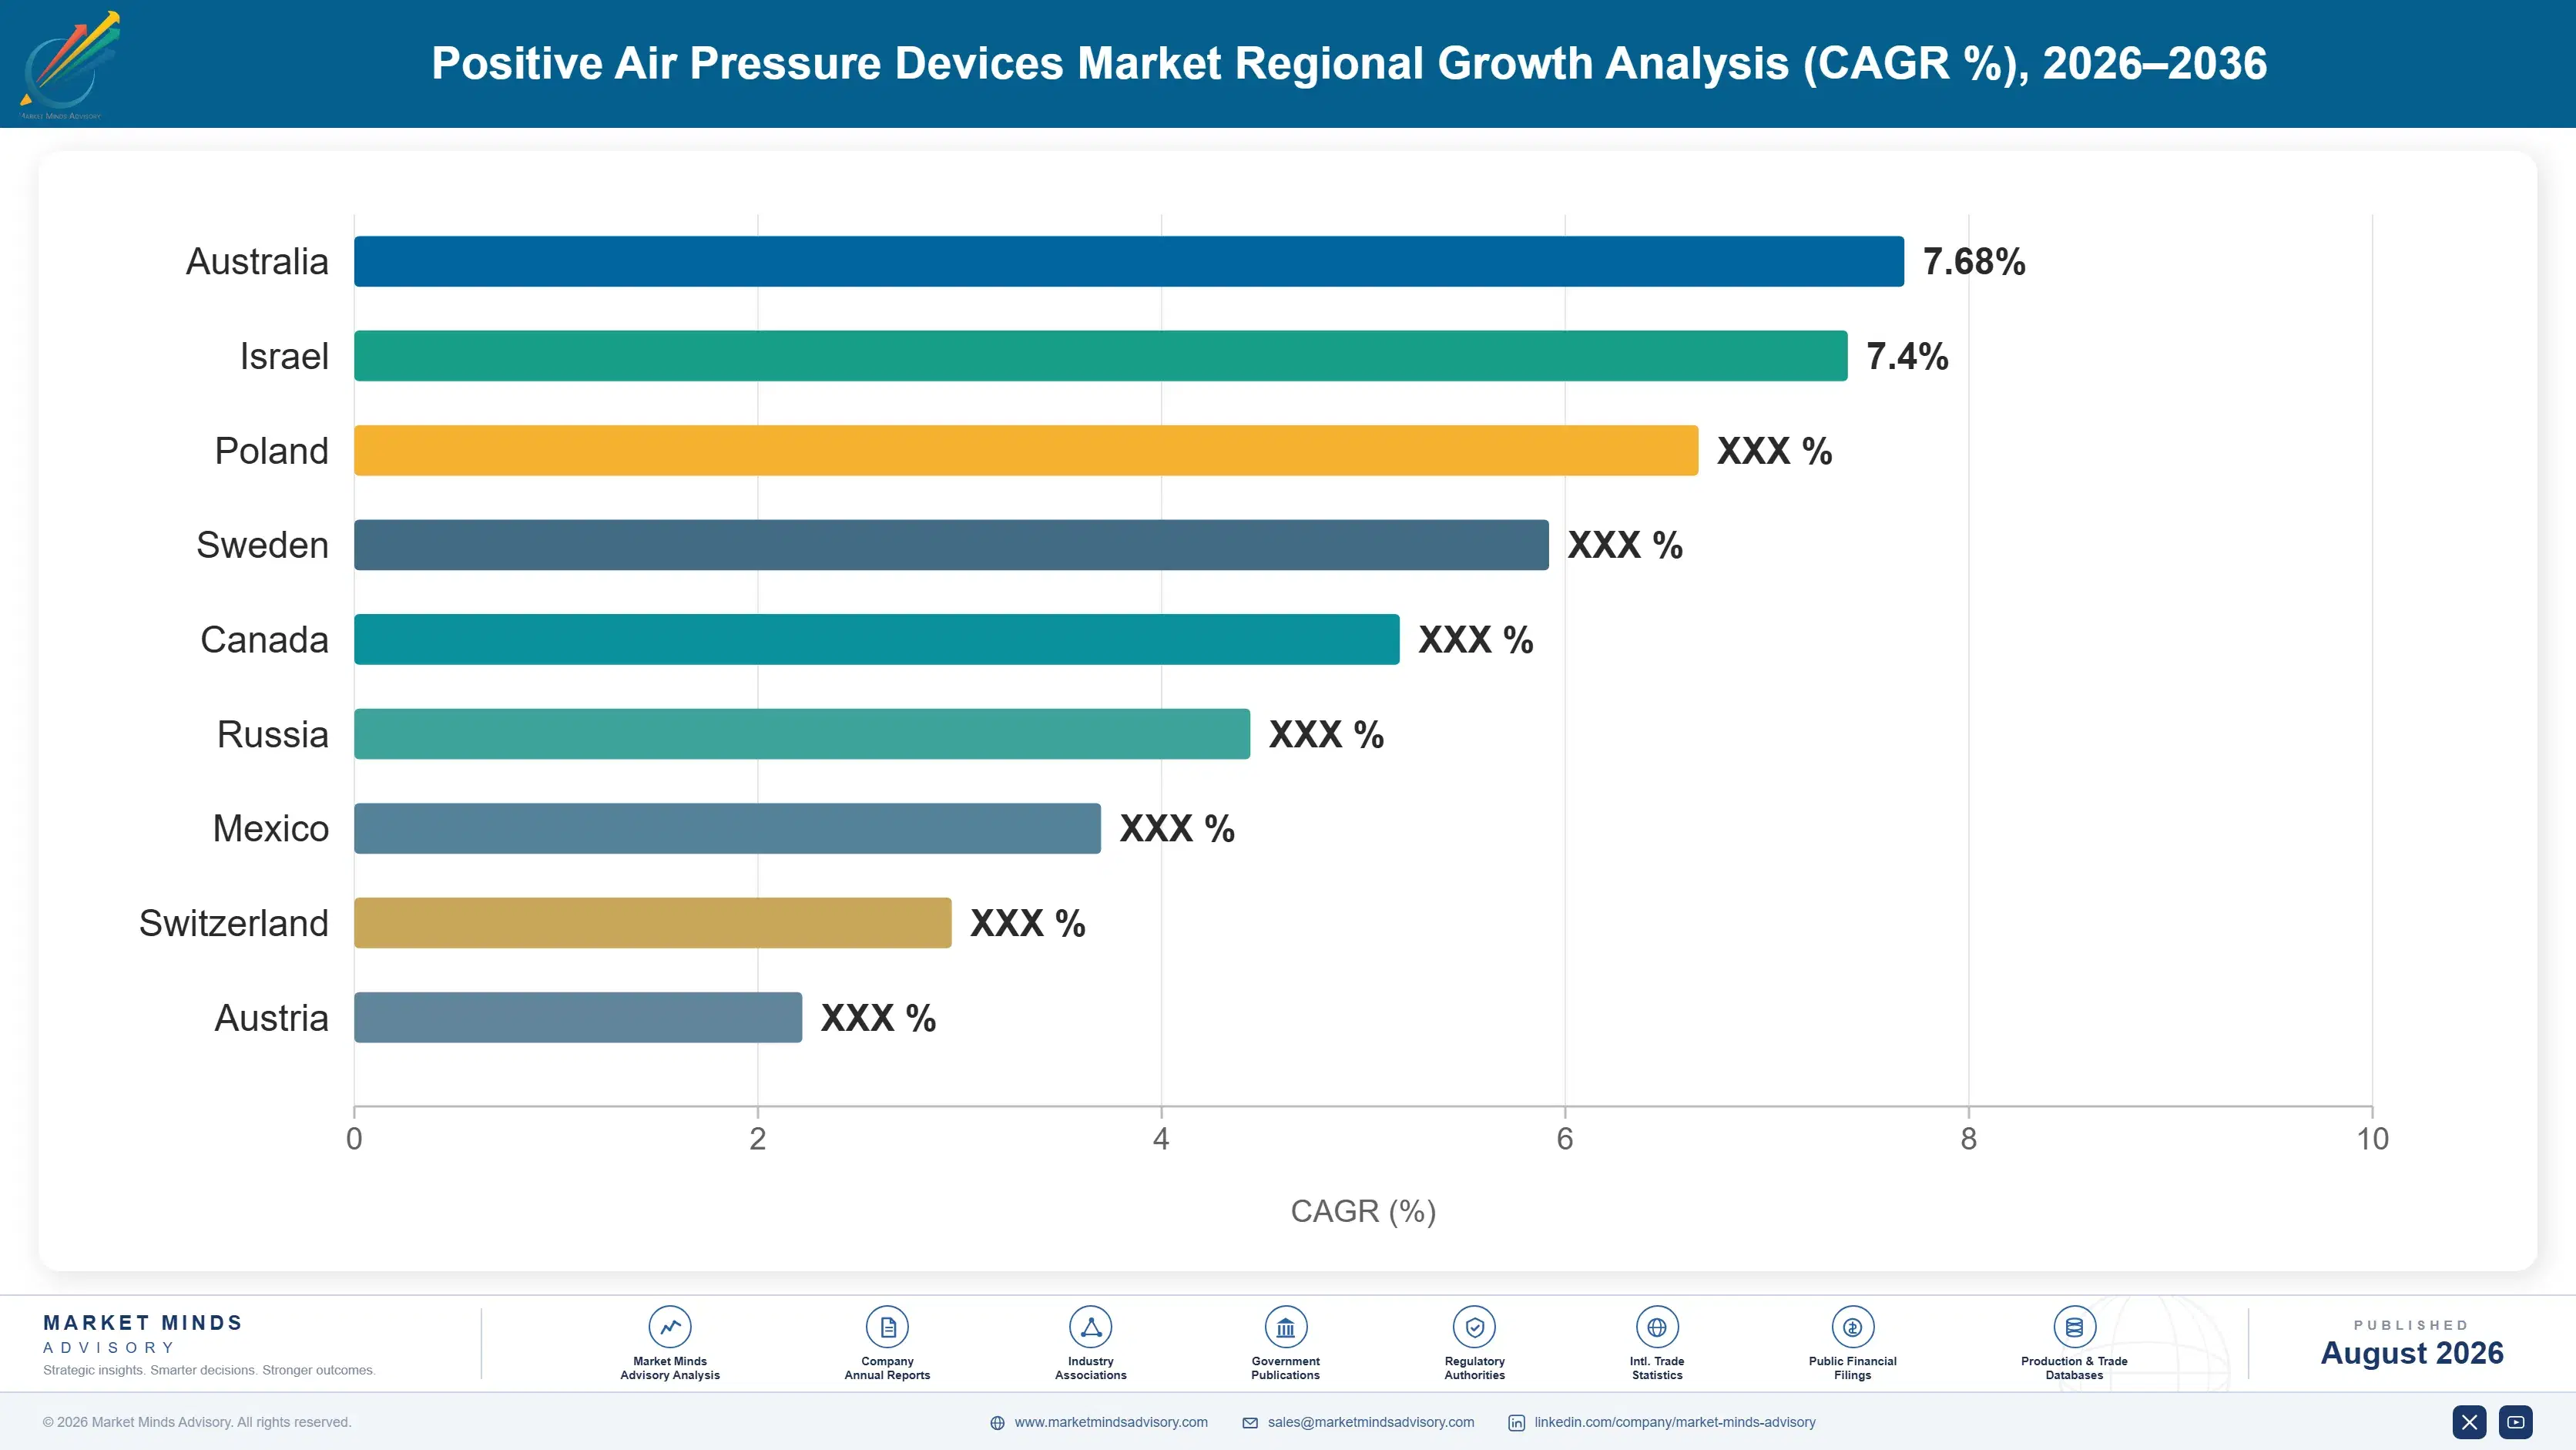
Regional Architecture and Country Demand Map

Value in this category follows reimbursement design rather than disease prevalence, and the two diverge sharply. North America sits far above its framework band because it pays for documented adherence, while East Asia falls below band despite a large diagnosed population buying at much lower prices.

North America

Thirty-eight percent, well above the framework band, and the justification is a reimbursement structure that exists nowhere else. United States payers fund therapy conditional on documented adherence, which built a telemetry infrastructure, a resupply industry, and a durable medical equipment channel around a device that elsewhere is simply sold. That channel captures the 63% of revenue sitting in consumables. Sleep physician density and home sleep testing access are both the highest anywhere. Growth at 6.4% trails the global rate on a mature diagnosed base, with competitive bidding compressing reimbursement and prescription weight-loss therapy arriving here first. Competitive bidding compresses device reimbursement steadily, and the new drugs arrive here first, Home sleep testing access is the best anywhere.
Share: 38% | CAGR: 6.4% (2026 to 2036)

East Asia

Nineteen percent, below the framework band, and the shortfall is price rather than patients. China has a very large affected population and diagnosis rates improving from a low base, but the great majority of purchases are out-of-pocket and domestic manufacturers supply devices at a fraction of Western prices. Resupply discipline is weaker without a reimbursement mechanism enforcing it, so consumable revenue per patient runs far below North American levels. Japanese and Korean demand behaves more like Western Europe. Growth at 8.7% runs above the global rate on Chinese diagnosis expansion and on rising obesity prevalence across urban populations. Resupply discipline weakens without reimbursement enforcing it, which cuts lifetime value considerably.
Share: 19% | CAGR: 8.7% (2026 to 2036)
Regional intelligence for 5 additional markets available in the complete report: Western Europe, South Asia and Pacific, Latin America, Middle East and Africa, Eastern Europe. Contact sales@marketmindsadvisory.com.
positive-air-pressure-devices-market-country-cagr-analysis-1787299161602

Four Ways to Grow a Sleep Franchise

Blower engineering is mature and no patient has ever chosen a brand on pressure algorithm. Value comes from owning the resupply channel rather than ceding it, from solving mask fit instead of adding mask variants, from positioning alongside the new drugs, and from funding the diagnosis that creates every future patient. Four levers follow, and none concerns the machine.

Take The Resupply Relationship Direct To The Patient

In the largest market the equipment provider decides which cushion arrives each month, which hands a manufacturer's most profitable revenue stream to an intermediary with no brand loyalty. Direct-to-patient resupply platforms, driven by the same telemetry that reports adherence, let the manufacturer contact the patient when replacement is due. Manufacturers running direct programmes capture 25 to 35% more resupply revenue per installed device across the therapy lifetime. Provider relationships complicate this considerably, which is exactly why competitors hesitate and why the position is worth taking. The telemetry needed to run it already exists.
Market Impact: Captures 25 to 35% more resupply per device

Solve Mask Fit With Scanning Rather Than More Variants

Thirty-eight percent of patients fail adherence thresholds and interface problems cause most of it, yet the industry response has been to proliferate mask variants and let clinicians select by trial. Facial scanning that matches geometry to a specific cushion size and style removes the guesswork and is technically straightforward with a phone camera. Deployment costs around 6 million dollars across a product range and a clinician network. Every adherence failure prevented saves a device return and preserves years of resupply, which makes the payback arithmetic unusually favourable. A phone camera is technically sufficient for the scan.
Market Impact: Deployment costs roughly 6 million dollars in total

Position Devices Alongside Weight-Loss Therapy. Not Against It

Manufacturers have treated incretin drugs approved for this diagnosis as a threat and responded defensively, which misreads what is happening in the clinic. Physicians prescribing these drugs screen for sleep apnoea far more often than they did, which pulls patients out of the roughly 80% who are undiagnosed. Many still need a device, and those who lose weight often need retitration rather than discharge. Building the combined pathway with prescribers converts a perceived substitute into the largest patient recruitment channel this category has ever had access to. Defensive positioning wastes the recruitment opportunity entirely.
Market Impact: Recruits from the 80% undiagnosed adult patient population

Fund Home Sleep Testing Access In Primary Care

Every device placement and every resupply annuity begins with a diagnosis, and diagnosis is gated by testing capacity rather than by patient willingness. Funding home sleep apnoea testing at primary care level costs perhaps 900,000 dollars annually across a national network and converts referrals that currently go unattended. It also builds the prescriber relationship long before any device decision is made. Competitors advertising to already-diagnosed patients are contesting a pool that is a fifth the size of the one this opens. Referrals currently go unattended in large numbers, and nobody is funding the fix.
Market Impact: Testing access costs roughly 900,000 dollars each year

Who Controls the Margin Pool

Concentration reaches 82% across the top five measured on installed device base, which makes this among the most concentrated categories in medical devices. Two suppliers account for the great majority of that, and the current balance between them reflects a recall rather than any competitive contest. The gap to challengers is enormous on installed base and telemetry infrastructure, and much narrower on device engineering itself, where several smaller manufacturers build capable machines.
Competition runs on three fronts. Resupply channel control is the first and it decides the majority of revenue. Interface range and fit capability is the second, since adherence failure destroys the annuity entirely. Telemetry and platform integration is the third, and it is where the incumbents are furthest ahead of everyone else. Nobody competes seriously on blower performance any more.

Pressure comes from two directions. Chinese manufacturers supply capable devices at prices that work in out-of-pocket markets the incumbents have never served well. And prescription weight-loss therapy is a category-level uncertainty that no manufacturer can influence through product development. Neither pressure can be answered by product development alone, which is uncomfortable for engineering-led organisations.
positive-air-pressure-devices-market-company-positioning-matrix-1787299162124

Competitive Moat and Risk Dimensions

RESMED

Moat: Telemetry platform and resupply infrastructure

Cellular-connected devices feeding a platform that reports adherence to payers and triggers resupply outreach create a position no competitor matches by building a better blower. The data belongs to the platform rather than the clinician. Providers and payers both integrate with that infrastructure, raising switching costs across the whole channel.
RESMED

Risk: Exposed to pharmaceutical substitution

Concentration in a single therapy area leaves nowhere to move if incretin drugs displace device treatment in mild and moderate disease. The company's strongest market is where those drugs are prescribed most aggressively. A franchise this focused converts a category-level uncertainty into a company-level one.
PHILIPS

Moat: Broad hospital and clinical relationships

Presence across imaging, monitoring, and hospital respiratory gives the company clinical relationships that a sleep-only competitor cannot assemble, and sleep services frequently sit inside institutions where those relationships already exist. Rebuilding sleep position on that foundation is a different task from entering the category cold. The breadth also funds regulatory and quality infrastructure that sleep volumes alone would not support.
PHILIPS

Risk: Installed base did not return

A recall removed the company from much of the market for years and the installed base that transferred has largely stayed put, because a patient settled on a working mask does not switch back without reason. Regaining position means winning newly diagnosed patients rather than recovering former ones.

Players Tracked

Prominent Players

ResMed
Philips
Fisher and Paykel Healthcare
Lowenstein Medical
BMC Medical

Other Key Players

React Health
Apex Medical
DeVilbiss Healthcare
3B Medical
Somnetics
Breas Medical
Vyaire Medical
Air Liquide Healthcare
SEFAM
Nidek Medical
Yuwell Medical
Hoffrichter
Sleepnet Corporation
Circadiance
Invacare

Recent Developments

JANUARY 2025

Incretin therapy obtains sleep apnoea indication in adults with obesity

A regulatory authority approved an incretin-based weight-loss therapy for moderate to severe obstructive sleep apnoea in adults with obesity, the first pharmacological treatment ever indicated for the condition. The approval was a regulatory decision on submitted trial data rather than any commercial arrangement involving device manufacturers.
Signal: A pharmaceutical alternative changes the payer conversation permanently, whether it recruits patients into the pathway or removes them
APRIL 2025

Manufacturer launches direct-to-patient resupply platform in major market

A sleep therapy manufacturer opened a direct resupply channel contacting patients when cushion replacement falls due, using adherence telemetry from its own connected devices. The launch was organic commercial development rather than any acquisition of a distribution business, and it operates alongside existing equipment provider relationships.
Signal: Manufacturers are moving on the consumable channel that intermediaries have held, which will strain provider relationships considerably
AUGUST 2025

Indian sleep clinics expand home testing across metropolitan private hospitals

Private hospital groups across several Indian metropolitan areas widened home sleep apnoea testing availability, moving diagnosis outside the small number of laboratory sleep units previously handling it. The expansion was internal clinical service investment rather than any partnership with a device manufacturer or diagnostics company.
Signal: Diagnosis capacity rather than device affordability is now the binding constraint across the fastest-growing national market

What Sits Inside the Cost Base

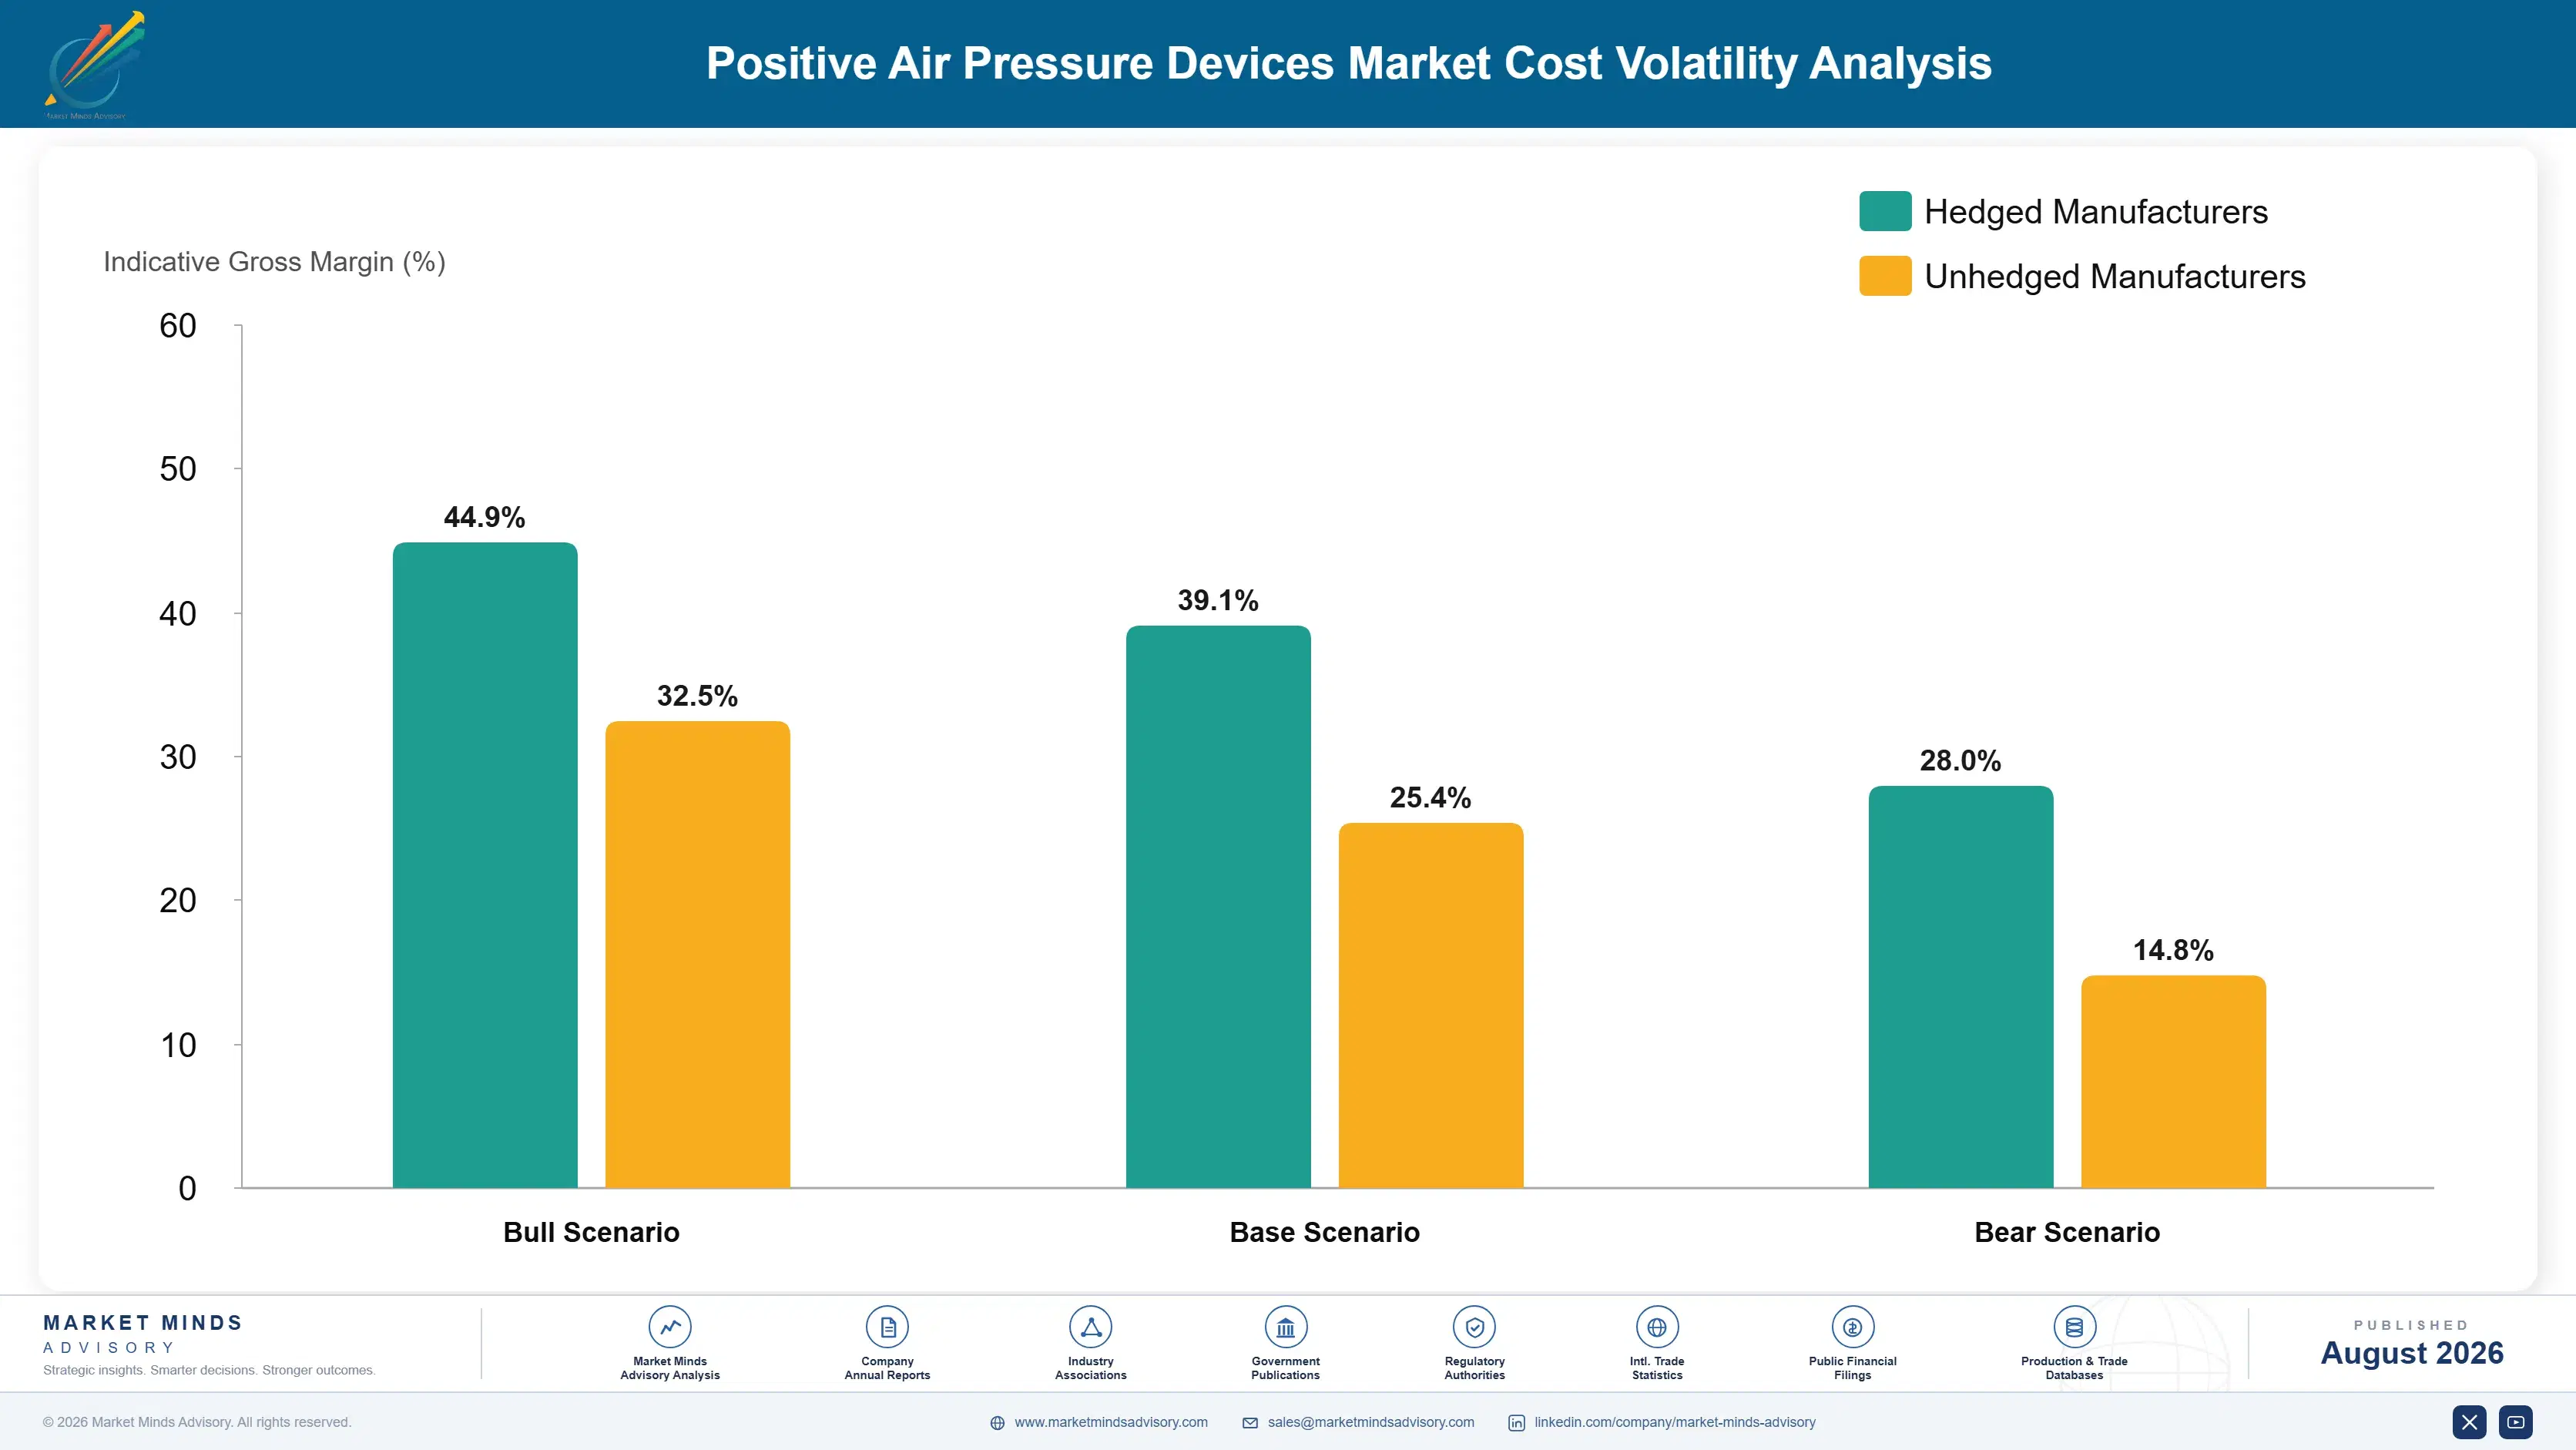
Electronics dominate the device and silicone dominates the consumable. Motors, sensors, control boards, and cellular modules together run about 41% of blower cost of goods, sourced from Asian electronics supply chains. Medical grade silicone for cushions and injection moulded frames account for roughly 34% of interface cost. Humidifier assemblies, tubing, and packaging make up most of the remainder across both product families.
Semiconductor availability was the exposure that bit hardest. Control chips and cellular modules were rationed severely during the recent shortage, and manufacturers unable to secure them lost shipments at precisely the moment a competitor's recall had created demand they could otherwise have captured. Company annual reports across medical devices describe the constraint in consistent terms. Medical grade silicone pricing also moved, though from a smaller base and with far less disruption to supply.

The competitive disadvantage mechanism runs through electronics allocation rather than manufacturing capability. Large manufacturers with multi-year semiconductor commitments held supply while smaller ones were rationed, and in a category this concentrated that difference translated directly into installed base. Interface manufacturers face a milder version around medical grade silicone qualification. Regional assemblers buying components on spot carry the full exposure with no allocation position.
positive-air-pressure-devices-market-cost-volatility-analysis-1787299162318

Hold multi-year semiconductor commitments across critical components

Control chips and cellular modules were rationed by allocation rather than by price during the last shortage, and manufacturers without standing commitments simply did not receive them at all. Multi-year agreements specifying volume in both directions secure position rather than merely price, which matters enormously in a category where a missed shipment transfers installed base permanently.

Design control boards for component substitution from the outset

Boards designed around a single specified microcontroller simply cannot be built at all when that particular part becomes unavailable, while boards laid out to accept alternatives from two separate suppliers can be. The design work costs engineering time upfront and regulatory revalidation afterwards, both of which are substantially cheaper than losing a production quarter.

Qualify a second medical grade silicone supplier for cushions

Cushion silicone is skin-contact material requiring biocompatibility documentation, which makes substitution slow and discourages holding alternatives. That reluctance is precisely why a shortage would be damaging, since resupply revenue stops immediately if cushions cannot be moulded. Qualifying a second grade costs testing time and documentation effort that must be spent before any disruption arrives.

Portfolio Architecture for Margin Defence

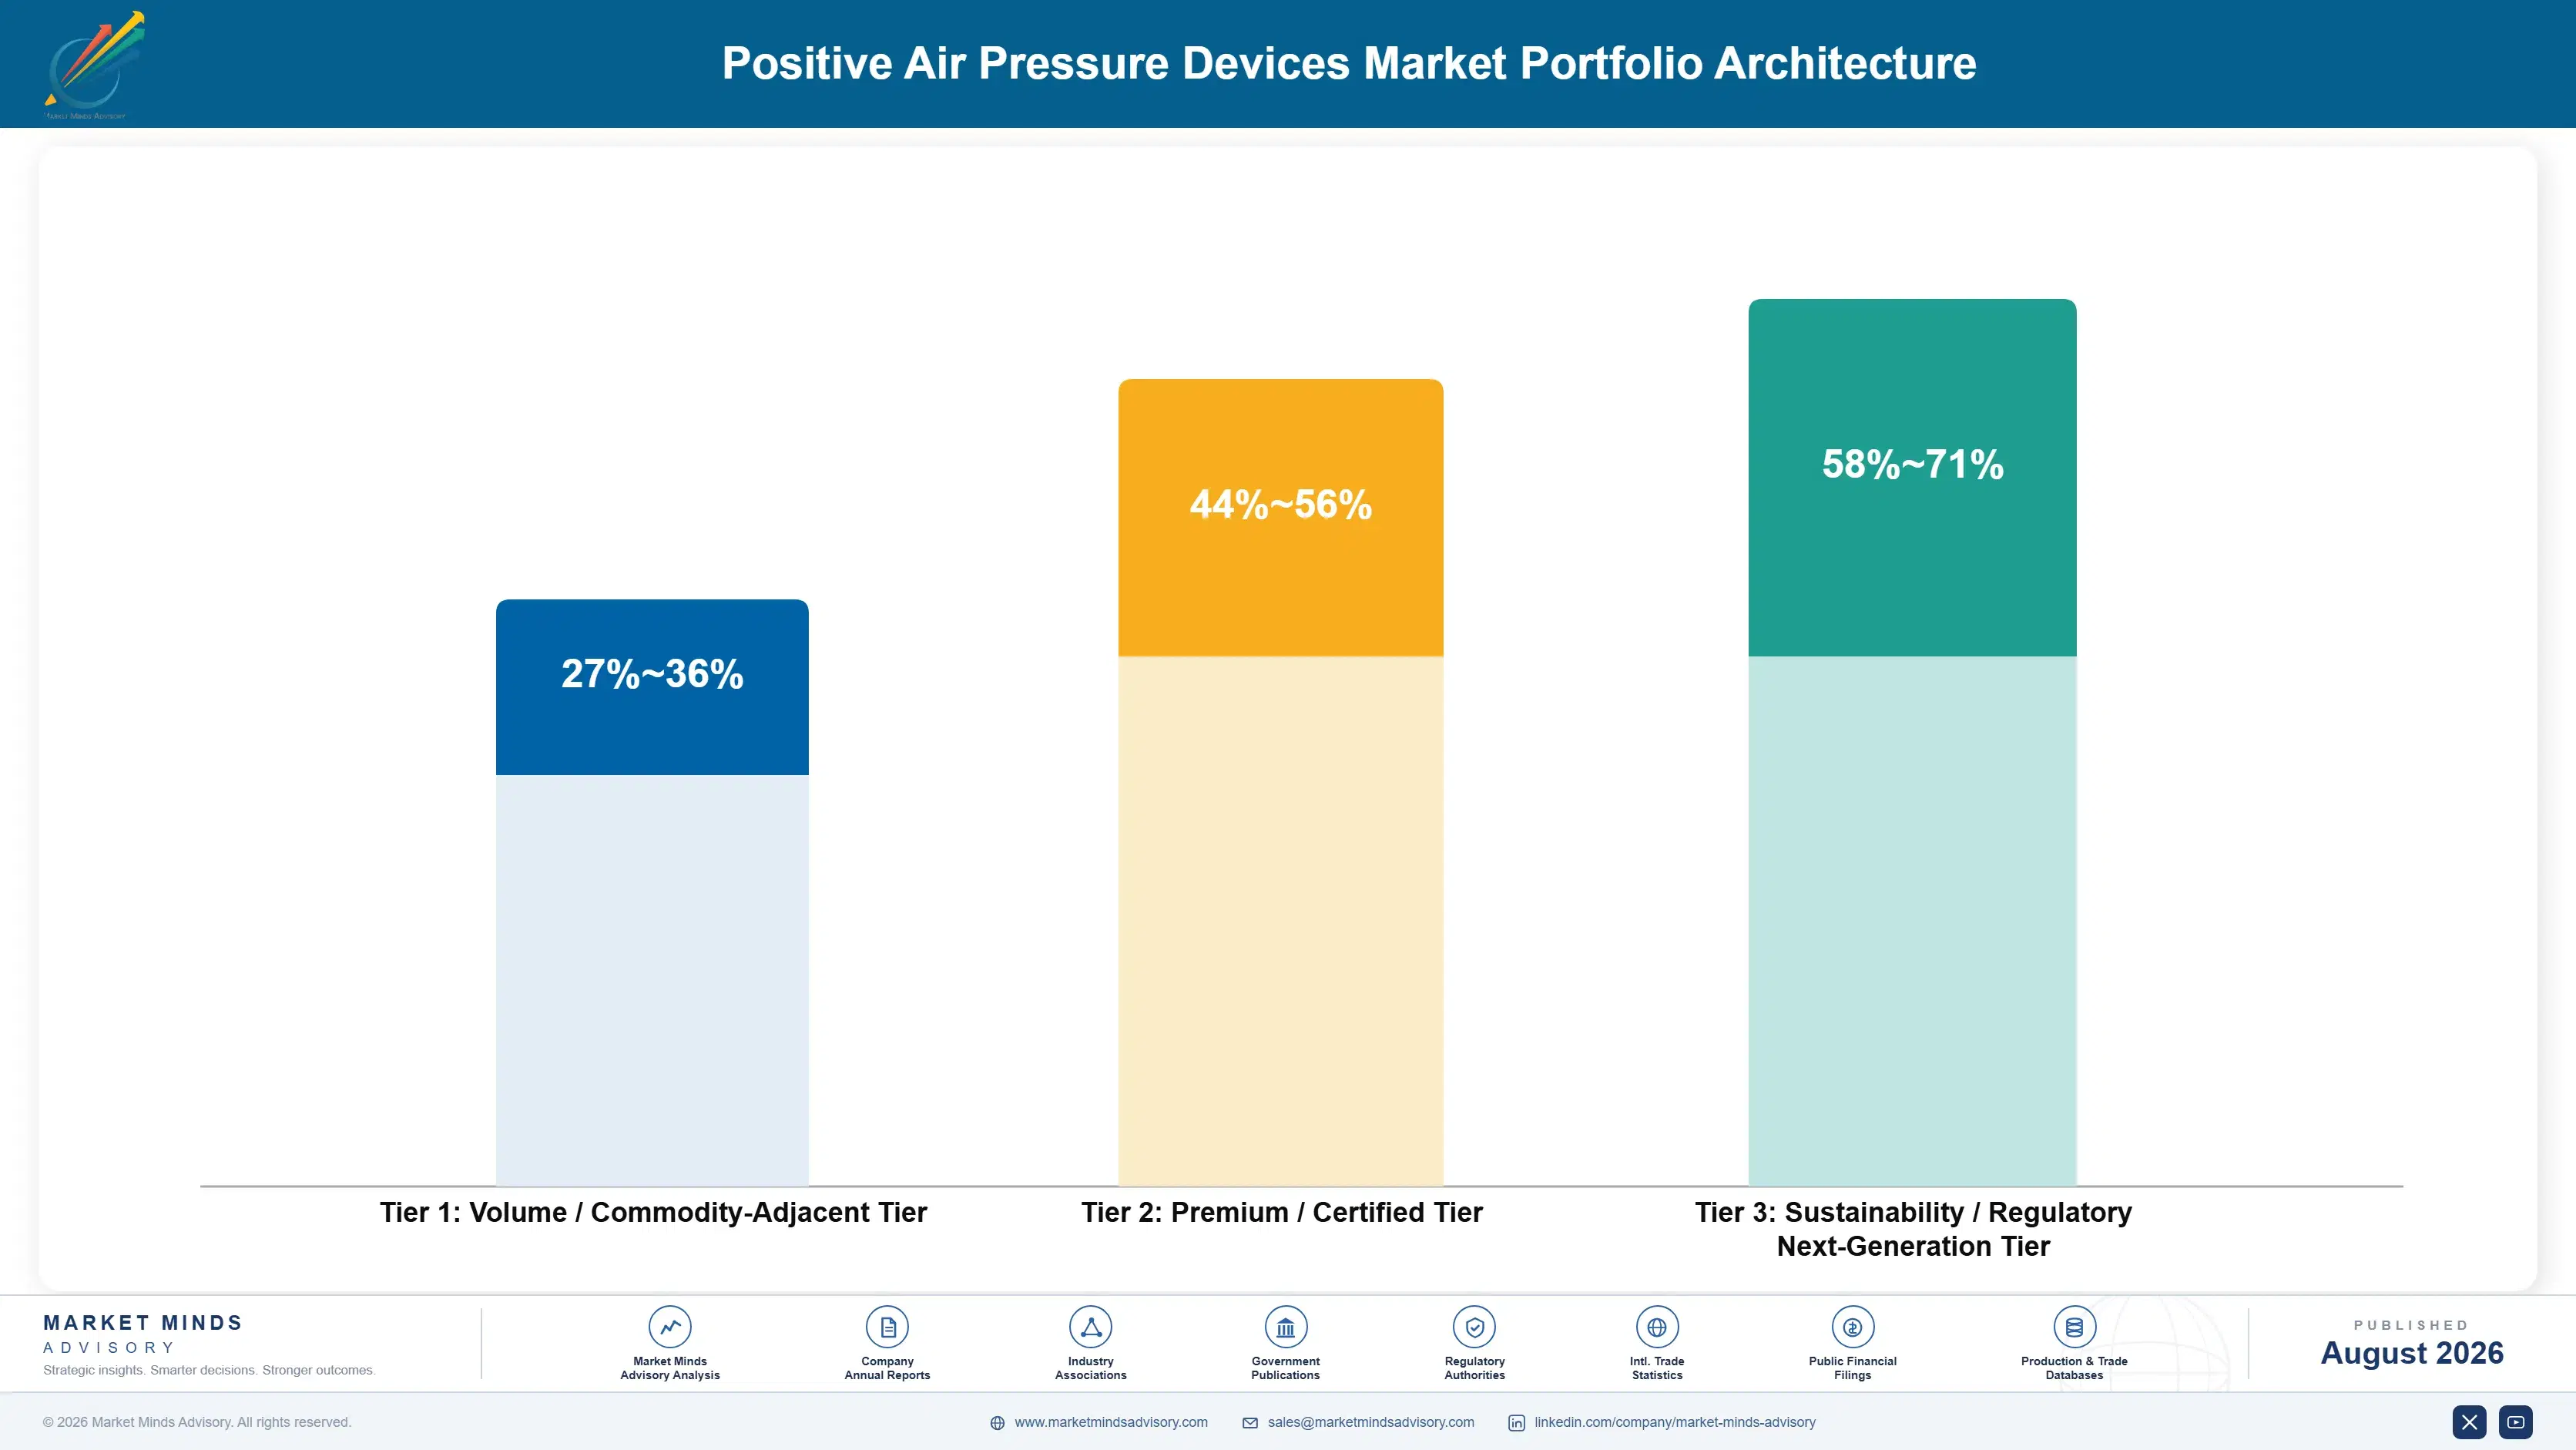
Three tiers describe this business and the margin spread reflects replacement frequency rather than manufacturing complexity. Entry devices sold into out-of-pocket markets sit at the bottom, competing directly against Chinese manufacturers on price. Reimbursed connected devices with telemetry and payer integration sit considerably higher. And consumables, meaning cushions, masks, and tubing on scheduled replacement, occupy a third tier at the best margin and the most predictable volume of anythi
The tension is that device placements create the consumable annuity and cannot be conceded to protect device margin. A manufacturer losing placements watches resupply revenue decline across the following five years as the installed base ages out, and resupply is 63% of the business. Several smaller manufacturers ceded device volume on price and discovered the consequence two device cycles later. The five-year lag is what makes the mistake invisible.

High-value pools concentrate where the manufacturer holds the patient relationship rather than an intermediary. Direct resupply and telemetry-driven outreach both capture revenue that a provider channel otherwise intercepts entirely. Telemetry is what makes the direct relationship possible at all, and the incumbents already have it.

Volume / Commodity-Adjacent Tier

Entry fixed-pressure and basic auto-adjusting devices sold into out-of-pocket markets across Asia. Latin America, and the Middle East. Thin margin against Chinese manufacturers, but each placement seeds a consumable stream lasting years.
Gross Margin: 27-36%

Premium / Certified Tier

Connected devices with cellular telemetry, payer adherence reporting, and provider platform integration for reimbursed markets. Margin reflects the infrastructure behind the device rather than the blower itself, which is broadly comparable across manufacturers.
Gross Margin: 44-56%

Sustainability / Regulatory / Next-Generation Tier

Cushions, masks, tubing, and filters on scheduled replacement, plus direct-to-patient resupply and fit selection services. Best margin and most predictable volume in the category, carrying 63% of revenue across the installed base.
Gross Margin: 58-71%
positive-air-pressure-devices-market-portfolio-architecture-1787299162822

High-value Sub-segments and Strategic Watch-out

Direct Resupply And Consumables

Best margin and fastest growth at 11.1%, generating dozens of transactions across a single device lifetime on a four-week cushion cycle. Direct programmes capture 25 to 35% more per installed device than those routed through equipment providers. Volumes are predictable and margin is excellent, and outreach is driven by telemetry.
Gross Margin: 58-71%

Connected Reimbursed Devices

Strong margin built on telemetry and payer integration rather than on blower engineering, which is broadly comparable across manufacturers. Growth is moderate on a mature diagnosed base, and prescription weight-loss therapy is the genuine uncertainty here. Payer integration raises switching costs across the channel, which the incumbents already hold.
Gross Margin: 44-56%

Entry Devices For Out-Of-Pocket Markets

The volume core in unit terms at thin margin against Chinese manufacturers, and the placements that seed consumable revenue for years afterwards. Manufacturers who conceded this tier on price found resupply declining two device cycles later. Each placement seeds a consumable stream lasting years, and abandoning it costs resupply later.
Gross Margin: 27-36%

Fit Selection And Adherence Services

The strategic watch-out and opportunity together, since 38% of patients currently fail adherence thresholds and interface problems cause most of it. Every failure prevented saves a device return and preserves years of resupply that would otherwise be lost. Abandonment happens in the first ninety days almost exclusively.
Gross Margin: 51-64%

How Sleep Therapy Revenue Repeats

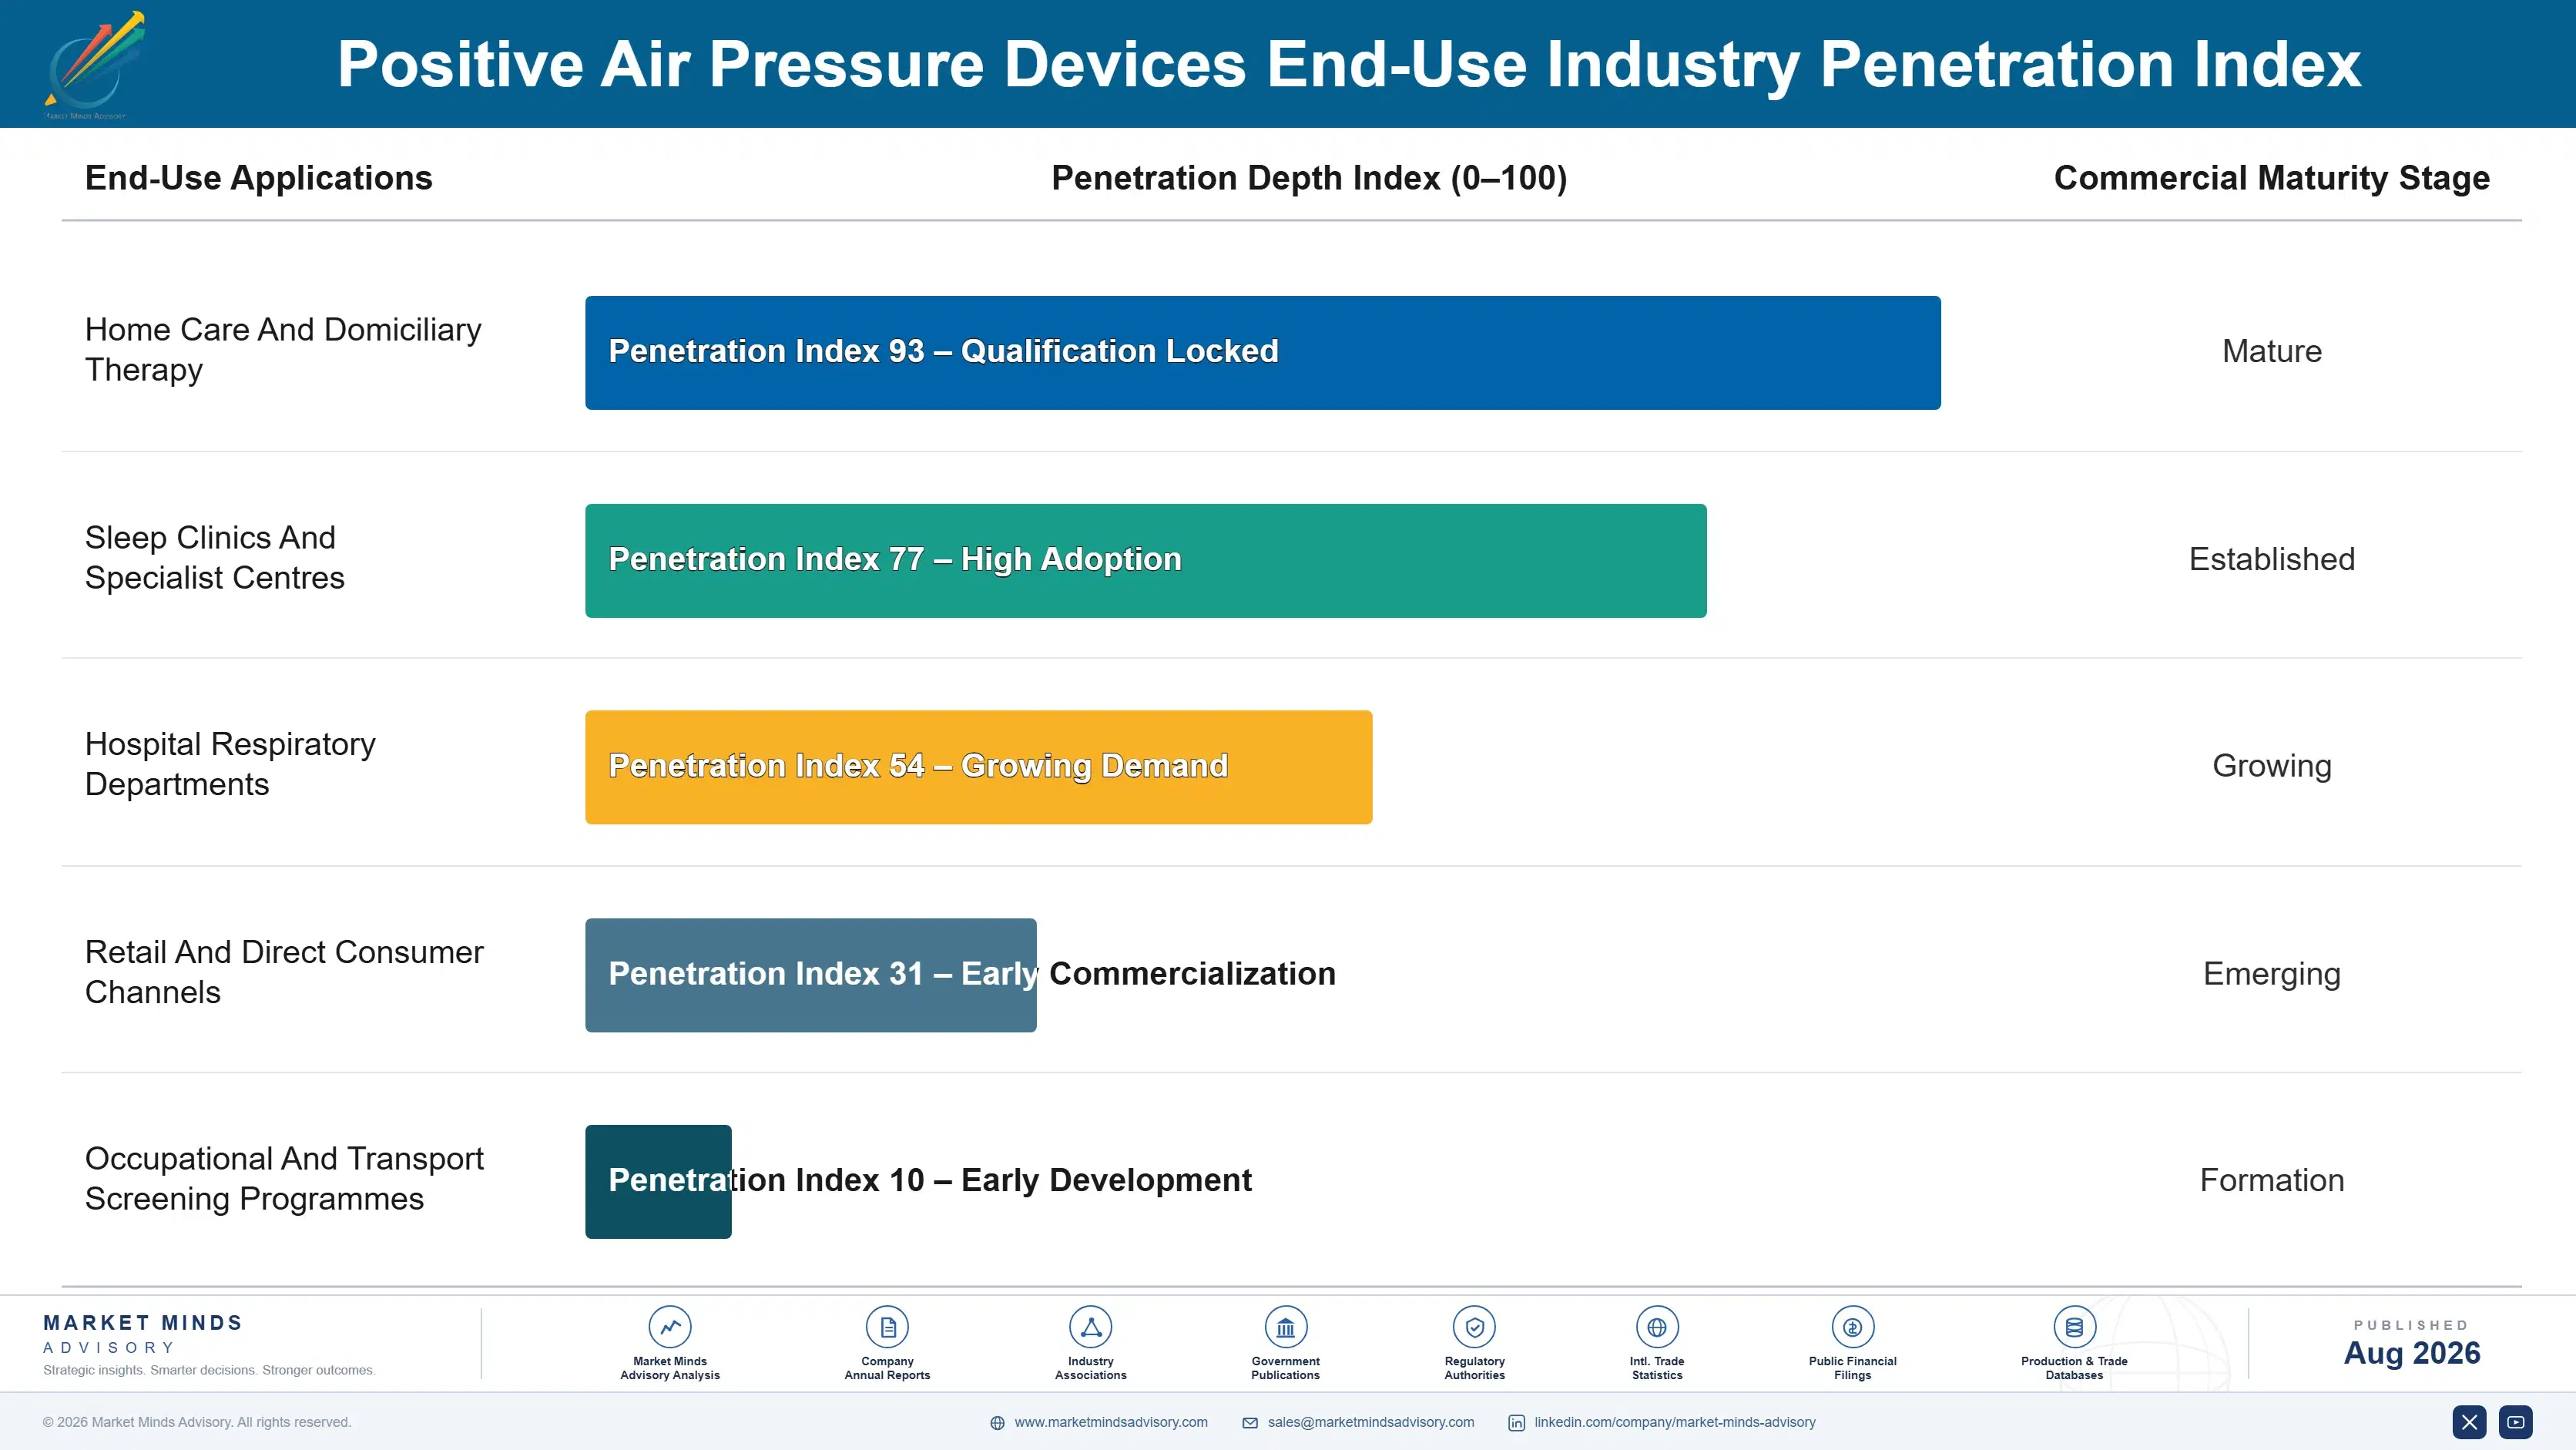
This is among the cleanest annuities in medical devices once a patient is established. A blower placed today generates cushion sales every four weeks, mask sales quarterly, and a replacement device in five years, and the patient rarely switches brands because the mask that finally worked is the mask they keep. What ends the annuity is not competition but abandonment, and abandonment happens in the first ninety days almost exclusively. Everything commercially important therefore happens at the st
Depth of adoption varies enormously by market structure. Reimbursed markets with adherence requirements produce disciplined resupply and high revenue per patient. Out-of-pocket markets produce placements followed by cushions replaced annually rather than monthly, which cuts lifetime value by a wide margin. Institutional and clinic-managed patients sit between the two. Australia and Western Europe fund therapy well and enforce resupply weakly, which is the least profitable combination of the three.

Buyer profiles are shifting as prescribing moves toward primary care and as weight management physicians begin screening for the condition. The clinician placing the patient increasingly is not a sleep specialist at all. Manufacturers built their field organisations around sleep specialists, and that alignment is now wrong.
positive-air-pressure-devices-market-end-use-penetration-index-1787299163311

What We Would Tell a Board

These are among the four positions where our research anticipates prominent divergence between winners and laggards over the coming forecast period. Each is grounded in the demand model, the regulatory perimeter, and the announced capacity pipeline.
01 / RESUPPLY CHANNEL OWNERSHIP

The intermediary is holding your most profitable revenue

Consumables carry 63% of category revenue, and in the largest market it is the equipment provider rather than the manufacturer who decides which brand of cushion reaches the patient every month. Direct resupply platforms driven by the manufacturer's own adherence telemetry capture 25 to 35% more per installed device across the therapy lifetime. Existing provider relationships make this genuinely awkward to execute, which is precisely why competitors hesitate and precisely why the position is worth taking before somebody else takes it first.
02 / INTERFACE FIT ENGINEERING

Fix the mask, not the algorithm nobody notices

Thirty-eight percent of patients fail reimbursement adherence thresholds and interface problems cause the overwhelming majority of those failures, yet engineering budgets keep going into blower acoustics and pressure algorithms. Facial scanning for cushion selection costs around 6 million dollars to deploy across a full interface range and a clinician network. Every adherence failure prevented saves a device return and preserves several years of resupply revenue, which makes the payback arithmetic more favourable than anything else currently available to a board here.
03 / PHARMACEUTICAL PATHWAY POSITIONING

Treat the drug as recruitment, not as competition

Incretin therapy approved for this diagnosis has been read defensively right across the industry, which misunderstands what actually happens in a clinic where prescribers now screen for sleep apnoea far more often than before. That screening reaches directly into the roughly 80% of affected adults who have never been formally diagnosed at all. Many will still need a device, and those losing substantial weight need retitration rather than discharge, so building the combined pathway with prescribers is comfortably the larger opportunity.
04 / DIAGNOSTIC ACCESS FUNDING

Every future patient starts with a test nobody funds

Around 80% of affected adults have never been formally diagnosed, and the binding constraint is testing capacity rather than any reluctance among patients or among referring physicians. Funding home sleep apnoea testing at primary care level costs roughly 900,000 dollars annually across a national network, and it converts referrals that currently go unattended entirely. Competitors advertising to patients already diagnosed are contesting a pool roughly a fifth the size of the one this investment would open up for them instead.

Engagement Snapshot From the Field

A live engagement with an industry participant carrying material or product regulatory and market exposure ahead of a defining policy shift, showing how our research translates into a defensible multi-year portfolio strategy.
MARKET MINDS ADVISORY · CLIENT ENGAGEMENT SUMMARY
Positive Air Pressure Devices Producer Strategic Portfolio Review and Transition Roadmap 2026·Investment Scenario on Positive Air Pressure Devices Exposure Evaluation 2025-26
CLIENT PROFILE
A mid-sized sleep therapy manufacturer with approximately 380 million dollars in annual revenue (client-reported, unverified by MMA), supplying connected positive airway pressure devices and interfaces across North America and Europe. The company routed all resupply through equipment providers, held a wide mask range selected by clinician trial, and had no organised response to the arrival of pharmacological therapy for the indication.
STRATEGIC CHALLENGE
Device placements had grown steadily while revenue per installed device declined for three consecutive years, and management attributed the gap to competitive discounting on consumables. Adherence data showed a rising proportion of patients failing reimbursement thresholds. The board wanted independent diagnosis before approving a consumables price reduction. Nobody had connected the two observations.
MMA APPROACH
We reconstructed revenue per installed device by cohort against resupply channel and adherence outcome, benchmarked cushion capture rates against manufacturers running direct programmes, and analysed adherence failures against interface type and fit selection method. Prescriber interviews across four markets tested how weight management physicians were handling sleep apnoea screening. Provider contract terms were reviewed alongside.
KEY FINDINGS
  1. Revenue per installed device tracked resupply capture rather than pricing, and provider-routed cushions were reaching the client's patients at roughly half the rate direct programmes achieve.
  2. Adherence failures concentrated overwhelmingly in the first ninety days and correlated with interface type rather than with pressure settings, disease severity, or patient demographics.
  3. Weight management physicians in three of four markets were screening for sleep apnoea and referring, but none had any relationship with the client or awareness of its products.
  4. Fit selection was performed by clinician trial at every site reviewed, with an average of 2.4 mask changes before a patient settled or abandoned therapy altogether.
CLIENT PROFILE
A mid-sized sleep therapy manufacturer with approximately 380 million dollars in annual revenue (client-reported, unverified by MMA), supplying connected positive airway pressure devices and interfaces across North America and Europe. The company routed all resupply through equipment providers, held a wide mask range selected by clinician trial, and had no organised response to the arrival of pharmacological therapy for the indication.
STRATEGIC CHALLENGE
Device placements had grown steadily while revenue per installed device declined for three consecutive years, and management attributed the gap to competitive discounting on consumables. Adherence data showed a rising proportion of patients failing reimbursement thresholds. The board wanted independent diagnosis before approving a consumables price reduction. Nobody had connected the two observations.
MMA APPROACH
We reconstructed revenue per installed device by cohort against resupply channel and adherence outcome, benchmarked cushion capture rates against manufacturers running direct programmes, and analysed adherence failures against interface type and fit selection method. Prescriber interviews across four markets tested how weight management physicians were handling sleep apnoea screening. Provider contract terms were reviewed alongside.
KEY FINDINGS
  1. Revenue per installed device tracked resupply capture rather than pricing, and provider-routed cushions were reaching the client's patients at roughly half the rate direct programmes achieve.
  2. Adherence failures concentrated overwhelmingly in the first ninety days and correlated with interface type rather than with pressure settings, disease severity, or patient demographics.
  3. Weight management physicians in three of four markets were screening for sleep apnoea and referring, but none had any relationship with the client or awareness of its products.
  4. Fit selection was performed by clinician trial at every site reviewed, with an average of 2.4 mask changes before a patient settled or abandoned therapy altogether.
RECOMMENDED STRATEGY
Phase 1: Phase 1 (months one to nine): cancel the consumables price reduction and launch a direct-to-patient resupply platform using existing device telemetry. Phase 2: Phase 2 (months nine to twenty-four): deploy facial scanning fit selection across the interface range and train the clinician network on it. Phase 3: Phase 3 (months twenty-four to thirty-six): build a referral pathway with weight management prescribers across the four principal markets served.
OUTCOME
The client abandoned the price reduction and launched direct resupply in two markets. Revenue per installed device recovered above its prior peak within four quarters and ninety-day adherence improved materially following fit scanning deployment (client-reported, unverified by MMA), with prescriber referral pathways now in pilot.

Frequently Asked Questions

Foundational context covering the market sizes, CAGR, scope, country, region and competition that inform every finding below. This section is provided to cover basics and most often pre-purchase conversations, answered from the MMA Primary Research Dataset.

What is the current size of the Positive Air Pressure Devices Market?

The market is valued at USD 5.8 billion in 2025, rising to USD 6.23 billion in 2026. Consumables and resupply account for roughly 63% of that value.

How large will the Positive Air Pressure Devices Market be by 2036?

MMA forecasts USD 12.72 billion by 2036, an increase of USD 6.49 billion over the 2026 base. That represents an expansion multiple of 2.04 times.

What is the CAGR for the Positive Air Pressure Devices Market 2026 to 2036?

The base case CAGR is 7.4%, with a bull case of 8.6% and a bear case of 6.2%. The historical rate from 2020 to 2025 was 6.1%.

Which segment is growing fastest?

Replacement cushions and consumables at 11.1%, exactly 1.50 times the market rate. A cushion is replaced roughly every four weeks against a device replaced once in five years.

Who are the major companies in the Positive Air Pressure Devices Market?

ResMed, Philips, Fisher and Paykel Healthcare, Lowenstein Medical, and BMC Medical lead on installed device base, together holding 82% of the market. That makes it among the most concentrated device categories anywhere.

Which country is growing fastest?

India at 12.4%, driven by high urban prevalence, minimal formal diagnosis, and device pricing that has finally reached accessible levels. Patients there pay directly rather than through reimbursement.

Report Segmentation Architecture

The full report scope spans multiple orthogonal segmentation dimensions, with cross-tabulated demand data provided for each dimension pair. Coverage extends further to regional breakdowns, trend trajectories, and the competitive detail needed to support segment-level decision-making.

By Therapy System Component

  • Fixed-Pressure CPAP Devices
  • Auto-Adjusting APAP Devices
  • Bilevel And Non-Invasive Ventilation Devices
  • Mask Systems And Interfaces
  • Replacement Cushions And Consumables
  • Humidification And Accessory Modules

By End-Use Industry

  • Home Care And Domiciliary Therapy
  • Sleep Clinics And Specialist Centres
  • Hospital Respiratory Departments
  • Retail And Direct Consumer Channels
  • Occupational And Transport Screening Programmes

By Payment Model

  • Reimbursed With Adherence Documentation
  • Public Health System Provision
  • Out-Of-Pocket Direct Purchase
  • Rental And Managed Service Programmes

By Region

  • North America
  • East Asia
  • Western Europe
  • South Asia and Pacific
  • Latin America
  • Middle East and Africa
  • Eastern Europe

Scope, Methodology, and Coverage

Every figure in this report is reproducible from documented input assumptions. The scope below maps the historical period, the forecast horizon, the segmentation dimensions, and the countries covered, alongside the underlying primary and qualitative methodology.
Historical Period
2020 to 2025
Forecast Period
2026 to 2036
Base Year
2025 (USD billions; MMA Primary Research Dataset, August 2026)
Market Definition
This market comprises positive airway pressure therapy systems used to treat obstructive sleep apnoea and related sleep-disordered breathing, measured at manufacturer realised prices across devices, interfaces, consumables, and accessory modules. Component coverage spans fixed-pressure and auto-adjusting devices, bilevel and non-invasive ventilation units, mask systems, replacement cushions and tubing, filters, and humidification modules across home care, clinic, and retail channels. Home sleep testing equipment, laboratory polysomnography systems, hypoglossal nerve stimulation implants, mandibular advancement and oral appliances, critical care ventilators, oxygen therapy equipment, and pharmacological treatments fall outside scope.
Quantitative Units
USD billions (current prices); devices shipped annually; resupply revenue per installed device
Segmentation Dimensions
By Therapy System Component; By End-Use Industry; By Payment Model; By Region
Regions Covered
North America, East Asia, Western Europe, South Asia and Pacific, Latin America, Middle East and Africa, Eastern Europe
Countries Covered
USA, Canada, Mexico, Brazil, Argentina, Chile, Germany, France, UK, Italy, Spain, Netherlands, Sweden, Switzerland, Poland, Czechia, Turkey, China, Japan, South Korea, Taiwan, India, Australia, Thailand, Indonesia, Saudi Arabia, UAE, South Africa, Egypt, and additional markets relevant to this sector
Key Companies Profiled
ResMed, Philips, Fisher and Paykel Healthcare, Lowenstein Medical, BMC Medical, React Health, Apex Medical, DeVilbiss Healthcare, 3B Medical, Somnetics, Breas Medical, Vyaire Medical, Air Liquide Healthcare, SEFAM, Nidek Medical, Yuwell Medical, Hoffrichter, Sleepnet Corporation, Circadiance, Invacare
Quantitative Methodology
Primary survey, n=3,800 respondents, Q4 2025, six countries; demand-side model with trade association cross-validation
Qualitative Methodology
47 expert interviews, Q4 2025; applied to validate demand model assumptions, identify emerging dynamics, and assess competitive positioning
Report Format
PDF and XLSX data workbook (Word format preview document)
Publisher
Market Minds Advisory
Report Code
MMA-2026-MED-273
Published
August 2026
Contact
sales@marketmindsadvisory.com | www.marketmindsadvisory.com

Purchase the full Positive Air Pressure Devices Market Report (2026 to 2036).

The full report sizes positive airway pressure therapy across six system components, five care settings, four payment models, and seven regions, with country detail for the twenty largest national markets. Device and consumable revenue are sized separately throughout, since resupply carries the majority of value and behaves nothing like device shipments. Revenue per installed device is modelled by market structure and resupply channel, alongside adherence outcomes by interface type. Competitive profiling covers twenty companies on installed device base. The commercial interaction between incretin therapy and device treatment is assessed market by market.
Device and consumable revenue sized separately throughout
Revenue per installed device by market and channel
Adherence outcomes benchmarked by interface type and fit method
Incretin therapy interaction assessed market by market
Undiagnosed population and home testing capacity by country
Resupply capture rates compared across direct and provider channels

Built For The People Who Decide

From boardroom strategy to bench-side execution, this report is read cover-to-cover by leaders shaping the next decade of their industry, turning demand scenarios, market dynamics and valuation benchmarks into decisions.
CXOs/ Presidents/ VPs/ Managers
M&A and Corporate Development
Strategy Teams and R&D Heads
Procurement and Product Directors
Regulatory and Compliance Leaders
Investor Relations and Equity Analysts