Market Minds Advisory
POS Terminal Market

POS Terminal Market: POS Terminal Market: Payment Acceptance Hardware, Smart Terminals and Unattended Systems, 2026 to 2036

Acquirers give the hardware away because the terminal is where a merchant relationship gets captured and defended. Manufacturers therefore sell to a subsidy budget rather than to anybody who wants the device.

Lead Analyst

Published

September 2026

Make Smarter Decisions with Customized Research Insights

Request a free sample report and evaluate market opportunities, growth trends, and competitive dynamics relevant to your business needs.

2025 MARKET VALUE$26.8BMarket Size 2025
2036 FORECAST VALUE$58.8BBase Case , 2026 to 2036
CAGR 2026 TO 20367.4 %Bull 8.6% / Bear 6.2%
INCREMENTAL OPPORTUNITY$30.0BNet 10- year value creation
EXPANSION MULTIPLE2.04x2036 value over 2026 base
Strategic Levers
M&A Pipeline
Regional Outlook
Country Rankings
Competitive Intelligence
Segmental Deep-dive
Call-Us : 91 93563 13602

Executive Snapshot and Market Trajectory.

Around 68% of terminals are deployed below cost by acquirers and payment service providers, because the device is where a merchant relationship is captured and then defended against anybody trying to take it. Manufacturers are selling into a customer acquisition budget rather than to a buyer who wants hardware.
Android smart terminals grow at 11.1%, half again the market rate of 7.4%, and they changed what the device is for. A terminal running applications becomes a distribution surface for lending, loyalty, and business software, which moves value toward whoever controls what gets installed on it. Some 54% of new shipments now run an application capable operating system. Acquirers specify that environment first. Hardware capability comes second in every conversation.
Five manufacturers hold 61% of shipment value, and security certification rather than engineering keeps the field that narrow, since approval takes the better part of a year and costs more than most entrants will fund. East Asia holds 29% of value on manufacturing and deployment together. Roughly 7.2 million sellers now accept cards using only a phone. Tap to phone is removing the smallest merchants, who were never profitable anyway. Certification keeps new entrants out.
Market Definition
This market covers payment acceptance terminals and associated hardware, including countertop fixed terminals, portable and handheld terminals, Android smart terminals, unattended and kiosk terminals, mobile card readers, and self-checkout and assisted selling systems. It excludes payment processing and acquiring services, merchant software subscriptions sold separately, cash handling equipment, general purpose tablets used without certified payment hardware, and card issuance systems.
Base Year Value
$26.8B in 2025 (MMA Primary Research Dataset, September 2026)
Forecast Period
2026 to 2036, eleven discrete annual values
CAGR
7.4% base case. Bull 8.6%. Bear 6.2%.
Fastest Growth Segment
Android Smart Terminals: 11.1% CAGR
Fastest Growth Country
Nigeria: 14.8% CAGR
Fastest Growth Region
South Asia and Pacific: 9.5% CAGR
Largest Region
East Asia: 29% of 2025 global value
Market Leaders
PAX Technology, Ingenico, Verifone, Newland Payment Technology, and NEXGO lead the field. Source: MMA Primary Research Dataset, July 2026.
Primary Survey
n=3,800 procurement and R&D decision-makers, Q4 2025, six countries
Methodology
Demand-side build-up, cross-validated against public data, 47 expert interviews

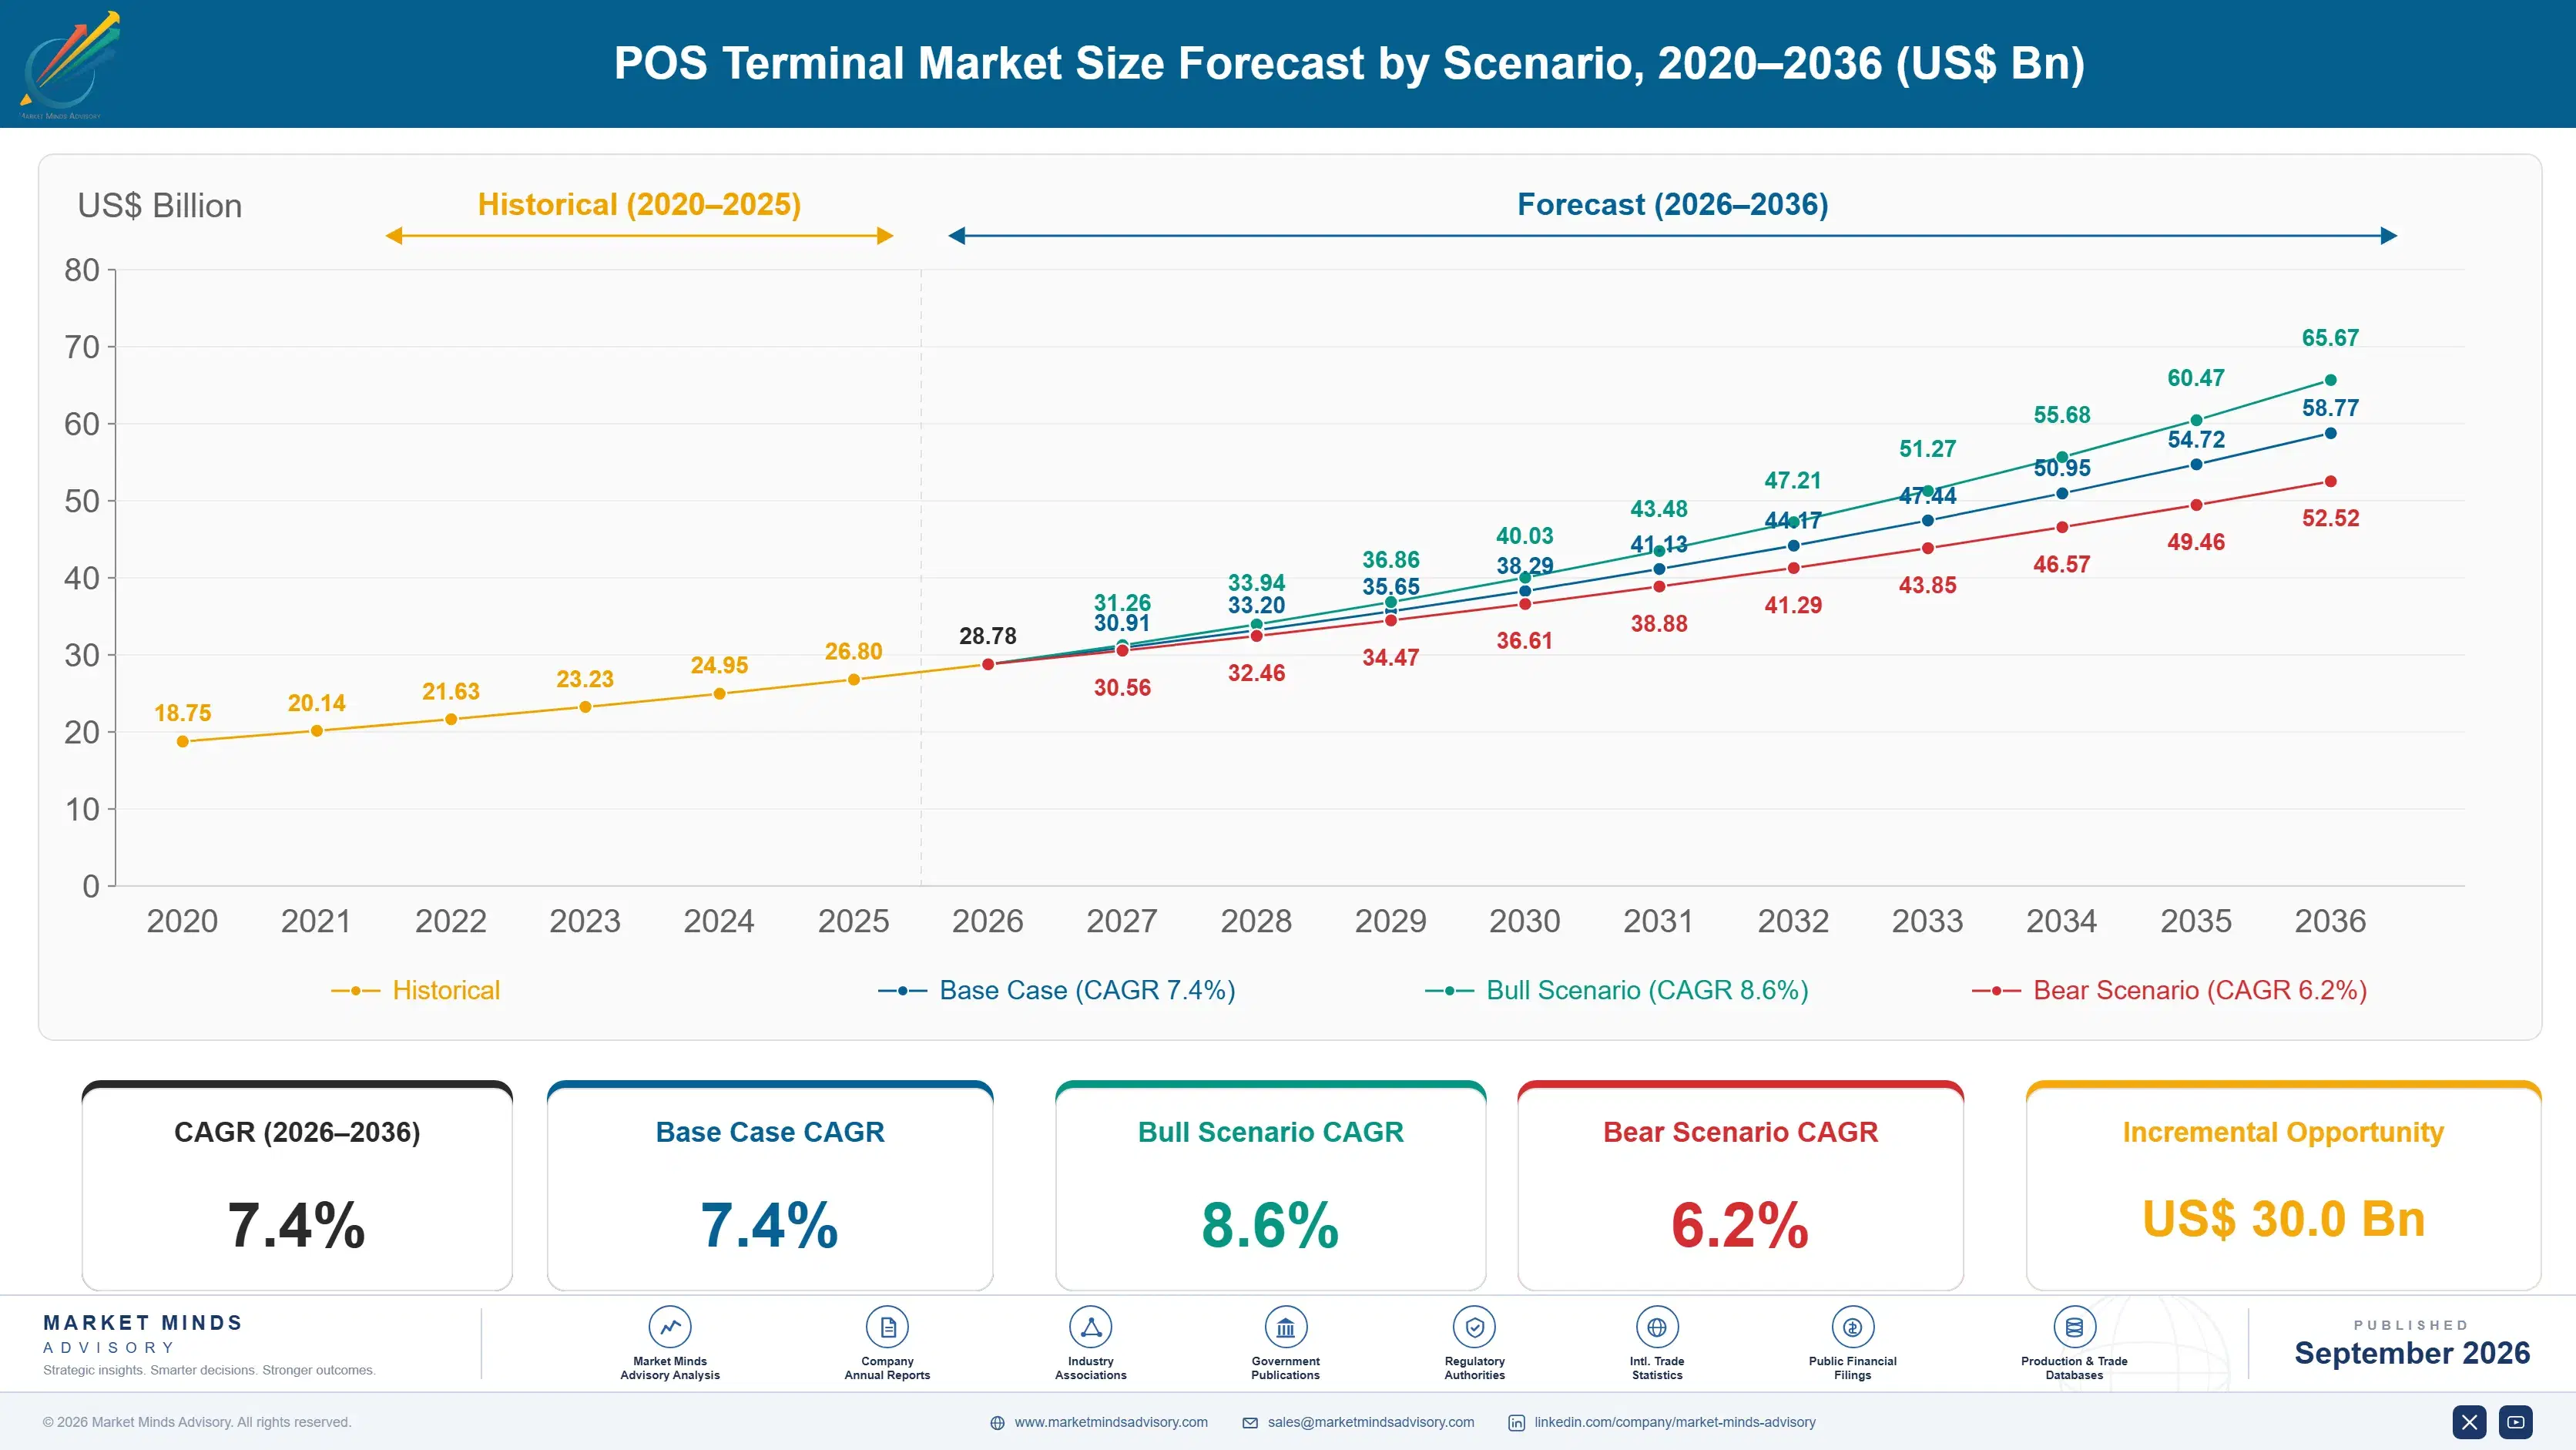
POS Terminal Market Forecast Scenarios

pos-terminal-market-size-forecast-scenario-1790008987444
Growth between 2020 and 2025 came from new merchants rather than from replacing old terminals. Card acceptance spread into segments that had been cash only, particularly across Latin America, Africa, and South Asia, while mature market unit volumes were largely flat and replacement driven. Historical growth of 6.3% reflects that split, with emerging unit growth offsetting price erosion elsewhere.
The base case at 7.4% rests on three mechanisms. Android terminals command higher prices than the countertop devices they replace, which lifts average value even where unit volumes do not move. Unattended acceptance keeps expanding across parking, fuel, transport, and vending as cash handling costs become indefensible. And agent banking networks across Africa and South Asia deploy terminals as cash access points rather than as retail payment devices, which is a different application entirely.
The bull case at 8.6% depends on unattended acceptance reaching transport and municipal infrastructure at scale, which would add terminal volumes with no merchant subsidy attached and much longer deployment lives. The bear case at 6.2% is acceptance on phones spreading upward: tap to phone already serves 7.2 million sellers, and if it becomes credible for higher volume merchants the entry tier disappears.

Hardware Given Away To Hold Merchants

The economics of this market are set by somebody who does not want the product. An acquirer deploys terminals to win and hold merchant processing, and 68% go out below cost on that basis. Manufacturers therefore compete for a subsidy budget, which explains average selling prices near USD 96 and the relentless pressure on specification at every price point.
TOP FIVE CONCENTRATION61%Share of shipment value held by the leading manufacturers
ACQUIRER SUBSIDISED SHARE68%Terminals deployed below cost to secure processing relationships
AVERAGE SELLING PRICEUSD 96Delivered manufacturer price across all deployed terminal types
ANDROID SHARE OF SHIPMENTS54%New terminals running an application capable operating system
TERMINAL DEPLOYMENT LIFE5 yearsMedian period a deployed terminal remains in active service
TAP TO PHONE MERCHANTS7.2 millionSellers accepting cards without any dedicated hardware device
Android changed what is being subsidised. A terminal running applications distributes merchant lending, loyalty, inventory, and accounting software, and whoever controls installation on that device controls a channel worth considerably more than the hardware. Some 54% of new shipments are application capable, and acquirers increasingly specify the operating environment before they specify the terminal. Hardware capability comes second in that conversation.
Certification is the reason only five manufacturers hold 61% of value. Security approval for payment hardware takes the better part of a year, costs more than most entrants will commit, and must be repeated for each hardware revision. That barrier has nothing to do with engineering difficulty and everything to do with why this field has not fragmented as consumer electronics did. Consumer electronics entrants would otherwise have arrived years ago.
"Nobody in this market is selling a terminal to somebody who wants one. You are selling into an acquisition budget that would rather spend nothing, for a device whose real value is the software channel it opens afterwards. Manufacturers who still price on hardware specification are having the wrong conversation."
Practice Director, Payments Infrastructure and Merchant Technology · MMA Technology Practice · September 2026

Market Trends

Smart Terminals Become Software Distribution Channels

A terminal running an application platform stops being a payment device and becomes the screen a merchant looks at all day, which makes it the obvious place to distribute lending offers, loyalty programmes, inventory tools, and accounting integrations. Android shipments reached 54% of new deployments and grow at 11.1%. The commercial consequence is that acquirers now specify the operating environment and application controls before they specify hardware capability, and manufacturers without a managed application layer are supplying a component rather than a platform. Manufacturers without a managed application layer supply a component rather than a platform.
Market Impact: Segment grows at 9.6%

Agent Banking Deploys Terminals As Cash Access Points

Across Africa and parts of South Asia, terminals are being deployed in small kiosks and shops that function as cash withdrawal and deposit points rather than as retail payment devices, serving customers with no nearby bank branch. Nigerian growth of 14.8% leads every country covered on that mechanism alone. These deployments favour rugged, low cost, connectivity tolerant devices with long battery life, which is a specification set that mature market product lines do not naturally provide. Mature market product lines do not provide that specification naturally, so adapted devices lose these awards.
Market Impact: Protects the 61% concentration

Market Opportunities and Growth Drivers

Unattended Acceptance Removes Cash Handling Cost

Parking, fuel, vending, transport, and car washing all carry cash collection, counting, and security costs that become indefensible once electronic acceptance is reliable in unattended environments. Unattended and kiosk terminals grow at 9.6%, and the buyer is an operator rather than an acquirer, which means no subsidy applies and the device is purchased on its own merits. Deployment lives run considerably longer than retail terminals, and specification requirements around weather, vandalism, and connectivity are genuinely demanding. Weather, vandalism, and connectivity requirements narrow the credible supplier field considerably. Deployment lives run far longer.
Market Impact: Serves 7.2 million sellers

Certification Keeps The Manufacturer Field Deliberately Narrow

Security approval for payment acceptance hardware takes close to a year, costs more than most new entrants will commit, and must be repeated for every hardware revision rather than granted once to a company. That is why five manufacturers hold 61% of shipment value in a category whose engineering is not especially difficult. The barrier protects incumbents against exactly the consumer electronics entrants who would otherwise have compressed pricing much further than subsidy pressure already has. Engineering difficulty has nothing to do with it. The barrier protects incumbents completely. Pricing would otherwise have compressed further.
Market Impact: Holds prices near USD 96

Market Restraints and Challenges

Acceptance On Phones Erodes The Entry Tier

Roughly 7.2 million sellers already take cards using a phone and no dedicated hardware, and the root cause is that modern handsets contain the contactless reader and the security capability the terminal used to supply exclusively. Commercially this removes the smallest merchants, who were never profitable to serve with subsidised hardware but who justified volume in manufacturing terms. Participants respond by moving upward into smart terminals with application platforms, by targeting unattended deployment where phones cannot go, and by supplying software to the same acquirers. Their departure improves unit economics rather than harming them.
Market Impact: Covers 54% of new shipments

Subsidised Deployment Caps Manufacturer Pricing Permanently

With 68% of terminals deployed below cost, acquirers buy the cheapest device meeting their certification and application requirements, and average selling prices near USD 96 reflect exactly that. The root cause is that the hardware is a customer acquisition expense rather than a product with an end buyer. Commercially this leaves manufacturers competing on unit cost with no route to premium positioning. Participants respond by earning on application platform fees, by pursuing unattended buyers who pay directly, and by extending deployment life to capture service revenue. Premium positioning is simply unavailable.
Market Impact: Drives 14.8% Nigerian growth
3 additional market trends, 4 additional growth drivers, and 2 additional restraints and challenges are covered in the full report. Contact sales@marketmindsadvisory.com to access the complete intelligence.

Segment CAGR and Growth Architecture

Segmentation follows terminal form and deployment context. Six categories cover the market: countertop fixed terminals, portable and handheld terminals, Android smart terminals, unattended and kiosk terminals, mobile card readers, and self-checkout and assisted selling systems. Countertop devices are in genuine decline while application capable terminals take their place. Unattended systems behave unlike everything else here.
pos-terminal-market-market-share-analysis-1790008987980

Android Smart Terminals

Android terminals grow at 11.1%, half again the market rate of 7.4%, and the reason has very little to do with payments. A device running applications becomes the screen a merchant watches all day, which makes it the natural distribution point for lending offers, loyalty schemes, inventory tools, and accounting integration. Whoever controls installation on that screen controls a channel worth more than the hardware ever was. Some 54% of new shipments are application capable, and acquirers now specify the operating environment and application controls before they discuss any hardware specification at all. The hardware conversation happens last, if it happens at all. Payment capability is assumed rather than compared.
CAGR 11.1%

Unattended And Kiosk Terminals

Unattended acceptance grows at 9.6% and is the one segment where somebody actually buys the terminal rather than receiving it. Parking, fuel, vending, transport, and self-service operators purchase directly because cash collection, counting, and security cost more than electronic acceptance does, and no acquirer subsidy applies to any of it. Specification requirements around weather sealing, vandal resistance, temperature range, and unattended connectivity are genuinely demanding, which narrows the credible supplier field considerably. Deployment lives run well beyond the five year retail median, so replacement volumes are lower and each award matters more. Nobody hands these terminals out for nothing. Each award therefore carries real weight. Replacement volumes stay low across the segment.
CAGR 9.6%
Full segment breakdown across 6 segments available in the complete report.

Regional Architecture and Country Demand Map

Regional shares reflect delivered shipment value, which follows merchant acceptance expansion and terminal specification rather than consumer spending levels. Read the table as a map of where card acceptance is still expanding rather than where consumers spend most. Two shares fall outside the standard bands accordingly.

East Asia

Manufacturing and deployment coincide here, which is why the region leads on shipment value. Chinese manufacturers supply most of the world's terminals while Chinese, Japanese, and Korean merchants deploy them at volumes nobody else approaches, generally at price points well beneath global averages. Android terminal adoption started here and remains furthest advanced, with acquirers running application stores on their deployed estates. Growth of 8.4% runs above the world rate because manufacturing scale, domestic deployment, and platform sophistication reinforce each other in a way that no other region has managed to replicate. Manufacturing scale, domestic deployment, and platform sophistication reinforce each other here in a way no other region has replicated.
Share: 29% | CAGR: 8.4% (2026 to 2036)

North America

Terminal replacement rather than acceptance expansion drives demand, since card acceptance was near universal long before this forecast period began. Integrated point of sale systems combining payments with business software account for an unusually large share of value, and merchants buy those directly rather than receiving them from an acquirer. Growth of 6.2% is moderate, held back by mature acceptance and by tap to phone taking the smallest sellers who were never profitable to serve. Unattended deployment across parking, fuel, and transport is the clearest source of genuinely new demand. Integrated systems combining payments with business software are bought directly by merchants rather than received from acquirers. Unattended deployment supplies the new demand.
Share: 22% | CAGR: 6.2% (2026 to 2036)
Regional intelligence for 5 additional markets available in the complete report: Western Europe, South Asia and Pacific, Latin America, Middle East and Africa, Eastern Europe. Contact sales@marketmindsadvisory.com.
pos-terminal-market-country-cagr-analysis-1790008988500

Where Manufacturers Escape The Subsidy

Four commercial moves separate manufacturers earning properly from those supplying a customer acquisition budget at cost. Each moves revenue away from the terminal itself, which is the part acquirers negotiate hardest and would prefer not to pay for at all. Competing for a subsidy budget on unit price is a losing position that gets worse every year.

Earn On The Application Layer Not The Device

A smart terminal is the screen a merchant watches all day, and distributing lending, loyalty, and business software across it is worth considerably more than the hardware. Manufacturers operating a managed application platform report revenue per deployed terminal 2.7 times higher across a deployment life, most of it recurring. It also changes who they sell to, since an acquirer choosing an application environment is making a five year decision rather than comparing unit prices on a purchase order. Most of that revenue recurs rather than arriving once. Unit price comparison stops mattering.
Market Impact: Lifts revenue per terminal by 2.7 times overall

Pursue Unattended Buyers Who Purchase Directly

Parking, fuel, transport, and vending operators buy terminals with their own money because cash handling costs more, and no acquirer subsidy sits between the manufacturer and the customer. That buyer specifies weather sealing, vandal resistance, and unattended connectivity rather than lowest unit cost, which supports prices 60% to 95% above retail terminal equivalents. Deployment lives run well past the five year retail median, so each award carries more revenue and considerably less replacement competition afterwards. Replacement competition is far less frequent. Nobody subsidises these buyers. Durability rather than price decides the specification.
Market Impact: Supports prices 60% to 95% above retail equivalents

Build Agent Banking Specification Deliberately Instead

Terminals deployed as cash access points in agent kiosks need ruggedness, battery life measured in days, and tolerance of unreliable connectivity, which mature market product lines were never designed to provide. Manufacturers building for that specification win agent network awards at roughly 3.4 times the rate of those adapting retail devices. Nigerian growth of 14.8% leads every country covered on this application alone, and the deployments are large, concentrated with a few network operators, and remarkably sticky once established. Deployments are large and concentrated with a few operators. Awards stay sticky once proven.
Market Impact: Wins 3.4 times more agent network awards overall

Extend Certified Hardware Revisions Across Longer Lives

Security approval must be repeated for every hardware revision at substantial cost and close to a year of elapsed time, which makes each certified design an asset to be amortised rather than replaced eagerly. Manufacturers designing for longer certified life and shipping capability through software report certification cost per unit falling 35% to 50%. It also aligns with acquirers, who resent replacing deployed estates and will specify a device that will still be supported in year six. Acquirers resent replacing deployed estates. They specify devices still supported in year six.
Market Impact: Cuts certification cost per unit 35% to 50%

Who Controls the Margin Pool

Concentration is high and certification keeps it that way. Five manufacturers hold 61% of shipment value, measured consistently on that basis across all participants, and the barrier is security approval taking close to a year per hardware revision rather than any engineering difficulty. The gap between the leader and the fifth is moderate, and Chinese manufacturers have taken share steadily on delivered cost while European incumbents defended on certification breadth and acquirer relationships. Approval must be repeated for every hardware revision rather than granted once.
Competition currently turns on three things: application platform capability that acquirers can control, specification depth for unattended and agent deployment, and delivered cost against a subsidy budget. Payment functionality differentiates almost nothing, since every certified device processes transactions identically by design and by regulation. Regulation guarantees the transaction behaves identically everywhere.

Pressure comes from two directions. Tap to phone acceptance removes the smallest merchants from hardware deployment entirely. Meanwhile integrated point of sale providers combining payments with business software reach merchants directly rather than through acquirers. Rankings will shift toward manufacturers earning on the application layer, since hardware pricing has nowhere left to go. Hardware pricing has nowhere further to fall.
pos-terminal-market-company-positioning-matrix-1790008989023

Competitive Moat and Risk Dimensions

PAX TECHNOLOGY

Moat: Cost Position And Certification Breadth

Manufacturing scale combined with an unusually wide portfolio of certified hardware revisions across many markets lets acquirers standardise on one supplier globally while meeting local approval requirements. In a category where 68% of devices are deployed below cost, being cheapest at an acceptable certified specification is an exceptionally strong position to hold.
PAX TECHNOLOGY

Risk: Procurement Scrutiny In Western Markets

Payment acceptance hardware sits inside financial infrastructure, and several Western acquirers and regulators have raised questions about supply origin that have nothing to do with product capability. That exposure concentrates in exactly the markets with the highest terminal specifications and the most attractive application platform economics attached.
INGENICO

Moat: Acquirer Relationships And Platform Control

Long-established relationships with European and North American acquirers, combined with a managed application platform those acquirers use to control what merchants install, produce revenue that continues across a deployment rather than ending at shipment. That platform position is difficult for cost-led competitors to replicate without the same acquirer trust.
INGENICO

Risk: Hardware Cost Gap Persists

Against manufacturers with domestic component supply and far larger production runs, the hardware cost gap cannot be closed through efficiency alone, and acquirers deploying below cost feel every dollar of it. Defending position depends on the application platform continuing to justify a premium that pure hardware comparison never would.

Players Tracked

Prominent Players

PAX Technology
Ingenico
Verifone
Newland Payment Technology
NEXGO

Other Key Players

Castles Technology
BBPOS
SZZT Electronics
Centerm
Urovo
Sunmi
Block
Toast
Lightspeed
NCR Voyix
Diebold Nixdorf
Fujitsu
Posiflex
Elo Touch Solutions
Worldline

Recent Developments

FEBRUARY 2026

PAX Technology Awarded Terminal Deployment Contract By Brazilian Acquirer

PAX Technology was selected to supply Android smart terminals across a Brazilian acquirer's merchant estate, with the award specifying application platform controls and remote management capability alongside delivered cost per unit at deployment scale. Remote management covers the whole merchant estate under one arrangement. Deployment runs across three years.
Signal: Acquirers now specify the application environment and its controls before discussing any hardware capability at all.
SEPTEMBER 2025

Sunmi Signs Supply Agreement With Nigerian Agent Banking Network

Sunmi entered a supply agreement covering rugged terminals for a Nigerian agent banking network, specified for multi-day battery life and tolerance of intermittent connectivity rather than for the features retail merchant deployment normally requires. Volumes run into the hundreds of thousands across the agreement term.
Signal: Agent banking specification differs enough that adapted retail devices lose these particular awards almost every time.
MAY 2025

Castles Technology Acquires Unattended Payment Terminal Specialist

Castles Technology completed an acquisition of an unattended terminal manufacturer, adding weather sealed and vandal resistant designs aimed at parking, fuel, and transport operators who purchase directly rather than receiving subsidised hardware. Certification for the acquired designs transfers with the transaction. Existing operator relationships transfer alongside the designs.
Signal: Manufacturers are now buying into the one segment where a customer genuinely pays for the terminal.

What Building A Terminal Costs

Three inputs dominate manufacturing cost. Processors, secure elements, and memory run 34% to 42% of cost of goods sold. Displays, keypads, enclosures, and mechanical assembly take 18% to 24%. Security certification, testing, and approval maintenance add a further 10% to 15%, which is unusually high for a device selling near USD 96 and is repeated for every hardware revision rather than amortised across a product family.
Memory pricing rose sharply through 2024 and 2025 as demand from artificial intelligence infrastructure absorbed supply, and several manufacturers described the resulting margin pressure in their annual reports for those years. Acquirers deploying subsidised hardware resisted price increases almost entirely, so manufacturers absorbed the movement or reduced specification, and most did a measure of both across their ranges. Certification cost never moved at all. Ranges thinned accordingly.

The competitive disadvantage mechanism runs through certification rather than through components. Each hardware revision requires fresh approval costing money and close to a year, so a manufacturer refreshing designs frequently carries a burden that a longer-lived platform avoids. Exposure varies by manufacturer type. Volume producers amortise certification across enormous shipments. Specialists serving unattended or agent segments carry comparable approval cost against far smaller runs.
pos-terminal-market-cost-volatility-analysis-1790008989218

Design Certified Platforms For Longer Product Lives

Approval must be repeated for every hardware revision at substantial cost and close to a year of elapsed time, which makes frequent redesign expensive in a way that consumer electronics practice does not prepare manufacturers for. Designing for a longer certified life and shipping new capability through software spreads that cost across far more units.

Share Component Platforms Across Terminal Families

Countertop, portable, and smart terminals differ mainly in enclosure and connectivity while sharing processing and security requirements almost entirely. A common component platform across families concentrates purchasing volume on the dominant cost line and simplifies certification evidence reuse between related hardware revisions considerably. Purchasing volume concentrates where it matters, and certification evidence transfers between related revisions cheaply.

Recover Margin Through Application Platform Fees

Against a delivered price near USD 96 with components taking most of it, hardware margin has very little room to improve regardless of manufacturing efficiency. Application platform and management fees carry no component cost, recur across a deployment life, and are negotiated with acquirers who value the control they provide rather than resenting the expense.

Portfolio Architecture for Margin Defence

Margin follows whether somebody pays for the device and what runs on it afterwards. Countertop and portable terminals deployed at acquirer subsidy are close to commodity, with components consuming most of a price near USD 96. Smart terminals earn better where an application platform accompanies them. Unattended systems and application platform fees earn most, the first because the customer buys directly and the second because no component cost applies.
The tension between volume and premium is severe. Subsidised retail deployment carries most units and the worst economics, and chasing that volume against vertically integrated Chinese manufacturers destroys margin without building anything. Unattended and platform revenue carry far better economics on volumes too small to sustain a large manufacturing footprint alone, which is the difficulty every participant in this category faces.

High-value pools concentrate where the buyer is not an acquirer minimising subsidy cost: unattended operators purchasing on their own budget, agent banking networks with specification requirements retail devices cannot meet, and application platform arrangements that recur across deployment lives. These share a customer with a reason to pay. Elsewhere, the terminal is a marketing expense and priced accordingly every year.

Volume / Commodity-Adjacent

Countertop, portable, and mobile reader hardware deployed below cost by acquirers buying the cheapest certified device available. Components consume most of a price near USD 96. The nine-point range reflects whether the manufacturer sources components domestically or at merchant market prices.
Gross Margin: 14% to 23%

Premium / Certified

Android smart terminals and agent banking specified devices where application capability or ruggedness influences selection alongside price. The ten-point range separates manufacturers sharing certified platforms across families from those certifying each hardware revision separately at full cost.
Gross Margin: 28% to 38%

Sustainability / Regulatory / Next-Generation

Unattended and kiosk systems purchased directly by operators, plus application platform and management fees recurring across deployment lives. Neither is subsidised and neither carries component cost at full rate. The fourteen-point range reflects how differently manufacturers price platform access to acquirers.
Gross Margin: 48% to 62%
pos-terminal-market-portfolio-architecture-1790008989715

High-value Sub-segments and Strategic Watch-out

Application Platform And Management Fees

Highest value in the category, recurring across a five year deployment life with no component cost attached at all. Acquirers pay for control over what merchants install. The twelve-point range reflects wide variation in how manufacturers price platform access across different acquirer relationships. Nothing recurs like it.
Gross Margin: 56% to 68%

Unattended And Kiosk Systems

Growing at 9.6% and the one segment where the customer buys the terminal with their own money because cash handling costs more. Specification demands narrow the supplier field considerably. Deployment lives run well past the five year retail median, so each award matters. No subsidy applies here.
Gross Margin: 42% to 54%

Agent Banking Terminal Supply

Fast growing on Nigerian and wider African deployment, requiring multi-day battery life and connectivity tolerance that adapted retail devices cannot deliver. Awards concentrate with a few network operators and prove remarkably sticky once a specification has been established and proven. Specification decides these awards outright.
Gross Margin: 30% to 40%

Subsidised Retail Terminal Supply

The strategic watch-out. Acquirers buy the cheapest certified device, tap to phone is removing the smallest merchants, and vertically integrated manufacturers hold the cost position. The nine-point range reflects component sourcing differences that change nothing about the underlying commercial trajectory. Volume without margin attached. Cost position decides it.
Gross Margin: 12% to 21%

How Deployments Generate Returns

Hardware revenue arrives at deployment and then stops for about five years, which makes it lumpy and fiercely competitive at every refresh. What recurs is application platform and management fees across the installed estate, and those grow with deployment rather than resetting at each replacement. Manufacturers who captured the platform hold revenue continuously; those who shipped hardware alone have nothing between refreshes. Platform revenue accumulates with the estate rather than resetting.
Commitment depth varies sharply by who paid. Unattended operators embed deeply, because devices are integrated into parking, fuel, or transport systems and replacement means revalidating an installation. Agent banking networks are similarly durable once a specification is proven across thousands of kiosks. Acquirer subsidised retail estates are the least committed, retendered at each refresh with delivered cost the dominant criterion. Delivered cost dominates every retail retender.

The decision maker has moved away from hardware entirely. Terminal specification teams once selected devices on payment capability and still participate. Acquirer product and merchant services functions now decide, weighing application platform control, remote management, and merchant retention rather than device features. Manufacturers presenting hardware specifications are addressing people who no longer make the choice.
pos-terminal-market-end-use-penetration-index-1790008990202

Where This Market Rewards

These are among the four positions where our research anticipates prominent divergence between winners and laggards over the coming forecast period. Each is grounded in the demand model, the regulatory perimeter, and the announced capacity pipeline.
01 / APPLICATION LAYER CAPTURE

The screen is worth more than the terminal

A smart terminal is what a merchant looks at all day, which makes it the natural distribution point for lending offers, loyalty programmes, and business software, and 54% of new shipments are now application capable. Manufacturers operating a managed platform earn 2.7 times more per deployed terminal across its life, most of it recurring rather than arriving once at shipment. Acquirers choosing an application environment are making a five year commitment rather than comparing unit prices, which changes what they are actually buying.
02 / DIRECT PURCHASE SEGMENTS

Find the buyers who pay their own money

Some 68% of terminals are deployed below cost by acquirers treating hardware as a customer acquisition expense, which caps pricing permanently and leaves manufacturers competing against a budget that would rather spend nothing at all. Unattended operators in parking, fuel, and transport buy directly, because cash collection and security cost them more than electronic acceptance does. They specify durability rather than lowest cost, supporting prices 60% to 95% above retail equivalents across much longer deployment lives, which is a materially better business.
03 / PURPOSE BUILT SPECIFICATION

Agent banking is not retail with a battery

Terminals deployed as cash access points in African and South Asian agent kiosks need multi-day battery life, ruggedness, and tolerance of unreliable connectivity that mature market product lines were never designed to deliver. Manufacturers building deliberately for that specification win agent network awards roughly 3.4 times more often than those adapting retail devices. Nigerian growth of 14.8% leads every country covered on this application alone, and the deployments prove remarkably sticky, which makes them worth pursuing properly rather than opportunistically.
04 / CERTIFICATION ASSET MANAGEMENT

Every hardware revision costs a year of approval

Security approval must be repeated for each hardware revision at substantial cost and close to a year of elapsed time, which makes frequent redesign expensive in a way consumer electronics practice does not prepare anybody for. Manufacturers designing longer certified lives and shipping capability through software cut certification cost per unit by 35% to 50%. It also suits acquirers, who resent replacing estates and specify devices still supported in year six, which is a specification requirement rather than a preference.

Engagement Snapshot From the Field

A live engagement with an industry participant carrying material or product regulatory and market exposure ahead of a defining policy shift, showing how our research translates into a defensible multi-year portfolio strategy.
MARKET MINDS ADVISORY · CLIENT ENGAGEMENT SUMMARY
POS Terminal Producer Strategic Portfolio Review and Transition Roadmap 2026·Investment Scenario on POS Terminal Exposure Evaluation 2025-26
CLIENT PROFILE
A regional payment acquirer serving approximately 340,000 merchants across four markets, deploying around 95,000 terminals annually at an equipment cost above USD 41 million (client-reported, unverified by MMA). Devices came from three manufacturers on separate contracts, and the estate ran four operating environments with no common application management across any of them. Procurement had run on unit cost for a decade.
STRATEGIC CHALLENGE
Merchant attrition among small sellers had accelerated as tap to phone acceptance became available, and the acquirer could not distribute value added services across its estate because the four operating environments shared nothing. Equipment procurement had been managed purely on unit cost for a decade with no view of what the estate could support afterwards.
MMA APPROACH
MMA modelled merchant retention against terminal type and application availability across the existing estate, assessed what a consolidated application platform would allow the acquirer to distribute, and evaluated manufacturers on platform capability and certification roadmap rather than on delivered unit price alone. Retention was measured across comparable merchant segments. Certification roadmaps were reviewed alongside.
KEY FINDINGS
  1. Merchants with access to at least one value added application through the terminal churned at 41% the rate of those with payment functionality alone across comparable segments.
  2. The four operating environments made it impossible to distribute anything consistently, and each application integration had been quoted separately by every manufacturer involved.
  3. Small merchants lost to tap to phone acceptance had generated 6% of processing revenue and 19% of terminal deployment cost, so their departure improved unit economics.
  4. Only two of five candidate manufacturers offered a managed application platform the acquirer could control rather than one the manufacturer would control on its behalf.
CLIENT PROFILE
A regional payment acquirer serving approximately 340,000 merchants across four markets, deploying around 95,000 terminals annually at an equipment cost above USD 41 million (client-reported, unverified by MMA). Devices came from three manufacturers on separate contracts, and the estate ran four operating environments with no common application management across any of them. Procurement had run on unit cost for a decade.
STRATEGIC CHALLENGE
Merchant attrition among small sellers had accelerated as tap to phone acceptance became available, and the acquirer could not distribute value added services across its estate because the four operating environments shared nothing. Equipment procurement had been managed purely on unit cost for a decade with no view of what the estate could support afterwards.
MMA APPROACH
MMA modelled merchant retention against terminal type and application availability across the existing estate, assessed what a consolidated application platform would allow the acquirer to distribute, and evaluated manufacturers on platform capability and certification roadmap rather than on delivered unit price alone. Retention was measured across comparable merchant segments. Certification roadmaps were reviewed alongside.
KEY FINDINGS
  1. Merchants with access to at least one value added application through the terminal churned at 41% the rate of those with payment functionality alone across comparable segments.
  2. The four operating environments made it impossible to distribute anything consistently, and each application integration had been quoted separately by every manufacturer involved.
  3. Small merchants lost to tap to phone acceptance had generated 6% of processing revenue and 19% of terminal deployment cost, so their departure improved unit economics.
  4. Only two of five candidate manufacturers offered a managed application platform the acquirer could control rather than one the manufacturer would control on its behalf.
RECOMMENDED STRATEGY
Phase 1: Phase one: consolidate new deployment onto a single application capable platform, accepting a higher unit price in exchange for distribution capability across the whole estate. Phase 2: Phase two: stop deploying subsidised hardware to the smallest merchants and move them to tap to phone acceptance, which improves unit economics rather than harming them. Phase 3: Phase three: build a value added application catalogue for the consolidated estate, using the retention difference the analysis established as the internal business case.
OUTCOME
Terminal equipment spending fell 22% despite a higher unit price, because deployment to the smallest merchants stopped entirely (client-reported, unverified by MMA). Merchant attrition among the retained base improved within three quarters. Two value added applications reached a third of the estate in the first year of the catalogue.

Frequently Asked Questions

Foundational context covering the market sizes, CAGR, scope, country, region and competition that inform every finding below. This section is provided to cover basics and most often pre-purchase conversations, answered from the MMA Primary Research Dataset.

What is the current size of the POS Terminal Market?

The market was worth USD 26.8 billion in 2025 and reaches USD 28.8 billion in 2026. Value covers delivered manufacturer shipments of payment acceptance hardware.

How large will the POS Terminal Market be by 2036?

MMA forecasts USD 58.8 billion by 2036, an increase of USD 30.0 billion across the forecast period. That represents 2.04 times the 2026 base of USD 28.8 billion.

What is the CAGR for the POS Terminal Market 2026 to 2036?

The base case compound annual growth rate is 7.4%, with a bull case at 8.6% and a bear case at 6.2%. Historical growth from 2020 to 2025 ran at 6.3%.

Which segment is growing fastest?

Android smart terminals grow at 11.1%, half again the market rate of 7.4%. They turn the device into a distribution surface for merchant software and lending.

Who are the major companies in the POS Terminal Market?

PAX Technology, Ingenico, Verifone, Newland Payment Technology, and NEXGO lead the field, holding 61% of shipment value between them. Security certification keeps that field narrow deliberately.

Which country is growing fastest?

Nigeria grows at 14.8%, on agent banking networks deploying terminals as cash withdrawal and deposit points rather than as conventional retail payment devices at all.

Report Segmentation Architecture

The full report scope spans multiple orthogonal segmentation dimensions, with cross-tabulated demand data provided for each dimension pair. Coverage extends further to regional breakdowns, trend trajectories, and the competitive detail needed to support segment-level decision-making.

By Terminal Type

  • Countertop Fixed Terminals
  • Portable and Handheld Terminals
  • Android Smart Terminals
  • Unattended and Kiosk Terminals
  • Mobile Card Readers
  • Self-Checkout and Assisted Selling Systems

By End-Use Industry

  • Retail and Grocery
  • Restaurants and Hospitality
  • Fuel, Parking and Transport
  • Agent Banking and Financial Access
  • Healthcare and Public Services
  • Entertainment, Leisure and Events

By Commercial Dimension

  • Acquirer Subsidised Deployment
  • Direct Merchant Purchase
  • Independent Sales Organisation Channel
  • Unattended Operator Procurement
  • Agent Network Bulk Supply
  • Application Platform Licensing

By Region

  • East Asia
  • North America
  • Western Europe
  • South Asia and Pacific
  • Latin America
  • Middle East and Africa
  • Eastern Europe

Scope, Methodology, and Coverage

Every figure in this report is reproducible from documented input assumptions. The scope below maps the historical period, the forecast horizon, the segmentation dimensions, and the countries covered, alongside the underlying primary and qualitative methodology.
Historical Period
2020 to 2025
Forecast Period
2026 to 2036
Base Year
2025 (USD billions; MMA Primary Research Dataset, September 2026)
Market Definition
This market covers payment acceptance terminals and associated hardware, including countertop fixed terminals, portable and handheld terminals, Android smart terminals, unattended and kiosk terminals, mobile card readers, and self-checkout and assisted selling systems. It excludes payment processing and acquiring services, merchant software subscriptions sold separately, cash handling equipment, general purpose tablets used without certified payment hardware, and card issuance systems.
Quantitative Units
USD billions, delivered manufacturer shipment value
Segmentation Dimensions
Terminal type, end-use industry, commercial dimension, region
Regions Covered
East Asia, North America, Western Europe, South Asia and Pacific, Latin America, Middle East and Africa, Eastern Europe
Countries Covered
China, Japan, South Korea, Taiwan, United States, Canada, Mexico, United Kingdom, Germany, France, Italy, Spain, Netherlands, India, Indonesia, Vietnam, Philippines, Australia, Brazil, Colombia, Chile, Argentina, Nigeria, Kenya, Ghana, Egypt, Saudi Arabia, United Arab Emirates, Poland, Romania
Key Companies Profiled
PAX Technology, Ingenico, Verifone, Newland Payment Technology, NEXGO, Castles Technology, BBPOS, SZZT Electronics, Centerm, Urovo, Sunmi, Block, Toast, Lightspeed, NCR Voyix, Diebold Nixdorf, Fujitsu, Posiflex, Elo Touch Solutions, Worldline
Quantitative Methodology
Primary survey, n=3,800 respondents, Q4 2025, six countries; demand-side model with trade association cross-validation
Qualitative Methodology
47 expert interviews, Q4 2025; applied to validate demand model assumptions, identify emerging dynamics, and assess competitive positioning
Report Format
PDF and XLSX data workbook (Word format preview document)
Publisher
Market Minds Advisory
Report Code
MMA-2026-TEC-601
Published
September 2026
Contact
sales@marketmindsadvisory.com | www.marketmindsadvisory.com

Purchase the full POS Terminal Market Report (2026 to 2036).

The full report sizes the payment terminal market across six device types, seven regions, and thirty countries, with forecasts to 2036 under base, bull, and bear cases. It examines why most terminals are deployed below cost, what the application layer changed about where value sits, and how tap to phone acceptance is removing the entry tier. Competitive analysis covers twenty participants evaluated consistently on shipment value, with detailed treatment of certification as a competitive barrier and agent banking as a distinct specification. Cost structure, margin architecture by device type, and regional deployment drivers are analysed in full. Primary research includes 3,800 survey responses and 47 expert interviews.
Six terminal types sized and forecast separately
Twenty participants evaluated on delivered shipment value
Regional deployment and acceptance drivers across seven geographies
Margin architecture by terminal type and revenue source
Certification barrier analysis with approval timeline evidence
Application platform economics across deployment lifetimes

Built For The People Who Decide

From boardroom strategy to bench-side execution, this report is read cover-to-cover by leaders shaping the next decade of their industry, turning demand scenarios, market dynamics and valuation benchmarks into decisions.
CXOs/ Presidents/ VPs/ Managers
M&A and Corporate Development
Strategy Teams and R&D Heads
Procurement and Product Directors
Regulatory and Compliance Leaders
Investor Relations and Equity Analysts