Market Minds Advisory
Portable Toilet Rental Market

Portable Toilet Rental Market: Portable Toilet Rental Market: Route Density Economics, Servicing Frequency Mismatch and A User Who Never Chooses, 2026 to 2036

Nobody in this business actually has a sanitation problem. They have a routing problem, and the operators who worked that out years ago have been quietly buying the ones who did not.

Lead Analyst

Published

September 2026

Make Smarter Decisions with Customized Research Insights

Request a free sample report and evaluate market opportunities, growth trends, and competitive dynamics relevant to your business needs.

2025 MARKET VALUE$3.8BMarket Size 2025
2036 FORECAST VALUE$7.0BBase Case , 2026 to 2036
CAGR 2026 TO 20365.8 %Bull 7.0% / Bear 4.6%
INCREMENTAL OPPORTUNITY$3.0BNet 10- year value creation
EXPANSION MULTIPLE1.75x2036 value over 2026 base
Strategic Levers
M&A Pipeline
Regional Outlook
Country Rankings
Competitive Intelligence
Segmental Deep-dive
Call-Us : 91 93563 13602

Executive Snapshot and Market Trajectory.

Route density decides everything here. A servicing stop 3.4 kilometres from the last one is profitable and one twenty kilometres away is not, and nothing about the unit itself changes that arithmetic in either direction. The whole commercial question sits in a routing algorithm.
Restroom trailers and luxury units grow at 8.7%, half again the market rate of 5.8%, because events will pay for an experience that a standard unit cannot deliver at any price. Accessible and compliant units follow at 7.4%, driven by provision requirements rather than by anybody choosing them. Standard single units grow at barely a third of the trailer rate. Both are taking revenue standard cubicles never reached.
Servicing frequency is where the reputation problem lives. Contracts specify weekly attendance whether a site carries eight workers or eighty, and about 6% of rented units can report their own condition. Undersized servicing produces the reputation this industry has carried for decades, and oversized servicing quietly consumes the margin instead. Sensors cost a fraction of one wasted truck visit and almost nobody fits them, which is the clearest available improvement anywhere in this business today.
Market Definition
This market covers the rental and servicing of portable sanitation units, including standard single portable units, restroom trailers and luxury units, accessible and compliant units, handwash and hygiene stations, deluxe flushing and solar units, and urinal banks and high capacity units. Delivery, servicing, and waste removal are counted within the unit rented. It excludes consumer purchased camping and caravan toilets, permanent modular washroom buildings, unit manufacture and outright sale, and standalone vacuum tanker haulage.
Base Year Value
$3.8B in 2025 (MMA Primary Research Dataset, September 2026)
Forecast Period
2026 to 2036, eleven discrete annual values
CAGR
5.8% base case. Bull 7.0%. Bear 4.6%.
Fastest Growth Segment
Restroom Trailers And Luxury Units: 8.7% CAGR
Fastest Growth Country
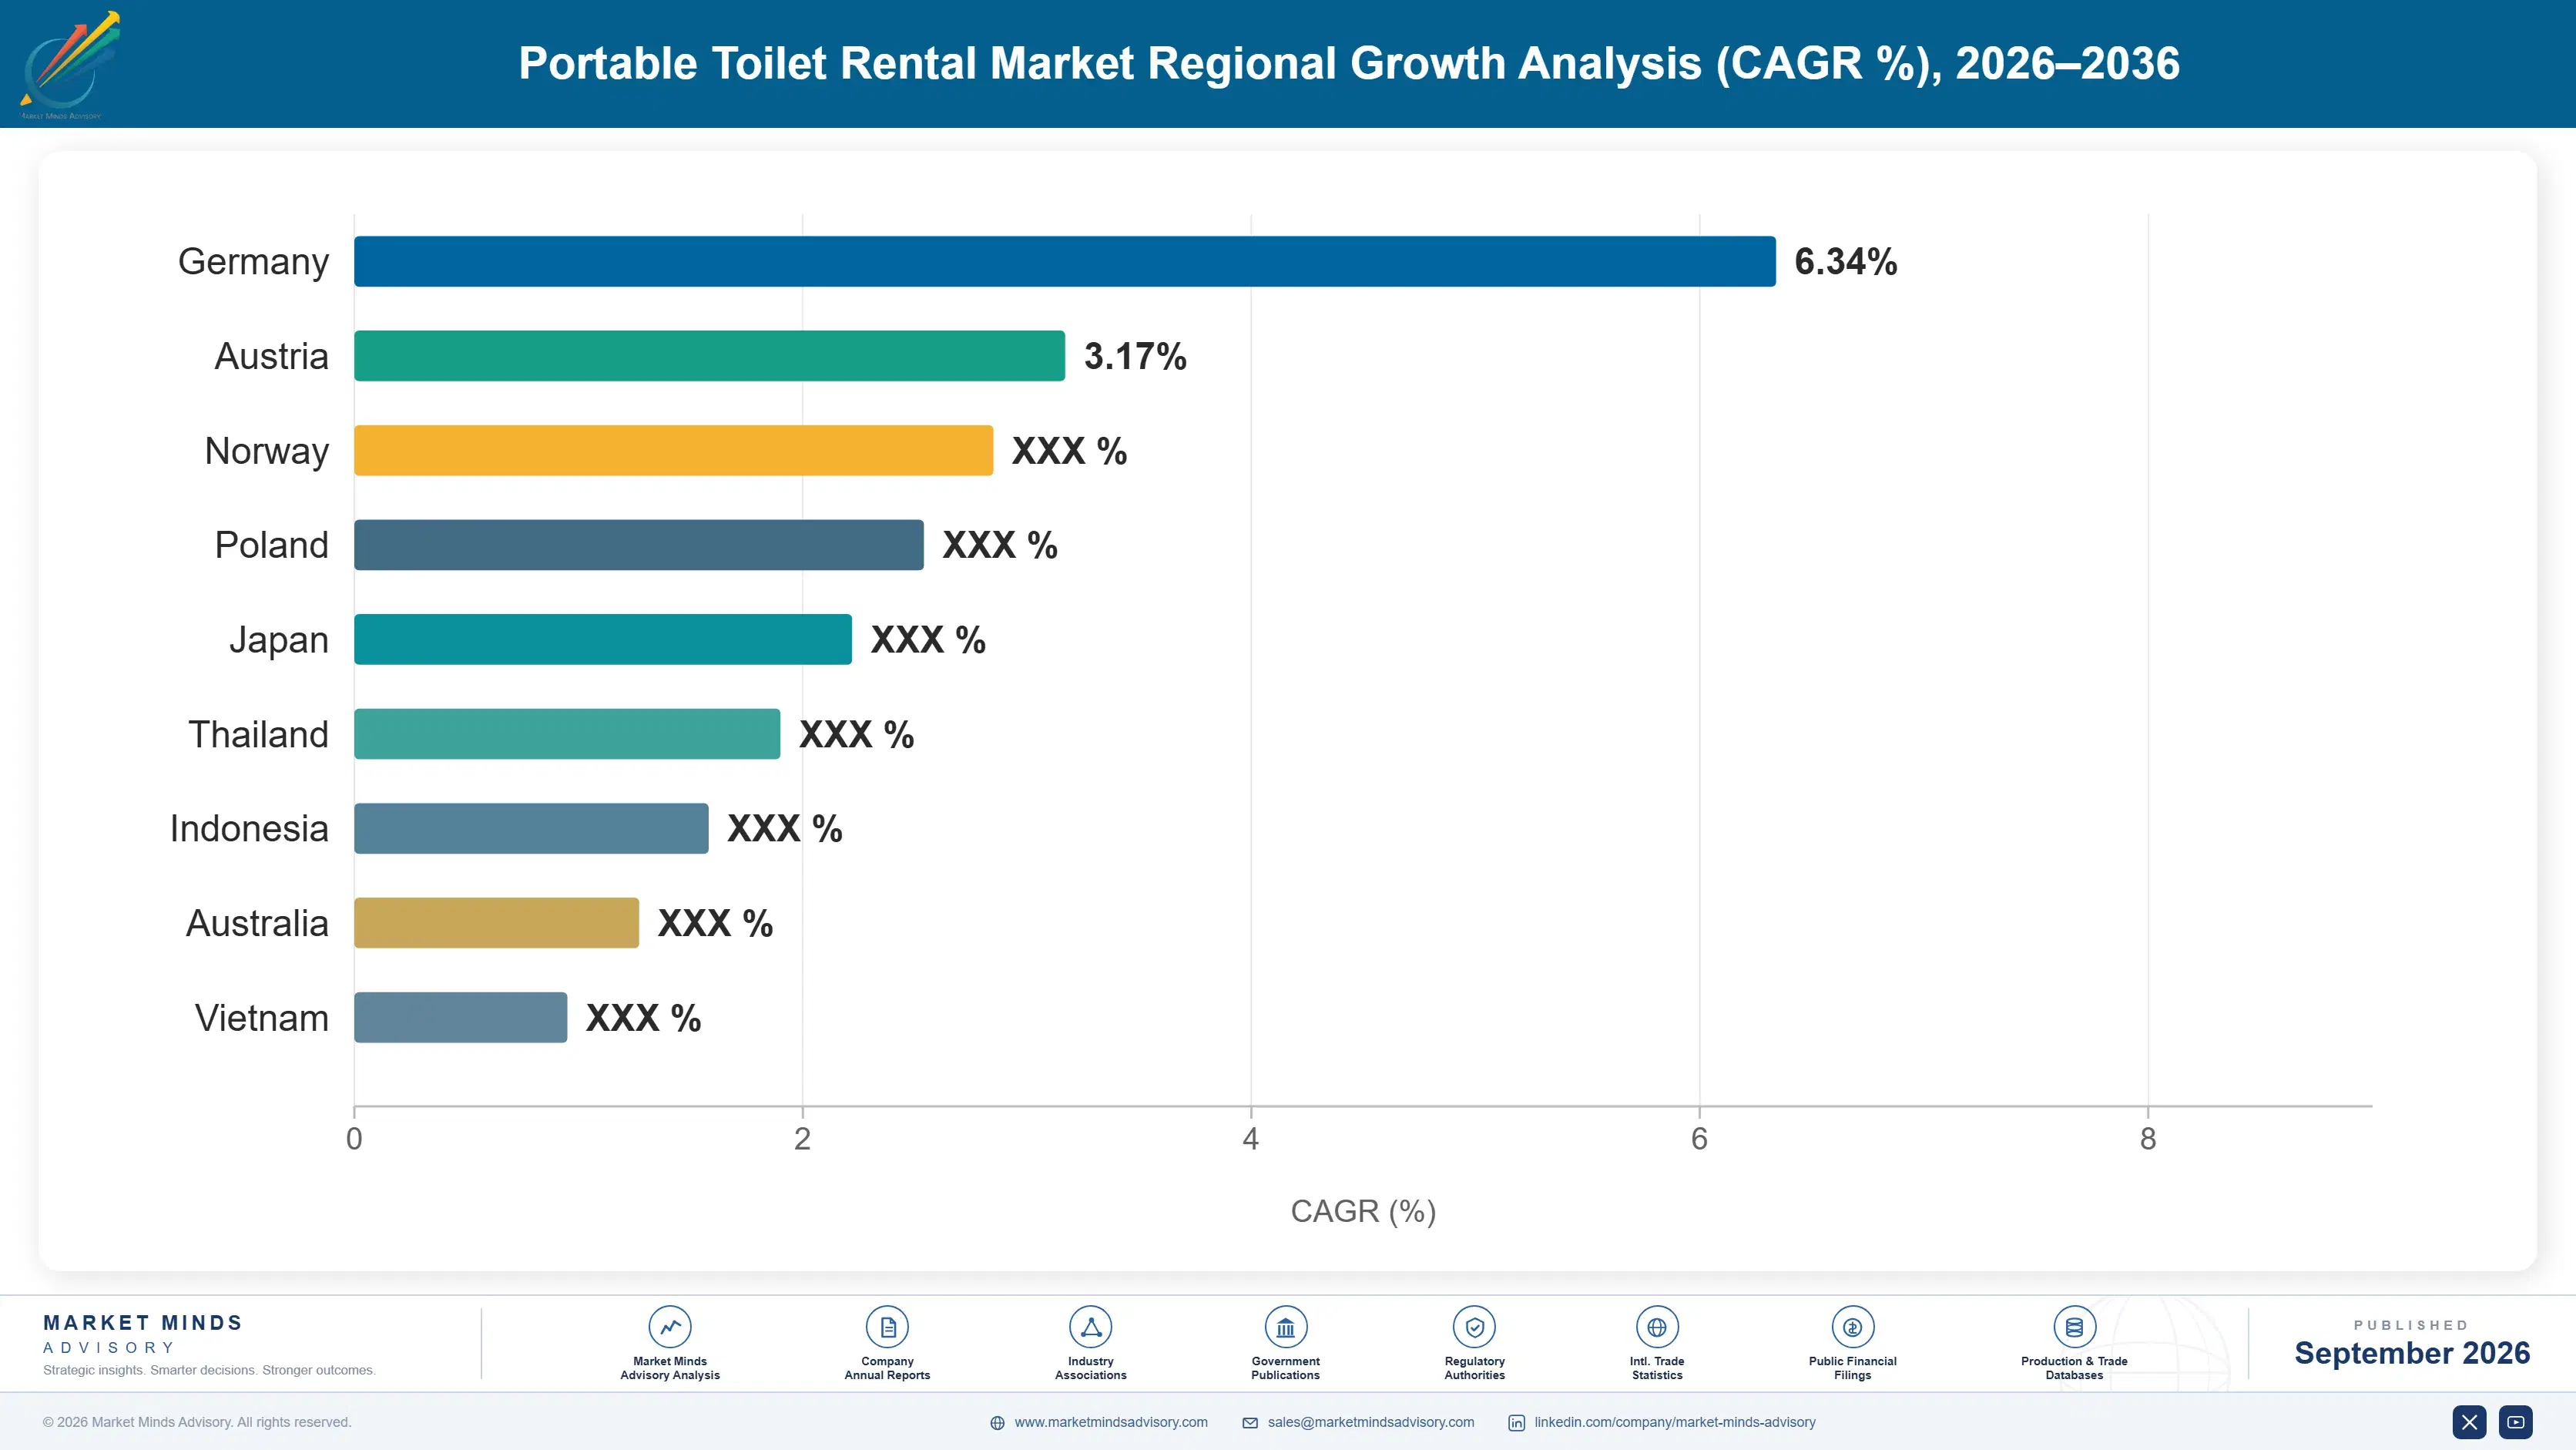
Saudi Arabia: 11.4% CAGR
Fastest Growth Region
South Asia and Pacific: 7.8% CAGR
Largest Region
North America: 32% of 2025 global value
Market Leaders
United Site Services, Boels Rental, Loxam Group, National Construction Rentals, and Algeco lead the field. Source: MMA Primary Research Dataset, July 2026.
Primary Survey
n=3,800 procurement and R&D decision-makers, Q4 2025, six countries
Methodology
Demand-side build-up, cross-validated against public data, 47 expert interviews

Portable Toilet Rental Market Forecast Scenarios

portable-toilet-rental-market-size-forecast-scenario-1790014461652
Between 2020 and 2025 the category grew at 4.7% through violent swings in both end markets. Events collapsed entirely and returned, construction paused and restarted on stimulus programmes, and consolidation accelerated throughout as operators with route density bought those without it. The businesses that survived the event collapse were generally those with construction fleets carrying them through it.
The base case at 5.8% rests on three mechanisms. Construction provision requirements are written into workplace regulation across major markets, which makes that demand legally specified rather than discretionary. Gulf giga-project construction generates concentrated site demand at a scale no other region approaches. And restroom trailers keep taking event revenue that standard units were never able to capture at any service level. None of the three requires rental rates per unit to rise at all.
The bull case at 7.0% depends on sensor fitment reaching scale, since matching servicing to actual use would raise margin and reputation together rather than trading one against the other. The bear case at 4.6% is construction cycles: this demand follows site starts almost exactly, and a downturn in commercial building removes units from hire faster than any event growth replaces them.

A Routing Business In Disguise

The unit costs a few hundred dollars and lasts a decade. The truck, the driver, and the distance between stops cost far more than that every week. An operator servicing units 3.4 kilometres apart runs a profitable round and one covering twenty kilometres between stops does not, regardless of what it charges. Everything commercially interesting in this business happens in a routing algorithm rather than in a plastic cubicle.
TOP FIVE CONCENTRATION29%Share of category revenue held by the leading operators
ROUTE DENSITY PER STOP3.4 kmAverage distance between servicing stops on a profitable round
FILL SENSOR PENETRATION6%Rented units able to report their own servicing need
CONTRACT SERVICE FREQUENCY7 daysInterval specified regardless of how many people use it
UNIT UTILISATION RATE71%Fleet on hire rather than standing in an operator yard
REVENUE PER UNIT MONTHLYUSD 118Average rental and servicing billed against a single unit
That explains the consolidation pattern precisely. Buying a competitor in a territory you already serve adds stops to existing rounds and costs almost nothing to absorb; buying one in an adjacent region adds a whole route structure. Operators who understood this bought geographically and now hold density that no entrant can assemble, since the acquisitions that would build it have already happened.
Servicing frequency is the part nobody has fixed. Contracts specify weekly attendance whether a site has eight workers or eighty, and roughly 6% of units can report their own fill level. Under-serviced units produce the reputation this whole industry carries, and over-serviced units burn the route capacity that determines margin. Sensors cost very little and almost nobody fits them.
"You are not renting a toilet. You are selling a truck visit, and the toilet is how you bill for it. Once an operator understands that, the acquisition strategy writes itself and the servicing schedule stops being a contract term and becomes an operating variable."
Practice Director, Site Services and Equipment Rental · MMA Construction and Industrial Equipment Practice · September 2026

Market Trends

Consolidation Follows Route Density Rather Than Revenue

Acquisitions in this market succeed or fail on geographic overlap rather than on the revenue acquired. A competitor whose units sit within existing rounds adds stops at almost no marginal cost, while one in an adjacent territory brings a whole route structure and the vehicles and depot to run it. Operators who understood the distinction bought accordingly and now hold density that late entrants cannot assemble, because the useful acquisitions have already been completed. That is why national revenue share tells you very little about this market. A small dense operator routinely beats a large dispersed one.
Market Impact: Requires 1 unit per 10 workers
Restroom Trailers Capture Revenue Standard Units Cannot

Restroom trailers and luxury units grow at 8.7%, the fastest rate here, because weddings, corporate events, and film production will pay for flushing fixtures, running water, and climate control that a standard cubicle cannot provide at any service frequency. The capital per unit is many times higher and utilisation is seasonal rather than continuous, which makes the economics genuinely different from construction hire and rewards operators running both fleets against each other. Operators without construction volume to cover the off-season find the capital intensity difficult to justify, which is why the segment concentrates among larger businesses running both fleets.
Market Impact: Country grows at 11.4%

Market Opportunities and Growth Drivers

Workplace Regulation Makes Construction Demand Non-Discretionary

Provision ratios for construction sites are written into workplace safety regulation across major markets, specifying units per worker and requiring handwashing facilities alongside them. That converts sanitation from a site manager's judgement into a compliance obligation with inspection consequences. Demand therefore follows site starts and headcount rather than budget decisions, which makes the construction half of this market considerably more predictable than the event half will ever be. Provision ratios typically require one unit per ten workers with handwashing alongside, which ties fleet demand directly to site headcount rather than to any budget conversation.
Market Impact: Only 6% carry sensors

Gulf Giga-Project Construction Concentrates Site Demand

Saudi Arabian growth of 11.4% leads every country covered, driven by giga-project construction employing site populations at a scale no other region approaches and by worker welfare requirements now being enforced rather than merely stated. Single project sites there require unit counts that a mid-sized Western operator would consider an entire regional fleet. Route density is exceptional on those sites, which makes the servicing economics unusually favourable for whoever holds the contract. Contract durations on those projects run for years rather than months, which makes them among the most valuable single relationships available anywhere in this industry.
Market Impact: Separates 100% of users

Market Restraints and Challenges

Servicing Frequency Ignores Actual Unit Usage

Contracts specify weekly attendance regardless of whether a site carries eight workers or eighty, and the root cause is that no operator has visibility of unit condition between visits. Commercially it produces under-serviced units that damage reputation and over-serviced units that consume route capacity for nothing. Operators respond with fill sensors, with usage-based contract structures, and with site headcount surveys, though roughly 6% of units currently carry any monitoring at all. The hardware is inexpensive and the obstacle is that nobody has priced contracts to reward it. Contract structures reward nobody for fixing it.
Market Impact: Density decides at 3.4 km

The User Never Chooses And Cannot Complain

A construction worker or event guest uses a unit specified by somebody else entirely, and the root cause is that the buyer and the user are different people with no channel between them. Commercially it means quality has almost no feedback loop, so poor servicing persists until a contract renewal rather than being corrected. Operators respond with site feedback systems, with scannable reporting codes on units, and with service level guarantees written into contracts. None of that changes the underlying separation, which is that the person experiencing the service has no commercial relationship with anybody providing it.
Market Impact: Segment grows at 8.7%
4 additional market trends, 3 additional growth drivers, and 2 additional restraints and challenges are covered in the full report. Contact sales@marketmindsadvisory.com to access the complete intelligence.

Segment CAGR and Growth Architecture

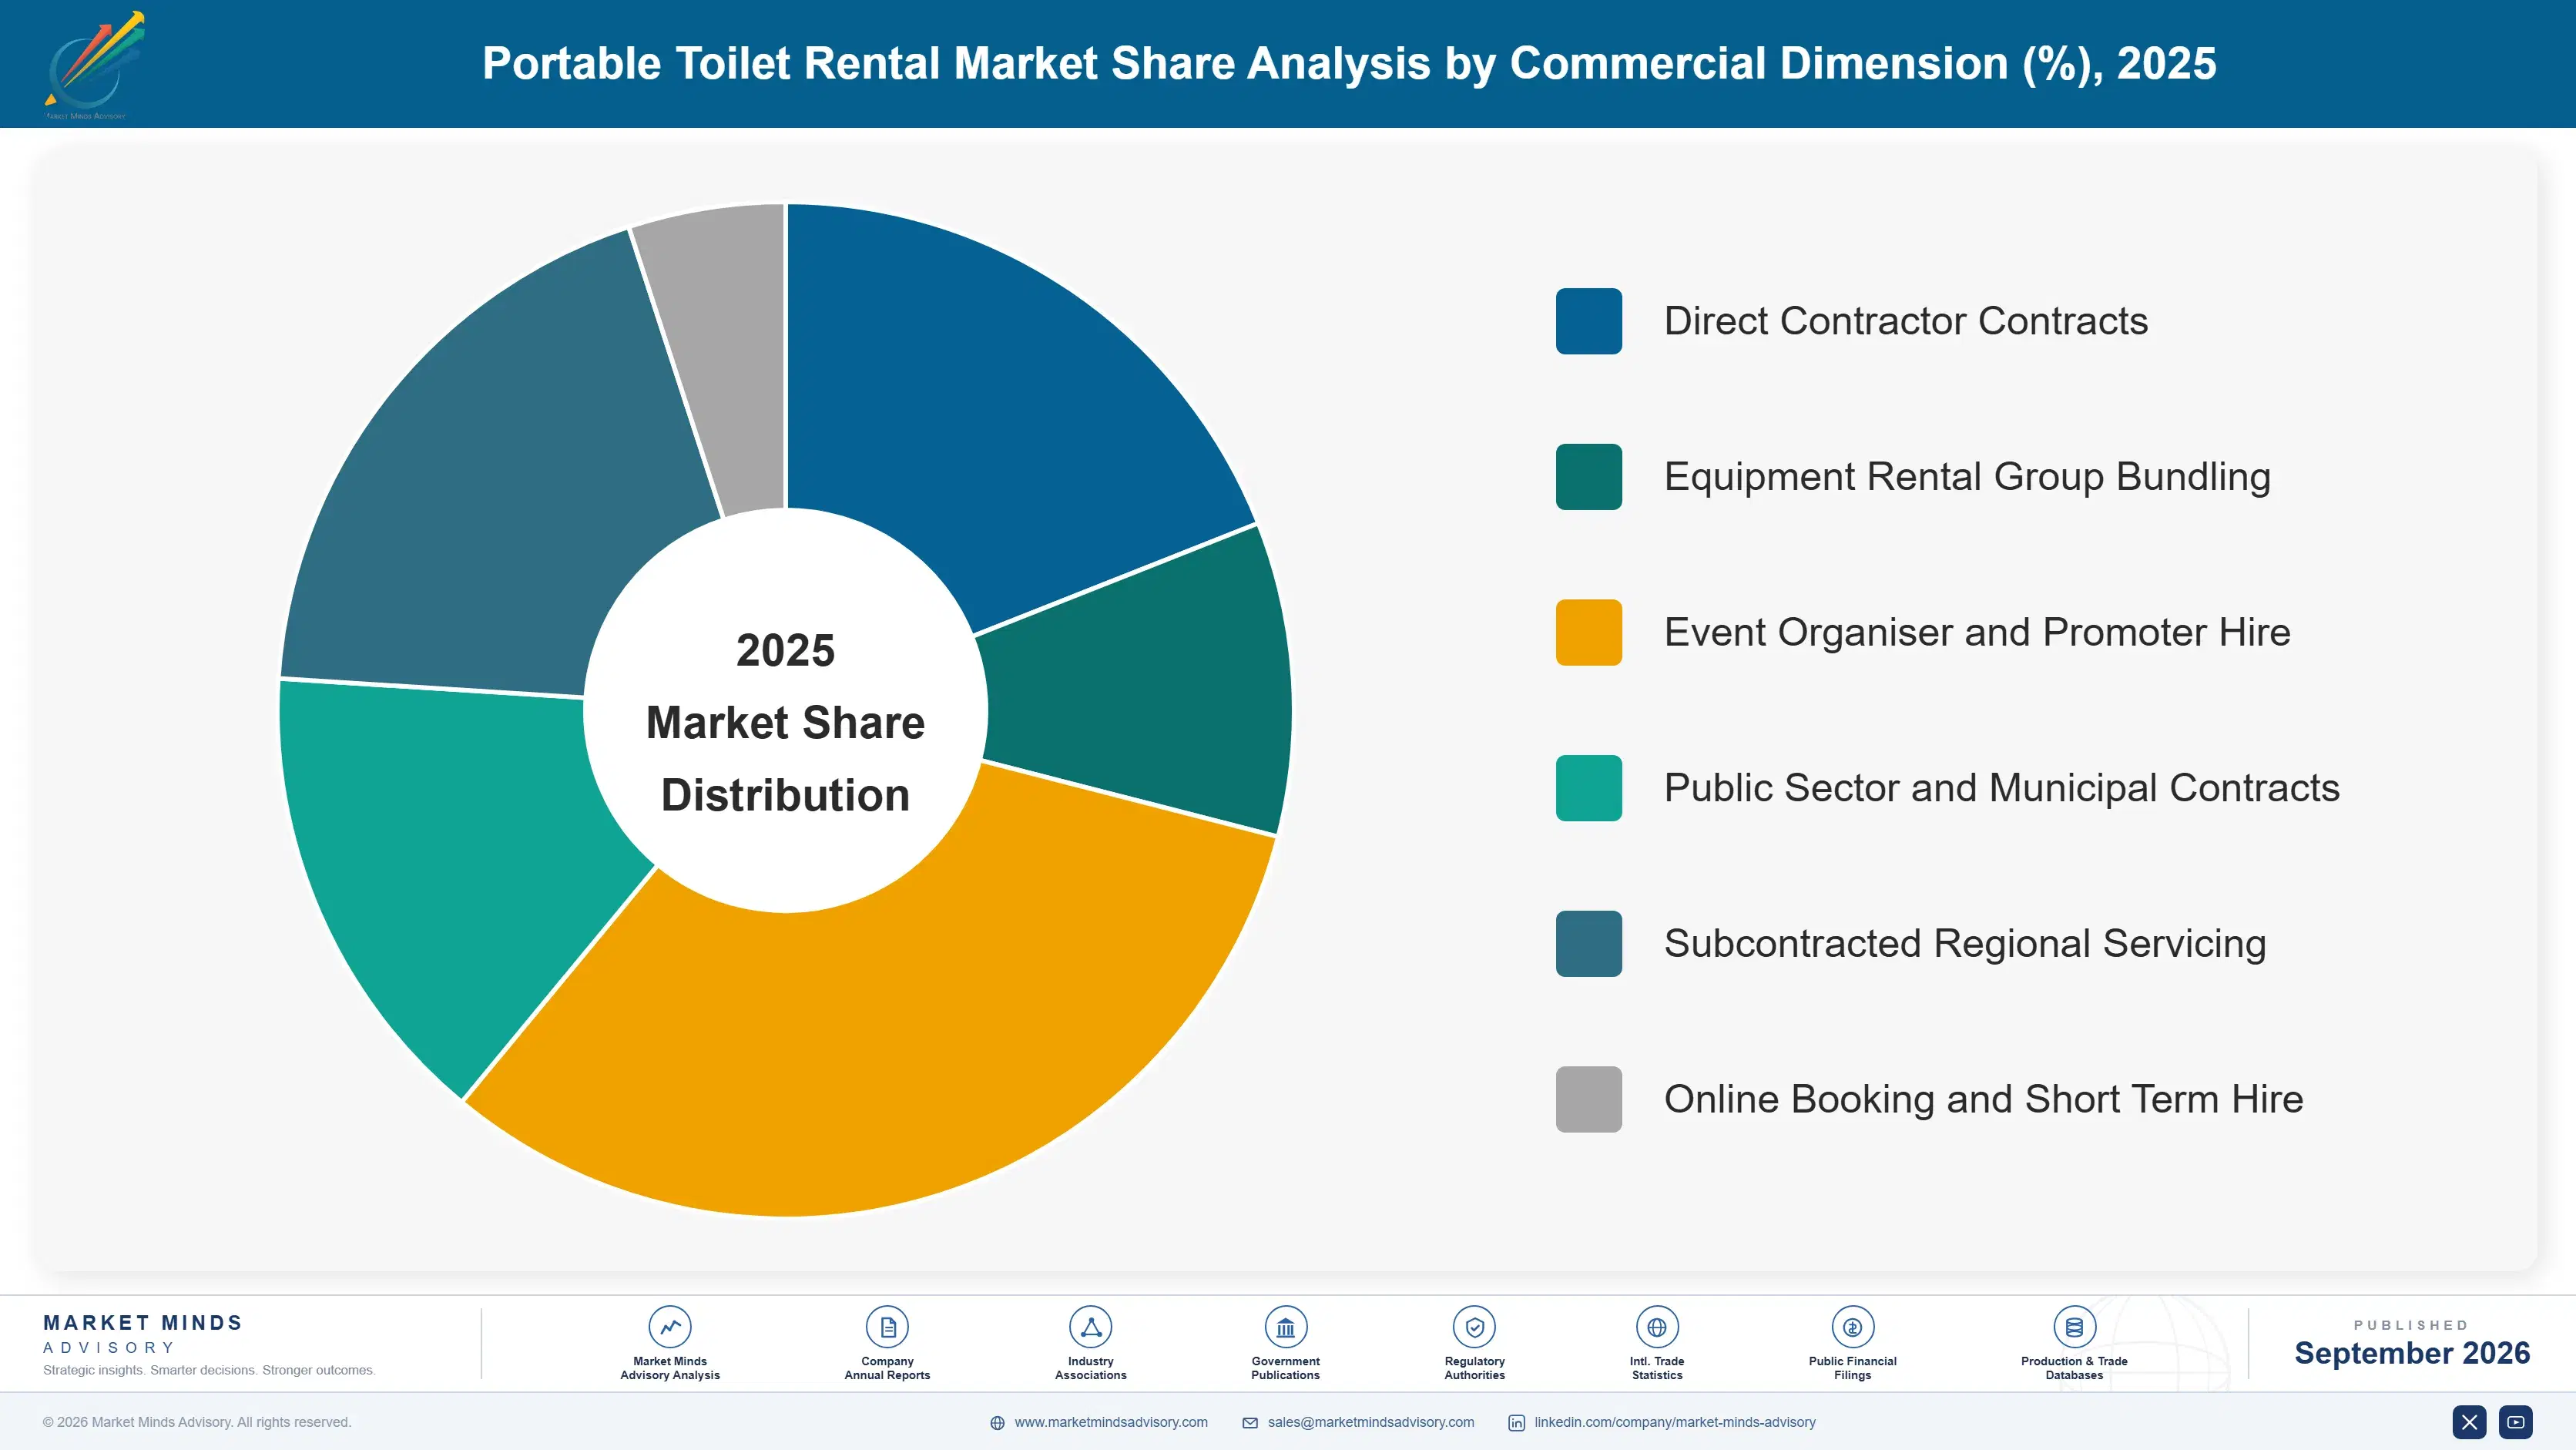
Segmentation follows unit type across six categories: restroom trailers and luxury units, accessible and compliant units, handwash and hygiene stations, deluxe flushing and solar units, standard single portable units, and urinal banks and high capacity units. Servicing, delivery, and waste removal are counted within the unit rented rather than tracked separately. Fleet ownership and subcontracted servicing are treated separately.
portable-toilet-rental-market-market-share-analysis-1790014462221

Restroom Trailers And Luxury Units

Restroom trailers grow at 8.7%, half again the market rate of 5.8%, by capturing event revenue that standard units were never going to reach. Weddings, corporate hospitality, and film production will pay substantially for flushing fixtures, running water, lighting, and climate control, and none of that is achievable in a moulded cubicle at any servicing frequency. Capital per unit runs many times higher than a standard toilet and utilisation is seasonal rather than continuous. Operators running trailers alongside construction fleets balance those cycles against each other, which is why the segment concentrates among larger businesses. Seasonal idle capital is the segment's defining commercial problem. Event demand peaks precisely when construction hire does not.
CAGR 8.7%

Accessible And Compliant Units

Accessible units grow at 7.4% almost entirely because regulation requires them rather than because any customer requests them. Provision rules across major markets specify accessible facilities in defined ratios at construction sites and public events, and enforcement has tightened steadily. The units are larger, heavier, and occupy more transport capacity per delivery, so route economics are worse than standard cubicles and pricing has not fully caught up. Operators treat them as a compliance obligation attached to winning the wider contract rather than as a segment they would pursue independently. Pricing has not fully caught up with the transport cost these units impose, and operators generally absorb the difference to keep the wider contract.
CAGR 7.4%
Full segment breakdown across 6 segments available in the complete report.

Regional Architecture and Country Demand Map

Regional shares here reflect where portable sanitation is actually rented and serviced, which is inherently local since the economics depend entirely on route density. Two regions sit outside the standard share bands, for reasons named in their own paragraphs and summarised below for operator review.

North America

Workplace provision ratios are written into federal safety regulation and enforced through site inspection, which makes construction demand legally specified rather than discretionary here more than anywhere. Growth of 5.4% tracks close to the world rate. Consolidation has advanced further than in any other region, with large operators holding route density in most metropolitan areas that entrants cannot now assemble. Event and festival hire is a mature commercial segment with established seasonal pricing across the market. Sensor fitment has begun among the largest operators and remains negligible across the wider fleet, which leaves most of the servicing efficiency available in this market still untaken. Event hire prices seasonally and predictably.
Share: 32% | CAGR: 5.4% (2026 to 2036)

Western Europe

Construction welfare requirements are stringent and enforcement is consistent, though European practice favours modular welfare cabins with plumbed facilities more heavily than standalone portable units. Growth of 4.4% is the slowest of the seven regions. That preference caps the addressable base relative to construction activity. Equipment rental groups rather than sanitation specialists hold most of the market, offering portable sanitation alongside broader site services under a single account relationship. That bundled account structure removes sanitation from competitive tender on many projects entirely, which suits contractors and suppresses the price competition specialists would otherwise create across the region. Modular welfare cabins cap the addressable base relative to construction activity across most of the region.
Share: 24% | CAGR: 4.4% (2026 to 2036)
Regional intelligence for 5 additional markets available in the complete report: East Asia, South Asia and Pacific, Middle East and Africa, Latin America, Eastern Europe. Contact sales@marketmindsadvisory.com.
portable-toilet-rental-market-country-cagr-analysis-1790014462753

Where Operators Actually Make Money

Four commercial moves separate operators earning genuine returns from those running trucks between distant stops at rental rates that never cover the mileage. Each addresses the same underlying truth: this is a logistics business, and the unit is simply the thing that gets billed for a visit. Two of the four cost almost nothing to implement.

Acquire For Overlap Rather Than For Revenue

A competitor whose units already sit within existing rounds adds stops at almost no marginal cost, while one in an adjacent territory brings vehicles, a depot, and a route structure to fund. Operators acquiring on geographic overlap report integration margins 2.9 times higher than those buying on revenue multiples alone. The distinction decides whether an acquisition improves route density or simply adds a second business to run alongside the first one. The useful acquisitions in most territories have already been completed. Density lowers cost per stop across the whole existing operation.
Market Impact: Raises acquisition integration margins to 2.9 times higher

Fit Sensors And Service On Actual Need

Contracts specify weekly attendance regardless of site headcount, and about 6% of units can report their own fill level. Operators fitting sensors report route efficiency gains of 18% to 27% and materially fewer complaints, since capacity moves from over-serviced units to under-serviced ones. The hardware costs a fraction of a single wasted truck visit, and the resulting data also supports usage-based contract pricing that weekly terms cannot. Capacity moves from over-serviced units toward under-serviced ones without adding a single truck to the fleet. The resulting data also supports usage pricing that weekly terms cannot.
Market Impact: Raises route efficiency by 18 to 27% overall

Give The User A Way To Report

The person using a unit never chose it and has no channel to the operator, so poor servicing persists until contract renewal rather than being corrected within days. Operators placing scannable reporting codes on units report contract retention 2.4 times higher, because problems surface while they can still be fixed. It costs a sticker and a web form, and it creates the feedback loop this industry has operated without for its entire history. No competitor currently offers the user any way to report at all. Problems surface while they can still be corrected.
Market Impact: Raises contract retention rates to 2.4 times higher

Run Trailers Against Construction Hire Seasonality

Restroom trailers grow at 8.7% on event demand that peaks precisely when it does, while construction hire runs continuously across the year at lower rates per unit. Operators balancing both fleets report annual asset utilisation 21% to 32% above single-fleet competitors. The capital intensity of trailers only works when the seasonal gaps are covered by something, and construction volume is the most reliable thing available to cover them. Construction volume is the most reliable thing available to cover those gaps, which is why trailer fleets concentrate among operators who already hold site contracts.
Market Impact: Lifts annual asset utilisation by 21 to 32%

Who Controls the Margin Pool

Concentration is low nationally and high locally, which is the defining structure of this market. Five operators hold 29% of category revenue, measured consistently on that basis across all participants, and within any given metropolitan area one or two businesses typically hold the route density that makes servicing profitable at all. Barriers to entry are trivial in equipment and considerable in density, which is an unusual combination for a rental business.
Competition currently turns on three dimensions: route density in a specific territory, which decides whether a contract can be served profitably; fleet mix across construction and event demand, which determines annual utilisation; and compliance capability on accessible units, which is frequently a condition of winning wider contracts. Monitoring capability is emerging as a fourth dimension that will eventually decide how contracts get priced across this whole market.

Pressure builds from two directions. Equipment rental groups bundle sanitation into broader site service accounts. Meanwhile large operators keep acquiring local density. Rankings will shift toward operators fitting monitoring and pricing on usage, since neither weekly contracts nor manual scheduling survives that comparison. Sensor data will eventually make usage pricing the standard rather than the exception.
portable-toilet-rental-market-company-positioning-matrix-1790014463278

Competitive Moat and Risk Dimensions

UNITED SITE SERVICES

Moat: Metropolitan Route Density

Years of acquiring operators inside territories already served have produced route density across most major American metropolitan areas that a new entrant cannot assemble, since the businesses that would have provided it have already been bought. Density lowers cost per stop to a level competitors serving the same customers cannot approach profitably.
UNITED SITE SERVICES

Risk: Construction Cycle Concentration

Revenue weighted heavily toward construction hire follows site starts almost exactly, and a downturn in commercial building removes units from hire faster than any other segment can replace them. Balancing with event and trailer fleets requires capital and seasonal management that a construction-focused operation is not structured around.
BOELS RENTAL

Moat: Bundled Site Services Account

Offering portable sanitation inside a broader equipment rental relationship means the contractor places one order and receives one invoice, which removes sanitation from competitive tender entirely on many projects. That account structure is difficult for a sanitation specialist to attack, since it competes on convenience rather than on price per unit.
BOELS RENTAL

Risk: Servicing Depth Against Specialists

Sanitation servicing requires vehicles, waste handling, and route scheduling that sit awkwardly inside a general equipment rental operation built around delivery and collection. Specialists running dedicated routes achieve service quality and cost per stop that a bundled provider struggles to match on the same territory.

Players Tracked

Prominent Players

United Site Services
Boels Rental
Loxam Group
National Construction Rentals
Algeco

Other Key Players

ASAP Site Services
Sunbelt Rentals
Herc Rentals
Speedy Hire
HSS Hire
Kiloutou
Cramo
Ramirent
GAP Group
Nixon Hire
Site Equip
Andy Loos
Mr John
Texas Outhouse
Diamond Environmental Services

Recent Developments

FEBRUARY 2026

United Site Services Deploys Fill Level Sensors Across Rental Fleet

United Site Services began fitting fill level sensors across its rental fleet, moving servicing from fixed weekly schedules toward actual condition and providing the data required to price contracts on usage rather than on calendar intervals. Route scheduling was rebuilt around the resulting data rather than around fixed rounds.
Signal: Servicing becomes an operating variable rather than a fixed contract term. Competitors on weekly terms cannot match the efficiency.
SEPTEMBER 2025

Boels Rental Acquires Regional Portable Sanitation Operator

Boels Rental completed an acquisition of a regional portable sanitation operator whose service territory overlapped existing rounds substantially, adding stops to established routes rather than requiring a separate depot and vehicle fleet. No additional depot or vehicles were required by the transaction. Acquired stops absorbed into existing rounds within weeks.
Signal: Geographic overlap rather than acquired revenue is what these deals target. Integration cost is near zero when territories overlap.
JUNE 2025

Loxam Expands Restroom Trailer Fleet Across European Markets

Loxam Group completed an organic fleet expansion for restroom trailers across several European markets, funded internally with no partner involved, after event demand for flushing and climate controlled facilities outran available units through peak season. Construction hire across the same territories covers the seasonal gaps.
Signal: Event capital is being deployed to balance construction hire seasonality. Trailer capital only works alongside continuous construction volume.

What A Service Visit Costs

Three cost groups dominate. Route labour and service vehicles run 32% to 40% of operating cost, and the eight-point range separates dense metropolitan rounds from rural territories where a driver spends most of a shift travelling. Fleet capital and depreciation take 26% to 34%, with restroom trailers far above standard units. Waste disposal and treatment gate fees add 18% to 26%, and they vary enormously by jurisdiction.
Diesel pricing moved considerably through 2024 and 2025 across every major market, and EIA fuel price series documented movements that flow directly into route cost for a business whose vehicles run continuously. Several rental groups described the resulting margin pressure in their annual reports for those years. Waste treatment gate fees followed local authority pricing on entirely separate and much slower cycles. Vehicle capital followed commercial chassis pricing separately again.

The competitive disadvantage mechanism runs through route density rather than through any input price. An operator servicing stops 3.4 kilometres apart spreads driver time and fuel across many more billable visits than one covering twenty kilometres between them, and no purchasing advantage closes that gap. Exposure varies by territory rather than scale: a small dense operator outperforms a large dispersed one consistently.
portable-toilet-rental-market-cost-volatility-analysis-1790014463475

Buy Density Before Buying Revenue

An acquisition inside an existing service territory adds stops to rounds already running, while one in an adjacent region brings vehicles, a depot, and a route structure to fund from scratch. The first improves cost per stop across the whole existing operation and the second simply creates a second business to manage alongside the first.

Match Servicing To Condition Not Calendar

Weekly attendance regardless of site headcount wastes visits on lightly used units and under-serves heavily used ones simultaneously. Fill sensors cost a fraction of a single wasted truck visit and redirect route capacity toward where it is actually needed, improving both margin and the reputation this industry has carried for decades. Nobody has priced contracts to reward it yet.

Price Rural Territories On Distance Not Units

Rural and remote sites consume driver hours and fuel far beyond what a standard per unit rate covers, and operators quoting national pricing lose money on exactly those contracts. Distance-based pricing is straightforward to justify to a customer who understands that somebody has to drive there every week. National rate cards lose money on precisely those contracts.

Portfolio Architecture for Margin Defence

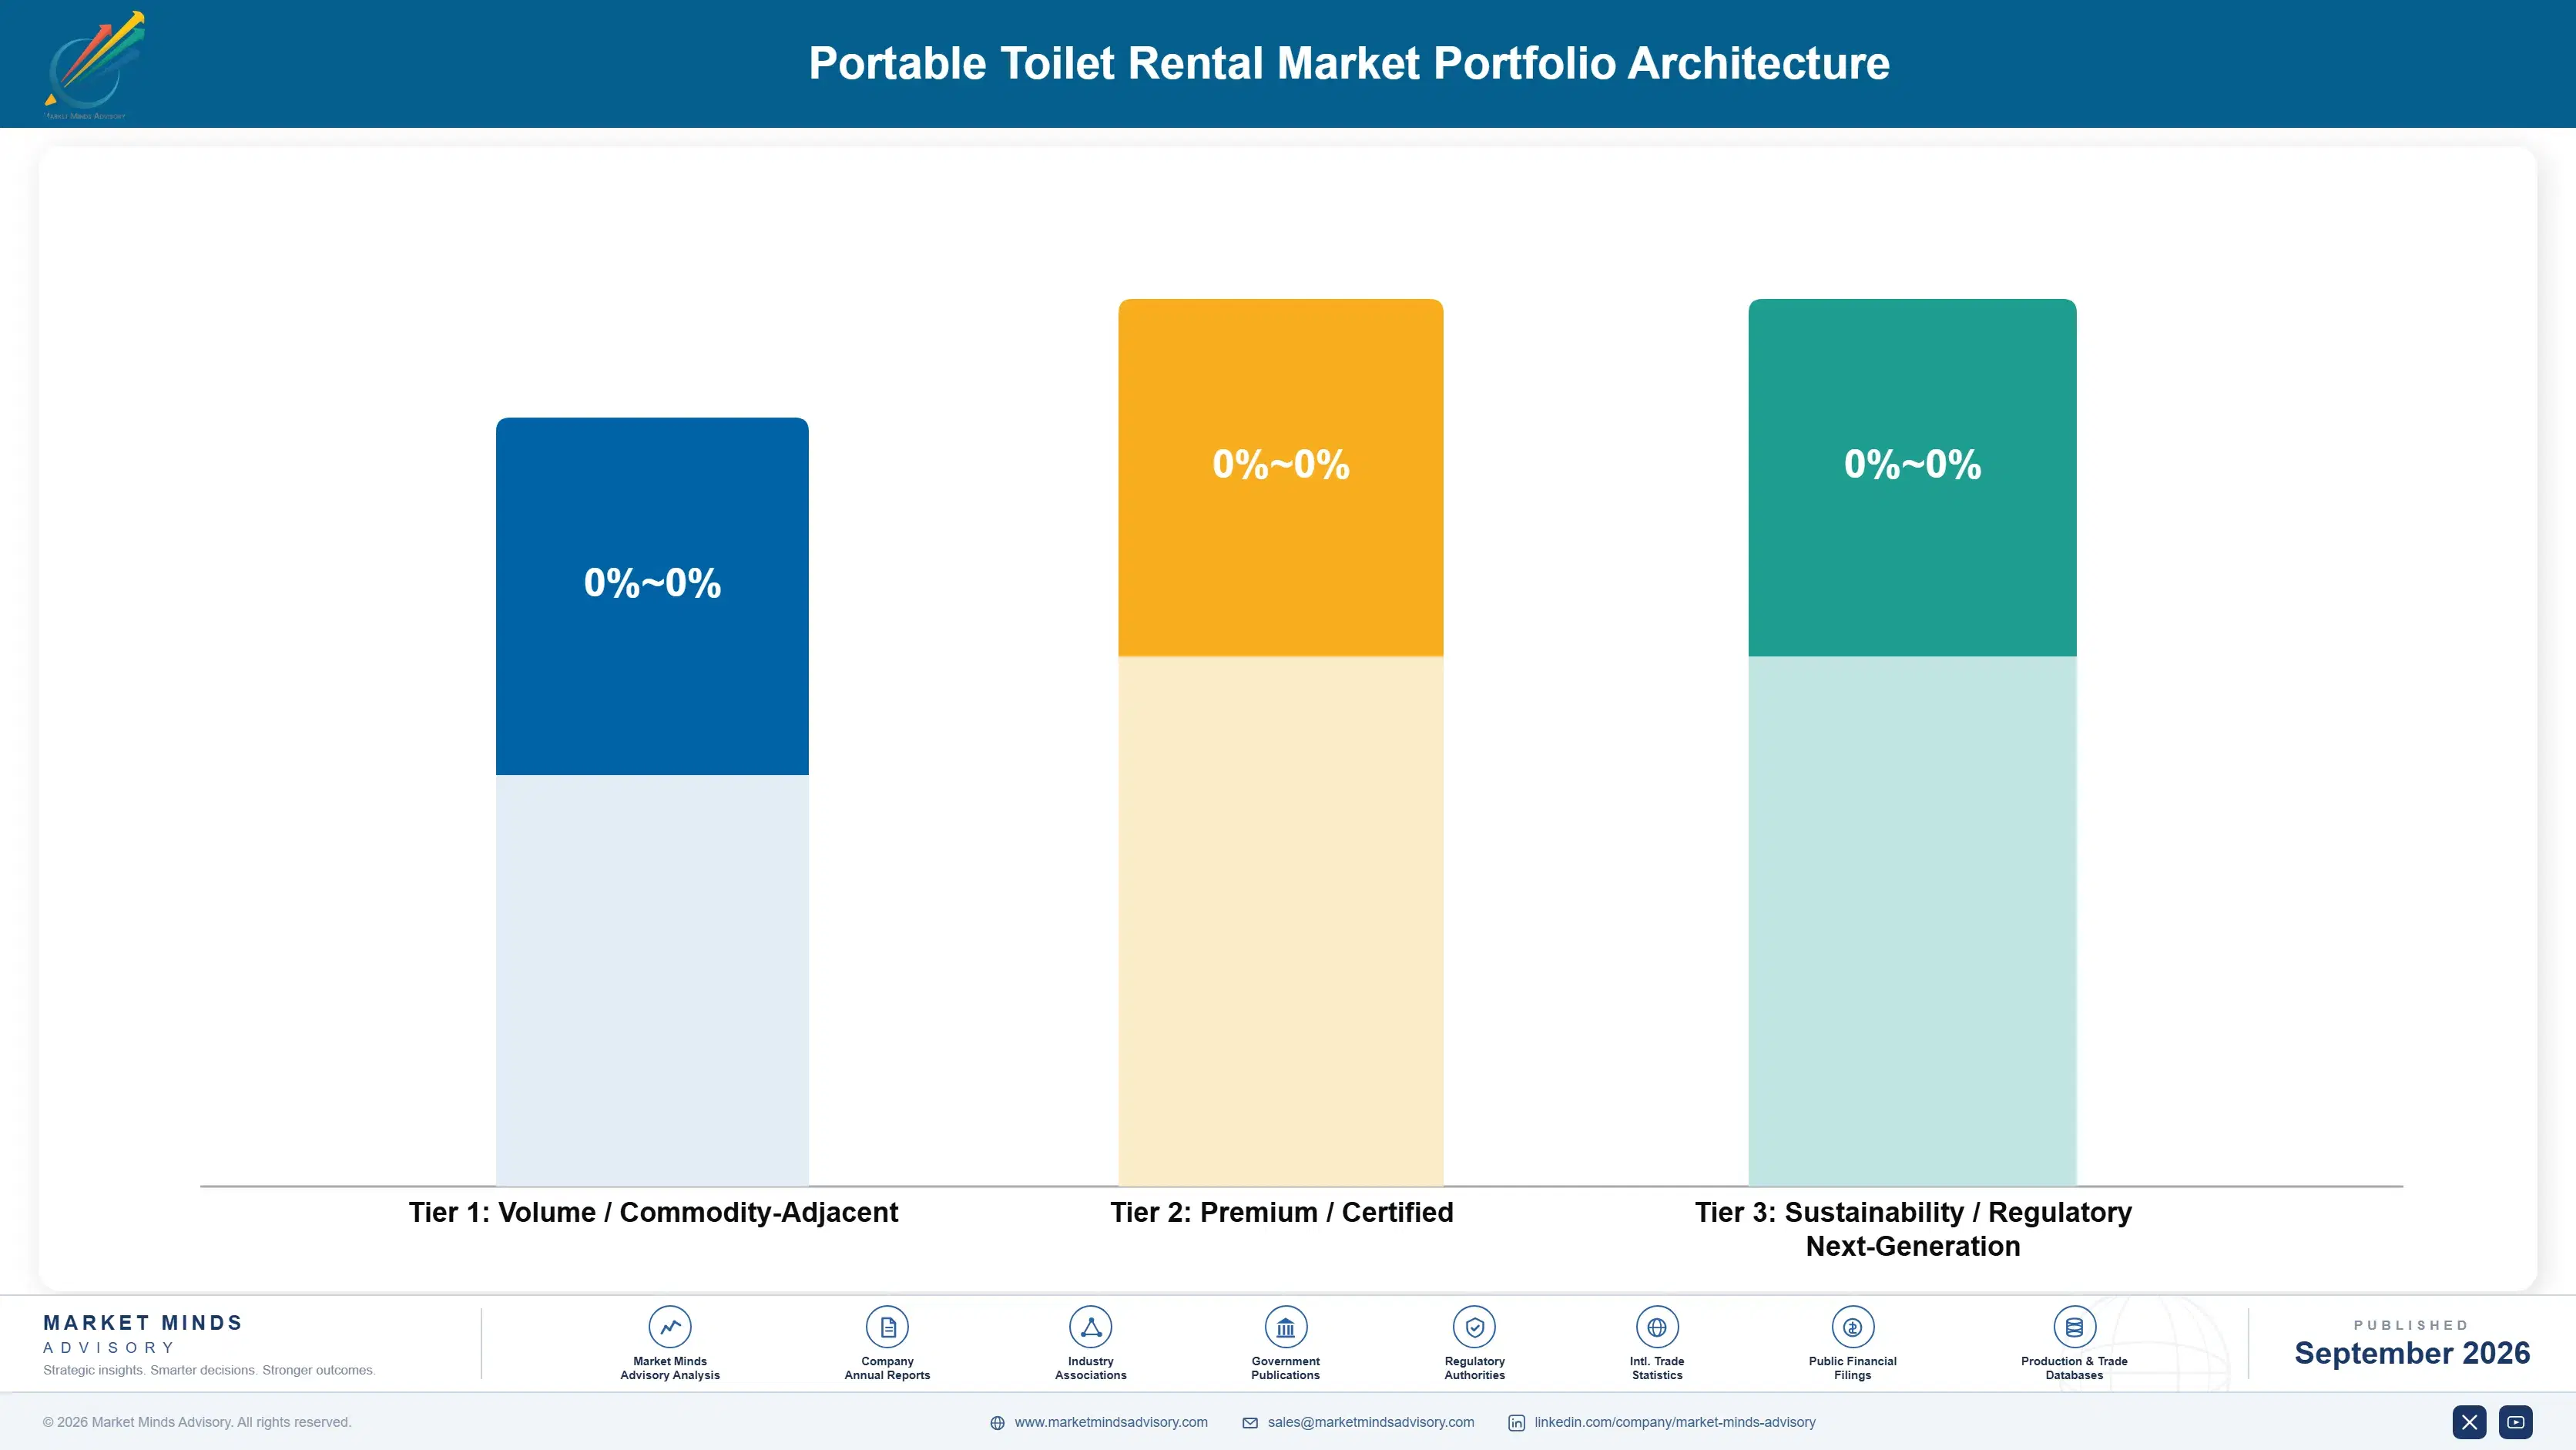
Margin follows route density and capital intensity together rather than unit type alone. Standard construction hire in dense territory earns steadily on volume. Urinal banks and high capacity units earn least, since they consume transport capacity without commanding proportionate rates. Handwash and hygiene stations earn better as compliance attachments, and restroom trailers earn most when their seasonal gaps are covered. The margin spread across those groups is wide for a service business.
The tension between volume and premium runs through utilisation. Construction hire runs continuously at modest rates and fills a route calendar reliably. Event and trailer hire commands several times the daily rate and stands idle for much of the year. Operators need both, and the ones running only one of them either waste capital or accept thin returns permanently.

High-value pools concentrate where distance or specification limits competition: remote mining and infrastructure sites where few operators will travel, event work requiring trailers that most local businesses cannot fund, and compliance-heavy contracts requiring accessible unit ratios that smaller operators cannot supply. Where the requirement is a standard cubicle on an urban building site, price decides entirely. That divide follows distance more than unit specification.

Volume / Commodity-Adjacent

Standard single units and urinal banks hired on construction sites in competitive urban territories where several operators serve the same streets. The ten-point range reflects route density and depot proximity rather than anything about the units themselves.
Gross Margin: 18% to 28%

Premium / Certified

Accessible units, handwash stations, and deluxe flushing units supplied as compliance obligations attached to wider site contracts. The twelve-point range separates operators holding the full compliant range from those subcontracting parts of a required specification.
Gross Margin: 32% to 44%

Sustainability / Regulatory / Next-Generation

Restroom trailers, solar units, and sensor-monitored fleets priced on usage rather than on fixed weekly attendance. The sixteen-point range reflects whether seasonal capital is balanced against continuous construction hire or left standing idle.
Gross Margin: 46% to 62%
portable-toilet-rental-market-portfolio-architecture-1790014463981

High-value Sub-segments and Strategic Watch-out

Restroom Trailer Event Fleets

Highest value in the category, growing at 8.7% on event demand that standard cubicles cannot serve at any price. The sixteen-point range reflects whether seasonal idle capital is offset by construction hire across the rest of the year. Few local operators can fund the capital.
Gross Margin: 48% to 64%

Sensor Monitored Service Contracts

High value where servicing matches condition rather than the calendar, redirecting route capacity toward units that actually need it. The twelve-point range reflects fitment scale, since around six per cent of the world fleet currently carries any monitoring. Contract terms have not caught up yet.
Gross Margin: 38% to 50%

Remote And Distance Priced Contracts

Volume core where few operators will travel and pricing reflects driver hours rather than unit counts alone. The twelve-point range reflects whether distance is priced properly or absorbed into a standard national rate card. Few competitors will travel to serve them, which makes these contracts unusually defensible.
Gross Margin: 34% to 46%

Urban Standard Unit Hire

The strategic watch-out. Several operators serve the same streets, units are interchangeable, and contractors compare on weekly rate alone with nothing else entering the decision. The ten-point range reflects route density and depot proximity only. Nothing about the unit resists that comparison anywhere. Rate alone decides it.
Gross Margin: 16% to 26%

How This Demand Recurs

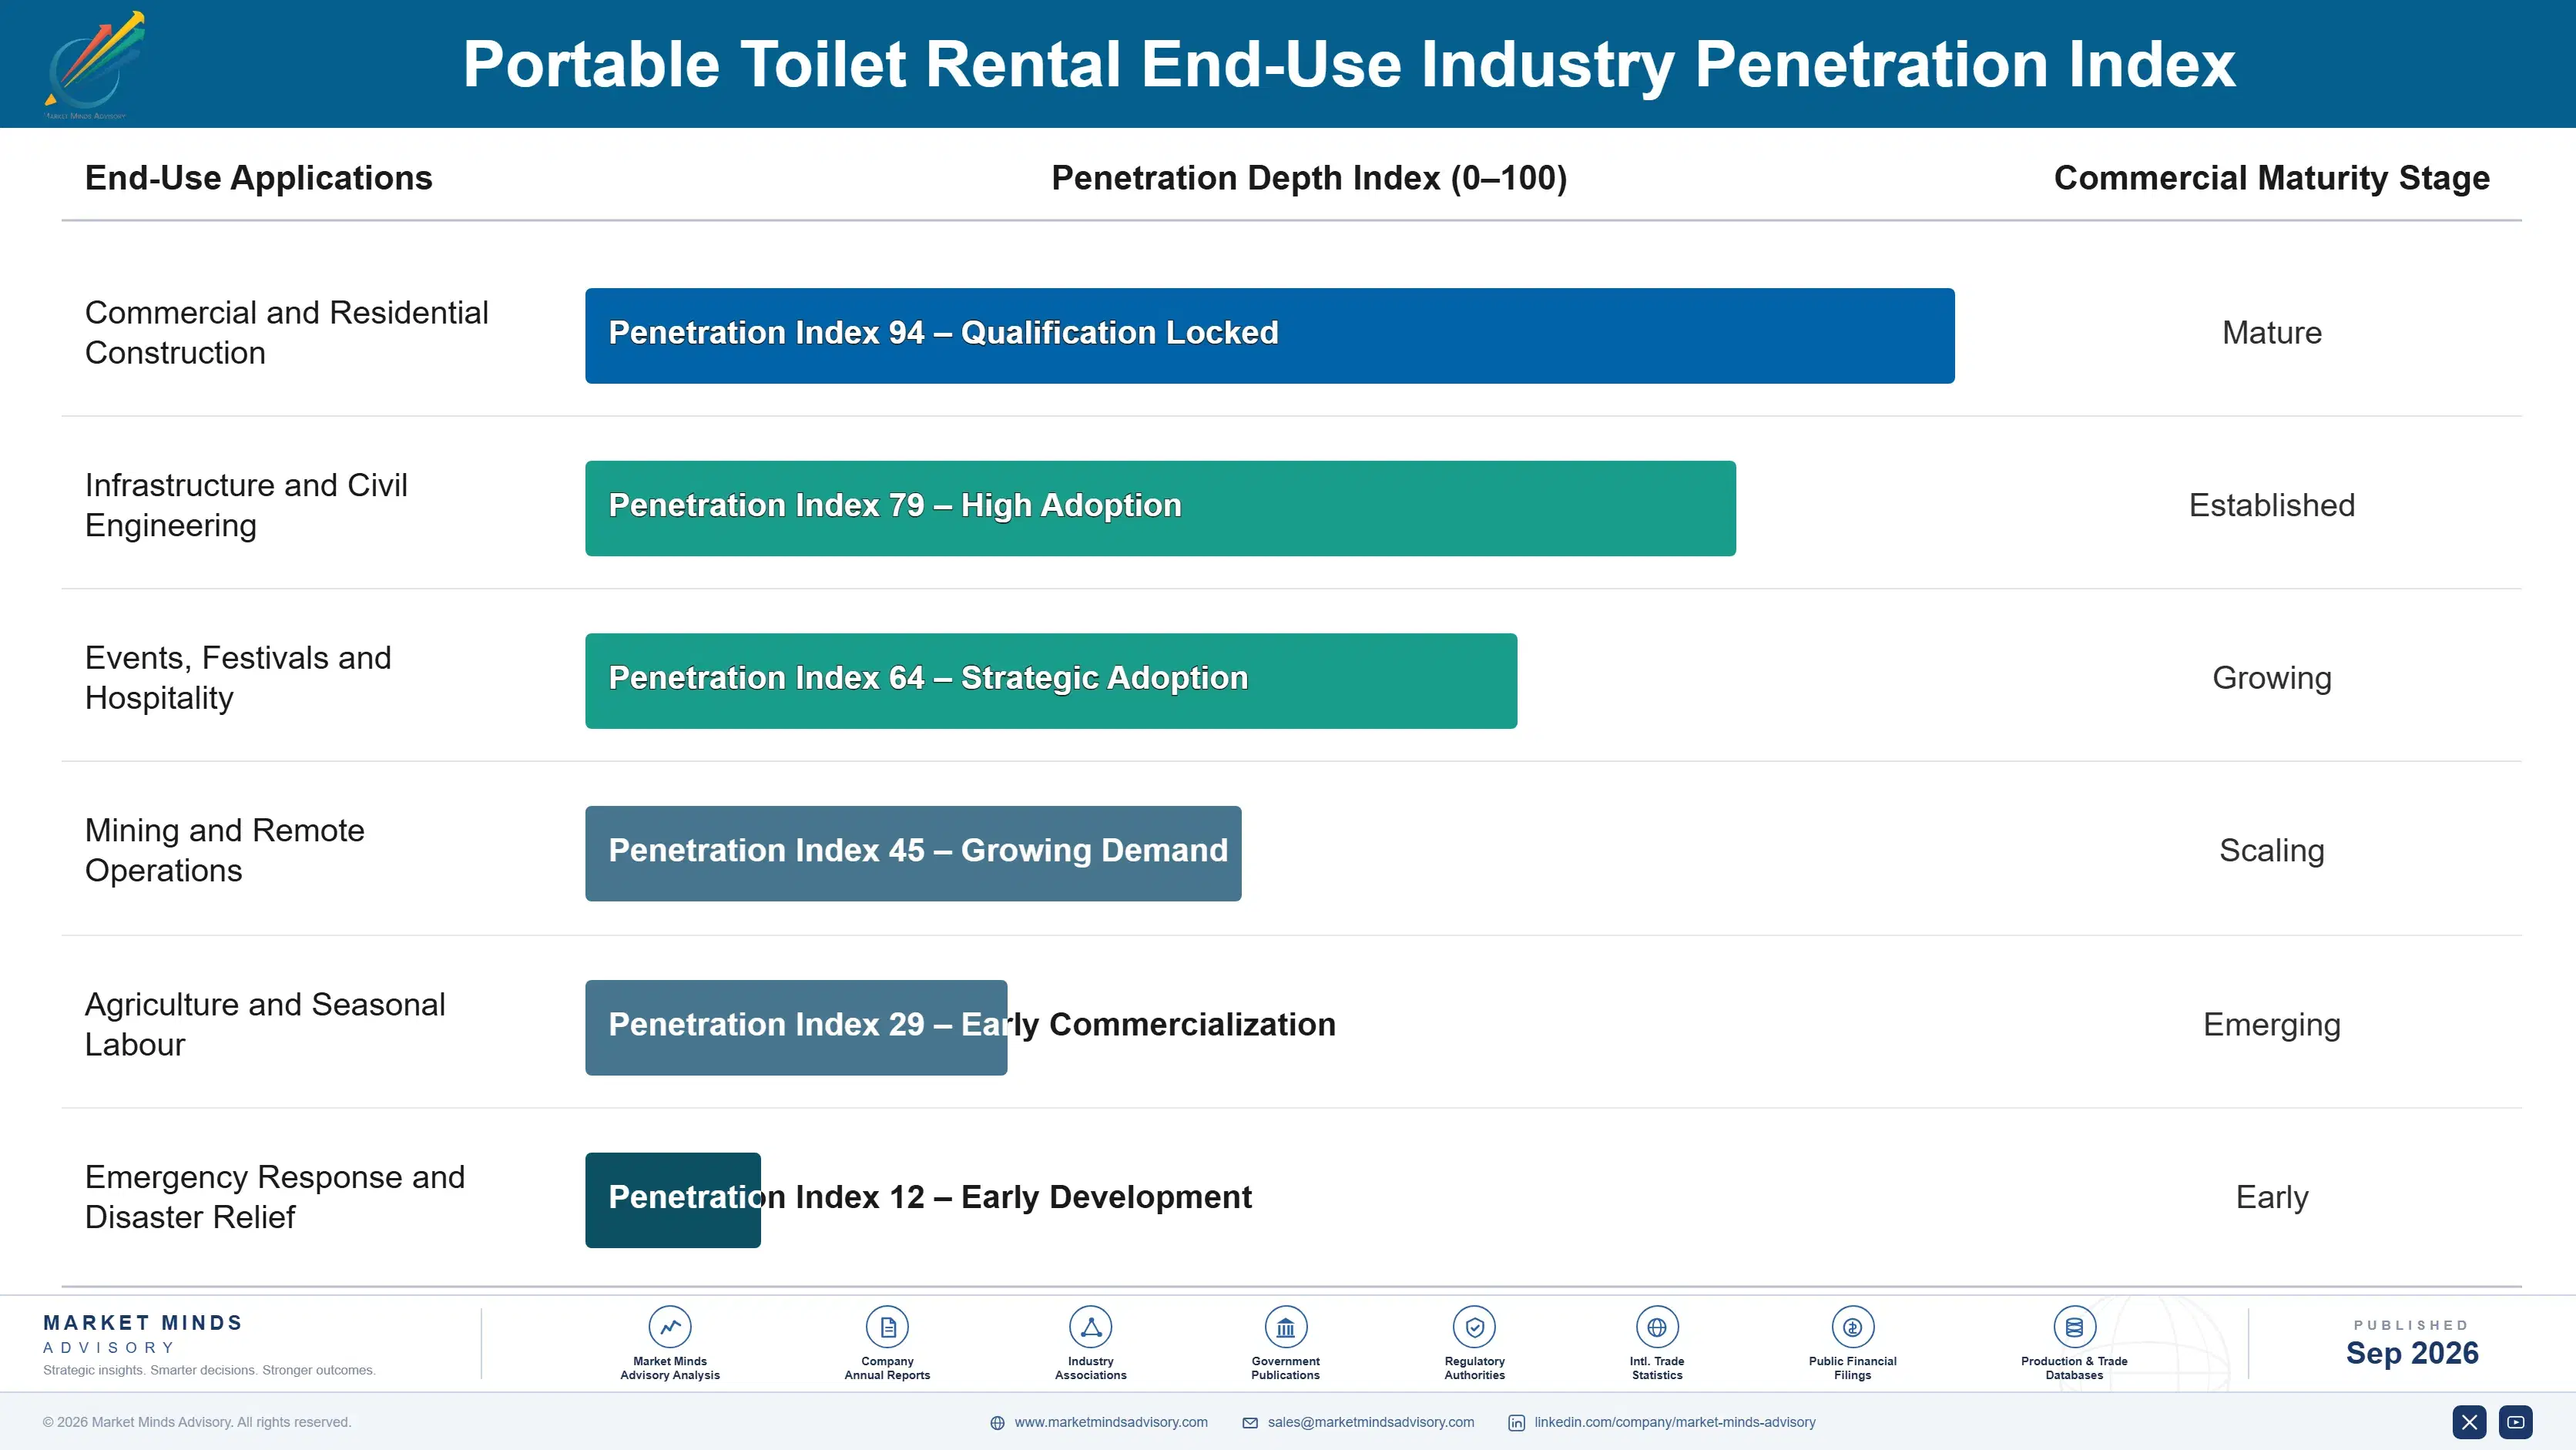
Revenue recurs weekly for as long as a site remains open, which makes this closer to a subscription than to equipment rental. A construction project running eighteen months generates seventy-eight service visits per unit at a predictable rate, and the operator holding that contract has effectively booked the revenue at the point of delivery. Retention therefore matters far more than winning any individual quotation.
Attachment depth follows contract length rather than satisfaction. Construction hire runs for the duration of a project and rarely changes operator midway, since switching means coordinating removal and delivery around active work. Event hire is transactional and re-tendered annually. The construction relationship is worth many times more and depends almost entirely on avoiding the service failures that reach a site manager.

The buyer has consolidated while the user has not changed at all. Site services are increasingly procured centrally by contractors across multiple projects rather than site by site, which favours operators with regional coverage over local specialists. The person using the unit still has no say and no channel, which is why service quality remains disconnected from commercial outcomes across most of this market.
portable-toilet-rental-market-end-use-penetration-index-1790014464471

Where This Market Rewards

These are among the four positions where our research anticipates prominent divergence between winners and laggards over the coming forecast period. Each is grounded in the demand model, the regulatory perimeter, and the announced capacity pipeline.
01 / DENSITY LED ACQUISITION

Buy the streets, not the revenue

A competitor whose units already sit within existing rounds adds stops at almost no marginal cost, while one in an adjacent territory brings vehicles, a depot, and a route structure to fund. Operators acquiring on geographic overlap report integration margins 2.9 times higher than competitors buying on revenue multiples alone. That distinction decides whether a deal improves route density or simply creates a second business to run, and in most territories the useful acquisitions have already been completed by somebody.
02 / CONDITION BASED SERVICING

Weekly is a guess, not a schedule

Contracts specify weekly attendance regardless of whether a site carries eight workers or eighty, and roughly 6% of rented units can report their own fill level. Operators fitting sensors report route efficiency gains of 18% to 27% alongside materially fewer service complaints. The hardware costs a fraction of a single wasted truck visit, and the data it produces also supports usage pricing that weekly terms cannot, and no truck needs adding to the fleet for any of it to happen.
03 / USER FEEDBACK CHANNEL

Nobody who uses one chose it

The person using a portable unit never selected the operator and has no route to reach them, so poor servicing persists until a contract renewal rather than being corrected inside days. Operators placing scannable reporting codes on their units report contract retention 2.4 times higher than competitors operating without them. It costs a sticker and a web form and creates the feedback loop this industry has operated without entirely, which no competitor currently offers to anybody using their units either.
04 / FLEET SEASONALITY BALANCE

Trailers idle when sites do not

Restroom trailers grow at 8.7% on event demand concentrated into just a few months of the year, while construction hire runs continuously at considerably lower rates per unit throughout. Operators who balance both fleets together now report annual asset utilisation 21% to 32% above single-fleet competitors of otherwise comparable size. Trailer capital intensity only works when something reliable covers the seasonal gaps, and construction volume is that something, which is why trailer fleets concentrate among operators already holding site contracts.

Engagement Snapshot From the Field

A live engagement with an industry participant carrying material or product regulatory and market exposure ahead of a defining policy shift, showing how our research translates into a defensible multi-year portfolio strategy.
MARKET MINDS ADVISORY · CLIENT ENGAGEMENT SUMMARY
Portable Toilet Rental Producer Strategic Portfolio Review and Transition Roadmap 2026·Investment Scenario on Portable Toilet Rental Exposure Evaluation 2025-26
CLIENT PROFILE
A regional portable sanitation operator running 4,100 units across three states with annual revenue near USD 38 million (client-reported, unverified by MMA). Revenue had grown for four consecutive years while operating margin declined in each of them, and management could not identify which contracts were responsible. The board wanted the loss-making contracts identified before any pricing decision was taken across the wider book.
STRATEGIC CHALLENGE
Leadership attributed the margin decline to fuel and labour inflation and had proposed an across-the-board rate increase. Nobody had calculated profitability by individual contract, or established whether the growth of recent years had come from territories the existing route structure could actually serve economically. Inflation and route economics imply entirely different remedies.
MMA APPROACH
MMA calculated cost to serve for every contract using route distance, service frequency, and time on site, mapped profitability against depot proximity, compared service complaint rates against actual usage intensity, and modelled outcomes under uniform pricing, distance pricing, and selective contract exit. Depot locations were assessed alongside, since several territories had been entered without any servicing base within reasonable reach.
KEY FINDINGS
  1. Around 31% of contracts by count were unprofitable once route distance was allocated properly, and every one of them sat beyond forty kilometres from the nearest depot.
  2. Those contracts had been won on a national rate card that priced by unit and made no allowance whatsoever for the driving time each visit required.
  3. Service complaints concentrated on high-usage sites receiving the same weekly attendance as sites with a fraction of the headcount, not on any particular unit type.
  4. An across-the-board increase would have raised prices on the profitable dense contracts most likely to switch, while leaving the loss-making distant ones only marginally improved.
CLIENT PROFILE
A regional portable sanitation operator running 4,100 units across three states with annual revenue near USD 38 million (client-reported, unverified by MMA). Revenue had grown for four consecutive years while operating margin declined in each of them, and management could not identify which contracts were responsible. The board wanted the loss-making contracts identified before any pricing decision was taken across the wider book.
STRATEGIC CHALLENGE
Leadership attributed the margin decline to fuel and labour inflation and had proposed an across-the-board rate increase. Nobody had calculated profitability by individual contract, or established whether the growth of recent years had come from territories the existing route structure could actually serve economically. Inflation and route economics imply entirely different remedies.
MMA APPROACH
MMA calculated cost to serve for every contract using route distance, service frequency, and time on site, mapped profitability against depot proximity, compared service complaint rates against actual usage intensity, and modelled outcomes under uniform pricing, distance pricing, and selective contract exit. Depot locations were assessed alongside, since several territories had been entered without any servicing base within reasonable reach.
KEY FINDINGS
  1. Around 31% of contracts by count were unprofitable once route distance was allocated properly, and every one of them sat beyond forty kilometres from the nearest depot.
  2. Those contracts had been won on a national rate card that priced by unit and made no allowance whatsoever for the driving time each visit required.
  3. Service complaints concentrated on high-usage sites receiving the same weekly attendance as sites with a fraction of the headcount, not on any particular unit type.
  4. An across-the-board increase would have raised prices on the profitable dense contracts most likely to switch, while leaving the loss-making distant ones only marginally improved.
RECOMMENDED STRATEGY
Phase 1: Phase one: reprice all contracts beyond forty kilometres on a distance basis and exit those where the customer declines the revised terms. Phase 2: Phase two: fit fill sensors on high-usage sites first, redirecting the freed route capacity toward the units generating complaints. Complaints concentrate on usage rather than unit type. Phase 3: Phase three: target acquisitions only where the service territory overlaps existing rounds rather than extends them. Extending territory has consistently destroyed margin here.
OUTCOME
Operating margin recovered 4.6 points within three quarters despite a small reduction in unit count (client-reported, unverified by MMA). Service complaints fell by roughly a third at sensor-fitted sites. The proposed across-the-board increase was abandoned entirely. Contract level profitability is now calculated monthly and reviewed before any renewal.

Frequently Asked Questions

Foundational context covering the market sizes, CAGR, scope, country, region and competition that inform every finding below. This section is provided to cover basics and most often pre-purchase conversations, answered from the MMA Primary Research Dataset.

What is the current size of the Portable Toilet Rental Market?

The market was worth USD 3.8 billion in 2025 and reaches USD 4.0 billion in 2026. Value covers rental and servicing of portable sanitation units across all types.

How large will the Portable Toilet Rental Market be by 2036?

MMA forecasts USD 7.0 billion by 2036, an increase of USD 3.0 billion across the forecast period. That represents 1.75 times the 2026 base of USD 4.0 billion.

What is the CAGR for the Portable Toilet Rental Market 2026 to 2036?

The base case compound annual growth rate is 5.8%, with a bull case at 7.0% and a bear case at 4.6%. Historical growth from 2020 to 2025 ran at 4.7%.

Which segment is growing fastest?

Restroom trailers and luxury units grow at 8.7%, half again the market rate of 5.8%. Events pay for flushing fixtures and climate control that standard cubicles cannot provide.

Who are the major companies in the Portable Toilet Rental Market?

United Site Services, Boels Rental, Loxam Group, National Construction Rentals, and Algeco lead. Together they hold 29% of revenue, though local route density matters far more than national scale.

Which country is growing fastest?

Saudi Arabia grows at 11.4%, the fastest of any country covered here. Giga-project construction employs site populations no other region approaches, and worker welfare requirements are now genuinely enforced.

Report Segmentation Architecture

The full report scope spans multiple orthogonal segmentation dimensions, with cross-tabulated demand data provided for each dimension pair. Coverage extends further to regional breakdowns, trend trajectories, and the competitive detail needed to support segment-level decision-making.

By Unit Type

  • Restroom Trailers and Luxury Units
  • Accessible and Compliant Units
  • Handwash and Hygiene Stations
  • Deluxe Flushing and Solar Units
  • Standard Single Portable Units
  • Urinal Banks and High Capacity Units

By End-Use Industry

  • Commercial and Residential Construction
  • Infrastructure and Civil Engineering
  • Events, Festivals and Hospitality
  • Mining and Remote Operations
  • Agriculture and Seasonal Labour
  • Emergency Response and Disaster Relief

By Commercial Dimension

  • Direct Contractor Contracts
  • Equipment Rental Group Bundling
  • Event Organiser and Promoter Hire
  • Public Sector and Municipal Contracts
  • Subcontracted Regional Servicing
  • Online Booking and Short Term Hire

By Region

  • North America
  • Western Europe
  • East Asia
  • South Asia and Pacific
  • Middle East and Africa
  • Latin America
  • Eastern Europe

Scope, Methodology, and Coverage

Every figure in this report is reproducible from documented input assumptions. The scope below maps the historical period, the forecast horizon, the segmentation dimensions, and the countries covered, alongside the underlying primary and qualitative methodology.
Historical Period
2020 to 2025
Forecast Period
2026 to 2036
Base Year
2025 (USD billions; MMA Primary Research Dataset, September 2026)
Market Definition
This market covers the rental and servicing of portable sanitation units, across restroom trailers and luxury units, accessible and compliant units, handwash and hygiene stations, deluxe flushing and solar units, standard single portable units, and urinal banks and high capacity units. Delivery, servicing, and waste removal are counted within the unit rented. It excludes consumer purchased camping and caravan toilets, permanent modular washroom buildings, unit manufacture and outright sale, and standalone vacuum tanker haulage.
Quantitative Units
USD billions, rental and servicing revenue at operator selling price
Segmentation Dimensions
Unit type, end-use industry, commercial dimension, region
Regions Covered
North America, Western Europe, East Asia, South Asia and Pacific, Middle East and Africa, Latin America, Eastern Europe
Countries Covered
United States, Canada, Mexico, Germany, United Kingdom, France, Netherlands, Belgium, Italy, Spain, Sweden, Poland, Czechia, China, Japan, South Korea, India, Australia, Indonesia, Vietnam, Saudi Arabia, United Arab Emirates, Qatar, Egypt, South Africa, Kenya, Brazil, Chile, Colombia, Peru
Key Companies Profiled
United Site Services, Boels Rental, Loxam Group, National Construction Rentals, Algeco, ASAP Site Services, Sunbelt Rentals, Herc Rentals, Speedy Hire, HSS Hire, Kiloutou, Cramo, Ramirent, GAP Group, Nixon Hire, Site Equip, Andy Loos, Mr John, Texas Outhouse, Diamond Environmental Services
Quantitative Methodology
Primary survey, n=3,800 respondents, Q4 2025, six countries; demand-side model with trade association cross-validation
Qualitative Methodology
47 expert interviews, Q4 2025; applied to validate demand model assumptions, identify emerging dynamics, and assess competitive positioning
Report Format
PDF and XLSX data workbook (Word format preview document)
Publisher
Market Minds Advisory
Report Code
MMA-2026-CON-341
Published
September 2026
Contact
sales@marketmindsadvisory.com | www.marketmindsadvisory.com

Purchase the full Portable Toilet Rental Market Report (2026 to 2036).

The full report sizes the portable toilet rental market across six unit types, seven regions, and thirty countries, with forecasts to 2036 under base, bull, and bear cases. It sets out why route density rather than unit specification determines profitability, quantifies the gap between contracted servicing frequency and actual site usage, and examines how a separated buyer and user leaves service quality without any feedback loop. Competitive analysis covers twenty participants evaluated consistently on category revenue, with detailed treatment of acquisition patterns and territory overlap. Cost structure, distance economics, and fleet seasonality are analysed throughout. Primary research includes 3,800 survey responses and 47 expert interviews.
Six unit types sized and forecast separately
Twenty participants evaluated on category revenue consistently
Route density economics modelled against depot distance and stop spacing
Servicing frequency compared against measured site usage intensity
Acquisition patterns analysed by territory overlap and integration outcome
Fleet seasonality assessed across construction and event demand

Built For The People Who Decide

From boardroom strategy to bench-side execution, this report is read cover-to-cover by leaders shaping the next decade of their industry, turning demand scenarios, market dynamics and valuation benchmarks into decisions.
CXOs/ Presidents/ VPs/ Managers
M&A and Corporate Development
Strategy Teams and R&D Heads
Procurement and Product Directors
Regulatory and Compliance Leaders
Investor Relations and Equity Analysts