Market Minds Advisory
Polyurethane Precursor Market

Polyurethane Precursor Market: Phosgene as a Moat, and What Happens If It Goes

One company has entered isocyanates at scale in fifty years, because the chemistry runs on phosgene and no regulator anywhere issues that permit lightly, which is the entire competitive structure of this business.

Lead Analyst

Bilal Shaikh

Published

September 2026

Make Smarter Decisions with Customized Research Insights

Request a free sample report and evaluate market opportunities, growth trends, and competitive dynamics relevant to your business needs.

2025 MARKET VALUE$42.6BMarket Size 2025
2036 FORECAST VALUE$74.4BBase Case , 2026 to 2036
CAGR 2026 TO 20365.2 %Bull 6.4% / Bear 4.0%
INCREMENTAL OPPORTUNITY$29.6BNet 10- year value creation
EXPANSION MULTIPLE1.66x2036 value over 2026 base
Strategic Levers
M&A Pipeline
Regional Outlook
Country Rankings
Competitive Intelligence
Segmental Deep-dive
Call-Us : 91 93563 13602

Executive Snapshot and Market Trajectory

Making isocyanate means handling phosgene, and no regulator issues that permit lightly. Five producers hold 68% of world capacity as a result, and one company has entered at scale in fifty years. That is the whole competitive structure. Nobody is arriving to change it.
The two large isocyanates are heading in opposite directions. Methylene diphenyl diisocyanate grows with rigid insulation foam, which now takes 37% of precursor demand and rises with building energy codes across every major economy. Toluene diisocyanate is tied to flexible slabstock for furniture and mattresses, where growth tracks household formation and very little else, and that gap keeps widening. Producers weighted toward the first are in a better business.
The polyol side is a different business entirely. Polyether polyols are made from propylene oxide with no comparable permitting barrier, and competition is correspondingly open. Recycled and bio-based polyols grow at 7.8%, half again the market rate of 5.2%, on furniture and mattress recycled content requirements. East Asia holds 44% of value, far above the usual band. Everyone knows where the money sits. Nobody calls themselves a polyurethane company on a polyol plant alone.
Market Definition
Chemical precursors used to manufacture polyurethanes, spanning aromatic and aliphatic isocyanates and polyether, polyester, recycled and bio-based polyols, measured at producer selling price. Excludes finished polyurethane foams, elastomers, coatings, adhesives and sealants, propylene oxide and toluene sold as such, polyol sweeteners, and thermoplastic polyurethane resin.
Base Year Value
$42.6B in 2025 (MMA Primary Research Dataset, August 2026)
Forecast Period
2026 to 2036, eleven discrete annual values
CAGR
5.2% base case. Bull 6.4%. Bear 4.0%.
Fastest Growth Segment
Recycled and Bio-Based Polyols: 7.8% CAGR
Fastest Growth Country
India: 8.0% CAGR
Fastest Growth Region
South Asia and Pacific: 7.4% CAGR
Largest Region
East Asia: 44% of 2025 global value
Market Leaders
Wanhua Chemical, BASF, Covestro, Dow, Huntsman. Source: MMA Primary Research Dataset, July 2026.
Primary Survey
n=3,800 procurement and R&D decision-makers, Q4 2025, six countries
Methodology
Demand-side build-up, cross-validated against public data, 47 expert interviews

Polyurethane Precursor Market Forecast Scenarios

polyurethane-precursor-market-trends-size-forecast-scenario-1787580664140
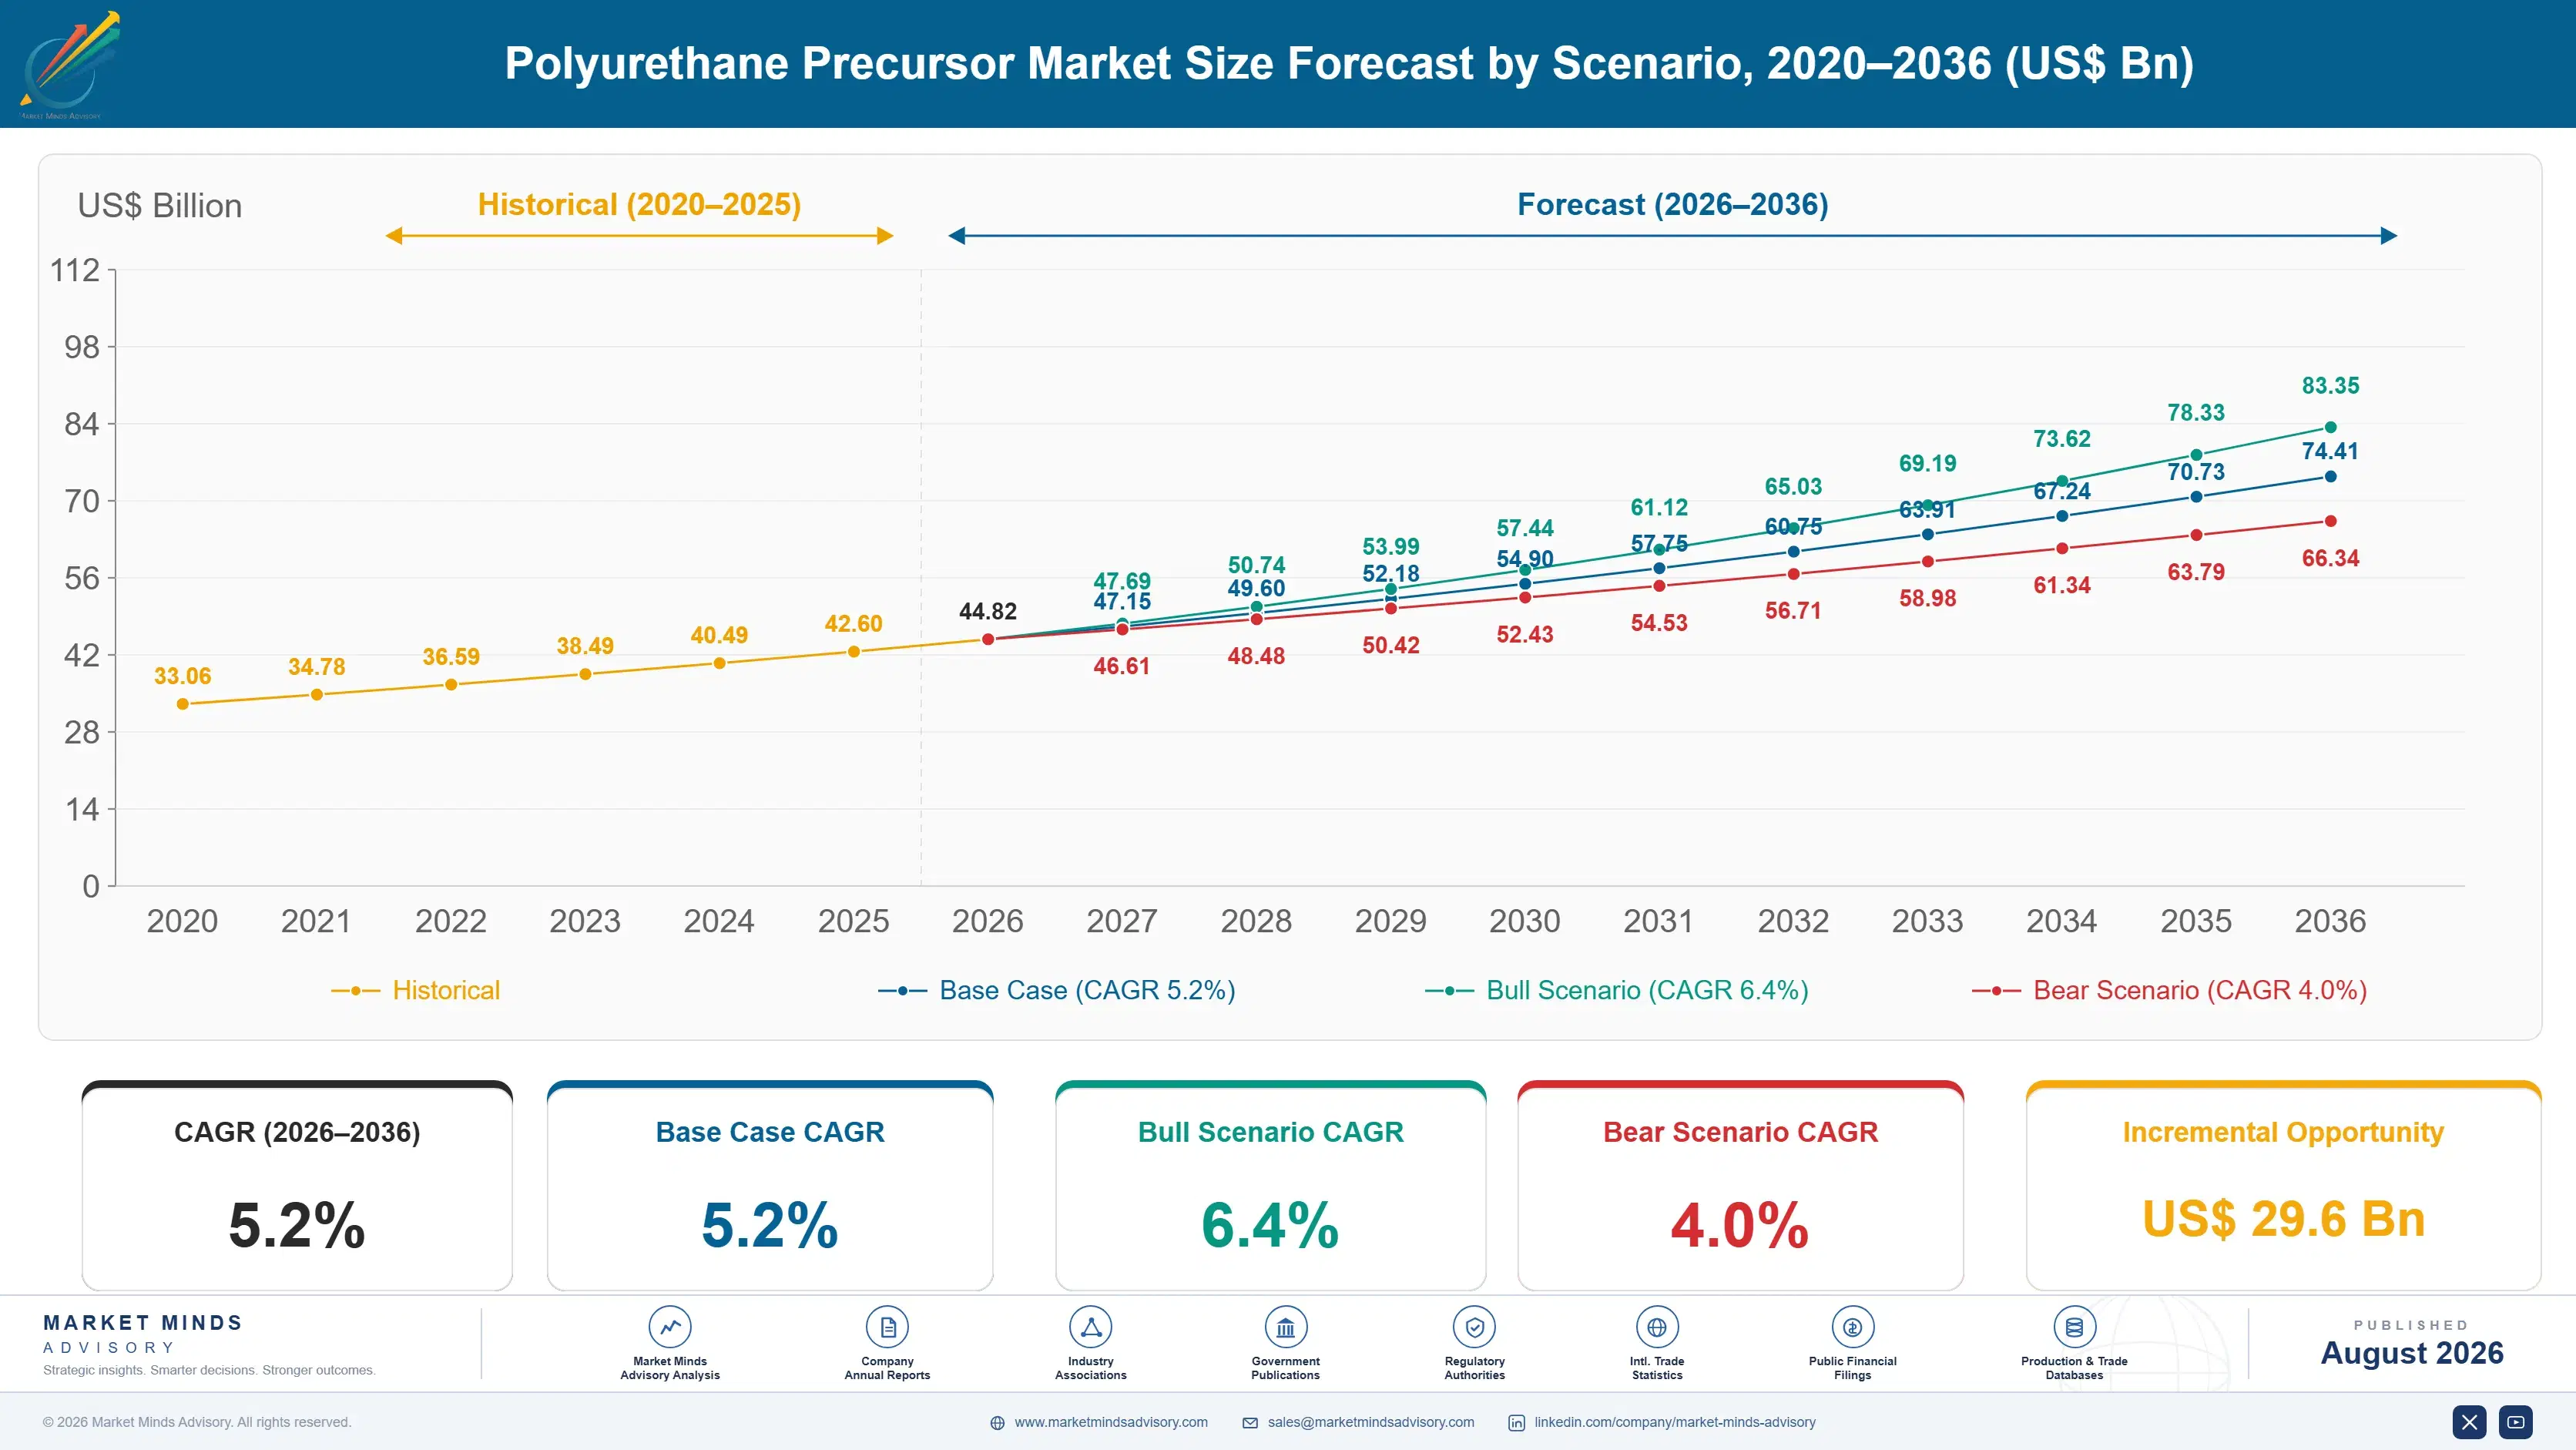
Growth ran near 4.1% between 2020 and 2025 through a period when construction and furniture demand moved in opposite directions repeatedly. Chinese isocyanate capacity expanded steadily throughout, pushing operating rates toward 79% and compressing margins that had historically been protected by scarcity. European producers faced energy costs that made their positions temporarily untenable, and several units ran below economic rates for extended stretches.
Base case 5.2% rests on three mechanisms. Building energy codes across Europe, China and North America keep raising insulation requirements, and rigid polyurethane board delivers thermal performance per millimetre that alternatives cannot match in constrained cavities. Furniture and mattress recycled content requirements are creating demand for recycled polyols that did not previously exist commercially. And Indian and Southeast Asian construction and appliance demand is deepening from a low per capita base.
The bull case at 6.4% assumes a non-phosgene isocyanate route stays uncommercialised while insulation demand accelerates, preserving both the pricing structure and the growth. The bear case at 4.0% is continued Chinese capacity addition into slower construction demand, pushing operating rates below current levels and eroding the pricing that the permitting barrier has always supported.

A Moat Built Out of Phosgene

Isocyanate manufacture requires phosgene, a gas used as a chemical weapon in the First World War and regulated accordingly ever since. Building a phosgenation plant means an environmental permit that regulators in most jurisdictions grant reluctantly, alongside safety systems, emergency response infrastructure and community consent that take years to assemble. The result is 68% of world capacity in five hands, which is remarkable for a commodity chemical.
TOP FIVE CONCENTRATION68%Phosgene permitting keeps the isocyanate field extremely narrow
RIGID FOAM SHARE37%Portion of precursor demand going into insulation applications
PROPYLENE OXIDE COST SHARE58%Share of polyether polyol cost carried by the oxide
NEW ENTRANTS AT SCALE1Producers entering isocyanates at scale in fifty years
ISOCYANATE OPERATING RATE79%Utilisation across the world isocyanate production capacity base
RECYCLED POLYOL PENETRATION3%Share of polyol demand met from recycled or bio feedstock
Wanhua is the exception that proves how hard entry is. It built MDI capability in China from a licensed base through the 1990s and 2000s and is now the largest producer in the world, and it remains the only company to have managed that in half a century. Everyone else in isocyanates has been there for decades, and the incumbents have generally expanded rather than been challenged.
The polyol half of this market works nothing like that. Polyether polyols come from propylene oxide and glycerol or sugar-based initiators, with no comparable permitting obstacle, so competition is open and margins are thin. Producers who describe themselves as polyurethane companies usually mean they hold isocyanate capacity, because that is where the defensible position sits and everyone in the industry knows it.
"This industry's returns are a permitting artefact, not a technology one. The chemistry has been public for eighty years and the barrier is that nobody wants a phosgene plant near their town, which is a moat right up until somebody commercialises a route that does not need one."
Director, Petrochemicals and Polymers Practice · MMA Chemicals and Materials Practice · August 2026

Market Trends

Non-phosgene isocyanate routes progressing toward commercial viability

Carbamate thermolysis and oxidative carbonylation routes to isocyanate without phosgene have been researched for decades, and Asahi Kasei commercialised a non-phosgene route for aliphatic isocyanate some years ago. Extending that to the aromatic isocyanates that carry most volume remains unsolved at commercial cost, but the work continues at several producers and research institutes. If it succeeds, the permitting barrier that produces 68% concentration disappears, and a chemical whose returns rest on scarcity becomes an ordinary commodity very quickly indeed. Nobody in the industry treats this as urgent, and the timeline is exactly the sort that surprises people.
Market Impact: Grows recycled polyols 7.8% annually

Insulation codes pulling rigid foam demand away from flexible

Building energy requirements across the European Union, China and North America keep raising mandated thermal performance, and rigid polyurethane board delivers more insulation per millimetre than mineral wool or polystyrene in cavities where thickness is constrained. Rigid foam now takes 37% of precursor demand and grows with published code schedules. Flexible slabstock for furniture and mattresses grows with household formation, which is far slower everywhere. The gap between methylene diphenyl and toluene diisocyanate demand widens every year that this continues. Producers weighted toward methylene diphenyl diisocyanate are in a materially better position than those weighted the other way.
Market Impact: Delivers 8.0% annual Indian growth

Market Opportunities and Growth Drivers

Furniture and mattress recycled content requirements creating polyol demand

Extended producer responsibility schemes for furniture and mattresses across France, the Netherlands and several American states are setting recycled content expectations that manufacturers cannot meet with virgin polyol. Glycolysis of end-of-life foam recovers polyol suitable for reuse in flexible applications, and chemical recyclers are commissioning capacity against contracted offtake. Recycled and bio-based polyols currently supply about 3% of polyol demand and grow at 7.8% on this mechanism alone. Collection infrastructure for bulky mattress waste is the practical constraint on going faster. Regulatory schedules imply considerably more penetration than exists today.
Market Impact: Pushes operating rates to 79%

Indian construction and appliance demand deepening from a low base

India grows fastest anywhere at 8.0%, on cold chain construction, appliance manufacturing incentives and building insulation requirements arriving in national codes for the first time. Rigid foam demand from refrigeration and cold storage is expanding faster than any other application in the country, driven by agricultural supply chain investment. Domestic isocyanate capacity is limited, leaving India a substantial net importer that every regional producer targets. Southeast Asian demand across Vietnam, Indonesia and Thailand follows similar construction and appliance patterns at smaller scale. Cold chain rather than buildings is the demand that matters most.
Market Impact: Exposes 58% of polyol cost

Market Restraints and Challenges

Chinese capacity addition eroding the scarcity that supported pricing

Chinese isocyanate capacity has expanded steadily while global demand grew more slowly, pushing operating rates to roughly 79% and compressing margins that scarcity historically protected. The root cause is that the permitting barrier which keeps new entrants out does not prevent existing producers from expanding, and Chinese regulatory processes have been more accommodating than European or American ones. Commercially it means concentration no longer guarantees pricing power. Producers are responding by weighting portfolios toward specialty and aliphatic grades where competition remains genuinely limited. The barrier keeps entrants out and does nothing about the incumbents.
Market Impact: Threatens 68% concentration position

Propylene oxide volatility transmitting directly into polyol margins

Propylene oxide accounts for roughly 58% of polyether polyol cost, and it sits downstream of a propylene chain that has itself become volatile as on-purpose production replaced by-product supply. The root cause is that polyol conversion adds little value, so the polyol price is essentially oxide plus a thin processing margin. Polyol producers holding fixed contracts through an oxide move absorb the whole swing. Integrated producers making their own oxide are insulated, which is most of why the polyol business consolidated as it did. Merchant polyol producers have been leaving the business steadily.
Market Impact: Lifts rigid foam past 37% share
3 additional market trends, 4 additional growth drivers, and 2 additional restraints and challenges are covered in the full report. Contact sales@marketmindsadvisory.com to access the complete intelligence.

Segment CAGR and Growth Architecture

Six segments split by precursor chemistry, because chemistry determines the permitting barrier, the achievable margin and the applications a producer can serve. Isocyanates and polyols are effectively separate industries that happen to sell into the same downstream reaction. Application and channel splits sit in the framework instead of here. Confusing them is how this market gets misread.
polyurethane-precursor-market-trends-market-share-analysis-1787580664693

Recycled and Bio-Based Polyols

Growing at 7.8%, half again the market rate of 5.2%, this segment covers polyol recovered by glycolysis of end-of-life polyurethane foam and polyol made from vegetable oil or other bio feedstock. Growth comes from furniture and mattress producer responsibility schemes rather than from any cost advantage, since recovered polyol prices above virgin in most conditions. Quality consistency is the technical obstacle, because recovered material carries variable functionality and hydroxyl number that formulators must design around. Capacity is being commissioned against contracted offtake rather than speculatively. Penetration sits near 3% and the regulatory schedules imply considerably more. Collection infrastructure for bulky end-of-life foam is the practical obstacle, and it is the part most projects underestimate.
CAGR 7.8%

Aliphatic Isocyanates

At 6.9% aliphatic isocyanates including hexamethylene and isophorone diisocyanate serve applications where ultraviolet stability matters, principally automotive refinish and industrial coatings that must not yellow. Volumes are small against the aromatic isocyanates and prices run several times higher, because the synthesis is more demanding and the customer base tolerates it. Competition is narrower than in aromatics, with a handful of producers holding most capacity, and Asahi Kasei operates the only significant non-phosgene route in commercial service. Growth follows automotive production and industrial coating demand rather than construction cycles at all. Qualification into an approved coatings system is slow and effectively permanent, which makes the positions here the most defensible in the whole market.
CAGR 6.9%
Full segment breakdown across 6 segments available in the complete report.

Regional Architecture and Country Demand Map

East Asia holds 44% of value, far above its usual band, because Chinese capacity and construction demand dominate together and Wanhua is the largest isocyanate producer anywhere. North America at 18% and Western Europe at 17% sit below their bands after several years of energy-driven cost pressure.

North America

American producers hold isocyanate positions built decades ago on Gulf Coast sites where phosgene permitting is established and would be almost impossible to replicate today. The 18% share sits below the usual band because demand growth has shifted toward Asia rather than because capacity has weakened. Dow, Huntsman and BASF operate most of the capacity. Construction insulation demand is growing on energy code updates, though more slowly than in Europe, and appliance and cold chain demand adds steadily. Mexican polyurethane conversion has grown with nearshoring, drawing precursor volume from Gulf Coast supply. Existing permits are worth more than any plant, and none of them could be obtained again today. Nothing about that changes.
Share: 18% | CAGR: 4.2% (2026 to 2036)

Western Europe

European producers hold strong technology positions and difficult cost positions simultaneously, and the 17% share sits below the usual band as energy costs bit through the last several years. Covestro and BASF operate substantial capacity in Germany and Belgium with phosgene permits that no new entrant could obtain now. What Europe has that others lack is regulatory demand: renovation wave insulation requirements and furniture producer responsibility schemes both create demand that regulation rather than economics generates. Aliphatic isocyanate and specialty polyol positions are stronger here than anywhere except Japan. Regional share sits below its usual band on cost rather than capability, and the technology positions here remain the strongest outside Japan.
Share: 17% | CAGR: 3.5% (2026 to 2036)
Regional intelligence for 5 additional markets available in the complete report: East Asia, South Asia and Pacific, Latin America, Middle East and Africa, Eastern Europe. Contact sales@marketmindsadvisory.com.
polyurethane-precursor-market-trends-country-cagr-analysis-1787580665221

Four Moves Around a Permit

Returns in this industry come from holding a phosgene permit and from what a producer chooses to make with it. Polyol production is an open competition where propylene oxide integration decides everything. The levers that matter all involve either protecting the isocyanate position or escaping the polyol commodity trap. Nothing else changes the outcome much.

Weight isocyanate output toward specialty and aliphatic grades

Chinese capacity expansion has pushed operating rates to 79% and eroded the pricing that scarcity historically supported in standard aromatic grades. Aliphatic isocyanates grow at 6.9% and sell at several times the price, into coatings customers who qualify a supplier and rarely change afterwards. Converting or adding aliphatic capacity costs perhaps 180 million dollars for a world-scale unit and takes four years including permitting. Producers who made that shift earlier hold coatings positions that are far harder to contest than commodity rigid foam volume. Permitting is the slow part, not construction.
Market Impact: Costs $180 million for each aliphatic unit built

Secure propylene oxide integration for polyol production

Propylene oxide is 58% of polyether polyol cost and the propylene chain behind it has become volatile as on-purpose production replaced by-product supply. A polyol producer without oxide integration carries the entire swing on a thin processing margin, which is most of why the polyol business consolidated toward integrated players. Where integration is unavailable, multi-year oxide supply on defined terms removes most of the exposure at modest premium. Producers on spot terms through the last cycle largely exited the business. Integration decides who stays in polyols. Very few merchant buyers remain.
Market Impact: Covers 58% of the polyol cost exposure directly

Commission glycolysis capacity against furniture offtake

Furniture and mattress producer responsibility schemes are setting recycled content expectations that virgin polyol cannot satisfy, and glycolysis of end-of-life foam recovers usable material. Recovered polyol prices above virgin, so plants are financed on contracted offtake from manufacturers facing an obligation rather than on merchant economics. Penetration sits near 3% against regulatory schedules implying far more. Securing collection arrangements for bulky mattress waste matters as much as the plant itself, and it is the part most projects underestimate badly. Nobody builds this on merchant assumptions. Collection is the failure mode here.
Market Impact: Serves demand well beyond the 3% current penetration

Build Indian supply position ahead of local capacity

India grows at 8.0% with very limited domestic isocyanate capacity, importing the majority of its requirement through a fragmented converter base that values technical support and credit terms above landed price. Cold storage construction is the largest single demand driver there, ahead of building insulation. Establishing local warehousing, formulation support and credit infrastructure costs relatively little and produces positions that survive the arrival of domestic capacity, because converters who have been supported stay supported. Cold storage rather than building insulation is the demand to organise around, and it is expanding on national programme schedules rather than on private construction cycles.
Market Impact: Serves 8.0% annual growth in Indian import demand

Who Controls the Margin Pool

Participation is measured on annual precursor production capacity, and the top five hold 68%. That is extraordinary concentration for a commodity chemical and it exists because phosgene permitting keeps new entrants out rather than because scale or technology does. Wanhua and BASF lead, with Wanhua the only company to enter isocyanates at scale in fifty years. The gap to challengers is a permit, not a plant.
Competition runs quite differently on each side of the business. In isocyanates it is about capacity expansion by incumbents, since nobody new arrives, and increasingly about specialty and aliphatic grades where pricing holds. In polyols it is propylene oxide integration and processing cost, with open competition and thin margins. Producers describing themselves as polyurethane companies almost always mean they hold isocyanate capacity.

The pressure ahead is a non-phosgene route reaching commercial scale for aromatic isocyanates. Asahi Kasei operates one commercially for aliphatics already, and extending it would dissolve the permitting barrier that produces 68% concentration. Expect continued incumbent expansion and specialty repositioning rather than acquisitions. Rankings shift if that chemistry succeeds, and very little in this industry would look the same afterwards.
polyurethane-precursor-market-trends-company-positioning-matrix-1787580665743

Competitive Moat and Risk Dimensions

WANHUA CHEMICAL

Moat: Isocyanate scale and cost

Wanhua built the largest isocyanate capacity in the world from a licensed technology base, and it operates at a cost position Western producers cannot match on energy, labour and capital cost. Having crossed the permitting barrier that keeps everyone else out, it now expands within it, which compounds the advantage with every additional world-scale unit commissioned.
WANHUA CHEMICAL

Risk: Concentration in aromatic grades

The portfolio weights heavily toward standard aromatic isocyanates, exactly where its own capacity expansion has eroded the pricing that scarcity used to support. Building position in aliphatic and specialty grades means competing against European and Japanese producers with decades of coatings customer qualification behind them, on criteria where cost advantage matters considerably less.
BASF

Moat: Verbund integration across the chain

BASF produces both isocyanate and polyol within integrated sites where propylene oxide, aniline and chlorine all come from adjacent units, which removes several merchant purchase points from the cost stack. That integration is essentially impossible to assemble now, both on capital cost and because the phosgene permits underpinning those sites predate current regulatory practice entirely.
BASF

Risk: European energy cost exposure

The integrated European sites that produce the cost advantage also carry industrial energy costs well above Asian and American levels, and no demand recovery corrects that position. Relocating integration means rebuilding a Verbund elsewhere, which is a decade of capital, and running the existing one means accepting a permanent cost gap against Chinese capacity.

Players Tracked

Prominent Players

Wanhua Chemical
BASF
Covestro
Dow
Huntsman

Other Key Players

Tosoh Corporation
Mitsui Chemicals
Asahi Kasei
Shell Chemicals
Repsol
Stepan Company
Kumho Mitsui Chemicals
Hanwha Solutions
LG Chem
PCC Rokita
Sadara Chemical
Coim Group
Perstorp
Emery Oleochemicals
Mitsubishi Chemical Group

Recent Developments

MARCH 2026

European producer commissions glycolysis capacity for mattress foam recovery

A European chemical producer commissioned polyol recovery capacity using glycolysis of end-of-life mattress foam, supported by contracted offtake from bedding manufacturers facing producer responsibility obligations. Collection arrangements were secured alongside the plant rather than left to develop afterwards, which earlier projects had not done. Capacity was not disclosed publicly.
Signal: Collection infrastructure rather than process chemistry is what determines whether these foam recycling projects actually work
SEPTEMBER 2025

Chinese producer commissions further world-scale isocyanate capacity

A Chinese producer commissioned an additional world-scale methylene diphenyl diisocyanate unit, adding capacity where global operating rates already sat near the high seventies. The company cited long-term domestic and export demand growth rather than any current supply shortage as the rationale, with start-up phased across the coming year.
Signal: Incumbent expansion rather than new entry is what erodes pricing, since the permitting barrier still holds firm
JANUARY 2026

Japanese producer extends non-phosgene isocyanate route to further grades

A Japanese producer extended its commercial non-phosgene isocyanate process to additional aliphatic grades, avoiding phosgene handling entirely in the synthesis. The company has not indicated any timeline for applying the route to aromatic isocyanates, which carry the great majority of world volume. Licensing terms were not disclosed.
Signal: Every extension of non-phosgene chemistry moves closer to dissolving the barrier this industry's returns rest on

Two Chains, Two Different Problems

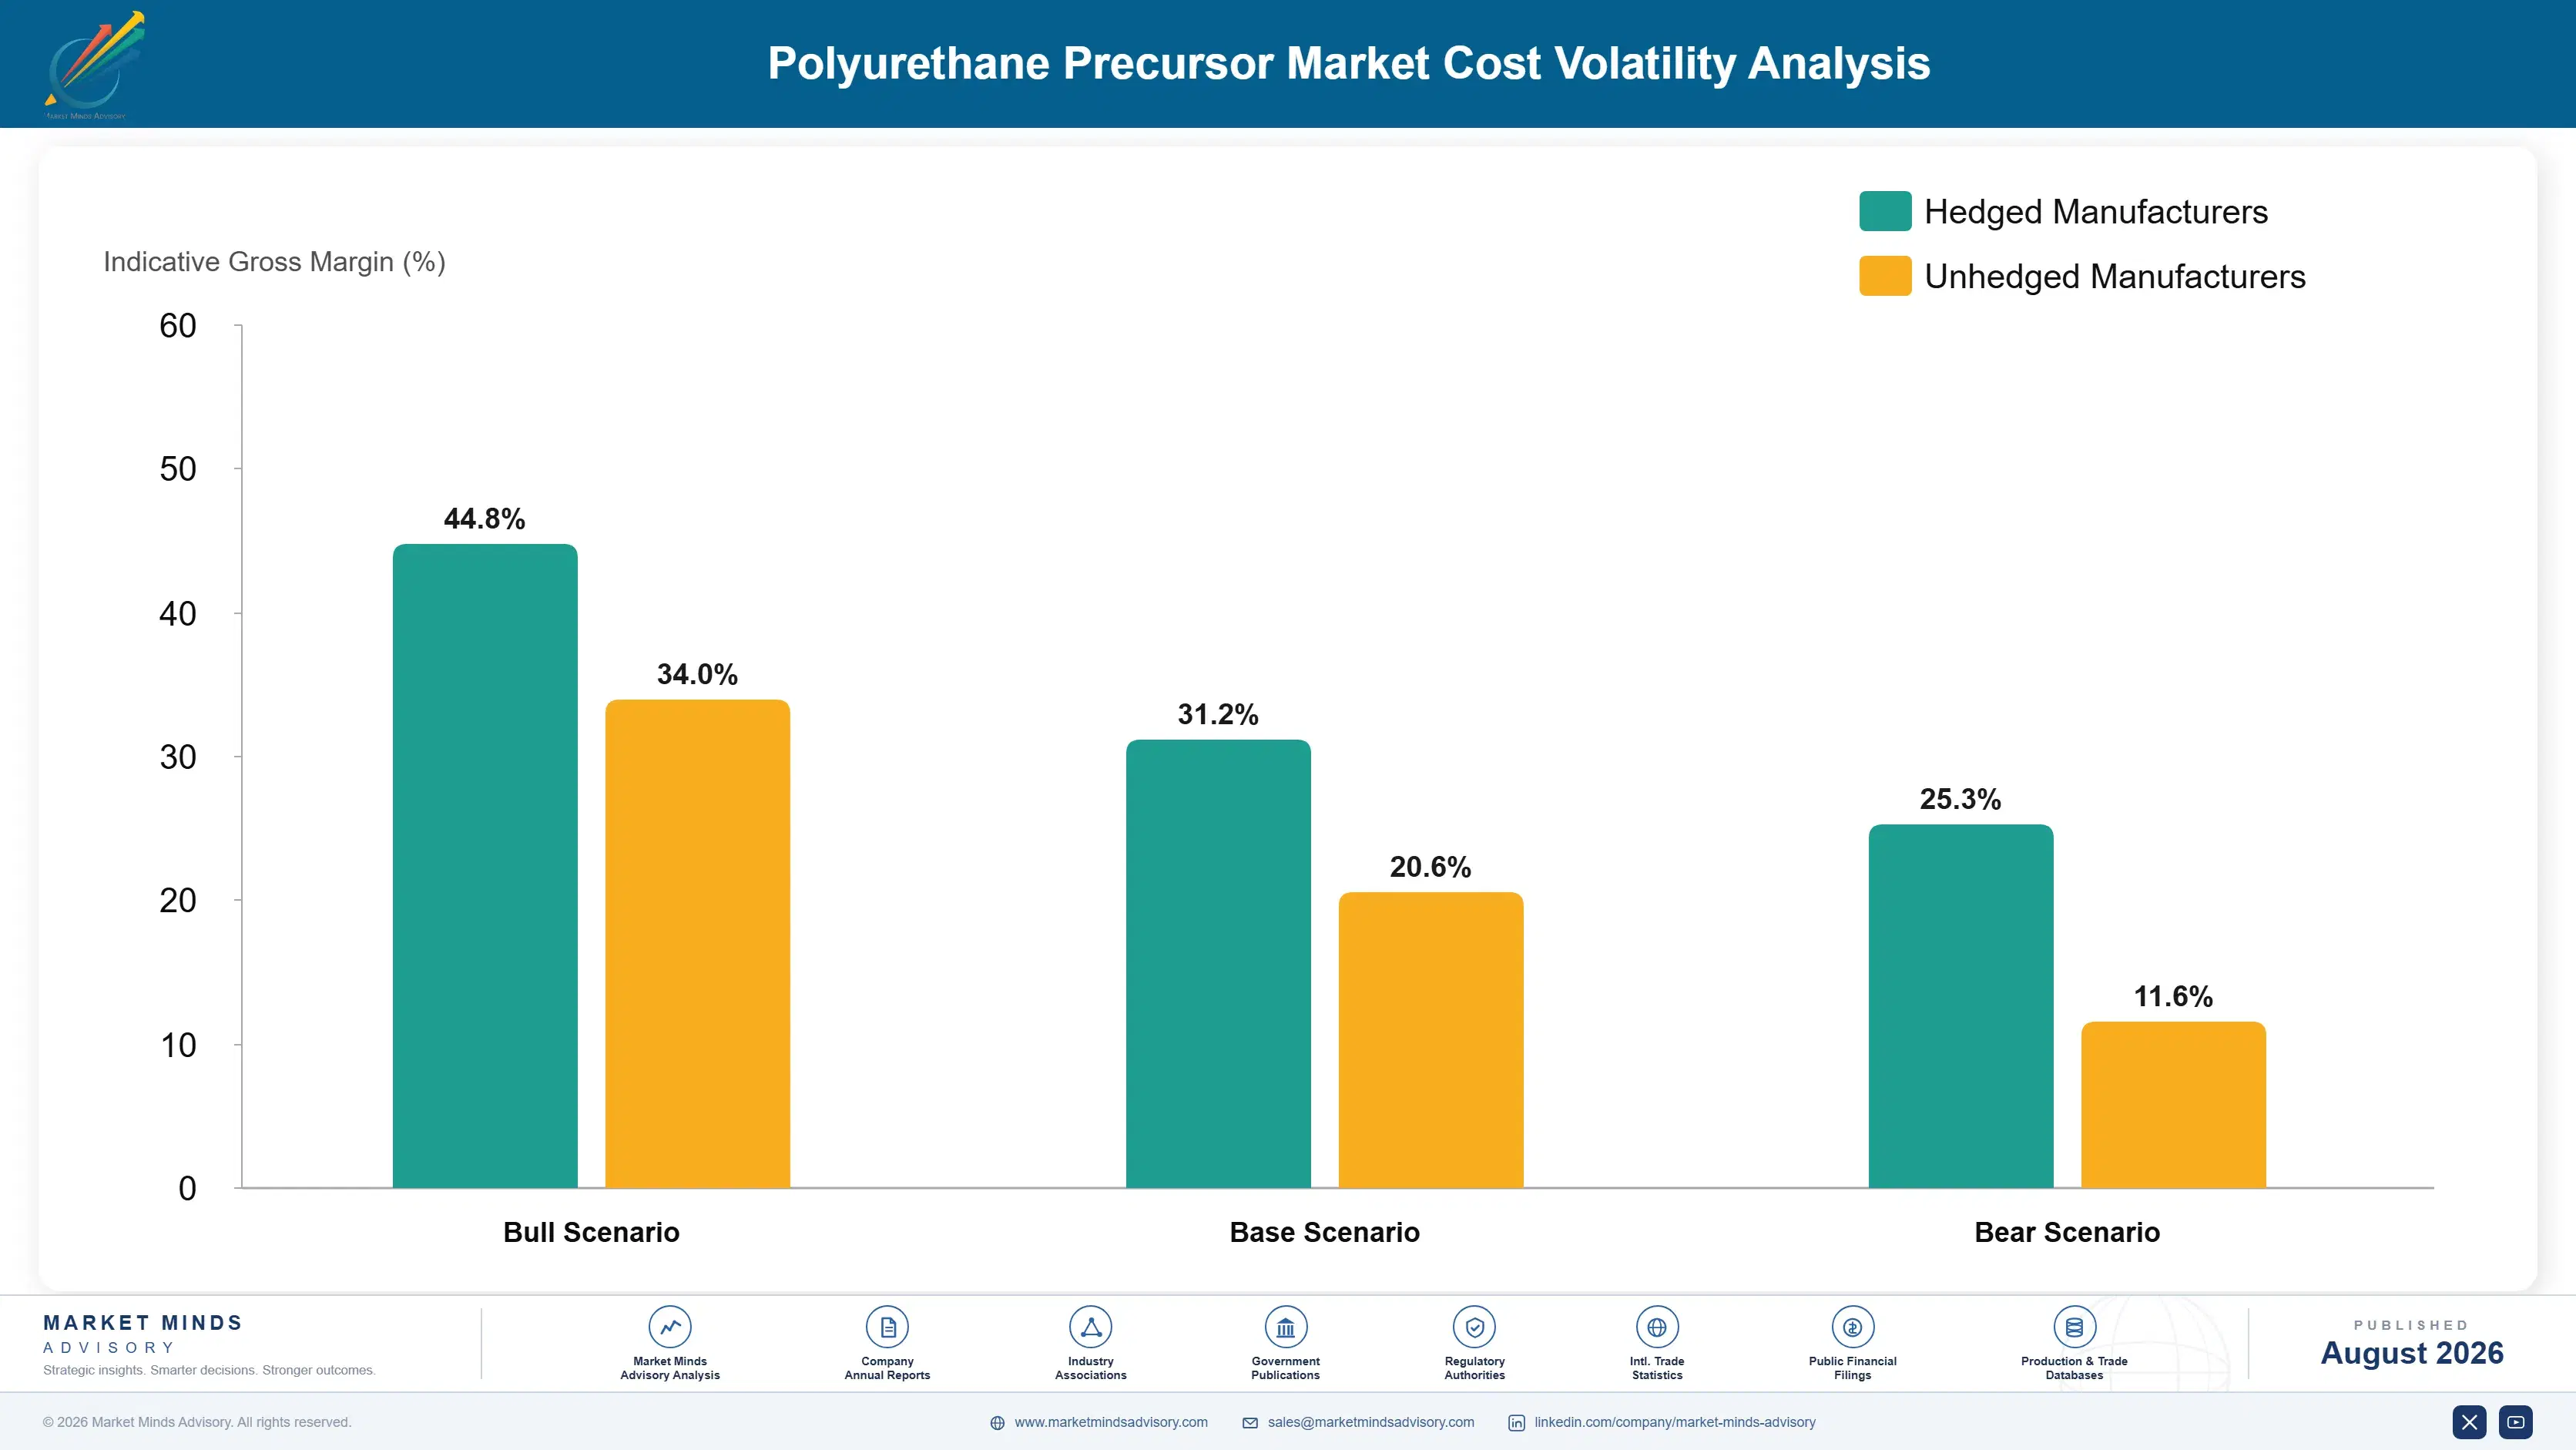
Isocyanate cost is dominated by aniline and toluene alongside chlorine for phosgene generation, with aniline from benzene and nitric acid and chlorine from electrolysis, which makes the chain electricity intensive. Polyol cost is dominated by propylene oxide at roughly 58%, with glycerol or sugar initiators adding a modest further share. Energy and utilities carry about 16% across isocyanate production and considerably less on the polyol side.
The 2022 European energy crisis hit this industry harder than most because chlor-alkali electrolysis is among the most electricity intensive processes in chemicals. European industrial power prices rose to multiples of historic levels, per IEA data on European industrial energy costs, and producers disclosed material margin compression on integrated polyurethane operations in annual reporting for that year. Several European units ran below economic rates for extended periods rather than shutting entirely.

The competitive mechanism runs through integration on both chains. An isocyanate producer generating its own chlorine and aniline within a site absorbs feedstock movement internally, while a merchant buyer carries it. On polyols the same logic applies to propylene oxide. Geography compounds both: Chinese and Gulf producers hold cost positions European sites cannot approach, which is where capacity growth has gone.
polyurethane-precursor-market-trends-cost-volatility-analysis-1787580665938

Contract industrial electricity on long tenor for electrolysis

Chlor-alkali electrolysis is among the most electricity intensive processes in chemicals, and European producers on spot power carried the entire 2022 increase while those holding long-dated supply absorbed a fraction. Long tenor costs a premium in normal conditions and functions as insurance against an event that has now occurred. Most European producers restructured energy procurement afterwards, though not all did.

Secure propylene oxide supply where integration is absent

Propylene oxide is 58% of polyether polyol cost and the propylene chain behind it has become considerably more volatile as on-purpose production replaced by-product supply. Multi-year oxide contracts on defined terms remove most of that exposure at modest premium. Producers who stayed on spot terms through the last cycle largely exited polyols, which tells its own story about the risk.

Weight production toward grades that carry real margin

Where feedstock cost cannot be improved, the remaining lever is product mix. Aliphatic isocyanates and specialty polyols carry margins that standard aromatic grades and commodity polyether cannot approach, and both involve customer qualification that limits substitution. Permitting and capital requirements make this a slow shift rather than a quick one, which suits producers who plan in decades.

Portfolio Architecture for Margin Defence

Margin here divides on which side of the business a producer sits. Commodity polyether polyol earns low double-digit margins at best, because propylene oxide sets 58% of the cost and processing adds little that a competitor cannot replicate. Integrated producers making their own oxide earn a spread that merchant buyers simply cannot access, whatever their processing efficiency happens to be. Processing efficiency cannot close a gap that size.
Standard aromatic isocyanate does considerably better, at margins in the high twenties to high thirties, though less well than it did before Chinese capacity expansion pushed operating rates to 79%. The range is wide because it depends on feedstock and energy integration, which differs enormously between an integrated European site, a Chinese complex and a merchant-fed unit anywhere. Scarcity still works here, less well than before.

Aliphatic and specialty grades hold the strongest economics, running into the high forties, because synthesis is demanding, capacity is narrow and coatings customers qualify a supplier and then stay. Those margins reflect both a permitting barrier and a qualification one, which is an unusually durable combination and explains where the industry's capital is now heading. Very few companies have crossed either barrier.

Commodity Polyether Polyols

Standard polyether polyols for flexible and rigid foam sold into open competition. The nine point range reflects propylene oxide integration, which separates producers making their own oxide from merchant buyers entirely.
Gross Margin: 9-18%

Standard Aromatic Isocyanates

Methylene diphenyl and toluene diisocyanate produced behind a phosgene permitting barrier. The eleven point range reflects feedstock and energy integration, which differs sharply between integrated European sites and Chinese complexes.
Gross Margin: 27-38%

Aliphatic, Specialty and Recycled Grades

Aliphatic isocyanates, specialty polyester polyols and recycled or bio-based polyols. The fourteen point range spans coatings-grade aliphatics with deep customer qualification through to recycled polyols still establishing quality consistency. Both barriers apply simultaneously.
Gross Margin: 34-48%
polyurethane-precursor-market-trends-portfolio-architecture-1787580666432

High-value Sub-segments and Strategic Watch-out

Aliphatic Isocyanates for Coatings

High value and growing at 6.9% on automotive refinish and industrial coating demand. Narrow competition, demanding synthesis and customer qualification that rarely changes once established. Permitting and qualification barriers reinforce each other in a way nothing else here matches. Capital is visibly moving toward this position.
Gross Margin: 42-48%

Recycled and Bio-Based Polyols

High value, fastest growth at 7.8%, and financed entirely on producer responsibility obligations rather than economics. Penetration near 3% against regulatory schedules implying far more. Collection infrastructure for bulky foam waste is the real constraint on scaling. Quality consistency is the technical obstacle. Offtake finances everything.
Gross Margin: 30-42%

Standard Aromatic Isocyanates

The volume core and still the most profitable large-scale position in the industry. Phosgene permitting keeps new entrants out entirely, though incumbent expansion has eroded the pricing scarcity once supported. Operating rates near 79% now cap what any producer can charge. Expansion by incumbents is the only real threat.
Gross Margin: 27-38%

Merchant-Fed European Polyol Capacity

The strategic watch-out. Buying propylene oxide at merchant prices while carrying European energy costs leaves very little processing margin in any conditions. The range includes periods of outright loss, and consolidation into integrated hands looks like the realistic outcome. Consolidation has already begun in this tier.
Gross Margin: 4-14%

Where the Volume Comes Back

Insulation demand behaves like an annuity tied to construction codes rather than to any purchasing choice. A rigid foam system meeting a mandated thermal performance value is specified on every project built to that code, at volumes calculated rather than negotiated, for as long as the code stands. Rigid foam takes 37% of precursor demand and code schedules are published years ahead, which makes it the most forecastable application in this market by some distance.
Stickiness varies enormously across applications. Coatings customers using aliphatic isocyanate are stickiest, since the material sits inside an approved automotive refinish system that takes years to requalify. Appliance and cold chain foam systems come next, held by product qualification and thermal performance testing. Flexible slabstock producers switch on price within specification. Commodity polyether polyol is close to spot business in character throughout.

The specifying buyer has moved further from the producer over time. Precursor selection sat with foam system houses choosing on reactivity and cost. Building code thermal values and furniture producer responsibility obligations now sit with architects and brand owners who never buy precursor at all, which means the real customer is increasingly a standard or a compliance schedule rather than a formulator.
polyurethane-precursor-market-trends-end-use-penetration-index-1787580666919

Where We Would Commit Capital

These are among the four positions where our research anticipates prominent divergence between winners and laggards over the coming forecast period. Each is grounded in the demand model, the regulatory perimeter, and the announced capacity pipeline.
01 / SPECIALTY GRADE REPOSITIONING

Move isocyanate capacity toward aliphatic and specialty output

Chinese expansion has pushed operating rates to 79% and eroded the pricing that scarcity once supported in standard aromatic grades, while aliphatic isocyanates grow at 6.9% and sell at several times the price into coatings customers who rarely change supplier. A world-scale aliphatic unit costs roughly 180 million dollars and takes about four years including the permitting work. Producers who began that shift earlier hold qualified coatings positions that commodity rigid foam volume can never match for defensibility at any scale.
02 / OXIDE INTEGRATION SECURITY

Integrate propylene oxide or contract it on long terms

Propylene oxide is 58% of polyether polyol cost and the propylene chain behind it has become volatile as on-purpose production replaced by-product supply from crackers and refineries. A polyol producer without integration carries that entire swing on a thin processing margin, which is most of why this business consolidated toward integrated players in the first place. Producers who stayed on spot terms through the last cycle have very largely exited polyol production altogether, which tells its own story about the exposure.
03 / FOAM RECYCLING CAPACITY

Secure collection arrangements alongside any glycolysis plant

Furniture and mattress producer responsibility schemes set recycled content expectations that virgin polyol cannot meet, and glycolysis of end-of-life foam recovers material that is genuinely usable in flexible applications. Penetration sits near 3% against regulatory schedules implying considerably more, which means the demand is both real and already contracted. The failure mode here is collection rather than process chemistry, because bulky mattress waste needs gathering arrangements that most projects underestimate badly and then discover far too late to fix properly.
04 / INDIAN IMPORT POSITION

Build local support before domestic capacity eventually arrives

India grows at 8.0% with very limited domestic isocyanate capacity, importing most of its requirement through a fragmented converter base that values technical support and credit terms well above landed price. Cold storage construction rather than building insulation is comfortably the largest single demand driver in that market. Local warehousing, formulation support and credit infrastructure cost relatively little and produce positions that survive domestic capacity arriving, because converters who have been properly supported tend to stay exactly where they are.

Engagement Snapshot From the Field

A live engagement with an industry participant carrying material or product regulatory and market exposure ahead of a defining policy shift, showing how our research translates into a defensible multi-year portfolio strategy.
MARKET MINDS ADVISORY · CLIENT ENGAGEMENT SUMMARY
Polyurethane Precursor Producer Strategic Portfolio Review and Transition Roadmap 2026·Investment Scenario on Polyurethane Precursor Exposure Evaluation 2025-26
CLIENT PROFILE
A European polyurethane systems producer operating polyether polyol capacity and purchasing isocyanate on merchant terms, with divisional revenue near 890 million euros across flexible and rigid foam systems (client-reported, unverified by MMA). Roughly two thirds of volume went into flexible slabstock for furniture and bedding customers concentrated in Poland, Germany and Italy. Isocyanate had never been produced in house.
STRATEGIC CHALLENGE
Polyol margins had compressed steadily as propylene oxide pricing moved and European energy costs rose, while furniture producer responsibility obligations were arriving in the group's two largest markets. Management needed to decide whether to invest in glycolysis capacity, pursue oxide integration, or exit polyol production and become a formulator buying both precursors.
MMA APPROACH
MMA modelled propylene oxide pricing under three propylene supply scenarios, benchmarked the client's polyol conversion cost against integrated European and Chinese producers, and quantified recycled content obligations across furniture schemes in six markets. Glycolysis economics were tested against contracted and merchant offtake assumptions. Interviews with 47 experts covered polyol production, foam recycling technology and furniture manufacturer compliance planning.
KEY FINDINGS
  1. The client's polyol conversion cost sat above integrated European producers in every scenario modelled, and the gap widened when propylene oxide pricing rose rather than narrowing.
  2. Furniture producer responsibility obligations in the two largest markets would require recycled content that virgin polyol could not satisfy from the 2028 compliance year onward.
  3. Glycolysis capacity cleared cost of capital against contracted offtake from bedding manufacturers, and failed to clear it on merchant assumptions at any modelled oxide price.
  4. Collection arrangements for end-of-life mattresses were unsecured in three of the six markets examined, and represented a larger project risk than the process technology itself.
CLIENT PROFILE
A European polyurethane systems producer operating polyether polyol capacity and purchasing isocyanate on merchant terms, with divisional revenue near 890 million euros across flexible and rigid foam systems (client-reported, unverified by MMA). Roughly two thirds of volume went into flexible slabstock for furniture and bedding customers concentrated in Poland, Germany and Italy. Isocyanate had never been produced in house.
STRATEGIC CHALLENGE
Polyol margins had compressed steadily as propylene oxide pricing moved and European energy costs rose, while furniture producer responsibility obligations were arriving in the group's two largest markets. Management needed to decide whether to invest in glycolysis capacity, pursue oxide integration, or exit polyol production and become a formulator buying both precursors.
MMA APPROACH
MMA modelled propylene oxide pricing under three propylene supply scenarios, benchmarked the client's polyol conversion cost against integrated European and Chinese producers, and quantified recycled content obligations across furniture schemes in six markets. Glycolysis economics were tested against contracted and merchant offtake assumptions. Interviews with 47 experts covered polyol production, foam recycling technology and furniture manufacturer compliance planning.
KEY FINDINGS
  1. The client's polyol conversion cost sat above integrated European producers in every scenario modelled, and the gap widened when propylene oxide pricing rose rather than narrowing.
  2. Furniture producer responsibility obligations in the two largest markets would require recycled content that virgin polyol could not satisfy from the 2028 compliance year onward.
  3. Glycolysis capacity cleared cost of capital against contracted offtake from bedding manufacturers, and failed to clear it on merchant assumptions at any modelled oxide price.
  4. Collection arrangements for end-of-life mattresses were unsecured in three of the six markets examined, and represented a larger project risk than the process technology itself.
RECOMMENDED STRATEGY
Phase 1: Phase one: secure mattress collection arrangements in the two largest compliance markets before committing any capital to glycolysis capacity at all. Phase 2: Phase two: commission glycolysis capacity against contracted bedding manufacturer offtake, rather than building it on any merchant recycled polyol assumptions. Phase 3: Phase three: exit commodity polyether production progressively as recovered polyol volumes build, while retaining full formulation and systems capability throughout.
OUTCOME
The producer secured collection arrangements in both target markets during 2025 and commissioned glycolysis capacity in 2026 against contracted offtake, reporting recovered polyol at 14% of systems volume within a year (client-reported, unverified by MMA). Commodity polyether output was reduced rather than expanded, and divisional margin improved by roughly four percentage points over the same period.

Frequently Asked Questions

Foundational context covering the market sizes, CAGR, scope, country, region and competition that inform every finding below. This section is provided to cover basics and most often pre-purchase conversations, answered from the MMA Primary Research Dataset.

What is the current size of the Polyurethane Precursor Market?

MMA sizes it at USD 42.6 billion in 2025, rising to USD 44.82 billion in 2026. The figure covers isocyanates and polyols at producer selling price, excluding finished polyurethane products entirely.

How large will the Polyurethane Precursor Market be by 2036?

USD 74.41 billion by 2036, an incremental USD 29.59 billion over the 2026 base and an expansion multiple of 1.66 times. Specialty and recycled grades account for a disproportionate share.

What is the CAGR for the Polyurethane Precursor Market 2026 to 2036?

5.2% in the base case, with a bull case at 6.4% and a bear case at 4.0%. The spread turns on Chinese capacity behaviour and on whether non-phosgene routes reach commercial scale.

Which segment is growing fastest?

Recycled and bio-based polyols at 7.8%, half again the market rate of 5.2%. Growth comes from furniture and mattress producer responsibility schemes rather than from any cost advantage.

Who are the major companies in the Polyurethane Precursor Market?

Wanhua Chemical, BASF, Covestro, Dow and Huntsman lead on annual production capacity, holding 68% between them. Fifteen further participants are profiled in the full report.

Which country is growing fastest?

India at 8.0%, on agricultural cold storage construction, appliance manufacturing incentives and insulation requirements entering national building codes. Domestic isocyanate capacity remains very limited there.

Report Segmentation Architecture

The full report scope spans multiple orthogonal segmentation dimensions, with cross-tabulated demand data provided for each dimension pair. Coverage extends further to regional breakdowns, trend trajectories, and the competitive detail needed to support segment-level decision-making.

By Precursor Chemistry

  • Methylene Diphenyl Diisocyanate
  • Toluene Diisocyanate
  • Aliphatic Isocyanates
  • Polyether Polyols
  • Polyester Polyols
  • Recycled and Bio-Based Polyols

By End-Use Industry

  • Building Insulation
  • Furniture and Bedding
  • Appliances and Cold Chain
  • Automotive and Transport
  • Coatings, Adhesives and Sealants
  • Footwear and Industrial Elastomers

By Commercial Dimension

  • Direct Supply to Systems Houses
  • Integrated Captive Consumption
  • Distributor and Trader Supply
  • Long-Term Offtake Agreements
  • Export and Cross-Border Trade
  • Toll Processing Agreements

By Region

  • North America
  • Western Europe
  • East Asia
  • South Asia and Pacific
  • Latin America
  • Middle East and Africa
  • Eastern Europe

Scope, Methodology, and Coverage

Every figure in this report is reproducible from documented input assumptions. The scope below maps the historical period, the forecast horizon, the segmentation dimensions, and the countries covered, alongside the underlying primary and qualitative methodology.
Historical Period
2020 to 2025
Forecast Period
2026 to 2036
Base Year
2025 (USD billions; MMA Primary Research Dataset, August 2026)
Market Definition
Chemical precursors used in polyurethane manufacture, spanning aromatic isocyanates including methylene diphenyl and toluene diisocyanate, aliphatic isocyanates, and polyether, polyester, recycled and bio-based polyols, measured at producer selling price. Finished polyurethane foams, elastomers, coatings, adhesives and sealants, propylene oxide, aniline and toluene sold as such, sugar alcohol polyol sweeteners, and thermoplastic polyurethane resin are excluded from scope.
Quantitative Units
USD billions (current prices); million tonnes produced annually; USD per tonne by precursor chemistry and region
Segmentation Dimensions
Precursor chemistry; end-use industry; commercial dimension; region
Regions Covered
North America, Western Europe, East Asia, South Asia and Pacific, Latin America, Middle East and Africa, Eastern Europe
Countries Covered
United States, Canada, Mexico, Germany, Belgium, Netherlands, Spain, Italy, China, Japan, South Korea, India, Thailand, Vietnam, Australia, Brazil, Saudi Arabia, United Arab Emirates, Poland, Romania
Key Companies Profiled
Wanhua Chemical, BASF, Covestro, Dow, Huntsman, Tosoh Corporation, Mitsui Chemicals, Asahi Kasei, Shell Chemicals, Repsol, Stepan Company, Kumho Mitsui Chemicals, Hanwha Solutions, LG Chem, PCC Rokita, Sadara Chemical, Coim Group, Perstorp, Emery Oleochemicals, Mitsubishi Chemical Group
Quantitative Methodology
Primary survey, n=3,800 respondents, Q4 2025, six countries; demand-side model with trade association cross-validation
Qualitative Methodology
47 expert interviews, Q4 2025; applied to validate demand model assumptions, identify emerging dynamics, and assess competitive positioning
Report Format
PDF and XLSX data workbook (Word format preview document)
Publisher
Market Minds Advisory
Report Code
MMA-2026-CHM-126
Published
August 2026
Contact
sales@marketmindsadvisory.com | www.marketmindsadvisory.com

Purchase the full Polyurethane Precursor Market Report (2026 to 2036).

The full report treats isocyanates and polyols as the separate industries they commercially are, sizing each precursor chemistry independently through 2036. It maps phosgene permitting positions by site and jurisdiction, tracks non-phosgene route development against commercial readiness, models propylene oxide exposure across polyol producers, and quantifies furniture and mattress recycled content obligations by compliance date. Regional chapters cover all seven regions with asset level detail where disclosure permits. Competitive profiling covers 20 participants on a single production capacity basis, with recycled content obligations quantified by compliance date.
Isocyanates and polyols sized as separate businesses
Phosgene permitting positions mapped by site and jurisdiction
Non-phosgene route development tracked against commercial readiness
Propylene oxide exposure modelled across polyol producers
Twenty participants profiled on one consistent basis
Recycled content obligations quantified by compliance date

Built For The People Who Decide

From boardroom strategy to bench-side execution, this report is read cover-to-cover by leaders shaping the next decade of their industry, turning demand scenarios, market dynamics and valuation benchmarks into decisions.
CXOs/ Presidents/ VPs/ Managers
M&A and Corporate Development
Strategy Teams and R&D Heads
Procurement and Product Directors
Regulatory and Compliance Leaders
Investor Relations and Equity Analysts