Market Minds Advisory
Polystyrene Resin Market

Polystyrene Resin Market: Banned in the Lunchbox, Building Into the Wall

Foam takeaway containers are being legislated out of existence in one market after another, while the same polymer quietly becomes the only commodity plastic that genuinely depolymerises back to its own monomer.

Lead Analyst

Bilal Shaikh

Published

September 2026

Make Smarter Decisions with Customized Research Insights

Request a free sample report and evaluate market opportunities, growth trends, and competitive dynamics relevant to your business needs.

2025 MARKET VALUE$34.2BMarket Size 2025
2036 FORECAST VALUE$50.5BBase Case , 2026 to 2036
CAGR 2026 TO 20363.6 %Bull 4.8% / Bear 2.4%
INCREMENTAL OPPORTUNITY$15.0BNet 10- year value creation
EXPANSION MULTIPLE1.42x2036 value over 2026 base
Strategic Levers
M&A Pipeline
Regional Outlook
Country Rankings
Competitive Intelligence
Segmental Deep-dive
Call-Us : 91 93563 13602

Executive Snapshot and Market Trajectory

Foam foodservice packaging is being banned across an expanding list of jurisdictions, now covering roughly 31% of world population. That is the polystyrene story most people know, and it accounts for a modest fraction of what this polymer actually does. The rest of the polymer is elsewhere entirely.
Building insulation takes 27% of output and grows with energy codes rather than with any consumer decision. Extruded and expandable board both benefit as retrofit requirements tighten across Europe, China and increasingly North America. That demand is specified by an architect against a thermal performance standard, which makes it insulated from the reputational problem foodservice created for the whole polymer. Roughly a quarter of demand sits behind a wall rather than in a hand.
The genuinely interesting development is chemical recycling. Polystyrene depolymerises back to styrene monomer at around 68% yield, far better than any polyolefin manages, because the polymer unzips rather than cracking randomly. Recycled and depolymerised grades grow at 5.4%, half again the market rate of 3.6%. East Asia holds 41% of value, well above the usual band. Almost nobody is competing for that position yet.
Market Definition
Polystyrene resins produced for conversion into plastic products, spanning general purpose and high impact grades, expandable and extruded foam resins, styrenic copolymers and recycled or depolymerised material, measured at producer selling price. Excludes styrene monomer sold as such, acrylonitrile butadiene styrene resin, styrenic block copolymers and elastomers, and converted foam or moulded products.
Base Year Value
$34.2B in 2025 (MMA Primary Research Dataset, August 2026)
Forecast Period
2026 to 2036, eleven discrete annual values
CAGR
3.6% base case. Bull 4.8%. Bear 2.4%.
Fastest Growth Segment
Recycled and Depolymerised Polystyrene: 5.4% CAGR
Fastest Growth Country
India: 6.2% CAGR
Fastest Growth Region
South Asia and Pacific: 5.7% CAGR
Largest Region
East Asia: 41% of 2025 global value
Market Leaders
INEOS Styrolution, Trinseo, TotalEnergies, Americas Styrenics, SABIC. Source: MMA Primary Research Dataset, July 2026.
Primary Survey
n=3,800 procurement and R&D decision-makers, Q4 2025, six countries
Methodology
Demand-side build-up, cross-validated against public data, 47 expert interviews

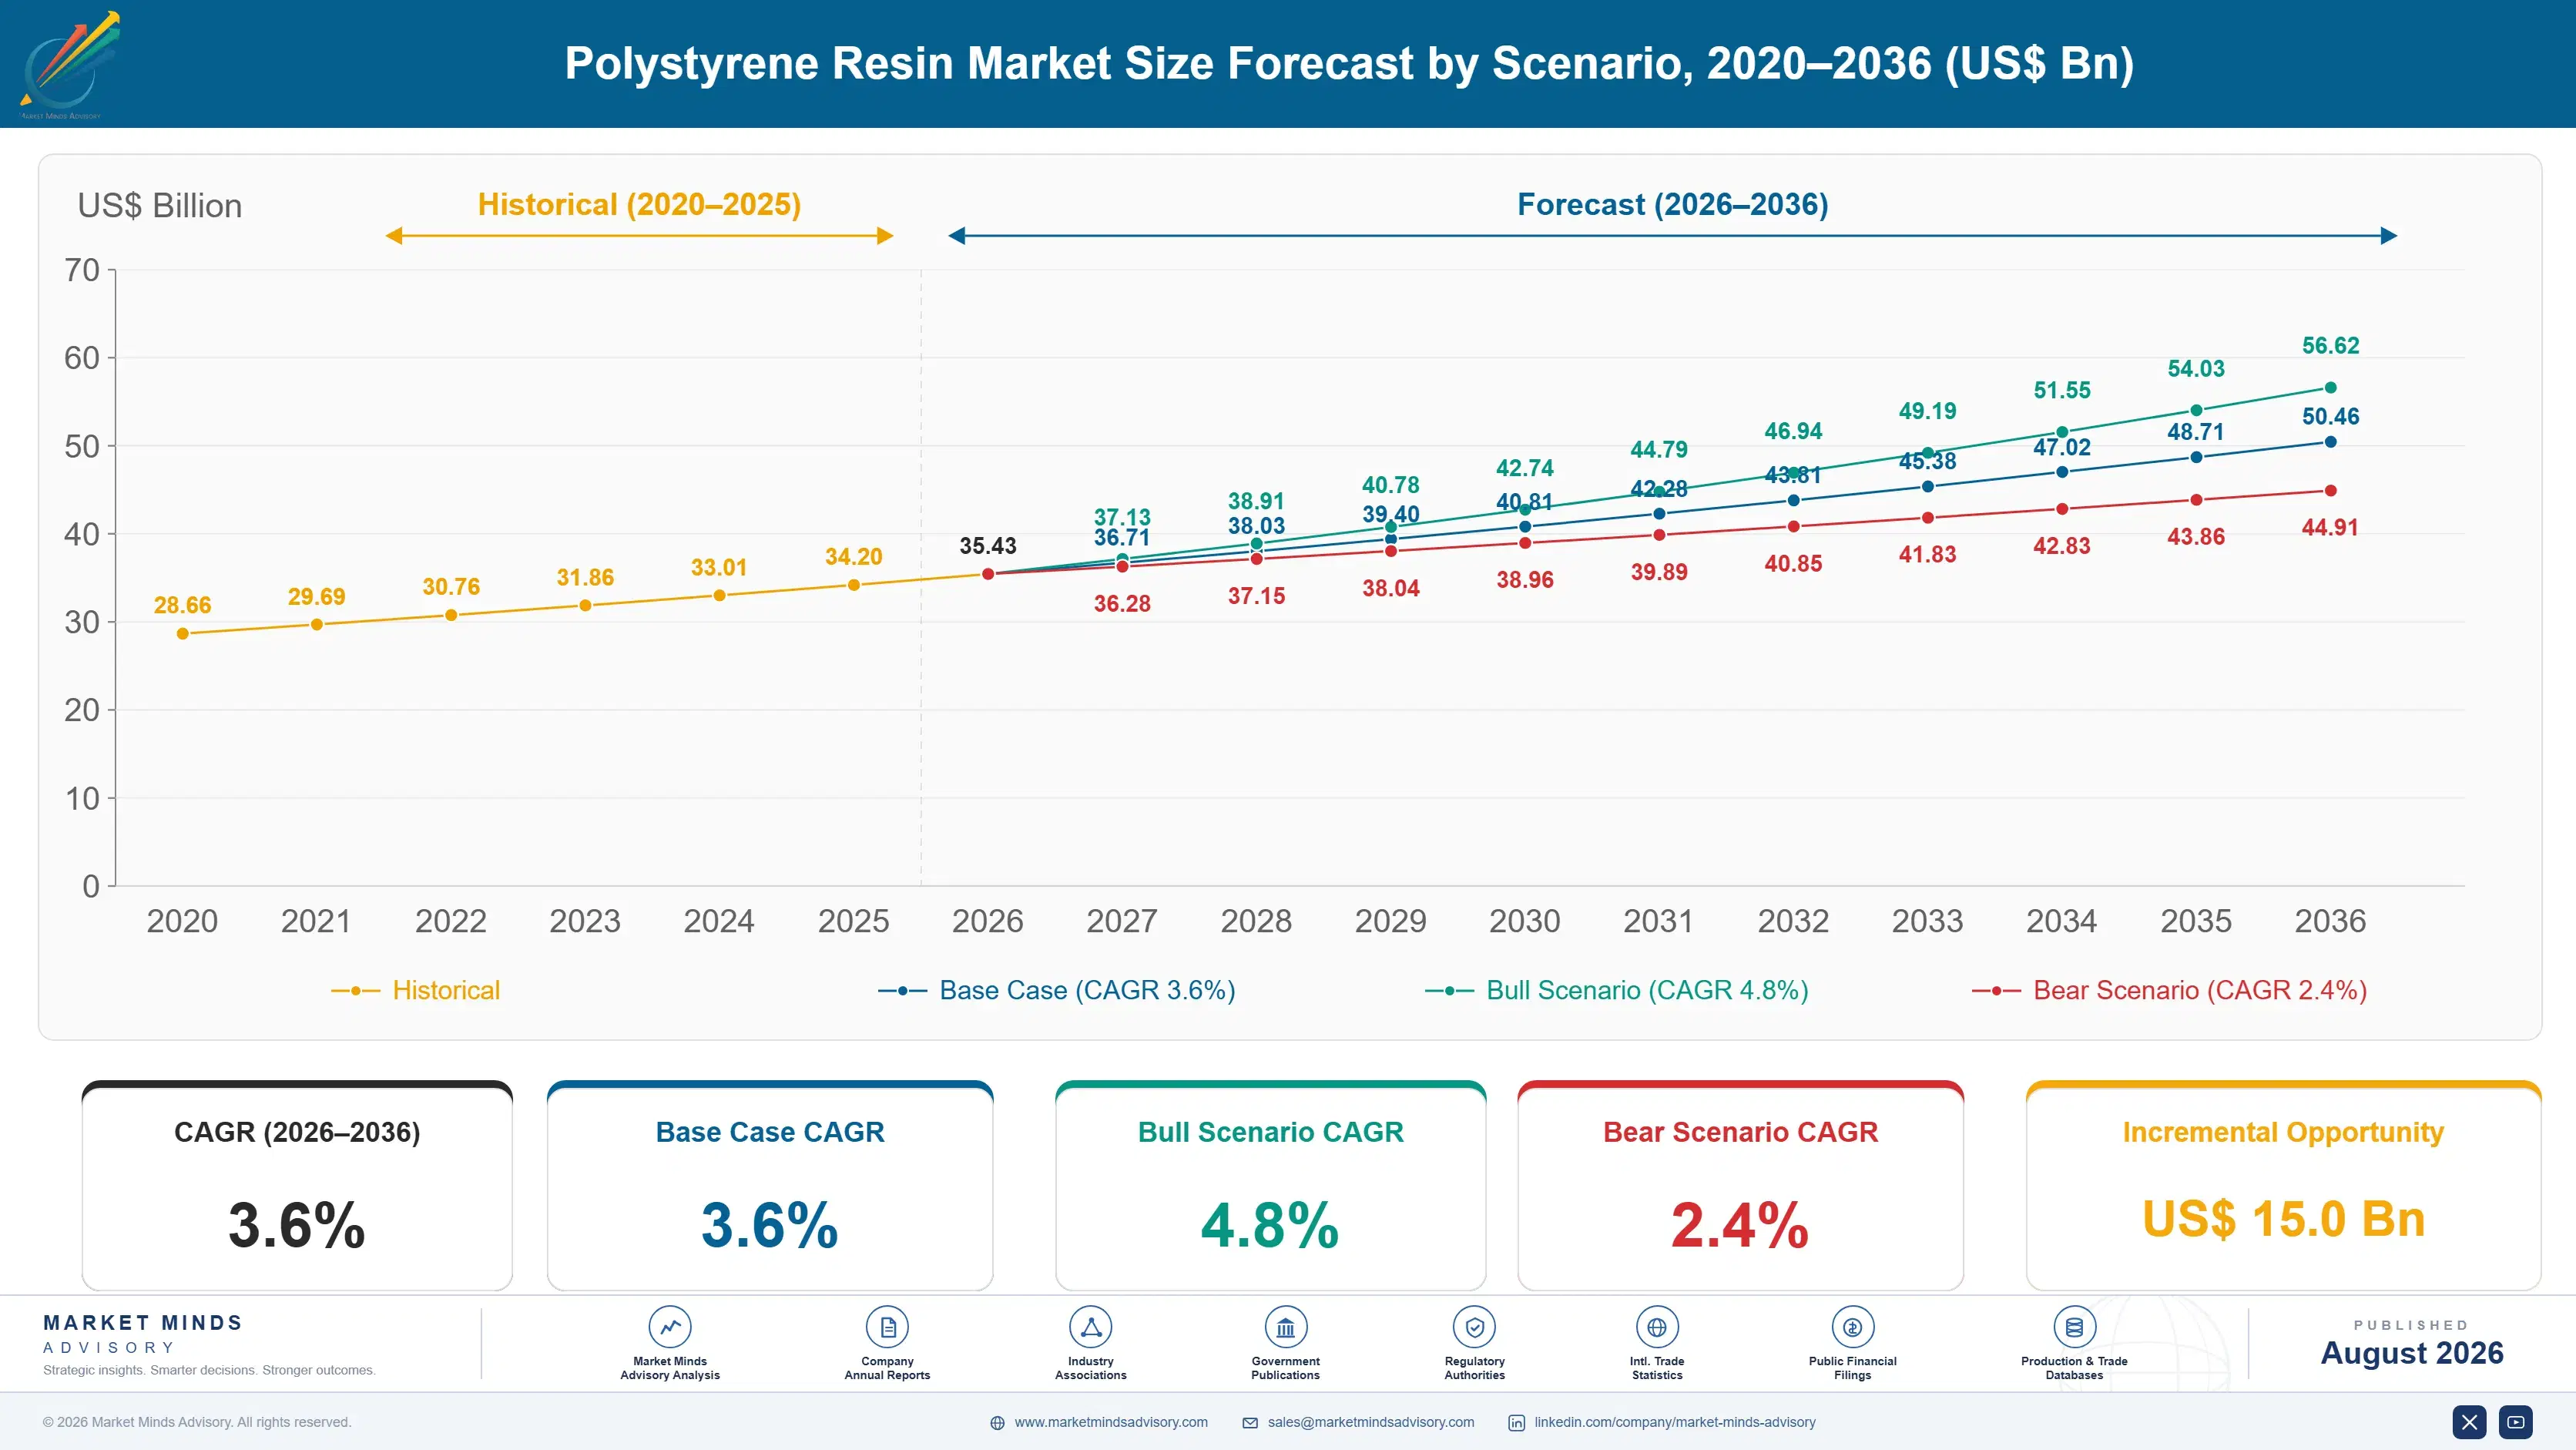
Polystyrene Resin Market Forecast Scenarios

polystyrene-resin-market-trends-size-forecast-scenario-1787580645631
Growth ran near 2.5% between 2020 and 2025, the slowest of any large commodity polymer, as foodservice restrictions spread while Chinese styrene monomer capacity arrived faster than demand. European and American producers closed capacity through the period, including monomer units whose economics no longer worked at prevailing operating rates. Insulation demand grew steadily throughout and offset part of the packaging decline.
Base case 3.6% rests on three mechanisms. Building energy codes across Europe, China and North America are tightening insulation requirements on both new construction and retrofit, and polystyrene board holds cost and thermal performance positions that alternatives struggle to match. Chemical recycling capacity is being commissioned against brand offtake for food contact material. And Indian and Southeast Asian appliance and construction demand is deepening from a low per capita base.
The bull case at 4.8% assumes depolymerisation capacity scales fast enough to give polystyrene a genuine circularity claim, which would reverse the regulatory direction in packaging rather than merely slowing it. The bear case at 2.4% is foodservice restrictions spreading into broader packaging categories while European capacity closures continue, leaving insulation as the only growing application anywhere in the portfolio.

The Polymer That Unzips

Polystyrene has a chemical property no other commodity polymer shares. Heated in the absence of oxygen it unzips, breaking back into styrene monomer rather than cracking into a mixed hydrocarbon soup the way polyethylene and polypropylene do. Recovery runs around 68% monomer, and the monomer that comes back is chemically indistinguishable from virgin, which means food contact approval without a purification argument.
TOP FIVE CONCENTRATION33%Styrenics specialists lead alongside the integrated national producers
MONOMER COST SHARE72%Share of resin cash cost carried by the monomer
GLOBAL OPERATING RATE76%Capacity utilisation across world polystyrene assets, and falling
DEPOLYMERISATION YIELD68%Recovered monomer from chemical recycling of waste polystyrene
FOODSERVICE BAN COVERAGE31%Portion of world population under foam foodservice restrictions
INSULATION BOARD SHARE27%Portion of output going into building insulation applications
That should make it the first genuinely circular commodity plastic. The obstacles are collection and economics rather than chemistry. Foam packaging is bulky, contaminated and expensive to gather, and depolymerisation needs a styrene price well above where an oversupplied monomer market has been sitting. Several pilot and demonstration plants operate; nothing yet runs at the scale the argument requires.
Meanwhile the polymer's public position keeps deteriorating on an application that is not its largest. Foam foodservice restrictions now cover roughly 31% of world population and continue spreading. Insulation board, at 27% of output and growing with building energy codes, attracts no comparable attention because an architect specifying a thermal performance value is not making a visible consumer choice about packaging. The two applications share nothing except a polymer name.
"This is the only large-volume plastic that hands you its own monomer back, and the industry has spent a decade being judged on takeaway containers instead. If depolymerisation reaches scale before the bans widen further, the regulatory story reverses completely, and very few people are positioned for that outcome."
Director, Petrochemicals and Polymers Practice · MMA Chemicals and Materials Practice · August 2026

Market Trends

Depolymerisation reaching demonstration scale across three regions

Chemical recycling plants recovering styrene monomer from waste polystyrene are operating at demonstration scale in North America, Europe and Japan, with recovery running near 68% and the monomer chemically identical to virgin material. That identity is the commercial point, because it delivers food contact approval without the purification argument every polyolefin recycling route has to make. Collection economics rather than process chemistry are the binding constraint, since foam is bulky and contaminated. Densification at collection points is where most of the current engineering effort sits. Nothing else in commodity plastics offers this route at all.
Market Impact: Delivers 6.2% annual Indian growth

Building energy codes lifting insulation board specification

Retrofit and new build insulation requirements are tightening across the European Union, China and several North American jurisdictions, with mandated thermal performance values rising on a defined schedule. Extruded and expandable polystyrene board hold cost and performance positions that mineral wool and polyisocyanurate do not fully displace, particularly below grade and in perimeter applications where moisture resistance matters. Insulation now takes 27% of resin output. Demand follows construction activity and code cycles rather than any consumer sentiment about the polymer itself. Code cycles are published years ahead, which makes this the most forecastable demand the polymer has anywhere.
Market Impact: Drives 5.4% recycled segment growth

Market Opportunities and Growth Drivers

Appliance and electronics demand deepening across South Asia

High impact polystyrene remains the default material for refrigerator liners, air conditioner housings and small appliance bodies, and Indian and Southeast Asian appliance production is growing faster than any other region. India grows fastest anywhere at 6.2% on this basis, with domestic manufacturing incentives pulling assembly into the country rather than leaving products imported. Refrigerator liner grades require impact and thermoforming performance that qualification testing verifies, so positions persist. This demand is entirely unaffected by anything happening in foodservice packaging regulation. Qualification lasts a model generation, so positions won here hold for several years rather than a contract term.
Market Impact: Covers 31% of world population

Brand offtake financing food contact recycled polystyrene capacity

Consumer goods companies facing packaging recycled content obligations have signed offtake agreements for depolymerised polystyrene that carry premiums well above virgin resin, because the recovered monomer clears food contact without argument. Those agreements are what finance the plants, since depolymerisation does not clear its cost of capital against styrene at current prices. Roughly 5.4% annual growth in recycled and depolymerised grades runs entirely on this mechanism. Capacity is being built against contracted volume rather than speculatively, which is the only discipline that has worked here. Speculative capacity in this segment has consistently disappointed.
Market Impact: Holds operating rates at 76%

Market Restraints and Challenges

Foam foodservice restrictions spreading across major jurisdictions

Expanded polystyrene foodservice packaging is now restricted across jurisdictions covering roughly 31% of world population, including numerous American states, Canadian provinces, Chinese cities and European member states under single-use plastics rules. The root cause is litter visibility rather than any comparative environmental assessment, since foam performs well on weight and energy in life cycle terms. Commercially it removes an application permanently rather than shifting it. Producers are funding depolymerisation to build a circularity argument, and repositioning capacity toward insulation and appliance grades. Neither response recovers the application that has already been legislated away.
Market Impact: Recovers 68% as usable monomer

Styrene monomer overcapacity holding resin margins near cash cost

Chinese styrene monomer capacity built through the last cycle arrived faster than downstream demand, pushing global polystyrene operating rates to roughly 76% and monomer margins to very little. The root cause is that monomer is 72% of resin cash cost, so an oversupplied monomer market transmits directly into resin economics with nothing in between. European and American producers have closed both monomer and polymer units. Rationalisation rather than demand recovery is the realistic route back, and it has begun in Europe. Closures so far have been almost entirely European ones.
Market Impact: Takes 27% of resin output
3 additional market trends, 4 additional growth drivers, and 2 additional restraints and challenges are covered in the full report. Contact sales@marketmindsadvisory.com to access the complete intelligence.

Segment CAGR and Growth Architecture

Six segments split by resin type, because type determines the conversion process, the end application and therefore the regulatory exposure a producer carries. Foam foodservice grades and insulation board grades face entirely different futures despite sharing a polymer. Application and channel splits are handled in the framework rather than folded in here. The polymer name is all they share.
polystyrene-resin-market-trends-market-share-analysis-1787580646241

Recycled and Depolymerised Polystyrene

Growing at 5.4%, half again the market rate of 3.6%, this segment covers mechanically recycled polystyrene and monomer recovered by depolymerisation. The second route is what matters commercially, since recovered styrene is chemically identical to virgin and clears food contact without the purification argument polyolefin recycling always requires. Recovery runs near 68% and the economics need styrene pricing well above current levels, so plants are financed on brand offtake at premium rather than on merchant returns. Collection and densification of bulky foam waste is the practical constraint. Capacity is small today and holds the strongest strategic position in the category. Whoever reaches commercial scale first holds a position no other commodity polymer can match.
CAGR 5.4%

Extruded Polystyrene Foam

At 4.7% extruded board grows with building energy codes across Europe, China and North America, where mandated thermal performance values rise on published schedules. Closed cell structure gives it moisture resistance that expandable board and mineral wool cannot match below grade or at building perimeters, which protects the application. Blowing agent transitions under hydrofluorocarbon phase-down forced reformulation toward carbon dioxide and hydrofluoroolefin blends, changing both thermal performance and cost. Specification by an architect against a performance value insulates demand from any consumer view of the polymer, which is worth a great deal here. Reformulation under the blowing agent transition cost the industry several years of development work, and the resulting boards perform slightly differently from what specifiers were used to.
CAGR 4.7%
Full segment breakdown across 6 segments available in the complete report.

Regional Architecture and Country Demand Map

East Asia holds 41% of value, well above its usual band, because Chinese capacity and construction demand dominate together. North America at 18% and Western Europe at 15% sit below their bands after capacity closures, while South Asia and Pacific at 14% sits above on appliance demand.

North America

Foodservice foam restrictions have spread state by state rather than federally, producing a patchwork that converters find harder to plan around than a single national rule would be. The 18% share sits below the usual band after capacity closures and packaging demand loss. Americas Styrenics and INEOS Styrolution hold most production, with the Gulf Coast holding a styrene monomer cost position built on shale-derived benzene and ethylene. Insulation demand is growing on energy code updates, though more slowly than in Europe. The most advanced depolymerisation demonstration capacity anywhere is operating in this region. A patchwork of state rules is harder for converters to plan around than a single federal restriction would be.
Share: 18% | CAGR: 2.6% (2026 to 2036)

Western Europe

European producers have closed both monomer and polymer capacity since 2023, and the 15% share sits below the usual band as a direct consequence of feedstock and energy costs that no demand recovery corrects. Single-use plastics rules removed foodservice foam across member states. What Europe retains is the strongest insulation demand anywhere, driven by renovation wave requirements and by national retrofit programmes with defined thermal performance schedules. INEOS Styrolution, Versalis and Synthos hold the remaining positions, increasingly weighted toward construction and appliance grades rather than packaging. Regional share sits below its usual band on closures rather than on demand, and insulation is genuinely the strongest application anywhere in the world here.
Share: 15% | CAGR: 2.0% (2026 to 2036)
Regional intelligence for 5 additional markets available in the complete report: East Asia, South Asia and Pacific, Latin America, Middle East and Africa, Eastern Europe. Contact sales@marketmindsadvisory.com.
polystyrene-resin-market-trends-country-cagr-analysis-1787580646802

Four Moves in a Difficult Polymer

Monomer is 72% of cash cost and the monomer market is oversupplied, so conversion efficiency changes very little. What decides returns is application mix, whether a producer holds monomer integration, and who is positioned when depolymerisation finally reaches scale. Packaging exposure is the thing to reduce. Everything else is arranging deck furniture. Discipline is what is on offer.

Shift mix from packaging toward insulation grades

Foodservice restrictions cover 31% of world population and continue spreading, while insulation takes 27% of output and grows with building energy codes on published schedules. Converting production emphasis toward extruded and expandable board grades moves volume from an application under permanent regulatory pressure into one specified by architects against performance values. The changeover requires grade development and customer qualification rather than new plant. Producers who began this shift before 2023 hold construction customer relationships that late movers now have to buy their way into. Late movers have to buy in.
Market Impact: Moves volume toward the 27% insulation demand share

Contract depolymerisation offtake before capacity is committed

Depolymerisation recovers 68% as monomer chemically identical to virgin, which delivers food contact approval that no polyolefin recycling route can claim. It does not clear its cost of capital against styrene at current prices, so what makes a plant financeable is a long brand offtake at premium against a packaging compliance obligation. Signing the offtake before committing capital is the discipline that separates the projects proceeding from those that stalled. Collection and densification arrangements need securing at the same time. Speculative capacity here has disappointed consistently. Nobody builds this speculatively any more.
Market Impact: Finances plants on a 68% monomer recovery rate

Secure styrene monomer integration or long supply

Monomer is 72% of resin cash cost, the highest raw material share of any commodity polymer, so a producer buying merchant styrene into a volatile market carries almost everything. Integrated producers absorb the movement internally and price downstream at their own discretion. Where integration is not available, multi-year monomer supply on defined terms removes most of the exposure at a modest premium. Producers who stayed on spot through the last cycle are largely the ones that have since closed capacity. Integration is worth more than any efficiency programme. Spot exposure is what closed the last cycle's casualties.
Market Impact: Covers 72% of the cash cost exposure directly

Build appliance grade qualification in South Asia

High impact polystyrene for refrigerator liners and air conditioner housings requires impact strength and thermoforming performance verified through customer qualification, which excludes commodity suppliers. Indian appliance assembly is growing at 6.2% annually on manufacturing incentives that pull production into the country. Qualifying with an appliance maker takes roughly a year and holds for the product generation afterwards. This demand carries no regulatory exposure whatever, which makes it the cleanest growth available anywhere in the polystyrene portfolio today. Nothing in appliance demand responds to packaging regulation, and the qualification barrier keeps commodity suppliers out entirely.
Market Impact: Targets the 6.2% growth in Indian appliance assembly

Who Controls the Margin Pool

Participation is measured on annual polystyrene production capacity, and the top five hold 33%. That is moderate concentration for a commodity polymer and reflects a handful of styrenics specialists alongside integrated national producers. INEOS Styrolution and Trinseo lead on dedicated styrenics focus rather than on breadth across other polymers. The gap to challengers is monomer integration and grade development capability rather than tonnage.
Competition runs on monomer position before anything else, since it is 72% of cash cost and the monomer market has been oversupplied for years. Application mix is the second front, with producers weighted toward insulation and appliance grades faring considerably better than those exposed to packaging. Depolymerisation capability is the third, and it is where the strategic positioning is happening now rather than where any current revenue sits.

The pressure ahead runs in two directions at once. Foodservice restrictions keep spreading, removing packaging demand permanently, while depolymerisation could hand the polymer a circularity argument no polyolefin can match. Expect capacity closures in Europe and depolymerisation partnerships with brand owners rather than acquisitions. Rankings shift depending on which of those two forces arrives at scale first, and nobody currently knows the answer.
polystyrene-resin-market-trends-company-positioning-matrix-1787580647329

Competitive Moat and Risk Dimensions

INEOS STYROLUTION

Moat: Styrenics focus and grade breadth

INEOS Styrolution is the largest dedicated styrenics business anywhere, with grade development capability across appliance, construction and specialty applications that generalist polymer producers cannot match. That focus produces application knowledge and customer qualification depth which matters more as the portfolio shifts away from commodity packaging toward specified end uses.
INEOS STYROLUTION

Risk: European asset cost position

European monomer and polymer assets carry feedstock and energy costs well above Asian and American levels, a position that persists through any demand recovery. Rationalising them means conceding volume in a region where the company holds strong construction and appliance relationships, and where insulation demand is actually the healthiest anywhere in the world.
TRINSEO

Moat: Depolymerisation technology position

Trinseo has invested in polystyrene depolymerisation ahead of most competitors, which positions it for food contact recycled material that no polyolefin route can supply. Brand owners facing packaging obligations have very few sources for chemically identical recycled monomer, and early technology and offtake relationships in a scarce supply situation are worth considerably more than capacity.
TRINSEO

Risk: Balance sheet and closure exposure

The company has closed European monomer and polymer capacity while carrying meaningful debt through a period of weak styrenics margins. Funding depolymerisation investment at scale competes directly against balance sheet repair, and a competitor with deeper resources could take the same technology position by simply outspending it on capacity commitments.

Players Tracked

Prominent Players

INEOS Styrolution
Trinseo
TotalEnergies
Americas Styrenics
SABIC

Other Key Players

Kumho Petrochemical
LG Chem
Chi Mei Corporation
Formosa Chemicals and Fibre
Sinopec
PetroChina
Denka Company
Toyo Styrene
Versalis
Synthos
BASF
Kaneka Corporation
SUNPOR
Ravago
Supreme Petrochem

Recent Developments

APRIL 2026

Consumer goods group contracts depolymerised polystyrene for food packaging

A consumer goods company signed a multi-year offtake for polystyrene produced from depolymerised monomer, cleared for food contact and priced at a substantial premium to virgin resin. The arrangement is a long-term supply agreement carrying volume commitments rather than an equity investment or joint venture.
Signal: Food contact clearance without any purification argument is what makes recovered styrene monomer commercially distinctive here
OCTOBER 2025

European producer closes styrene monomer capacity permanently

A European styrenics producer permanently closed styrene monomer capacity, citing feedstock and energy cost positions that no demand recovery would correct. Downstream polymer units at the site will run on purchased monomer, and the closed plant is being dismantled rather than preserved for restart. Employees were redeployed to remaining units.
Signal: European monomer integration is disappearing, which leaves the remaining polymer units carrying full merchant cost exposure
JANUARY 2026

Chinese building energy standard raises insulation performance requirements

Revised Chinese building energy standards raised mandated thermal performance values for residential and commercial construction, increasing insulation thickness requirements across most climate zones. Expandable and extruded polystyrene board are among the materials that meet the revised values at acceptable cost. Compliance dates run through the decade.
Signal: Insulation demand is set by code cycles, which makes it the most forecastable application this polymer has

Monomer Decides the Outcome

Styrene monomer accounts for roughly 72% of polystyrene cash cost, the highest raw material share of any commodity polymer, and it is produced from benzene and ethylene through alkylation and dehydrogenation. Benzene comes from refinery reforming and pyrolysis gasoline, ethylene from steam crackers, so the monomer sits downstream of two separate feedstock chains. Conversion energy and additives together add about 11% of the total cost.
The 2022 European energy crisis showed how exposed this chain is. Styrene production is energy intensive through the dehydrogenation step, and European industrial gas and power prices rose to multiples of historic levels, per IEA data on European industrial energy costs. Producers disclosed impairments on styrene assets in annual reporting for that year, and permanent closures of both monomer and polymer capacity followed across the region within eighteen months.

Exposure divides sharply on integration. A producer making its own monomer absorbs benzene and ethylene movements internally and prices resin at discretion, while a merchant buyer carries a 72% cost input priced by someone else. Geography compounds it: Gulf and American producers hold advantaged feedstock while European assets pay both feedstock and energy premiums, which is why the closure list is almost entirely European.
polystyrene-resin-market-trends-cost-volatility-analysis-1787580647525

Secure multi-year monomer supply where integration is unavailable

Producers without monomer capacity should contract multi-year supply on defined terms rather than buying spot into a volatile market that represents 72% of their cash cost. The premium in easy conditions is modest against the protection in difficult ones, and the producers who stayed on spot through the last cycle are largely those that have since closed capacity permanently.

Contract industrial energy on long tenor in exposed regions

Dehydrogenation is energy intensive and European producers on spot power and gas carried the entire 2022 increase, while those holding long-dated supply absorbed a fraction of it. Long tenor costs a premium in normal conditions and functions as insurance against an event that has now occurred once this decade. Most European producers restructured energy procurement afterwards.

Weight the portfolio toward grades that carry margin

When monomer cost cannot be improved, the remaining lever is what the plant produces. Insulation board and appliance grades carry margins that commodity packaging resin cannot approach, and both are specified rather than bought on price. Grade development and customer qualification take time rather than capital, which suits producers unable to fund major investment.

Portfolio Architecture for Margin Defence

Margin here is monomer position plus application mix, in that order. Commodity general purpose grades sold into packaging earn very little and sometimes nothing, because monomer at 72% of cost sets the floor and the application is under permanent regulatory pressure. Merchant monomer buyers in this tier have been the closures list for three years running. Conversion efficiency changes that arithmetic very little.
Insulation and appliance grades occupy a better economy, at margins in the low to high twenties. Both are specified against performance values or verified through customer qualification, which limits substitution and slows price competition. The range is wide because building code requirements and appliance qualification depth differ considerably between regions and between customers. A qualified appliance grade is not requalified to save a few dollars a tonne.

Depolymerised food contact material holds the strongest position and the smallest volume, running into the high thirties, because recovered styrene monomer is chemically identical to virgin and almost nobody can supply it. That premium reflects scarcity and a packaging compliance obligation rather than any cost advantage, and it compresses as capacity arrives. The window in which scarcity supports that price is not open indefinitely.

General Purpose and Packaging Grades

Standard general purpose and expandable grades sold into packaging and disposable applications. The ten point range reflects monomer integration position, which separates producers making their own styrene from merchant buyers entirely.
Gross Margin: 4-14%

Insulation Board and Appliance Grades

Extruded and expandable board for construction plus high impact grades for appliance manufacture. The nine point range reflects differences in building code requirements and appliance qualification depth across regions and individual customers.
Gross Margin: 19-28%

Depolymerised and Recycled Grades

Material from recovered styrene monomer and mechanically recycled resin sold against packaging content obligations. The fourteen point range separates mechanically recycled material from the scarce depolymerised monomer that clears food contact.
Gross Margin: 24-38%
polystyrene-resin-market-trends-portfolio-architecture-1787580648021

High-value Sub-segments and Strategic Watch-out

Depolymerised Food Contact Grades

High value and high growth from a very small base. Recovered monomer is chemically identical to virgin, which clears food contact without any purification argument. Brand offtake at premium finances the plants, since merchant economics do not work at current styrene pricing. Collection economics are the constraint.
Gross Margin: 32-38%

Extruded Insulation Board Grades

High value, steady growth at 4.7%, and specified by architects against thermal performance values. Closed cell moisture resistance protects the below grade and perimeter applications that alternatives cannot serve. Building code cycles rather than consumer sentiment drive the demand. Moisture resistance protects the application. Codes set the pace.
Gross Margin: 22-28%

General Purpose Packaging Grades

The volume core and the position under permanent regulatory pressure. Foodservice restrictions cover 31% of world population and continue spreading jurisdiction by jurisdiction. Monomer at 72% of cost leaves merchant buyers with no defensible margin at all. Restrictions keep spreading jurisdiction by jurisdiction across the world.
Gross Margin: 4-14%

European Merchant-Fed Capacity

The strategic watch-out. Losing local monomer integration while carrying European energy costs places these assets above the cost curve permanently rather than cyclically. The range includes periods of outright loss, and further closures look likely. Feedstock and energy costs both work against these assets permanently.
Gross Margin: 0-10%

Where the Volume Still Repeats

Insulation demand behaves like an annuity tied to construction cycles rather than to any purchasing decision. A board grade meeting a mandated thermal performance value gets specified on every project built to that code, at volumes an architect calculates rather than negotiates, for as long as the code holds. Roughly 27% of output moves this way, and the code cycle is published years ahead, which makes it the most forecastable demand this polymer has.
Stickiness varies enormously by application. Appliance grades are stickiest, since a refrigerator liner grade sits inside a product qualification lasting a model generation and requalifying costs real money. Insulation board grades come next, held by building code approvals referencing material standards. Packaging converters switch within specification on price alone. Foodservice grades are disappearing rather than switching, which is a different problem entirely.

The buyer has moved away from the converter in construction. Resin selection sat with board manufacturers choosing on processability and cost. Thermal performance requirements now sit with architects and code officials who never buy resin, which means the real customer is a building standard, and a producer whose grade does not meet the revised value simply falls out of the specification.
polystyrene-resin-market-trends-end-use-penetration-index-1787580648518

Where We Would Place Capital

These are among the four positions where our research anticipates prominent divergence between winners and laggards over the coming forecast period. Each is grounded in the demand model, the regulatory perimeter, and the announced capacity pipeline.
01 / APPLICATION MIX REBALANCING

Move production emphasis from packaging toward insulation grades

Foodservice restrictions now cover roughly 31% of world population and keep spreading jurisdiction by jurisdiction, while insulation takes 27% of output and grows against building energy codes published years in advance. Shifting emphasis moves volume out of an application under permanent regulatory pressure and into one specified by architects against performance values. The changeover needs grade development and customer qualification rather than new plant, and producers who began this before 2023 already hold the construction customer relationships that late movers must now buy into.
02 / DEPOLYMERISATION CAPACITY POSITIONING

Contract the offtake before committing any recycling capital

Depolymerisation recovers around 68% as monomer chemically identical to virgin resin, which delivers a food contact approval that no polyolefin recycling route can honestly claim for itself. It does not clear its cost of capital against styrene at current pricing, so a long brand offtake at premium is what makes a plant financeable at all. Signing that offtake, and securing collection and densification arrangements alongside it, is what separates the projects actually proceeding from the several that have quietly stalled.
03 / MONOMER POSITION SECURITY

Integrate or contract long, but never stay on spot

Styrene monomer is 72% of polystyrene cash cost, the highest raw material share of any commodity polymer, so a merchant buyer carries almost the entire cost structure at somebody else's price. Integrated producers absorb feedstock movement internally and price resin at their own discretion. Where integration is not available, multi-year supply on defined terms removes most of the exposure at modest premium, and the producers who chose to stay on spot through the last cycle are largely the closures list now.
04 / APPLIANCE GRADE QUALIFICATION

Qualify with South Asian appliance makers while assembly grows

High impact grades for refrigerator liners and air conditioner housings require impact and thermoforming performance verified through customer qualification, which excludes commodity suppliers from the application altogether at any price. Indian appliance assembly is growing at 6.2% annually on manufacturing incentives pulling production into the country. Qualification takes roughly a year and then holds for the whole product generation, and this demand carries no regulatory exposure whatever, which is genuinely rare anywhere in polystyrene today and worth paying to secure.

Engagement Snapshot From the Field

A live engagement with an industry participant carrying material or product regulatory and market exposure ahead of a defining policy shift, showing how our research translates into a defensible multi-year portfolio strategy.
MARKET MINDS ADVISORY · CLIENT ENGAGEMENT SUMMARY
Polystyrene Resin Producer Strategic Portfolio Review and Transition Roadmap 2026·Investment Scenario on Polystyrene Resin Exposure Evaluation 2025-26
CLIENT PROFILE
A European styrenics producer operating two polystyrene plants and one styrene monomer unit across two countries, with polymer revenue near 1.1 billion euros (client-reported, unverified by MMA). The portfolio was weighted toward general purpose and expandable packaging grades, with roughly a quarter of volume going into applications facing single-use plastics restrictions across the European Union.
STRATEGIC CHALLENGE
Divisional returns had been below cost of capital for eight consecutive quarters, and the monomer unit was operating at a loss on European energy costs. Management needed to decide between closure, a shift toward construction and appliance grades, or investment in depolymerisation, and the board had rejected an earlier proposal to close the monomer unit outright.
MMA APPROACH
MMA positioned each asset on a delivered cash cost curve against Asian and American producers, modelled European insulation demand against renovation wave code schedules through 2032, and tested depolymerisation economics at several styrene price assumptions. Packaging volume exposed to restriction schedules was quantified by application. Interviews with 47 experts covered styrenics operations, construction specification and brand packaging procurement.
KEY FINDINGS
  1. The monomer unit sat above the delivered cash cost curve against Asian and American supply at every operating rate the model produced, cyclically and otherwise.
  2. European insulation demand grew in all three modelled scenarios on renovation wave code schedules, offering more volume than the packaging business being lost.
  3. Depolymerisation returned below cost of capital on merchant assumptions and cleared it comfortably against a ten-year brand offtake at contracted premium pricing.
  4. Roughly a quarter of packaging volume faced restriction schedules that were already legislated, which no commercial effort would recover once those dates arrived.
CLIENT PROFILE
A European styrenics producer operating two polystyrene plants and one styrene monomer unit across two countries, with polymer revenue near 1.1 billion euros (client-reported, unverified by MMA). The portfolio was weighted toward general purpose and expandable packaging grades, with roughly a quarter of volume going into applications facing single-use plastics restrictions across the European Union.
STRATEGIC CHALLENGE
Divisional returns had been below cost of capital for eight consecutive quarters, and the monomer unit was operating at a loss on European energy costs. Management needed to decide between closure, a shift toward construction and appliance grades, or investment in depolymerisation, and the board had rejected an earlier proposal to close the monomer unit outright.
MMA APPROACH
MMA positioned each asset on a delivered cash cost curve against Asian and American producers, modelled European insulation demand against renovation wave code schedules through 2032, and tested depolymerisation economics at several styrene price assumptions. Packaging volume exposed to restriction schedules was quantified by application. Interviews with 47 experts covered styrenics operations, construction specification and brand packaging procurement.
KEY FINDINGS
  1. The monomer unit sat above the delivered cash cost curve against Asian and American supply at every operating rate the model produced, cyclically and otherwise.
  2. European insulation demand grew in all three modelled scenarios on renovation wave code schedules, offering more volume than the packaging business being lost.
  3. Depolymerisation returned below cost of capital on merchant assumptions and cleared it comfortably against a ten-year brand offtake at contracted premium pricing.
  4. Roughly a quarter of packaging volume faced restriction schedules that were already legislated, which no commercial effort would recover once those dates arrived.
RECOMMENDED STRATEGY
Phase 1: Phase one: close the styrene monomer unit and contract multi-year merchant supply, since the asset cannot cover cash cost at any modelled operating rate. Phase 2: Phase two: redirect both polymer plants toward insulation board and appliance grades, qualifying with construction and appliance customers before packaging volume disappears. Phase 3: Phase three: pursue depolymerisation only against a signed brand offtake, rather than committing any capital on merchant styrene price assumptions.
OUTCOME
The producer closed the monomer unit in late 2025 and reported divisional return on capital improving by roughly five percentage points within four quarters (client-reported, unverified by MMA). Insulation and appliance grades reached 46% of volume during 2026, and a depolymerisation investment case was reworked around contracted rather than merchant pricing.

Frequently Asked Questions

Foundational context covering the market sizes, CAGR, scope, country, region and competition that inform every finding below. This section is provided to cover basics and most often pre-purchase conversations, answered from the MMA Primary Research Dataset.

What is the current size of the Polystyrene Resin Market?

MMA sizes it at USD 34.2 billion in 2025, rising to USD 35.43 billion in 2026. The figure covers polystyrene resins at producer selling price, excluding styrene monomer and converted foam products.

How large will the Polystyrene Resin Market be by 2036?

USD 50.46 billion by 2036, an incremental USD 15.03 billion over the 2026 base and an expansion multiple of 1.42 times. Insulation and recycled grades account for a disproportionate share.

What is the CAGR for the Polystyrene Resin Market 2026 to 2036?

3.6% in the base case, with a bull case at 4.8% and a bear case at 2.4%. The spread turns on whether depolymerisation scales before foodservice restrictions spread further.

Which segment is growing fastest?

Recycled and depolymerised polystyrene at 5.4%, half again the market rate of 3.6%. Recovered styrene monomer is chemically identical to virgin and clears food contact without argument.

Who are the major companies in the Polystyrene Resin Market?

INEOS Styrolution, Trinseo, TotalEnergies, Americas Styrenics and SABIC lead on annual production capacity. Fifteen further participants are profiled in the full report on that basis.

Which country is growing fastest?

India at 6.2%, on appliance manufacturing incentives pulling refrigerator and air conditioner assembly into the country alongside construction insulation demand rising from a very low base.

Report Segmentation Architecture

The full report scope spans multiple orthogonal segmentation dimensions, with cross-tabulated demand data provided for each dimension pair. Coverage extends further to regional breakdowns, trend trajectories, and the competitive detail needed to support segment-level decision-making.

By Resin Type

  • General Purpose Polystyrene
  • High Impact Polystyrene
  • Expandable Polystyrene
  • Extruded Polystyrene Foam
  • Styrene-Acrylonitrile and Specialty Styrenics
  • Recycled and Depolymerised Polystyrene

By End-Use Industry

  • Building and Construction Insulation
  • Appliances and White Goods
  • Food and Beverage Packaging
  • Consumer Electronics
  • Medical and Laboratory Disposables
  • Protective and Transport Packaging

By Commercial Dimension

  • Direct Supply to Converters
  • Distributor and Trader Supply
  • Brand Owner Direct Contracting
  • Long-Term Offtake Agreements
  • Export and Cross-Border Trade
  • Toll Polymerisation Agreements

By Region

  • North America
  • Western Europe
  • East Asia
  • South Asia and Pacific
  • Latin America
  • Middle East and Africa
  • Eastern Europe

Scope, Methodology, and Coverage

Every figure in this report is reproducible from documented input assumptions. The scope below maps the historical period, the forecast horizon, the segmentation dimensions, and the countries covered, alongside the underlying primary and qualitative methodology.
Historical Period
2020 to 2025
Forecast Period
2026 to 2036
Base Year
2025 (USD billions; MMA Primary Research Dataset, August 2026)
Market Definition
Polystyrene resins produced for conversion into plastic products, spanning general purpose and high impact grades, expandable and extruded foam resins, styrene-acrylonitrile and specialty styrenics, and recycled or depolymerised material, measured at producer selling price. Styrene monomer sold as such, acrylonitrile butadiene styrene resin, styrenic block copolymers and thermoplastic elastomers, and converted foam or moulded products are excluded from scope.
Quantitative Units
USD billions (current prices); million tonnes produced annually; USD per tonne by resin type and region
Segmentation Dimensions
Resin type; end-use industry; commercial dimension; region
Regions Covered
North America, Western Europe, East Asia, South Asia and Pacific, Latin America, Middle East and Africa, Eastern Europe
Countries Covered
United States, Canada, Mexico, Germany, Belgium, Netherlands, France, Italy, China, Japan, South Korea, Taiwan, India, Thailand, Indonesia, Brazil, Saudi Arabia, United Arab Emirates, Poland, Czech Republic
Key Companies Profiled
INEOS Styrolution, Trinseo, TotalEnergies, Americas Styrenics, SABIC, Kumho Petrochemical, LG Chem, Chi Mei Corporation, Formosa Chemicals and Fibre, Sinopec, PetroChina, Denka Company, Toyo Styrene, Versalis, Synthos, BASF, Kaneka Corporation, SUNPOR, Ravago, Supreme Petrochem
Quantitative Methodology
Primary survey, n=3,800 respondents, Q4 2025, six countries; demand-side model with trade association cross-validation
Qualitative Methodology
47 expert interviews, Q4 2025; applied to validate demand model assumptions, identify emerging dynamics, and assess competitive positioning
Report Format
PDF and XLSX data workbook (Word format preview document)
Publisher
Market Minds Advisory
Report Code
MMA-2026-CHM-125
Published
August 2026
Contact
sales@marketmindsadvisory.com | www.marketmindsadvisory.com

Purchase the full Polystyrene Resin Market Report (2026 to 2036).

The full report sizes each resin type separately through 2036 and separates the regulatory exposure of packaging grades from the code-driven growth of insulation, which most analysis of this polymer conflates. It models depolymerisation economics at several styrene price assumptions, maps foodservice restriction schedules by jurisdiction and effective date, and positions global capacity on a delivered cash cost curve. Regional chapters cover all seven regions with asset level detail where disclosure permits. Competitive profiling covers 20 participants on a single production capacity basis, with insulation demand modelled against published building code cycles.
Each resin type sized separately through 2036
Depolymerisation economics modelled at several styrene prices
Foodservice restriction schedules mapped by jurisdiction and date
Global capacity positioned on a delivered cash cost curve
Twenty participants profiled on one consistent basis
Insulation demand modelled against published building code cycles

Built For The People Who Decide

From boardroom strategy to bench-side execution, this report is read cover-to-cover by leaders shaping the next decade of their industry, turning demand scenarios, market dynamics and valuation benchmarks into decisions.
CXOs/ Presidents/ VPs/ Managers
M&A and Corporate Development
Strategy Teams and R&D Heads
Procurement and Product Directors
Regulatory and Compliance Leaders
Investor Relations and Equity Analysts