Market Minds Advisory
Polypropylene Market

Polypropylene Market: Easy To Make, Hard To Make Specially

Global operating rates sit near 81% with more capacity still committed, which means the marginal Chinese producer now sets the price that every other producer in the world has to live with.

Lead Analyst

Bilal Shaikh

Published

September 2026

Make Smarter Decisions with Customized Research Insights

Request a free sample report and evaluate market opportunities, growth trends, and competitive dynamics relevant to your business needs.

2025 MARKET VALUE$138.0BMarket Size 2025
2036 FORECAST VALUE$217.0BBase Case , 2026 to 2036
CAGR 2026 TO 20364.2 %Bull 5.4% / Bear 3.0%
INCREMENTAL OPPORTUNITY$73.2BNet 10- year value creation
EXPANSION MULTIPLE1.51x2036 value over 2026 base
Strategic Levers
M&A Pipeline
Regional Outlook
Country Rankings
Competitive Intelligence
Segmental Deep-dive
Call-Us : 91 93563 13602

Executive Snapshot and Market Trajectory

Chinese propane dehydrogenation and coal-to-olefins capacity has arrived faster than demand for a decade, and global operating rates now sit near 81% with roughly 12 million tonnes of announced additions still ahead. The marginal producer sets the price and that producer is increasingly Chinese. Nothing about that arrangement is cyclical.
Growth runs at 4.2% and recycled grades lead it. Mechanically and chemically recycled polypropylene grows at 6.3%, exactly 1.50 times the market rate, pulled by packaging brand commitments and recycled content mandates rather than by any cost advantage. East Asia holds 47%, far outside band, because Chinese capacity and conversion demand together dwarf every other region. Recycled content still meets only 4% of demand.
Concentration is very low at 26% across the top five measured on polymer capacity, and the fragmentation is real rather than an artefact of measurement. Anybody can make homopolymer. Very few can make a metallocene grade qualified into a medical device or a thin-wall packaging line running at 0.35 millimetres, and that gap is where the remaining margin sits. Positions in those grades are considerably more consolidated than the headline suggests.
Market Definition
This market covers polypropylene resin supplied for conversion into finished products, spanning homopolymer grades, random copolymer grades, impact block copolymer grades, specialty and metallocene grades, and mechanically and chemically recycled grades. Propylene monomer sold as such, polypropylene compounds and masterbatches produced by third-party compounders, polypropylene fibres, films and finished converted products, catalyst and process technology licensing, and other polyolefins including polyethylene fall outside scope.
Base Year Value
$138.0B in 2025 (MMA Primary Research Dataset, August 2026)
Forecast Period
2026 to 2036, eleven discrete annual values
CAGR
4.2% base case. Bull 5.4%. Bear 3.0%.
Fastest Growth Segment
Mechanically and Chemically Recycled Grades: 6.3% CAGR
Fastest Growth Country
India: 7.0% CAGR
Fastest Growth Region
South Asia and Pacific: 6.3% CAGR
Largest Region
East Asia: 47% of 2025 global value
Market Leaders
LyondellBasell, Sinopec, SABIC, ExxonMobil, Braskem. Source: MMA Analysis based on company annual reports.
Primary Survey
n=3,800 procurement and R&D decision-makers, Q4 2025, six countries
Methodology
Demand-side build-up, cross-validated against public data, 47 expert interviews

Polypropylene Market Forecast Scenarios

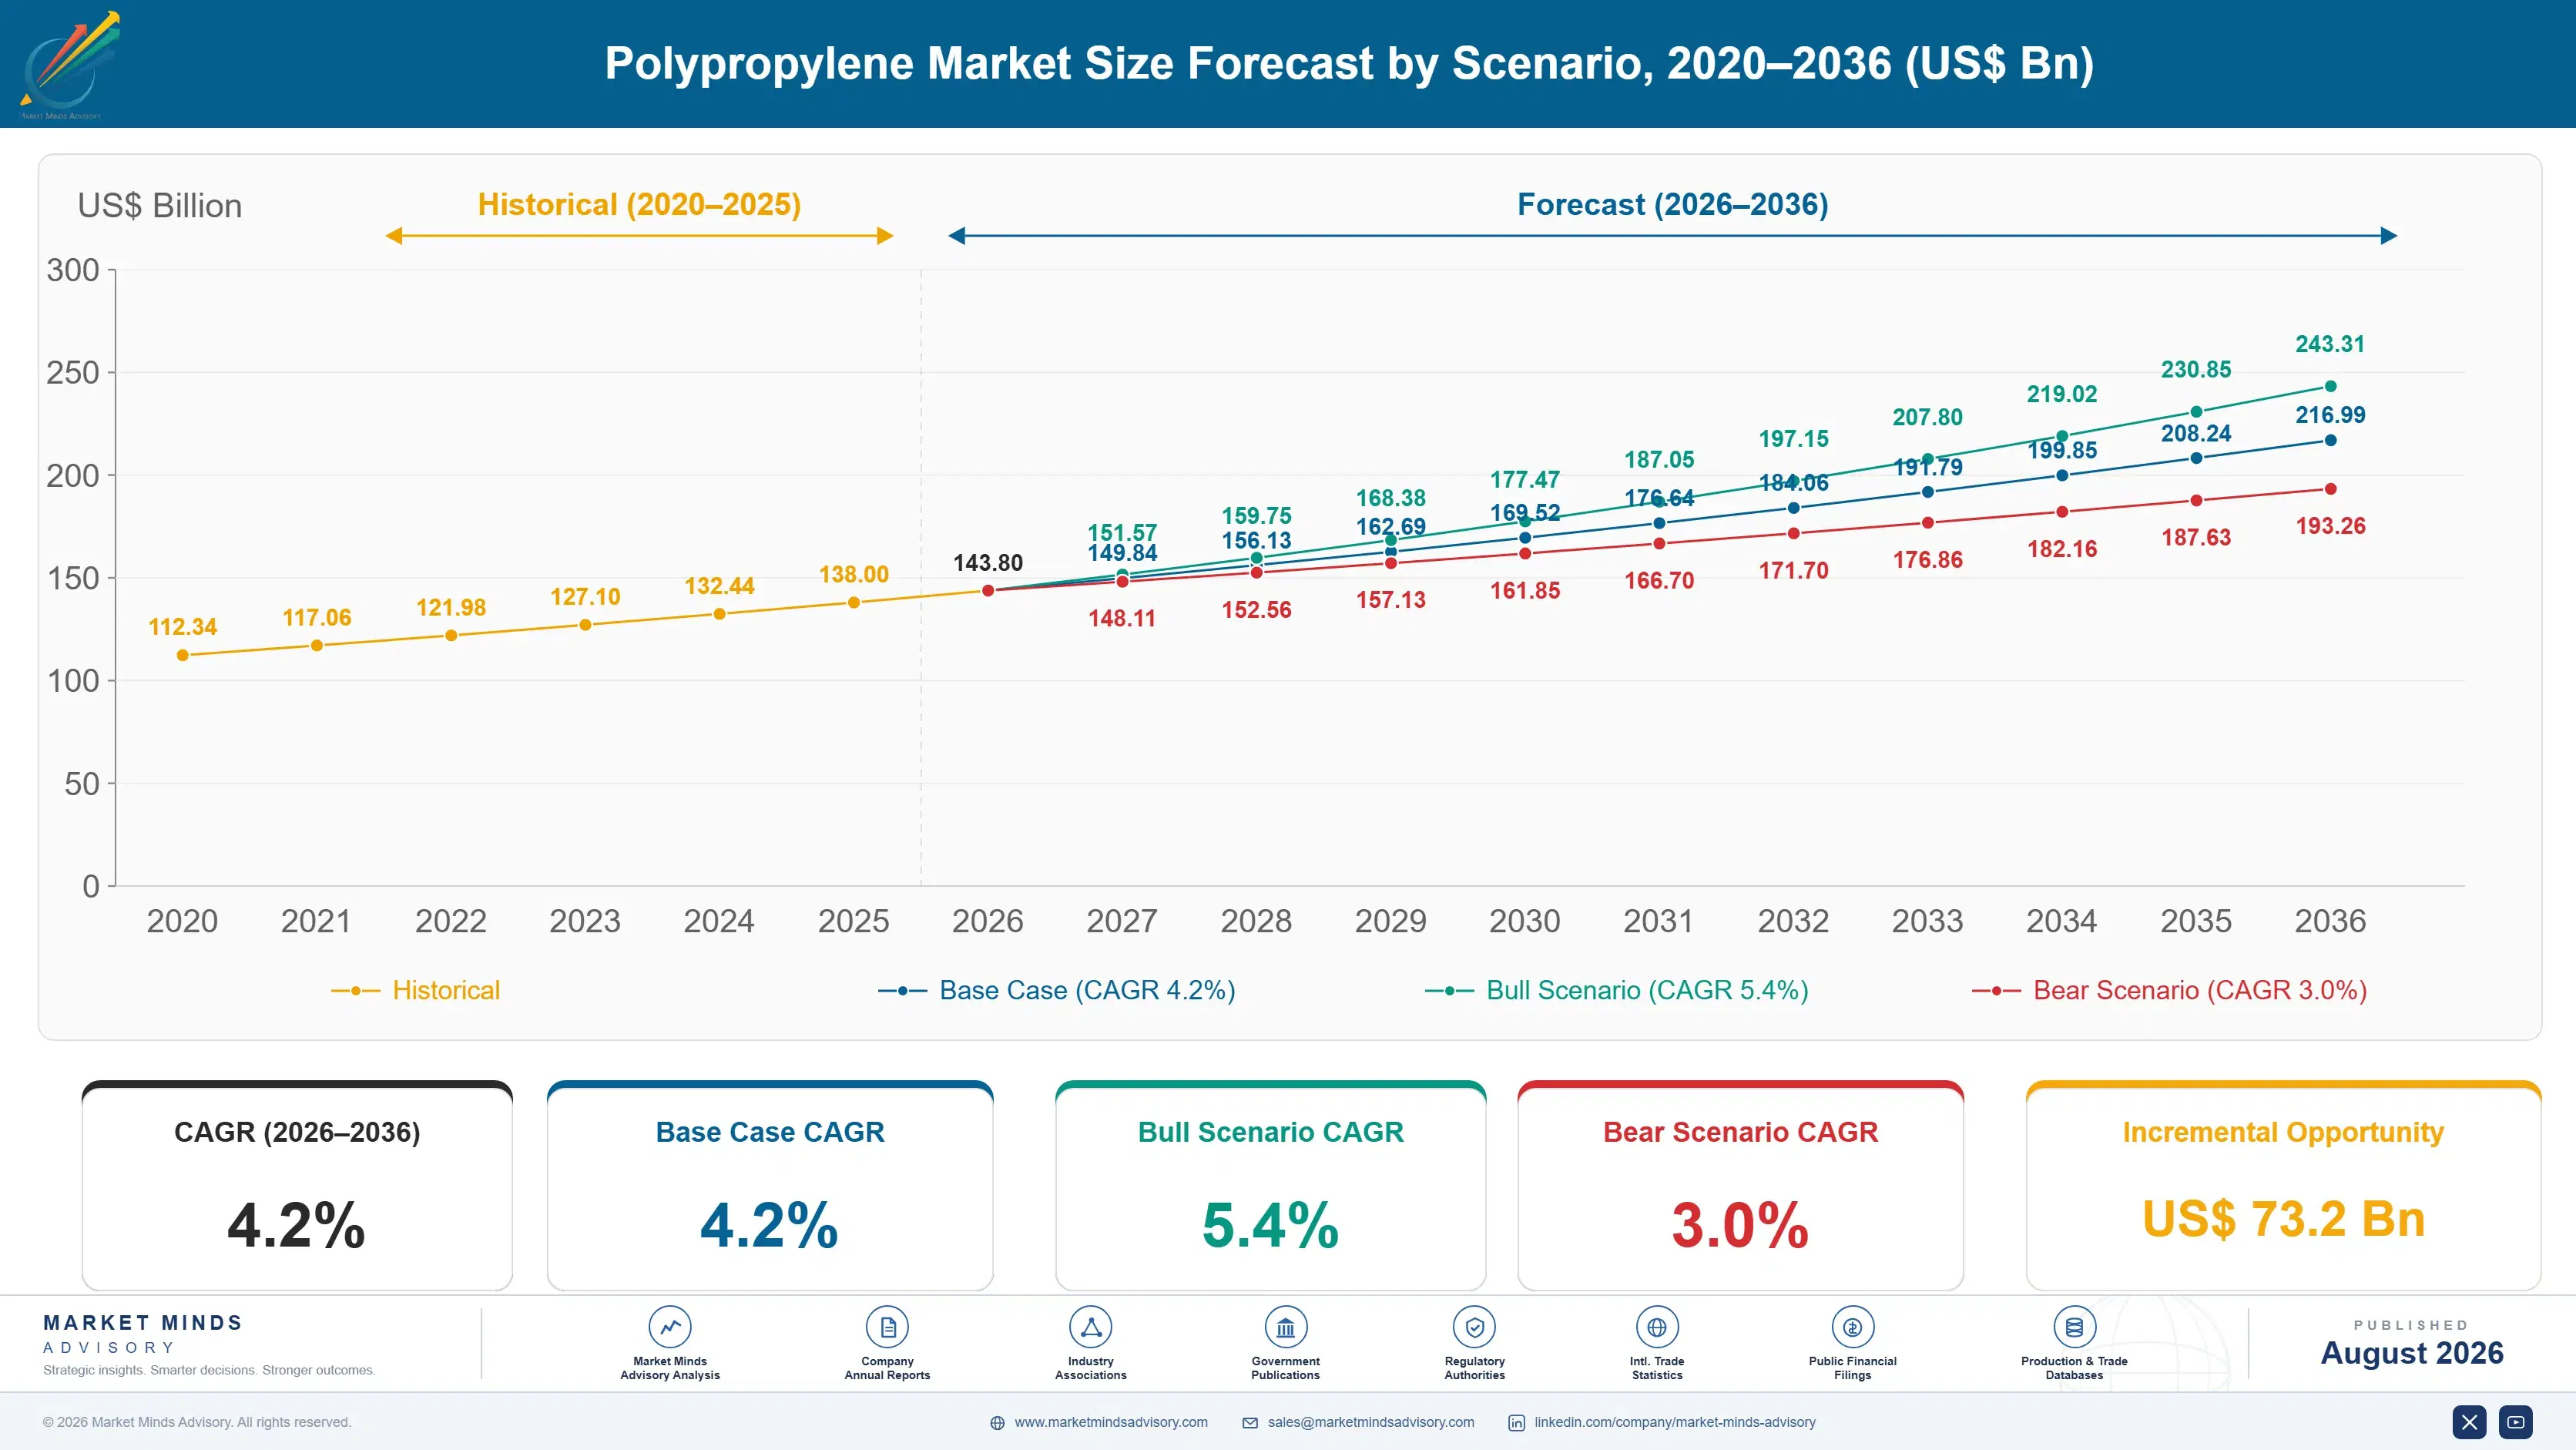
polypropylene-market-size-forecast-scenario-1787302397564
The 2020 to 2025 period ran at 3.4% and the margin environment mattered more than the volume did. Demand recovered steadily after 2020 while Chinese capacity additions ran well ahead of it, compressing operating rates and integrated margins across every region. European producers with naphtha-based propylene were worst affected once energy costs rose in 2022, and several rationalised capacity rather than continue running it.
Three mechanisms carry the 4.2% base case. Packaging demand across food, healthcare, and consumer goods is the largest, since polypropylene keeps taking share from other materials on cost and processability. Indian and Southeast Asian conversion capacity is the second, adding demand where per capita consumption remains far below developed markets. And recycled grade growth is the third, at 6.3%. Automotive lightweighting sits behind all three, adding volume in better-margin grades.
The 5.4% bull case rests on lightweighting and material substitution accelerating in automotive and appliances, which would add volume in grades that carry better margin than commodity packaging. The 3.0% bear case is further Chinese capacity arriving into an already oversupplied market, since operating rates near 81% leave no room to absorb additions without pushing marginal producers below cash cost.

Oversupply Meets Specialty Scarcity

The oversupply is not a cycle. Chinese propane dehydrogenation and coal-to-olefins capacity has been added faster than demand for over a decade, driven by feedstock advantage and industrial policy rather than by any return calculation a Western producer would recognise. Global operating rates near 81% with around 12 million tonnes of further additions announced means the marginal producer sets price, and that producer is increasingly Chinese.
TOP FIVE CONCENTRATION26%Fragmented, with regional producers serving local converter bases everywhere
GLOBAL OPERATING RATE81%Across nameplate capacity, well below historical industry norms
PROPYLENE SHARE OF COST68%Of total production cost from propylene monomer feedstock alone
RECYCLED CONTENT SHARE4%Of total demand currently met from recovered material
THIN WALL PACKAGING GAUGE0.35 mmAchievable wall thickness that only specialty grades support
CAPACITY ADDITION OVERHANG12 million tonnesAnnounced beyond forecast demand across the coming decade
That reality has separated the industry into two businesses. Commodity homopolymer and standard copolymer compete on delivered cost against a price floor nobody outside China influences, which makes feedstock position and freight radius the only meaningful variables. Specialty grades are a different market that happens to share a name, and the producers who invested in them are the ones still earning acceptable returns.
The specialty gap is wider than it looks. Metallocene and controlled-rheology grades qualified into medical devices, thin-wall packaging at 0.35 millimetres, or automotive interior parts require catalyst, process, and application capability that most producers simply do not hold. Concentration at 26% across all polypropylene masks positions in those grades that are considerably more consolidated. Qualification restricts supply there far more than capacity ever does.
"Producers keep telling us their cost position is competitive. Against whom? The Chinese plant setting the marginal price is not trying to earn a return on capital, and no amount of operating improvement answers that."
Director, Polyolefins and Petrochemical Markets Practice · MMA Chemicals and Com

Market Trends

Recycled Grades Grow On Mandate Rather Than Economics

Mechanically and chemically recycled polypropylene grows at 6.3% against 4.2% for the market, pulled by brand owner commitments and packaging content mandates rather than by any cost advantage over virgin resin. Recycled content still meets only 4% of demand. Food contact approval is the practical ceiling on mechanical recycling, and chemical recycling remains expensive enough that most volume is subsidised by a brand willing to pay for the claim. The gap between what mandates require and what approvable recycled resin exists is the defining problem here. Nobody has resolved it. Brands are paying premiums to bridge it.
Market Impact: Recycled meets only 4% of demand
Chinese Capacity Sets The Global Price Floor

Roughly 12 million tonnes of announced capacity sits beyond forecast demand, most of it Chinese propane dehydrogenation and coal-to-olefins built on feedstock advantage and policy support rather than on return expectations. Global operating rates near 81% leave no capacity to absorb it. European and some Asian producers have rationalised rather than run assets below cash cost, and further closures are the most likely mechanism through which this resolves. Running assets below cash cost while waiting for a recovery those additions will not permit destroys value. Several producers took too long to accept that.
Market Impact: Thin walls reach 0.35 mm

Market Opportunities and Growth Drivers

Polypropylene Keeps Taking Share From Other Materials

Cost, processability, chemical resistance, and density together let polypropylene displace polystyrene, polyethylene terephthalate, metals, and paper across packaging, appliances, and automotive interiors year after year. That substitution has run for decades and shows no sign of exhausting itself, since each processing improvement opens applications that were previously out of reach. Demand therefore grows faster than the end markets it serves, which is unusual for a commodity polymer. Each processing improvement opens applications that had previously been out of reach entirely. Thin-wall packaging is the current example. Metals and paper keep losing ground.
Market Impact: Overhang exceeds 12 million tonnes

Indian And Southeast Asian Conversion Capacity Expands

Per capita polypropylene consumption across India, Indonesia, and Vietnam remains far below developed market levels while conversion capacity is being built quickly across packaging, textiles, and automotive components. That growth is genuine demand rather than capacity relocation. Regional producers have added polymer capacity alongside, though not fast enough to cover the demand, which leaves those markets importing from an already oversupplied world. Regional polymer capacity has grown but not fast enough to cover that demand locally. Those markets import from an oversupplied world at attractive prices. Converters there benefit considerably.
Market Impact: Recycled content is only 4%

Market Restraints and Challenges

Capacity Overhang Suppresses Margin Across Every Region

Around 12 million tonnes of announced capacity sits beyond forecast demand and the root cause is that Chinese additions were built on feedstock advantage and industrial policy rather than on any expected return, so they run regardless of margin. Commercial impact is operating rates near 81% and marginal producers below cash cost. Mitigation runs through specialty grade migration, rationalising uncompetitive assets rather than running them, and feedstock integration where the position genuinely exists. Naphtha-based European capacity carries the worst position and several producers have already closed rather than continue. Further closures are the likely resolution.
Market Impact: Recycled grades grow at 6.3%

Food Contact Approval Caps Mechanical Recycling

Recycled polypropylene meets only 4% of demand and the root cause is that mechanically recycled material cannot generally achieve food contact approval, which is where the largest packaging volumes sit. Commercial impact is that mandates and brand commitments outrun the material actually available to meet them. Mitigation runs through chemical recycling routes that produce approvable material, closed-loop collection from non-food streams, and honest reporting of what recycled content is achievable. Chemical recycling produces approvable material and costs considerably more than virgin resin does. Brands are paying that premium to meet commitments. Volumes remain small against the mandates.
Market Impact: Operating rates sit near 81%
4 additional market trends, 3 additional growth drivers, and 2 additional restraints and challenges are covered in the full report. Contact sales@marketmindsadvisory.com to access the complete intelligence.

Segment CAGR and Growth Architecture

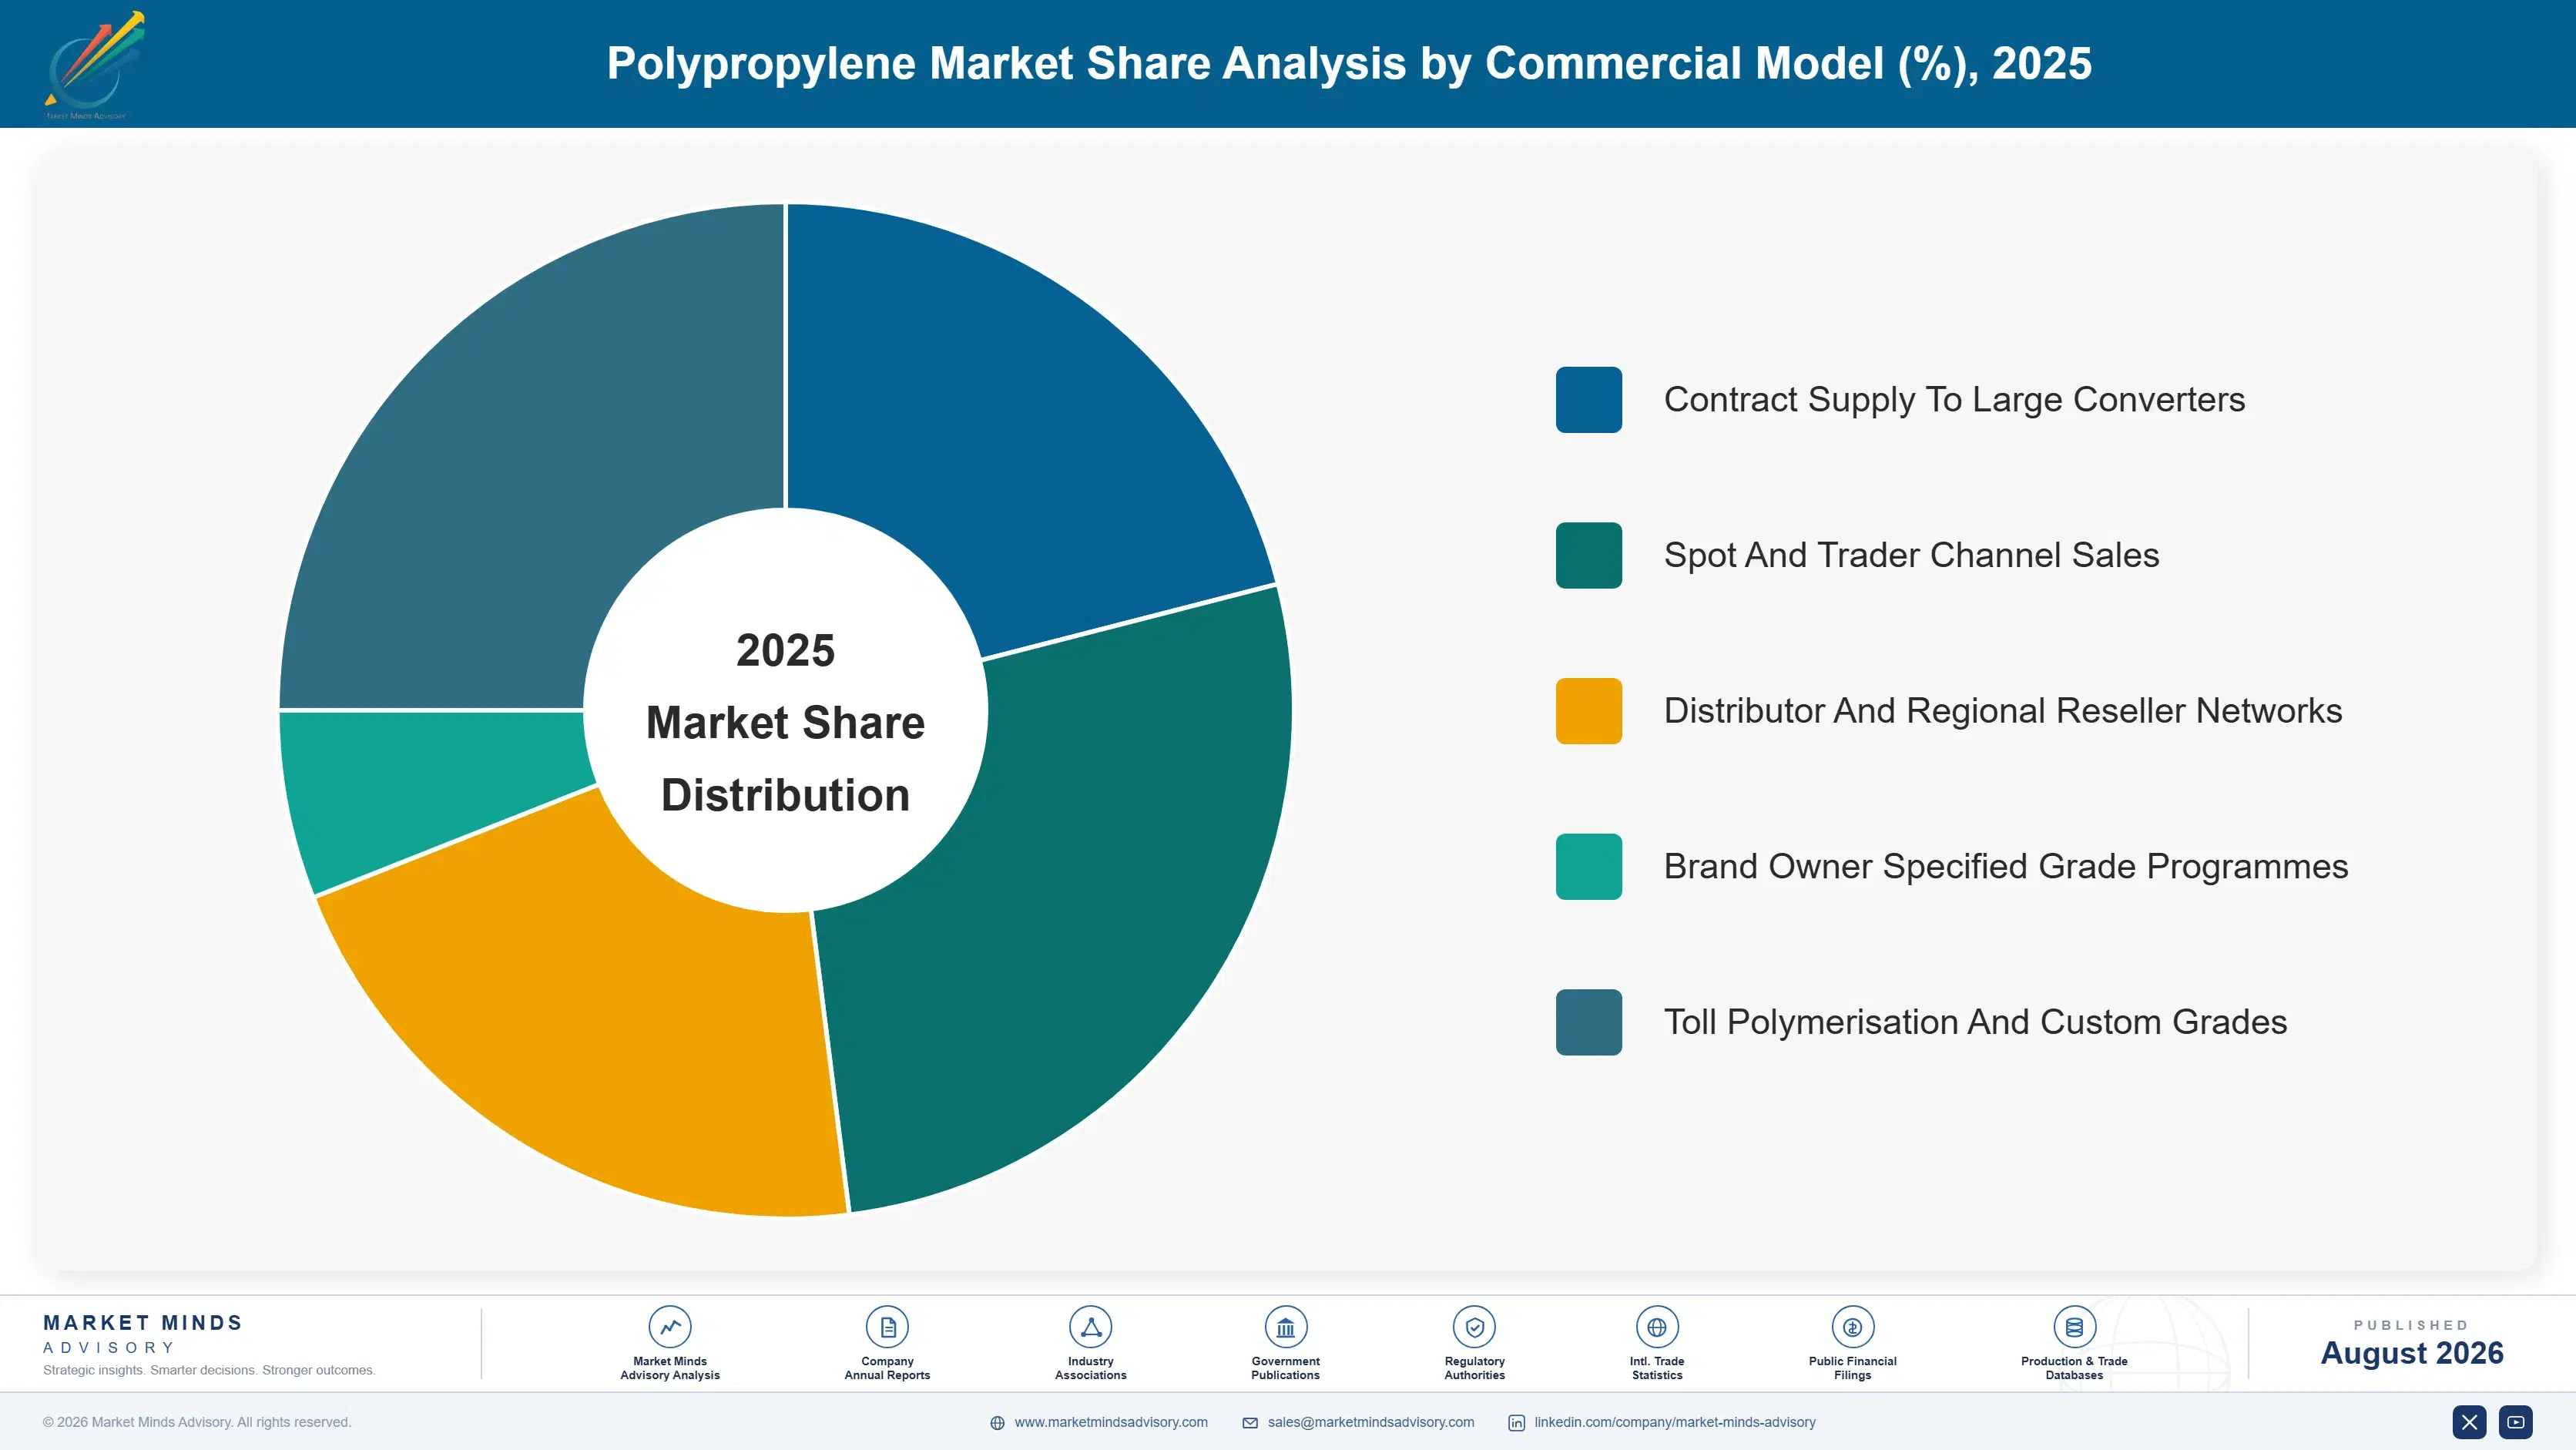
Segmentation follows polymer grade and the catalyst and process route producing it, because those determine mechanical properties, processability window, application qualification, and the margin a producer can actually hold. Converter industry and end application both cut across every grade rather than separating them, which makes either a weaker primary dimension. Grade decides which market a producer competes in.
polypropylene-market-market-share-analysis-1787302398096

Mechanically And Chemically Recycled Grades

The fastest grade family at 6.3%, exactly 1.50 times the market rate, though it still meets only 4% of total demand and grows on regulation and brand commitment rather than on economics. Mechanically recycled material rarely achieves food contact approval, which excludes it from the largest packaging volumes and pushes brands toward chemically recycled resin that costs considerably more than virgin. The gap between what mandates require and what approvable recycled polypropylene actually exists is the defining commercial problem in this segment and nobody has resolved it. Brand owners are contracting chemically recycled resin at substantial premiums to virgin pricing to meet food contact commitments. That premium is the segment's economics.
CAGR 6.3%

Specialty And Metallocene Grades

Second fastest at 5.4%, covering metallocene, controlled-rheology, and high-clarity grades qualified into medical devices, thin-wall packaging at 0.35 millimetres, and demanding automotive interior applications. Catalyst and process capability restricts who can produce them, and application qualification restricts who gets specified, which makes this a genuinely different business from commodity polypropylene despite sharing the name. Margins here have held while commodity grades compressed, and producers who invested in specialty capability before the oversupply arrived are the ones still earning acceptable returns. A resin qualified into a medical device cannot be substituted without regulatory work that no converter undertakes for price. That insulation holds through any commodity cycle. Very few producers hold those qualifications.
CAGR 5.4%
Full segment breakdown across 5 segments available in the complete report.

Regional Architecture and Country Demand Map

East Asia leads at 47%, far outside band, because Chinese capacity and conversion demand together dwarf every other region. South Asia and Pacific grows fastest as conversion capacity expands. India leads on rate. Six regional shares sit outside their framework bands. Capacity and conversion geography explain every one.

East Asia

Forty-seven percent, far outside the framework band, and justified because Chinese polypropylene capacity and conversion demand each exceed the rest of the world combined by a wide margin. Propane dehydrogenation and coal-to-olefins routes built on feedstock advantage and policy support have added capacity faster than demand for over a decade, which is why the marginal price is now set here. Japanese and Korean producers hold specialty grade positions rather than volume. Growth at 5.0% runs above the market rate on continuing conversion expansion. Chinese converters are themselves moving toward higher specification applications, which will eventually pull domestic producers up the grade ladder as well. That shift has barely started. Nothing forces it yet.
Share: 47% | CAGR: 5.0% (2026 to 2036)

North America

Fourteen percent, far below the framework band because polypropylene demand follows conversion capacity rather than economic output, and North American converters serve a smaller population base than Asian ones. Propane dehydrogenation capacity built on shale advantage gives regional producers a genuine cost position, though not one that reaches Asian markets economically. Packaging and automotive interiors carry most demand. Growth at 3.6% sits below the market rate, tracking a mature conversion base rather than any weakness in cost position. Propane-based cost advantage rarely reaches Asian markets economically once freight and duty are applied, which limits what the position is actually worth. Delivered cost decides sales. Plant gate cost decides nothing. Few producers map it.
Share: 14% | CAGR: 3.6% (2026 to 2036)
Regional intelligence for 5 additional markets available in the complete report: South Asia and Pacific, Western Europe, Middle East and Africa, Latin America, Eastern Europe. Contact sales@marketmindsadvisory.com.
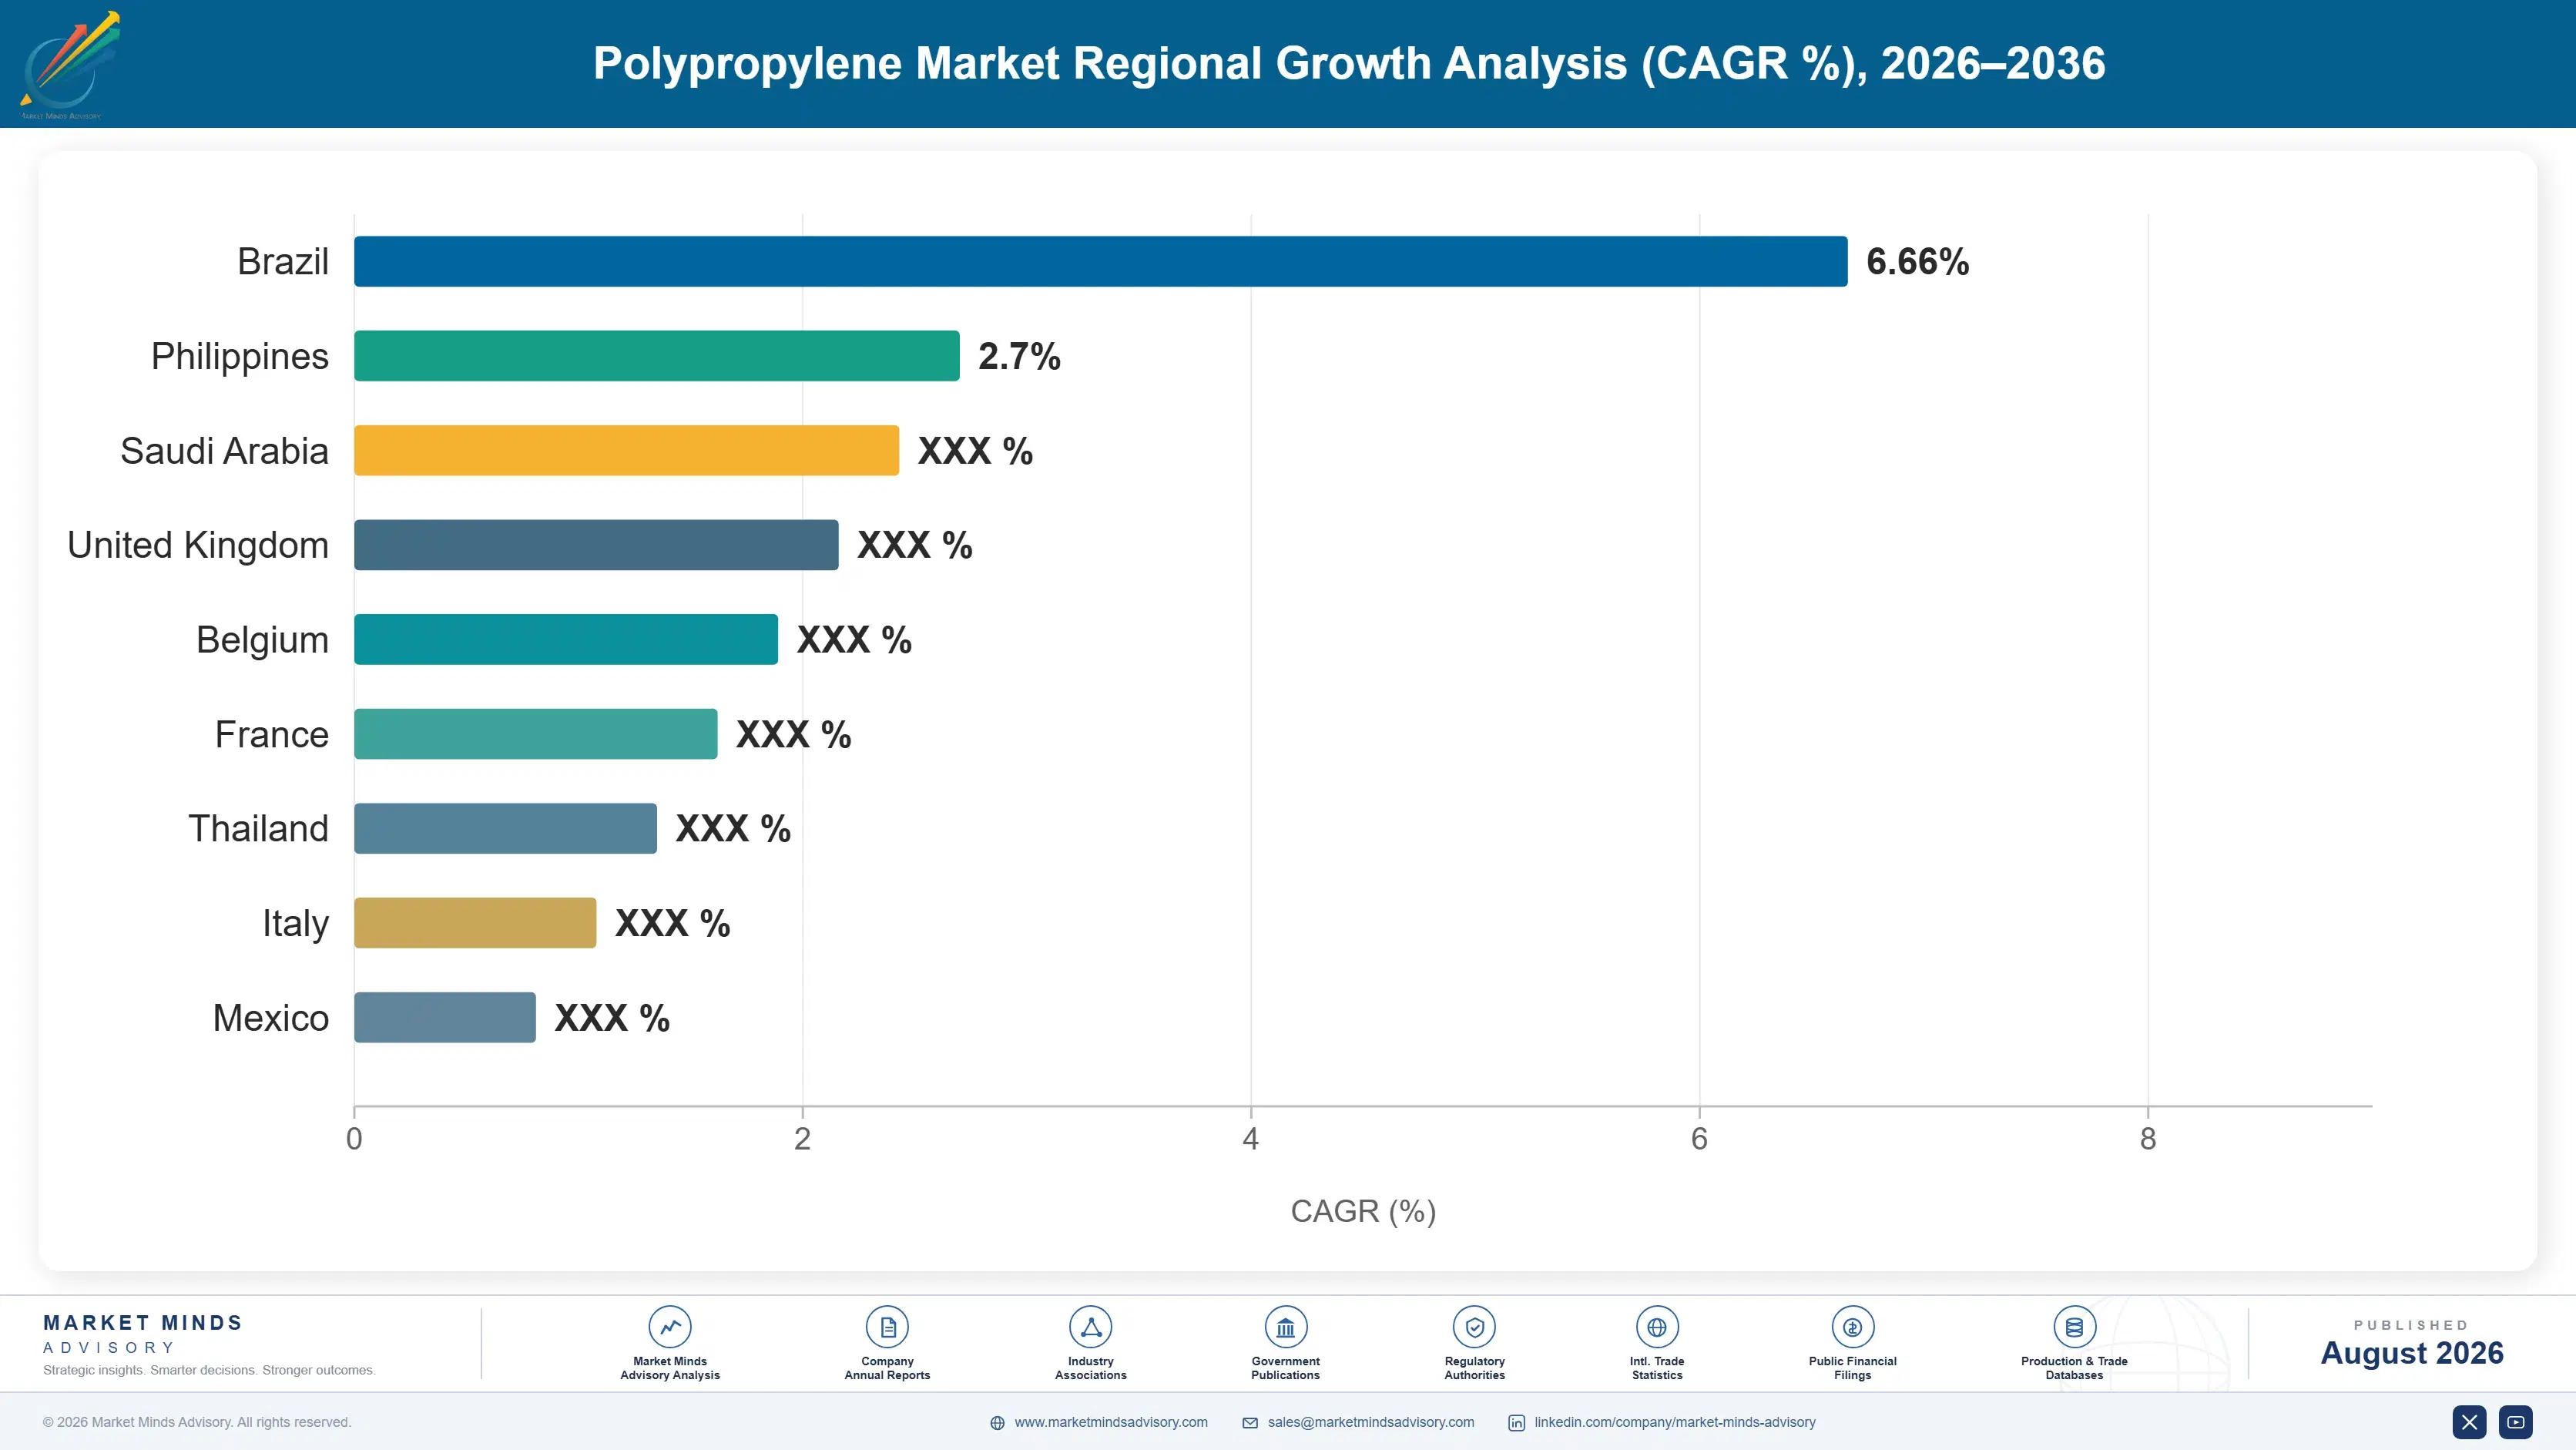
polypropylene-market-country-cagr-analysis-1787302398608

Specialty Migration And Honest Rationalisation

Operating rates sit near 81% with 12 million tonnes of overhang, propylene carries 68% of cost, recycled content meets only 4% of demand, and specialty grades grow at 5.4%. Value comes from specialty migration, feedstock position, and closing assets that will never earn a return. Operating improvement answers none of it. Structure decides outcomes.

Migrate Capacity Toward Specialty And Metallocene Grades

Specialty grades grow at 5.4% against 4.2% for the market and have held margin while commodity grades compressed, because catalyst capability and application qualification restrict who can supply them at all. Metallocene resin qualified into a medical device or a 0.35 millimetre thin-wall packaging line is not competing against Chinese homopolymer in any meaningful sense. Producers who made that migration before the oversupply arrived are the ones still earning returns. Qualification into a medical device or an automotive interior part restricts supply far more than capacity ever does. Those positions survive commodity cycles intact.
Market Impact: Specialty grades grow at 5.4% every

Close Assets That Will Never Recover Their Cost

Global operating rates near 81% with roughly 12 million tonnes of further capacity announced mean some assets will not run economically again in any cycle. Naphtha-based European capacity is the clearest case. Running a plant below cash cost while waiting for a recovery that Chinese capacity additions will not permit destroys more value than the closure charge does, and several producers have taken far too long to accept that arithmetic. Global operating rates near 81% leave nothing to absorb further additions without pushing marginal producers below cash cost. Rationalisation is the only plausible resolution.
Market Impact: Overhang now exceeds a 12 million t

Convert Feedstock Advantage Into Delivered Cost Position

Propylene carries roughly 68% of production cost, so a producer with advantaged propane or refinery propylene holds a position no operating improvement replicates. Gulf and North American producers have that advantage and frequently fail to convert it into markets where freight and duty preserve it. Delivered cost rather than plant gate cost is what decides sales, and the distinction gets lost inside integrated companies more often than it should. Mapping delivered cost by destination rather than production cost by asset changes commercial priorities considerably. Most producers have never done that properly.
Market Impact: Propylene alone carries 68% of all

Build Approvable Recycled Supply Rather Than Claims

Recycled polypropylene meets only 4% of demand while brand commitments and content mandates assume far more, and mechanically recycled material rarely reaches food contact approval where the largest packaging volumes sit. Producers who secure approvable recycled supply, whether through chemical recycling or controlled closed-loop collection, are selling into demand that exceeds availability. That is a rare position in a market this oversupplied and it will not last indefinitely. Recycled content still meets only 4% of demand while mandates and commitments assume considerably more. Brands are paying premiums to bridge that. The premium will not last indefinitely.
Market Impact: Recycled meets only 4% of the total

Who Controls the Margin Pool

Concentration is very low at 26% across the top five measured on polymer capacity, and the fragmentation is genuine rather than an artefact of how the market is measured. Polypropylene plants are built regionally to serve converter bases within economic freight range, and capacity has been added by national producers, integrated refiners, and policy-driven investors with quite different return expectations. The leader to challenger gap is meaningless on commodity grades and decisive on
Competitive activity runs on three fronts. Feedstock position is the first, since propylene carries roughly 68% of cost and no operating improvement substitutes for advantaged monomer. Specialty and metallocene capability is the second, where the margin that remains in this industry has concentrated. And approvable recycled supply is the third, currently short of the demand that mandates have created.

Pressure arrives from two directions. Chinese capacity continues arriving regardless of global operating rates. And brand owner recycled content commitments are pulling demand toward material that barely exists. Rankings shift on rationalisation decisions rather than on any commercial activity. Neither pressure touches specialty and medical grades, where catalyst capability and qualification restrict participation and margins have held throughout the oversupply. That tier behaves as a separate industry.
polypropylene-market-company-positioning-matrix-1787302399123

Competitive Moat and Risk Dimensions

LYONDELLBASELL

Moat: Process technology and specialty breadth

Ownership of widely licensed polypropylene process technology gives visibility across the industry's capacity base alongside a specialty and metallocene portfolio that commodity producers cannot match. Licensing income is uncorrelated with resin margin, which matters considerably in an oversupplied market. Application development depth across automotive and healthcare converters reinforces the specialty position further.
LYONDELLBASELL

Risk: European asset cost disadvantage

Naphtha-based European capacity carries a cost position that energy pricing since 2022 has made permanently uncompetitive against advantaged propane and Chinese coal-based routes. No operating improvement closes a feedstock gap of that size anywhere. Rationalisation charges are substantial and the alternative is running assets below cash cost indefinitely.
SINOPEC

Moat: Scale and domestic demand access

Enormous domestic capacity sitting inside the world's largest conversion market gives freight and relationship advantages that importing producers cannot overcome on price. Integrated refinery propylene supply removes most of the feedstock exposure that carries 68% of production cost. Both advantages are reinforced rather than threatened by the capacity additions compressing margins elsewhere.
SINOPEC

Risk: Specialty grade position remains narrow

Specialty and metallocene grades grow at 5.4% and carry the margin that has survived the oversupply, and a volume-weighted position participates in that only partially. Catalyst and application qualification capability takes years to build rather than capital to buy. Domestic converters are themselves moving toward higher specification applications over time.

Players Tracked

Prominent Players

LyondellBasell
Sinopec
SABIC
ExxonMobil
Braskem

Other Key Players

Borealis
TotalEnergies
INEOS
Reliance Industries
Formosa Plastics
Hanwha TotalEnergies Petrochemical
LG Chem
Mitsui Chemicals
Sumitomo Chemical
PetroChina
Hengli Petrochemical
Rongsheng Petrochemical
Indian Oil Corporation
Borouge
Advanced Petrochemical Company

Recent Developments

FEBRUARY 2025

European producer permanently closes naphtha-based polypropylene capacity

A European petrochemical producer permanently shut polypropylene capacity fed by naphtha-based propylene, citing a cost position that regional energy pricing had made permanently uncompetitive against imported resin. The closure was an internal rationalisation decision rather than any technical failure, regulatory action, or sale of the asset.
Signal: Rationalisation is now the only mechanism
MAY 2025

Brand owner contracts chemically recycled resin above virgin pricing

A consumer goods company contracted chemically recycled polypropylene at a substantial premium to virgin resin to meet food contact packaging content commitments that mechanically recycled material could not satisfy. The agreement was a long-term supply contract rather than any joint venture, acquisition, or investment in recycling capacity.
Signal: Food contact approval is the ceiling that
SEPTEMBER 2025

Producer qualifies metallocene grade into thin-wall packaging line

A polypropylene producer completed qualification of a metallocene grade into a thin-wall injection moulding line running below 0.4 millimetres, an application where conventional grades had failed on flow length and part stiffness together. The qualification was a technical development outcome rather than any commercial arrangement change.
Signal: Specialty qualification is where the remai

Propylene, Energy and Catalyst

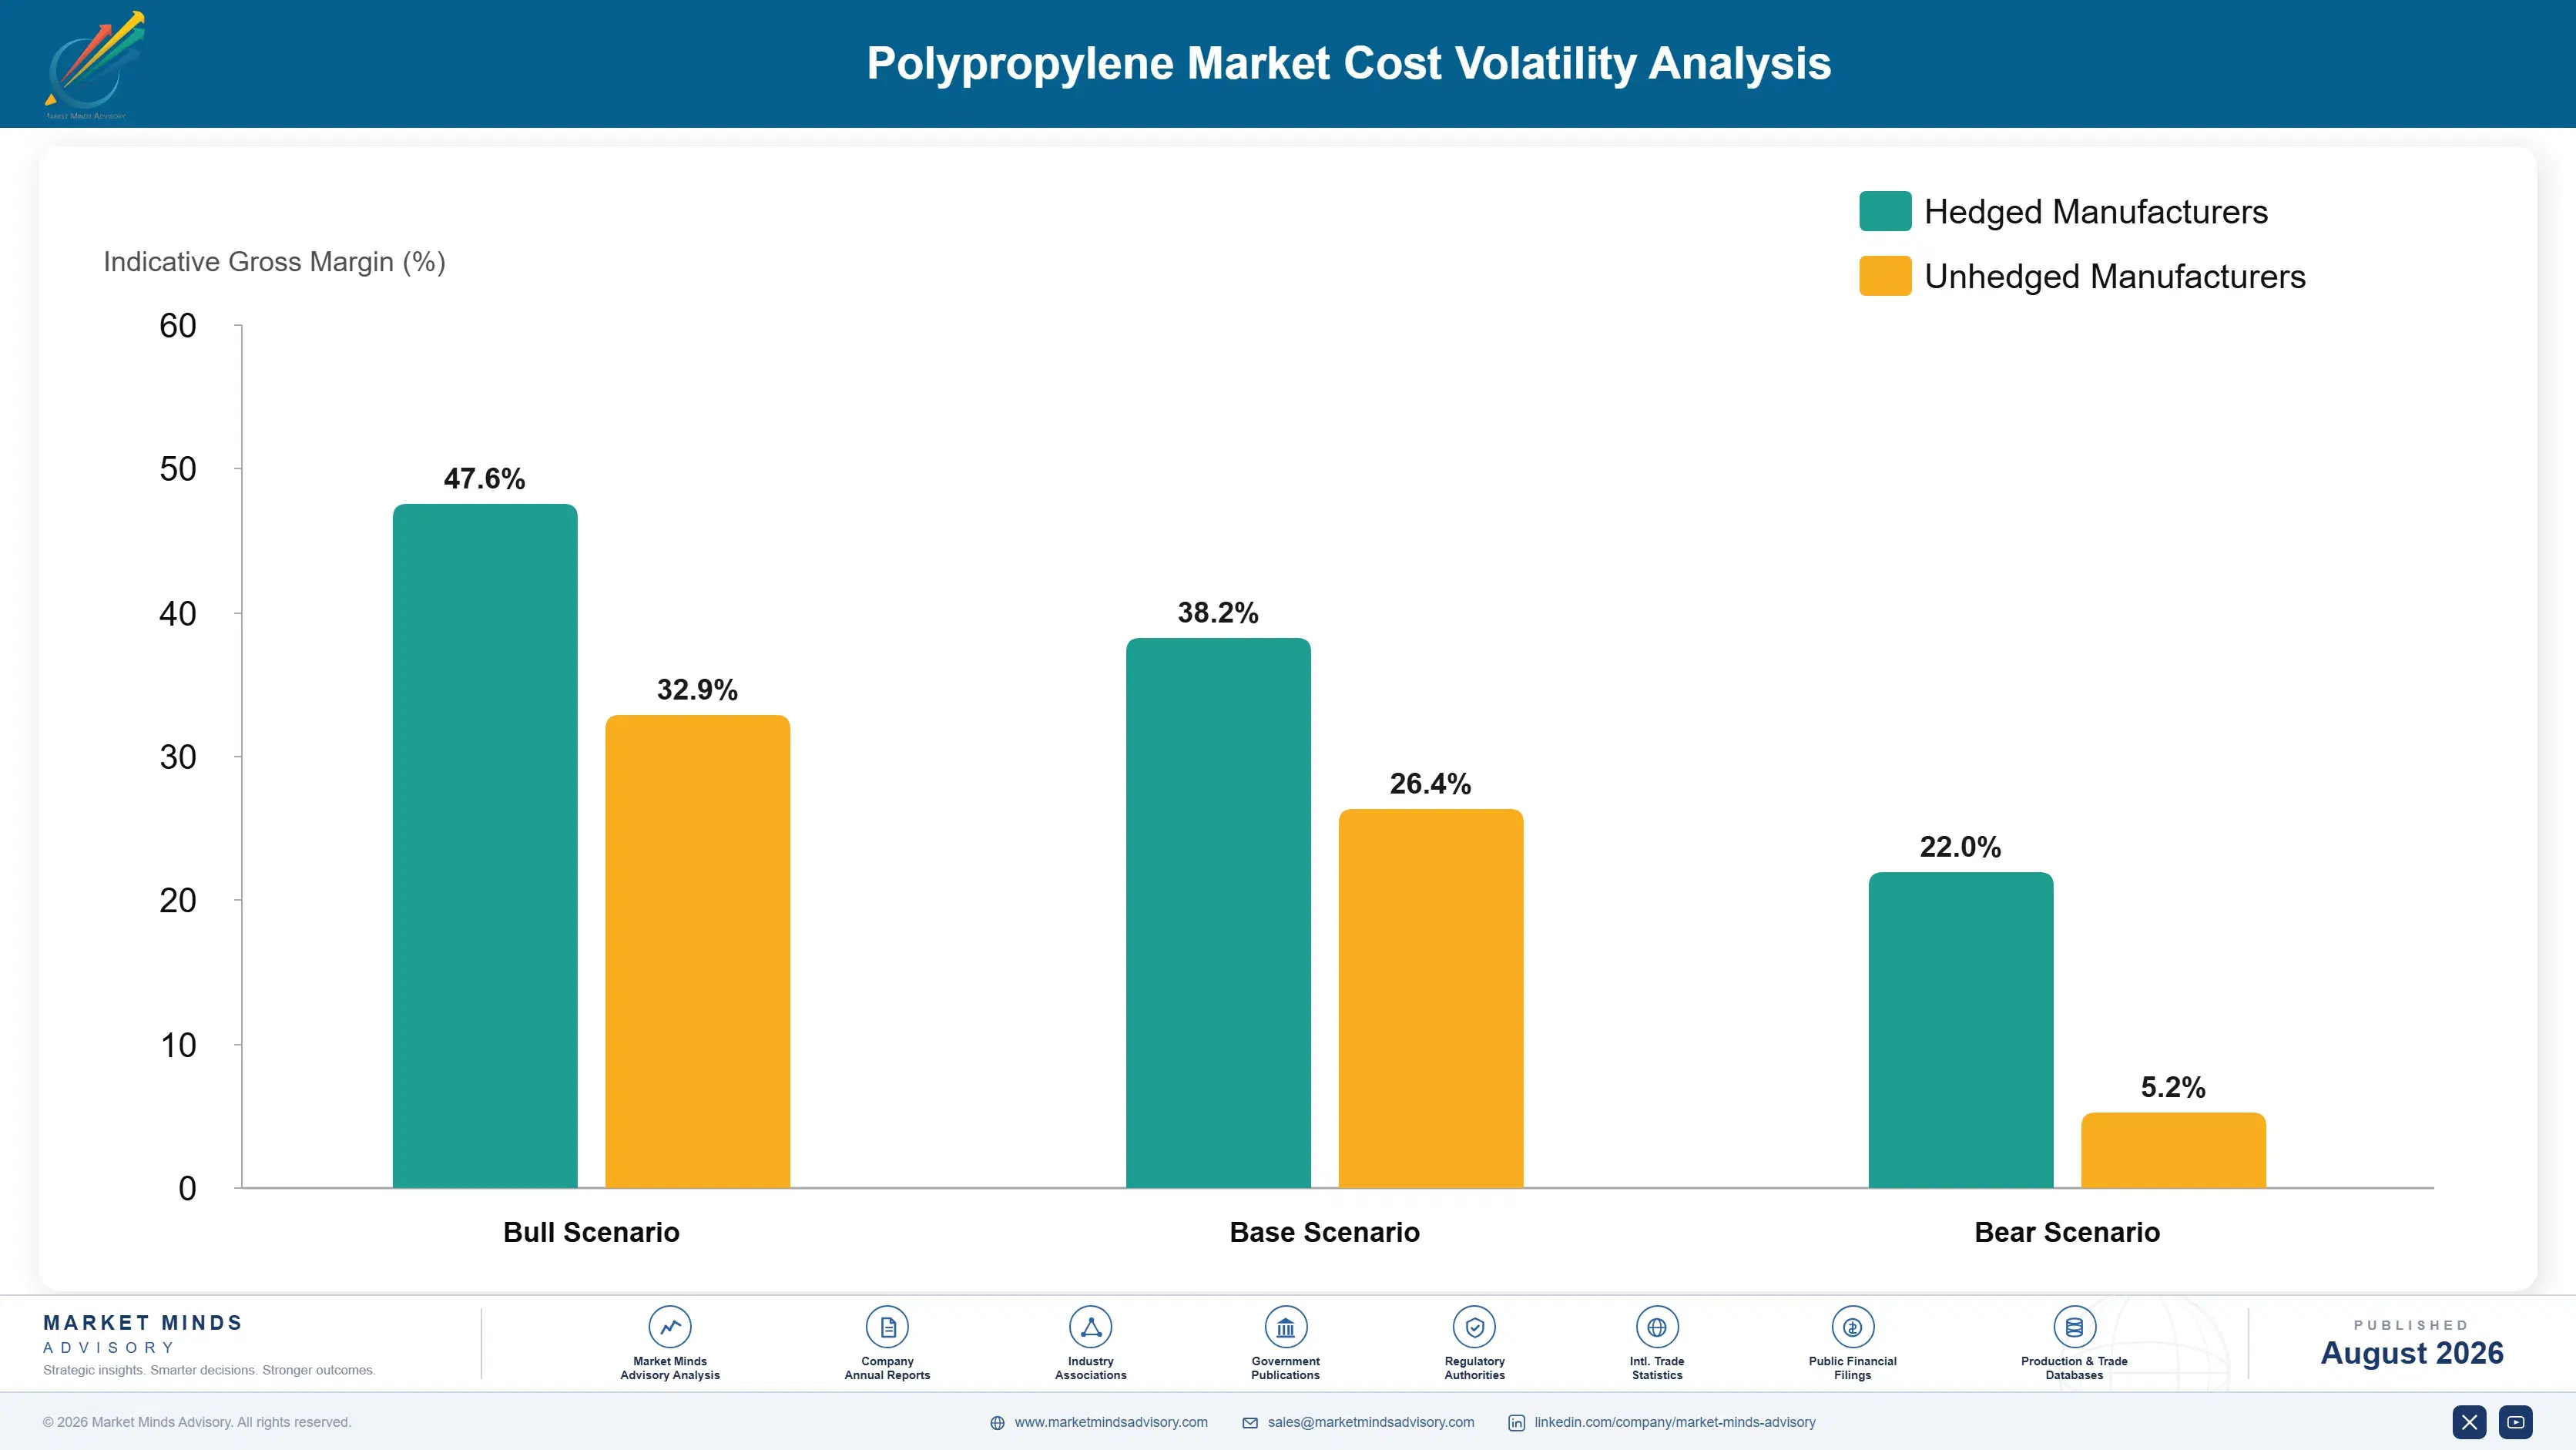
Production cost divides between propylene monomer at roughly 68%, polymerisation and finishing energy near 13%, catalyst and process additives around 7%, packaging and outbound logistics about 8%, and labour, maintenance, and overhead the balance. Propylene dominates so heavily that everything else is a rounding difference between competent producers, which is why feedstock position rather than plant efficiency decides who survives an oversupply.
European naphtha and industrial energy costs rose sharply through 2022 and stayed elevated, and several petrochemical producers disclosed margin compression and capacity rationalisation in filings covering that period, with IEA data tracking the underlying energy movement. Propane-based and coal-based routes were far less affected. That divergence did not reverse, and it has reshaped which regional assets can compete at all. Chinese coal-based routes sit outside that comparison entirely.

The competitive disadvantage mechanism runs through feedstock route rather than through operating efficiency. Polymerisation plants of similar vintage convert propylene at broadly comparable efficiency, while the delivered cost of that propylene differs by amounts no operating programme can close. European naphtha crackers carry the worst position, Gulf and North American propane the best, and Chinese coal-based routes sit outside the comparison because their investment case was never a return calculation.
polypropylene-market-cost-volatility-analysis-1787302399317

Secure advantaged propylene or accept the marginal position

Propylene carries roughly 68% of production cost and the delivered cost of that monomer differs by amounts no efficiency programme can close. A producer without advantaged propane, refinery propylene, or integrated cracker economics is a marginal producer whatever it does inside the plant. Recognising that early leads to better decisions than pursuing operating improvements that cannot bridge the gap.

Shift catalyst systems toward higher value grade capability

Catalyst and process additives carry around 7% of cost while determining whether a plant can produce metallocene, controlled-rheology, and high-clarity grades at all. That is the cheapest line in the cost structure and the one that decides which market a producer competes in. Converting a line to specialty capability costs capital and changes the competitive question entirely.

Optimise logistics against genuine delivered cost positions

Packaging and outbound logistics carry about 8% of cost, and resin from an advantaged plant loses that advantage across sufficient distance or duty. Producers routinely calculate cost at the plant gate and sell into markets where freight erases the difference entirely. Mapping delivered cost by destination rather than production cost by asset changes commercial priorities more than most producers expect.

Portfolio Architecture for Margin Defence

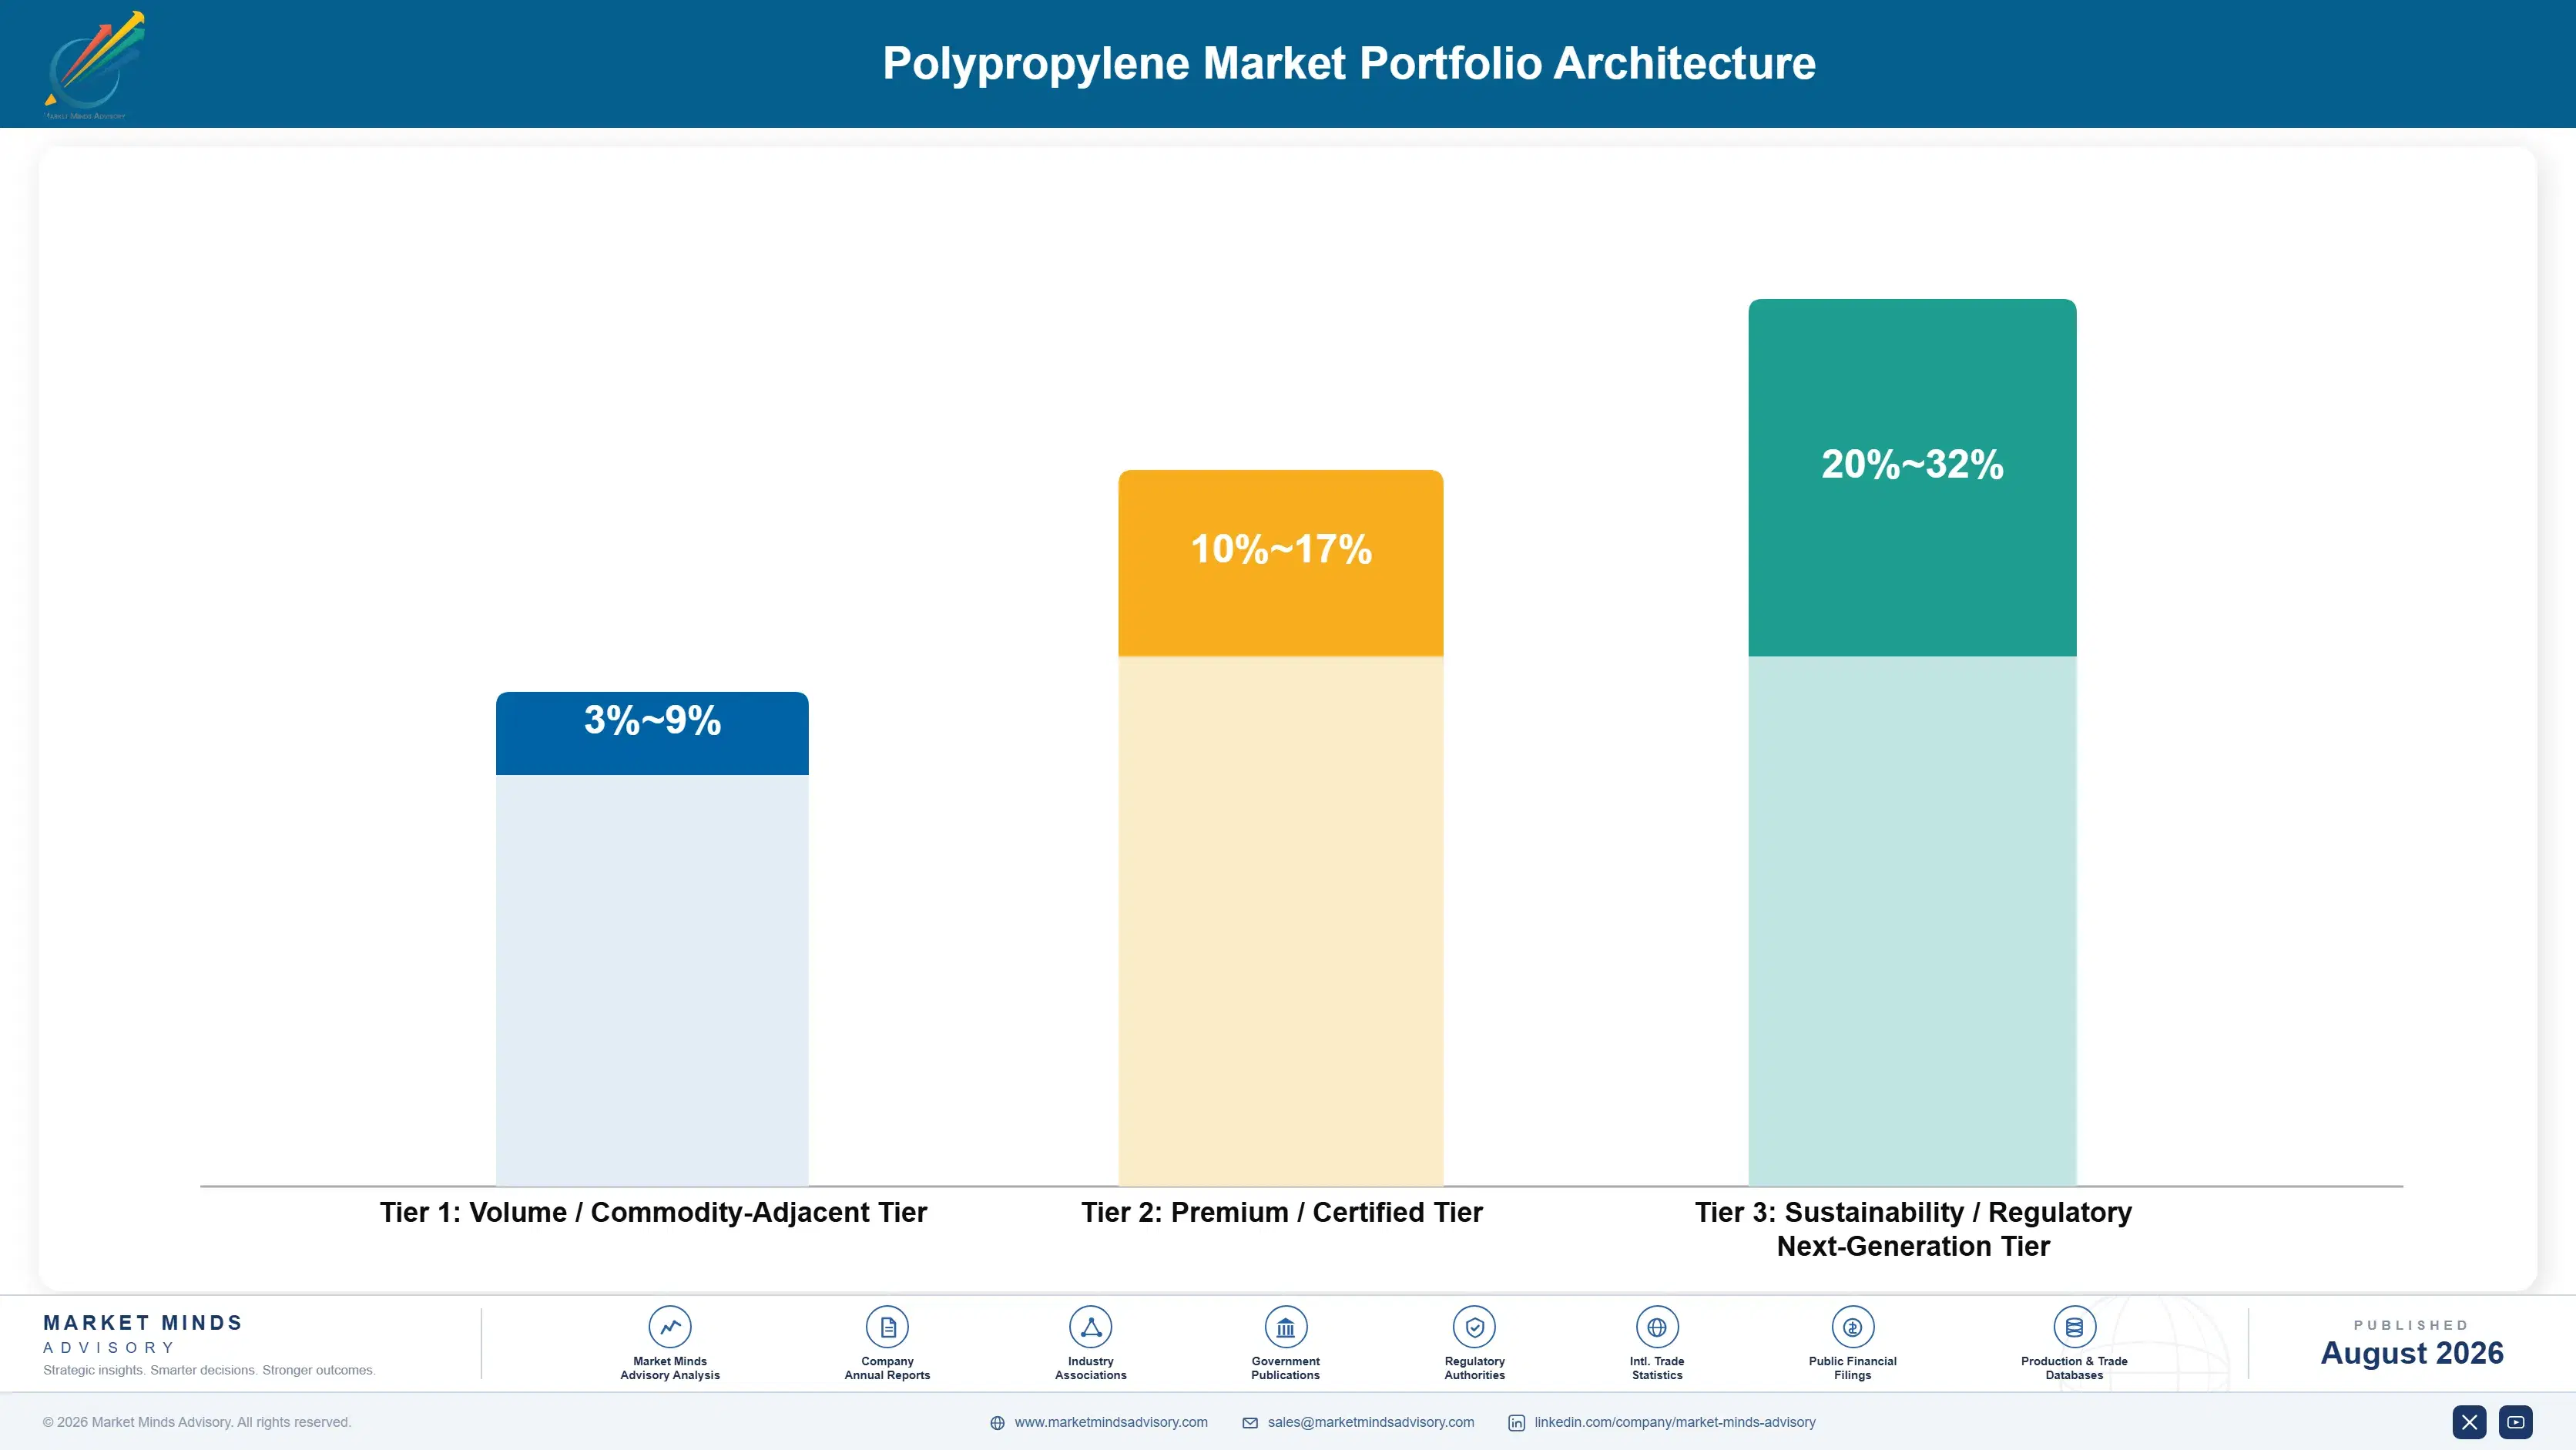
Three tiers describe this business and the spread follows grade capability rather than volume. Commodity homopolymer and standard copolymer sit at the bottom, competing on delivered cost against a price floor set outside the producer's control entirely. Random and impact copolymers for demanding conversion occupy the middle. Specialty, metallocene, and approvable recycled grades sit at the top, where capability rather than cost decides participation.
The tension is that commodity grades fill the plant and earn least, and in the current oversupply they frequently earn nothing at all. A producer weighted there is running assets to absorb fixed cost while the marginal price is set by someone with different return expectations. One weighted toward specialty holds margin on volumes that cannot fill a world-scale line by themselves.

High-value pools concentrate where qualification restricts supply. Medical and healthcare grades are the clearest case, since a resin qualified into a device or a drug delivery component cannot be substituted without regulatory work nobody undertakes for a resin price difference, and that insulation holds through any commodity cycle. Approvable recycled resin is the second such pool, short against mandates that assume far more than exists.

Volume / Commodity-Adjacent Tier

Homopolymer and standard copolymer grades competing on delivered cost against a price floor set by producers with different return expectations. Fills the plant and frequently earns nothing at all. Freight radius is the only other variable.
Gross Margin: 3-9%

Premium / Certified Tier

Random and impact copolymer grades for demanding conversion in packaging, appliances, and automotive components. Processability and consistency differentiate producers here in ways commodity grades never allow. Consistency across lots matters as much as the datasheet does.
Gross Margin: 10-17%

Sustainability / Regulatory / Next-Generation Tier

Metallocene, medical, high-clarity, and approvable recycled grades where catalyst capability and qualification restrict participation. Best margin available and the only tier insulated from the oversupply. Volumes cannot fill a world-scale line alone.
Gross Margin: 20-32%
polypropylene-market-portfolio-architecture-1787302399816

Converters, Grades and Qualifications

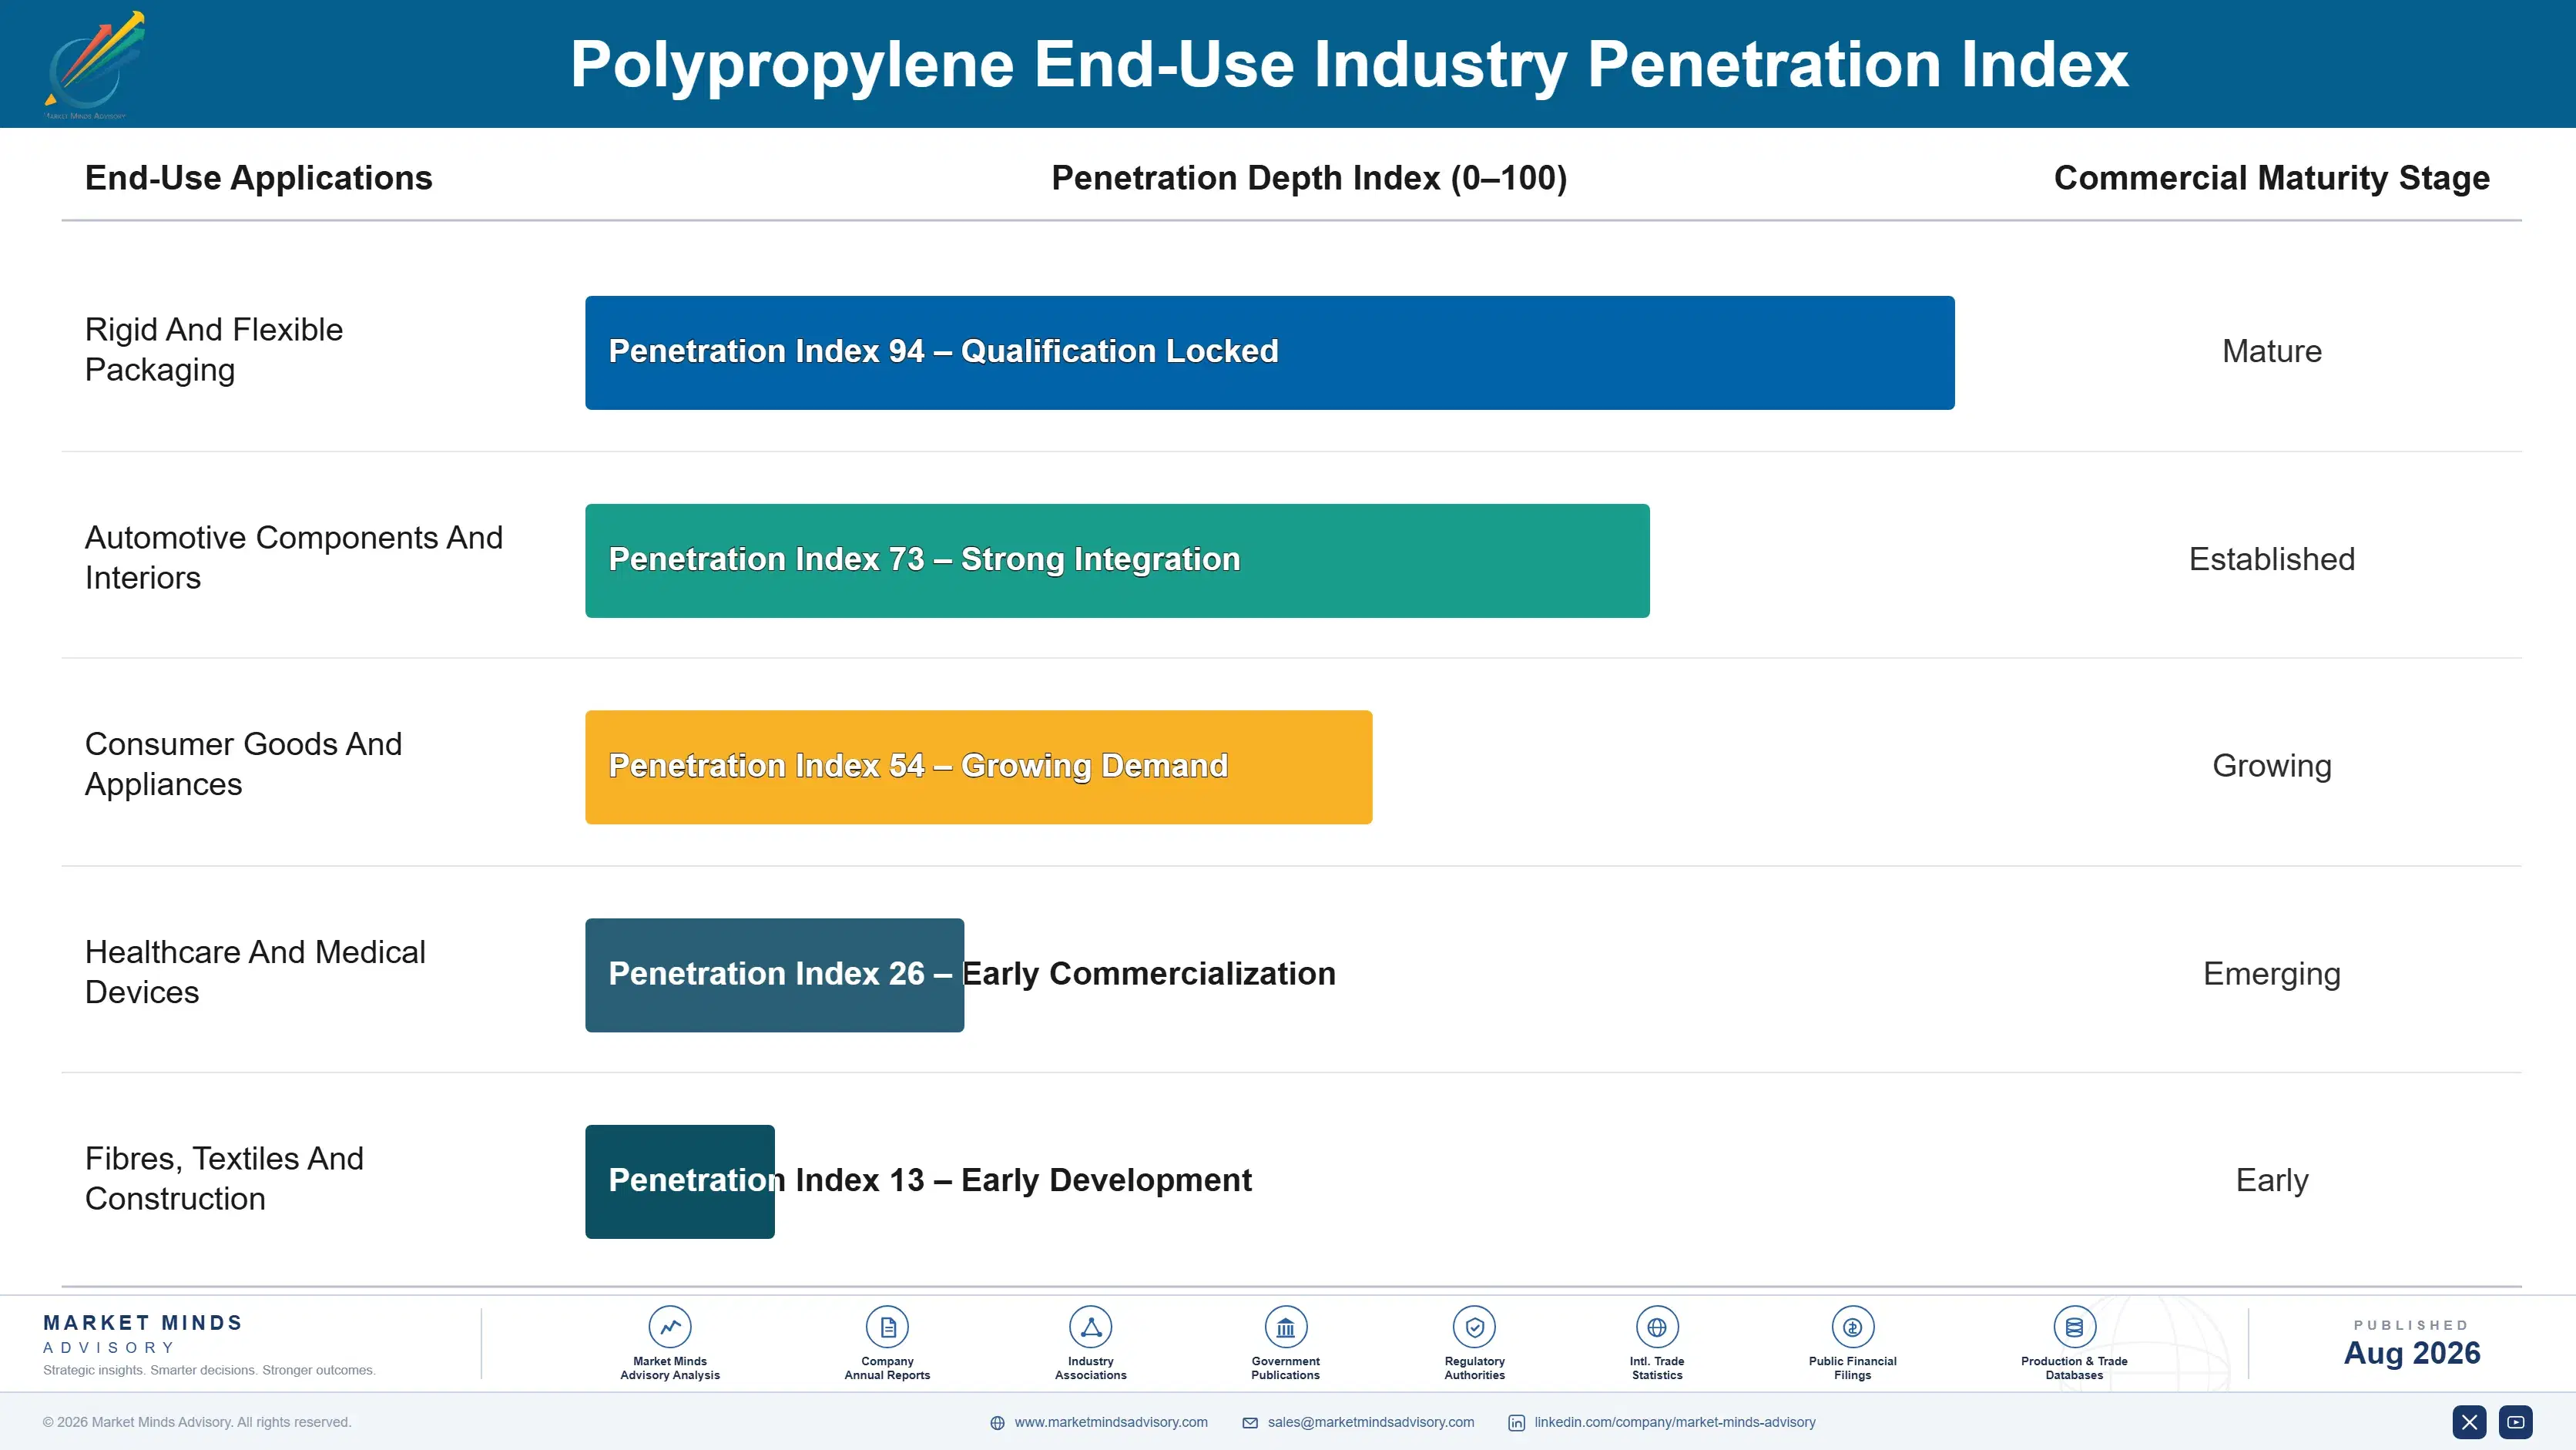
Demand behaves as a continuous flow tied to converter operating rates rather than any project cycle, which makes volumes predictable and prices anything but. A converter running injection moulding or extrusion lines consumes resin against its own order book, buys on contract or spot depending on grade, and switches supplier on delivered price wherever qualification does not prevent it. Most commodity volume moves that way.
Stickiness varies enormously by grade and by end application. Medical and healthcare grades are effectively permanent, since requalification involves regulatory work nobody undertakes for a resin price difference. Automotive interior grades are firm through a platform's life. Packaging and general injection moulding grades stick hardly at all, and converters do move volume on a few percent of delivered cost.

Buyer profiles shifted as recycled content mandates arrived. The earlier buyer was a converter purchasing manager comparing delivered resin prices across qualified suppliers. The current conversation increasingly involves a brand owner's packaging or sustainability function specifying recycled content several steps upstream, at levels that approvable recycled supply cannot currently meet anywhere. That conversation now starts several steps upstream of the resin purchase itself, at levels approvable supply cannot meet.
polypropylene-market-end-use-penetration-index-1787302400301

What We Would Tell a Board

These are among the four positions where our research anticipates prominent divergence between winners and laggards over the coming forecast period. Each is grounded in the demand model, the regulatory perimeter, and the announced capacity pipeline.
01 / SPECIALTY GRADE MIGRATION

Move up or accept the marginal producer's price

Specialty and metallocene grades grow at 5.4% against 4.2% for the wider market and have held margin throughout an oversupply that compressed commodity grades to nothing in several regions. Catalyst capability and application qualification together restrict who can supply those grades at all, which is exactly what makes the positions defensible against incoming Chinese capacity. Producers who made that migration before the capacity overhang arrived are the ones still earning acceptable returns today, and the gap has widened every year since.
02 / ASSET RATIONALISATION REALISM

Close what will never earn its cost again

Global operating rates near 81% with roughly 12 million tonnes of further announced capacity mean some assets will not run economically again through any cycle this industry is likely to see. Naphtha-based European capacity is the clearest and least contested example of that anywhere in this industry, and several producers have already acted on it. Running a plant below cash cost while awaiting a recovery that Chinese additions will simply not permit destroys considerably more value than any closure charge ever does.
03 / FEEDSTOCK POSITION CONVERSION

Advantaged propylene only counts where it lands

Propylene carries roughly 68% of production cost, so advantaged propane or refinery propylene creates a cost position that no operating improvement anywhere inside the plant can replicate, match, or close. Producers holding that advantage routinely calculate their cost at the plant gate and then sell into markets where freight and duty erase the whole difference. Mapping delivered cost by destination rather than production cost by individual asset changes a producer's commercial priorities considerably more than most of them ever expect it to.
04 / RECYCLED SUPPLY SECURING

Approvable recycled resin is genuinely short

Recycled polypropylene meets only 4% of total demand while brand content commitments and packaging mandates assume considerably more, and mechanically recycled material rarely reaches food contact approval at all, which is where the largest packaging volumes actually sit. Producers who secure approvable recycled supply, whether through chemical recycling or controlled closed-loop collection, are selling into demand that comfortably exceeds available supply. That is a genuinely rare position in a market this heavily oversupplied, and nothing about the current premium suggests it will persist indefinitely.

Engagement Snapshot From the Field

A live engagement with an industry participant carrying material or product regulatory and market exposure ahead of a defining policy shift, showing how our research translates into a defensible multi-year portfolio strategy.
MARKET MINDS ADVISORY · CLIENT ENGAGEMENT SUMMARY
Polypropylene Producer Strategic Portfolio Review and Transition Roadmap 2026·Investment Scenario on Polypropylene Exposure Evaluation 2025-26
CLIENT PROFILE
A regional polyolefin producer with approximately 2.6 billion dollars in annual revenue (client-reported, unverified by MMA), operating three polypropylene lines across two countries on mixed naphtha and propane feedstock. Two lines had run below cash cost for six consecutive quarters, specialty grade capability was limited to one line, and management had proposed an efficiency programme rather than any capacity decision.
STRATEGIC CHALLENGE
The board wanted an independent assessment of whether operating improvements could restore the two loss-making lines to profitability, or whether the cost gap against imported resin originated in feedstock route in a way no programme could address. Nobody had benchmarked delivered cost against imported resin at the customer locations themselves. Averages had been used throughout.
MMA APPROACH
We benchmarked delivered cost per tonne against imported resin at each customer location rather than at the plant gate. Feedstock positions were modelled across three price scenarios. Specialty grade conversion options were costed by line, and the announced global capacity pipeline was assessed against realistic demand growth by region. Closure economics were then compared against continued operation.
KEY FINDINGS
  1. The cost gap on both loss-making lines exceeded what any credible efficiency programme could recover, since it originated in feedstock route rather than in plant operation.
  2. Delivered cost at half the customer base was worse than the plant gate figure suggested, because freight had been calculated on average rather than by destination.
  3. One loss-making line could be converted to specialty and metallocene capability at a capital cost well below the value it would recover across five years.
  4. The announced capacity pipeline meant no plausible demand growth would restore regional operating rates to levels supporting the current asset base. No demand scenario tested changed that conclusion.
CLIENT PROFILE
A regional polyolefin producer with approximately 2.6 billion dollars in annual revenue (client-reported, unverified by MMA), operating three polypropylene lines across two countries on mixed naphtha and propane feedstock. Two lines had run below cash cost for six consecutive quarters, specialty grade capability was limited to one line, and management had proposed an efficiency programme rather than any capacity decision.
STRATEGIC CHALLENGE
The board wanted an independent assessment of whether operating improvements could restore the two loss-making lines to profitability, or whether the cost gap against imported resin originated in feedstock route in a way no programme could address. Nobody had benchmarked delivered cost against imported resin at the customer locations themselves. Averages had been used throughout.
MMA APPROACH
We benchmarked delivered cost per tonne against imported resin at each customer location rather than at the plant gate. Feedstock positions were modelled across three price scenarios. Specialty grade conversion options were costed by line, and the announced global capacity pipeline was assessed against realistic demand growth by region. Closure economics were then compared against continued operation.
KEY FINDINGS
  1. The cost gap on both loss-making lines exceeded what any credible efficiency programme could recover, since it originated in feedstock route rather than in plant operation.
  2. Delivered cost at half the customer base was worse than the plant gate figure suggested, because freight had been calculated on average rather than by destination.
  3. One loss-making line could be converted to specialty and metallocene capability at a capital cost well below the value it would recover across five years.
  4. The announced capacity pipeline meant no plausible demand growth would restore regional operating rates to levels supporting the current asset base. No demand scenario tested changed that conclusion.
RECOMMENDED STRATEGY
Phase 1: Phase 1 (months one to nine): halt the efficiency programme on the weaker line and prepare it for permanent closure rather than continued operation. Phase 2: Phase 2 (months nine to thirty): convert the second loss-making line to specialty and metallocene capability, targeting medical and thin-wall applications. Phase 3: Phase 3 (months thirty to fifty-four): rebuild the commercial footprint around delivered cost by destination rather than around plant gate economics.
OUTCOME
The weaker line was closed within three quarters rather than absorbing further efficiency capital. Specialty conversion on the second line was approved and commissioned, and commercial territory was reassigned against delivered cost mapping (client-reported, unverified by MMA). The efficiency programme was formally abandoned rather than quietly continued. Capital moved to the conversion instead.

Frequently Asked Questions

Foundational context covering the market sizes, CAGR, scope, country, region and competition that inform every finding below. This section is provided to cover basics and most often pre-purchase conversations, answered from the MMA Primary Research Dataset.

What is the current size of the Polypropylene Market?

The market is valued at USD 138.0 billion in 2025, rising to USD 143.80 billion in 2026. Scope covers polypropylene resin supplied for conversion, not propylene monomer, third-party compounds, or finished converted products.

How large will the Polypropylene Market be by 2036?

MMA forecasts USD 216.98 billion by 2036, an increase of USD 73.18 billion over the 2026 base. That represents an expansion multiple of 1.51 times across the forecast period.

What is the CAGR for the Polypropylene Market 2026 to 2036?

The base case CAGR is 4.2%, with a bull case of 5.4% and a bear case of 3.0%. The historical rate from 2020 to 2025 was 3.4%, with margins compressed throughout by capacity additions.

Which segment is growing fastest?

Mechanically and chemically recycled grades at 6.3%, exactly 1.50 times the market rate. Growth comes from content mandates and brand commitments rather than from any cost advantage over virgin resin.

Who are the major companies in the Polypropylene Market?

LyondellBasell, Sinopec, SABIC, ExxonMobil, and Braskem lead on polymer capacity. The top five hold only 26%, since plants are built regionally to serve converter bases within economic freight range.

Which country is growing fastest?

India at 7.0%, where conversion capacity is expanding across packaging, textiles, and automotive components while per capita consumption stays far below developed market levels. Regional polymer capacity has not kept pace.

Report Segmentation Architecture

The full report scope spans multiple orthogonal segmentation dimensions, with cross-tabulated demand data provided for each dimension pair. Coverage extends further to regional breakdowns, trend trajectories, and the competitive detail needed to support segment-level decision-making.

By Polymer Grade And Process Route

  • Homopolymer Grades
  • Random Copolymer Grades
  • Impact Block Copolymer Grades
  • Specialty And Metallocene Grades
  • Mechanically And Chemically Recycled Grades

By End-Use Industry

  • Rigid And Flexible Packaging
  • Automotive Components And Interiors
  • Consumer Goods And Appliances
  • Healthcare And Medical Devices
  • Fibres, Textiles And Construction

By Commercial Model

  • Contract Supply To Large Converters
  • Spot And Trader Channel Sales
  • Distributor And Regional Reseller Networks
  • Brand Owner Specified Grade Programmes
  • Toll Polymerisation And Custom Grades

By Region

  • East Asia
  • North America
  • South Asia and Pacific
  • Western Europe
  • Middle East and Africa
  • Latin America
  • Eastern Europe

Scope, Methodology, and Coverage

Every figure in this report is reproducible from documented input assumptions. The scope below maps the historical period, the forecast horizon, the segmentation dimensions, and the countries covered, alongside the underlying primary and qualitative methodology.
Historical Period
2020 to 2025
Forecast Period
2026 to 2036
Base Year
2025 (USD billions; MMA Primary Research Dataset, August 2026)
Market Definition
This market comprises polypropylene resin supplied for conversion into finished products, measured at producer revenue across contract, spot, distribution, brand-specified, and toll channels. Coverage spans homopolymer grades, random copolymer grades, impact block copolymer grades, specialty grades including metallocene, controlled-rheology, high-clarity and medical resins, and mechanically and chemically recycled polypropylene grades. Propylene monomer sold as a chemical intermediate, polypropylene compounds, masterbatches and reinforced formulations produced by third-party compounders, polypropylene fibres, staple, spunbond, films and finished converted articles, catalyst and polymerisation process technology licensing, and other polyolefins including polyethylene and ethylene copolymers fall outside scope.
Quantitative Units
USD billions (current prices); resin tonnage supplied; price per tonne by grade; operating rate against nameplate capacity
Segmentation Dimensions
By Polymer Grade And Process Route; By End-Use Industry; By Commercial Model; By Region
Regions Covered
East Asia, North America, South Asia and Pacific, Western Europe, Middle East and Africa, Latin America, Eastern Europe
Countries Covered
China, Japan, South Korea, Taiwan, India, Indonesia, Vietnam, Thailand, Malaysia, United States, Canada, Mexico, Germany, Belgium, Netherlands, France, Italy, Spain, Saudi Arabia, United Arab Emirates, Qatar, South Africa, Brazil, Argentina, Poland, Hungary, Czechia, and additional markets relevant to this sector
Key Companies Profiled
LyondellBasell, Sinopec, SABIC, ExxonMobil, Braskem, Borealis, TotalEnergies, INEOS, Reliance Industries, Formosa Plastics, Hanwha TotalEnergies Petrochemical, LG Chem, Mitsui Chemicals, Sumitomo Chemical, PetroChina, Hengli Petrochemical, Rongsheng Petrochemical, Indian Oil Corporation, Borouge, Advanced Petrochemical Company
Quantitative Methodology
Primary survey, n=3,800 respondents, Q4 2025, six countries; demand-side model with trade association cross-validation
Qualitative Methodology
47 expert interviews, Q4 2025; applied to validate demand model assumptions, identify emerging dynamics, and assess competitive positioning
Report Format
PDF and XLSX data workbook (Word format preview document)
Publisher
Market Minds Advisory
Report Code
MMA-2026-CHM-861
Published
August 2026
Contact
sales@marketmindsadvisory.com | www.marketmindsadvisory.com

Purchase the full Polypropylene Market Report (2026 to 2036).

The full report sizes polypropylene across five grade families, five end-use industries, five commercial models, and seven regions, with delivered cost modelled by destination rather than at the plant gate throughout. The announced capacity pipeline is assessed against realistic demand growth region by region, since that determines which assets can run economically at all. Specialty and metallocene capability is evaluated separately from nameplate capacity. Competitive profiling covers twenty producers on polymer capacity, and approvable recycled supply is quantified against mandate requirements. Regional demand is built from conversion capacity rather than from economic output measures.
Delivered cost modelled by destination rather than at plant gate
Announced capacity pipeline assessed against realistic regional demand growth
Specialty and metallocene capability evaluated separately from nameplate capacity
Approvable recycled supply quantified against content mandate requirements
Feedstock route cost positions compared across naphtha, propane, and coal
Grade level qualification stickiness assessed by end-use application

Built For The People Who Decide

From boardroom strategy to bench-side execution, this report is read cover-to-cover by leaders shaping the next decade of their industry, turning demand scenarios, market dynamics and valuation benchmarks into decisions.
CXOs/ Presidents/ VPs/ Managers
M&A and Corporate Development
Strategy Teams and R&D Heads
Procurement and Product Directors
Regulatory and Compliance Leaders
Investor Relations and Equity Analysts