Market Minds Advisory
Polyphosphate Market

Polyphosphate Market: Additive Intake Reviews, Lead Corrosion Control and Phosphate Rock Supply Concentration

European intake reviews tightened permitted phosphate use rather than banning it, while American lead pipe rules pulled municipal water treatment volume upward against a rock supply base concentrated in remarkably few countries.

Lead Analyst

Lisa Gevelber

Published

September 2026

Make Smarter Decisions with Customized Research Insights

Request a free sample report and evaluate market opportunities, growth trends, and competitive dynamics relevant to your business needs.

2025 MARKET VALUE$3.4BMarket Size 2025
2036 FORECAST VALUE$5.8BBase Case , 2026 to 2036
CAGR 2026 TO 20365.0 %Bull 6.1% / Bear 3.8%
INCREMENTAL OPPORTUNITY$2.2BNet 10- year value creation
EXPANSION MULTIPLE1.63x2036 value over 2026 base
Strategic Levers
M&A Pipeline
Regional Outlook
Country Rankings
Competitive Intelligence
Segmental Deep-dive
Call-Us : 91 93563 13602

Executive Snapshot and Market Trajectory

Clean-label pressure has been trying to remove phosphates from processed food for a decade and has mostly failed, because nothing else holds water in meat at anything like the cost. Regulators tightened permitted levels instead of banning the additives. That outcome surprised almost everybody who had been watching.
Food grade carries the growth on that reality plus documentation requirements that favour established suppliers. Water treatment grade grows nearly as fast on American lead pipe corrosion control rules that obliged utilities to demonstrate treatment. East Asia holds the largest share on Chinese processed food manufacturing and on domestic phosphate production that supplies both its own converters and a large share of world export volume.
Concentration reads at 48% for the top five, which understates the position because phosphate rock supply sits with remarkably few countries and integrated producers control their own feedstock. Rock cost dominates manufactured cost and moves on fertiliser demand rather than on anything happening in food or water treatment, so cost position is largely decided upstream of the polyphosphate business itself. Merchant converters compete on service and specialty grades because competing on cost is not available.
Market Definition
This market covers condensed phosphate salts including sodium tripolyphosphate, sodium hexametaphosphate, tetrasodium pyrophosphate, potassium and calcium polyphosphates, supplied into food, water treatment, detergent, industrial and specialty applications. Orthophosphate fertilisers, phosphoric acid sold as such, elemental phosphorus and phosphorus trichloride derivatives, and organophosphate flame retardants are excluded from the sizing.
Base Year Value
$3.4B in 2025 (MMA Primary Research Dataset, August 2026)
Forecast Period
2026 to 2036, eleven discrete annual values
CAGR
5.0% base case. Bull 6.1%. Bear 3.8%.
Fastest Growth Segment
Food Grade Polyphosphates: 7.5% CAGR
Fastest Growth Country
India: 8.2% CAGR
Fastest Growth Region
South Asia and Pacific: 7.2% CAGR
Largest Region
East Asia: 31% of 2025 global value
Market Leaders
Prayon, Innophos, ICL Group, Chengxing Group and Aditya Birla Chemicals lead on polyphosphate production revenue. Source: MMA Primary Research Dataset, July 2026.
Primary Survey
n=3,800 procurement and R&D decision-makers, Q4 2025, six countries
Methodology
Demand-side build-up, cross-validated against public data, 47 expert interviews

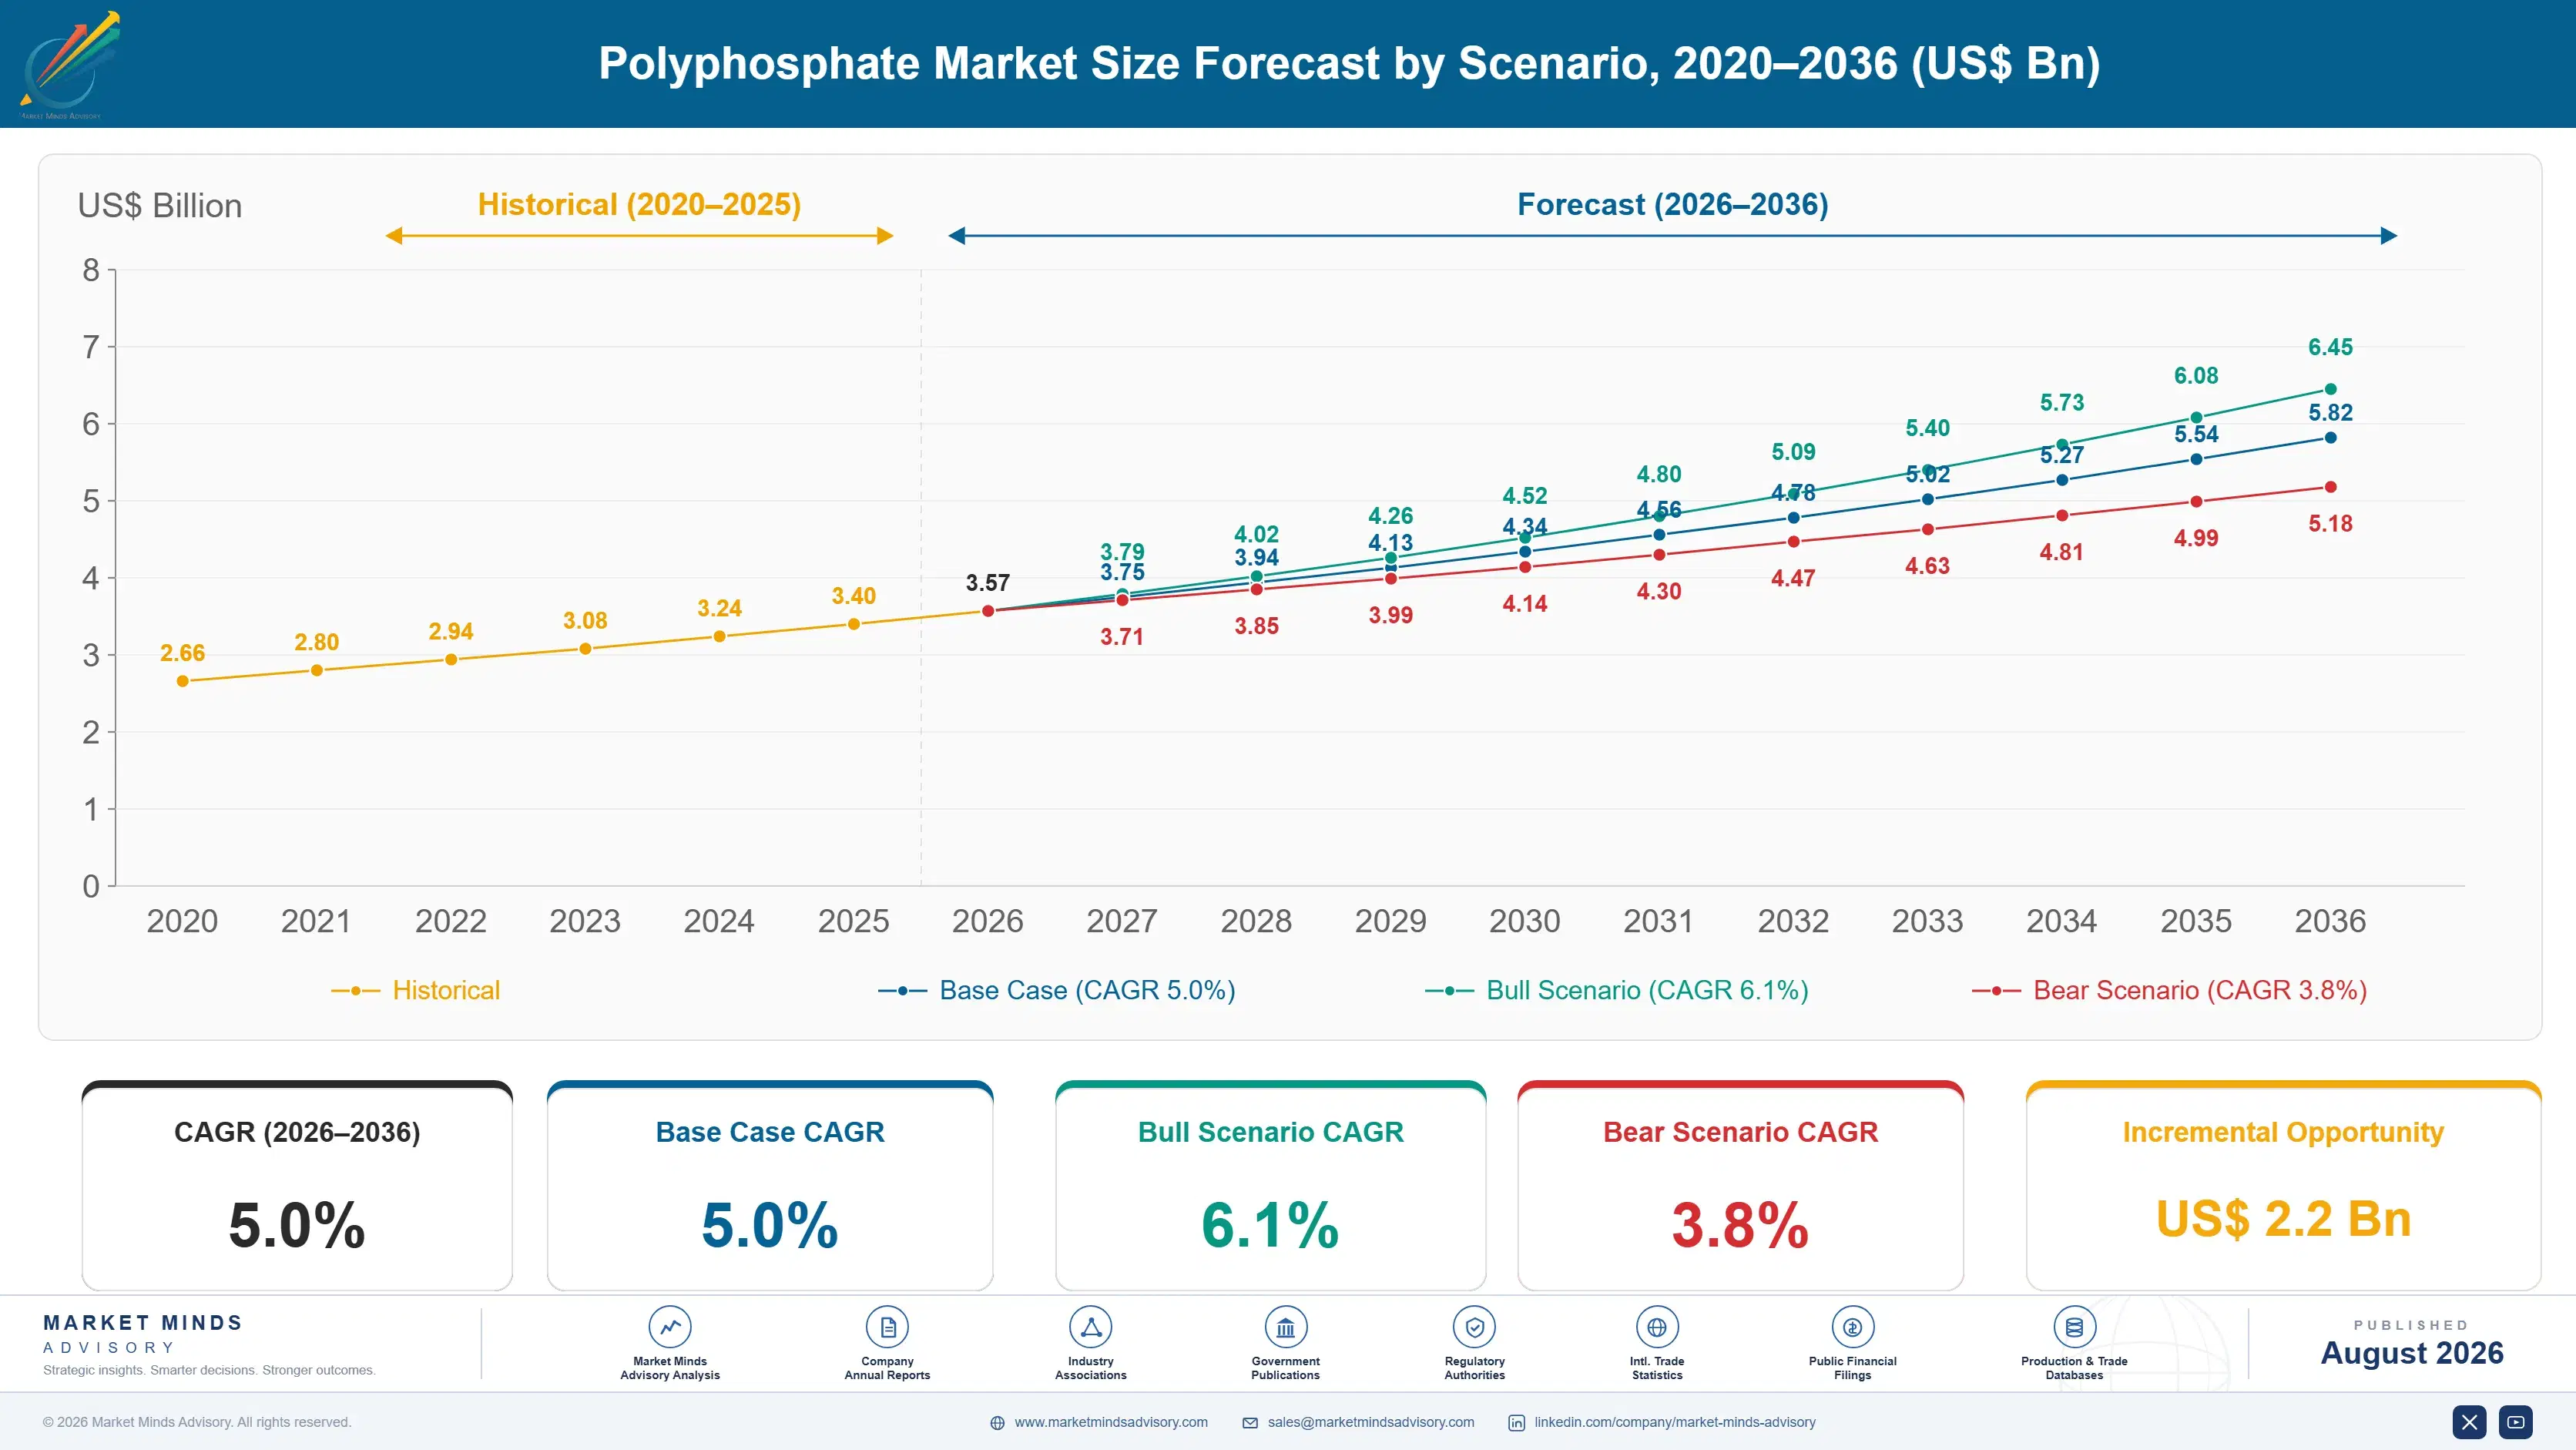
Polyphosphate Market Forecast Scenarios

polyphosphate-market-trends-growth-size-forecast-scenario-1787335735283
Growth ran at 4.1% annually between 2020 and 2025, and regulation pulled in two directions at once throughout the period. European additive intake reviews tightened permitted phosphate use levels in processed food, which capped volume growth there. American lead action level revisions simultaneously obliged utilities to demonstrate corrosion control treatment, which pulled water treatment volume upward against that.
The base case at 5.0% rests on three mechanisms. Processed food manufacturing keeps expanding across Asia and Latin America where clean-label pressure is considerably weaker than in Europe and functional performance still decides formulation. Municipal water treatment volume grows as lead service line replacement programmes run for years while corrosion control remains required throughout. And detergent applications stabilise after the phosphate removal that reshaped that segment a decade ago. None of the three requires a new rule.
The bull case at 6.1% turns on further tightening of drinking water lead requirements across additional jurisdictions, which would extend corrosion control obligations to utilities not currently covered. The bear case at 3.8% reflects European intake limits tightening again toward levels that make reformulation genuinely unavoidable, which would remove volume that no other application picks up.

Rock Supply Decides Polyphosphate Cost Position

The commercial position in polyphosphates is decided upstream of the polyphosphate business. Phosphate rock and purified acid run near 44% of manufactured cost, and rock supply is concentrated in a handful of countries with Morocco holding reserves larger than everyone else combined. Producers integrated back into rock or acid carry a cost position that converters buying on the merchant market simply cannot match.
TOP FIVE CONCENTRATION48%Moderate at producer level, considerably higher in rock supply
PHOSPHATE ROCK COST SHARE44% of COGSRock and acid contribution to finished salt manufactured cost
FOOD GRADE SHARE38%Portion of value entering food and beverage manufacturing applications
FOOD GRADE PREMIUM41%Price advantage of food grade over technical grade material
QUALIFICATION CYCLE12 monthsTypical time to qualify a supplier with a food manufacturer
UTILITY CONTRACT LENGTH3 yearsTypical duration of a municipal water treatment supply agreement
Food grade is where the value sits and where the regulatory argument has been fought. Clean-label campaigns spent a decade trying to remove phosphates from processed meat and cheese, and reformulation projects kept concluding that alternatives cost more and perform worse. European authorities responded by tightening permitted intake levels rather than banning the additives, which favours suppliers carrying full compliance documentation over those selling on price.
Water treatment is the quieter growth story. American lead action level revisions obliged utilities to demonstrate corrosion control, and polyphosphate and orthophosphate blends are the standard treatment. Utility contracts run around three years, are technically specified, and change supplier reluctantly because a treatment failure is a public health event rather than a commercial disappointment. Service reliability decides those accounts more often than price per tonne does.
"Everyone in this industry watches clean-label headlines. The people who actually make money watch Moroccan rock pricing and American lead service line replacement schedules, neither of which appears in a single food trade publication."
Director, Inorganic Chemicals and Water Treatment Practice · MMA Specialty Chemicals Practice · August 2026

Market Trends

Intake Reviews Tighten Permitted Levels Rather Than Banning Phosphates

European authorities reviewed dietary phosphate intake and responded by tightening permitted use levels across food categories instead of removing the additives, which is a materially different commercial outcome from the ban that campaigners expected. Suppliers now compete partly on documentation demonstrating compliance at the revised levels, which favours established producers with regulatory capability. Reformulation projects continue and keep concluding that alternatives cost more and perform worse in water holding. Food grade volume consequently grows at 7.5% annually rather than declining. Campaigners had expected a ban and got a tighter limit instead.
Market Impact: India grows at 8.2% annually
Lead Corrosion Rules Pull Municipal Water Treatment Volume Upward

Revised lead action levels in American drinking water regulation obliged utilities to demonstrate corrosion control treatment across systems that had previously operated without it. Polyphosphate and orthophosphate blends are the standard answer, and service line replacement programmes running for a decade or more mean treatment continues throughout rather than ending when the pipes are changed. Utility contracts run around three years and change supplier reluctantly, since a treatment failure is a public health event. Service reliability decides most of these accounts. Replacement programmes run for a decade or more in most systems.
Market Impact: Rock is 44% of manufactured cost

Market Opportunities and Growth Drivers

Asian Processed Food Manufacturing Expands Without Clean-Label Constraint

Clean-label pressure is a developed market phenomenon and considerably weaker across Asian and Latin American processed food manufacturing, where functional performance and cost still decide formulation without much argument. Indian demand grows near 8.2% annually as packaged meat, poultry and processed dairy manufacturing scales up from a modest base. Chinese converters serve both domestic manufacturing and export markets. That combination adds volume no European reformulation project removes, and it does so faster than developed market demand declines. Chinese and Indian converters are building capacity alongside that demand rather than trailing behind it.
Market Impact: Rock swings exceed 40% in cycles

Rock Integration Decides Which Producers Hold Cost Position

Phosphate rock and purified acid account for roughly 44% of manufactured cost, and rock reserves sit with remarkably few countries. Producers integrated back into rock or acid carry a cost position that converters buying on the merchant market cannot approach, particularly during the periodic tightness that fertiliser demand creates without warning. That integration is why concentration at producer level understates real market power. Merchant converters compete on service and specialty grades because competing on cost is not available to them. Producer level concentration therefore understates the real position by a considerable margin.
Market Impact: Erodes 2% of European volume annually

Market Restraints and Challenges

Fertiliser Demand Drives Rock Pricing Regardless Of Polyphosphate Need

Phosphate rock prices on agricultural fertiliser demand, which dwarfs industrial and food phosphate volume by a wide margin and pays no attention to it whatever. The root cause is simply relative scale, since fertiliser consumes the overwhelming majority of world phosphate production. Commercially this means polyphosphate producers absorb price movements driven by crop economics and grain prices they have no exposure to otherwise. Participants are responding with rock integration, multi-year acid contracts, and specialty grade positioning where pricing power partly offsets input volatility. Crop economics set the price of a food additive.
Market Impact: Food grade grows at 7.5% annually

Clean-Label Reformulation Removes Volume Where Alternatives Reach Parity

Reformulation projects have mostly concluded that phosphate alternatives cost more and hold less water, but in applications where the functional gap is narrow the volume does leave and does not return. The root cause is retailer and brand commitment to shorter ingredient lists rather than any regulatory requirement. Commercially this erodes developed market food volume steadily rather than dramatically. Participants are responding with blended systems reducing phosphate content without removing it, with clean-label positioning on naturally occurring phosphates, and by weighting toward Asian demand. Volume that leaves this way does not come back.
Market Impact: Contracts typically run 3 years
3 additional market trends, 4 additional growth drivers, and 2 additional restraints and challenges are covered in the full report. Contact sales@marketmindsadvisory.com to access the complete intelligence.

Segment CAGR and Growth Architecture

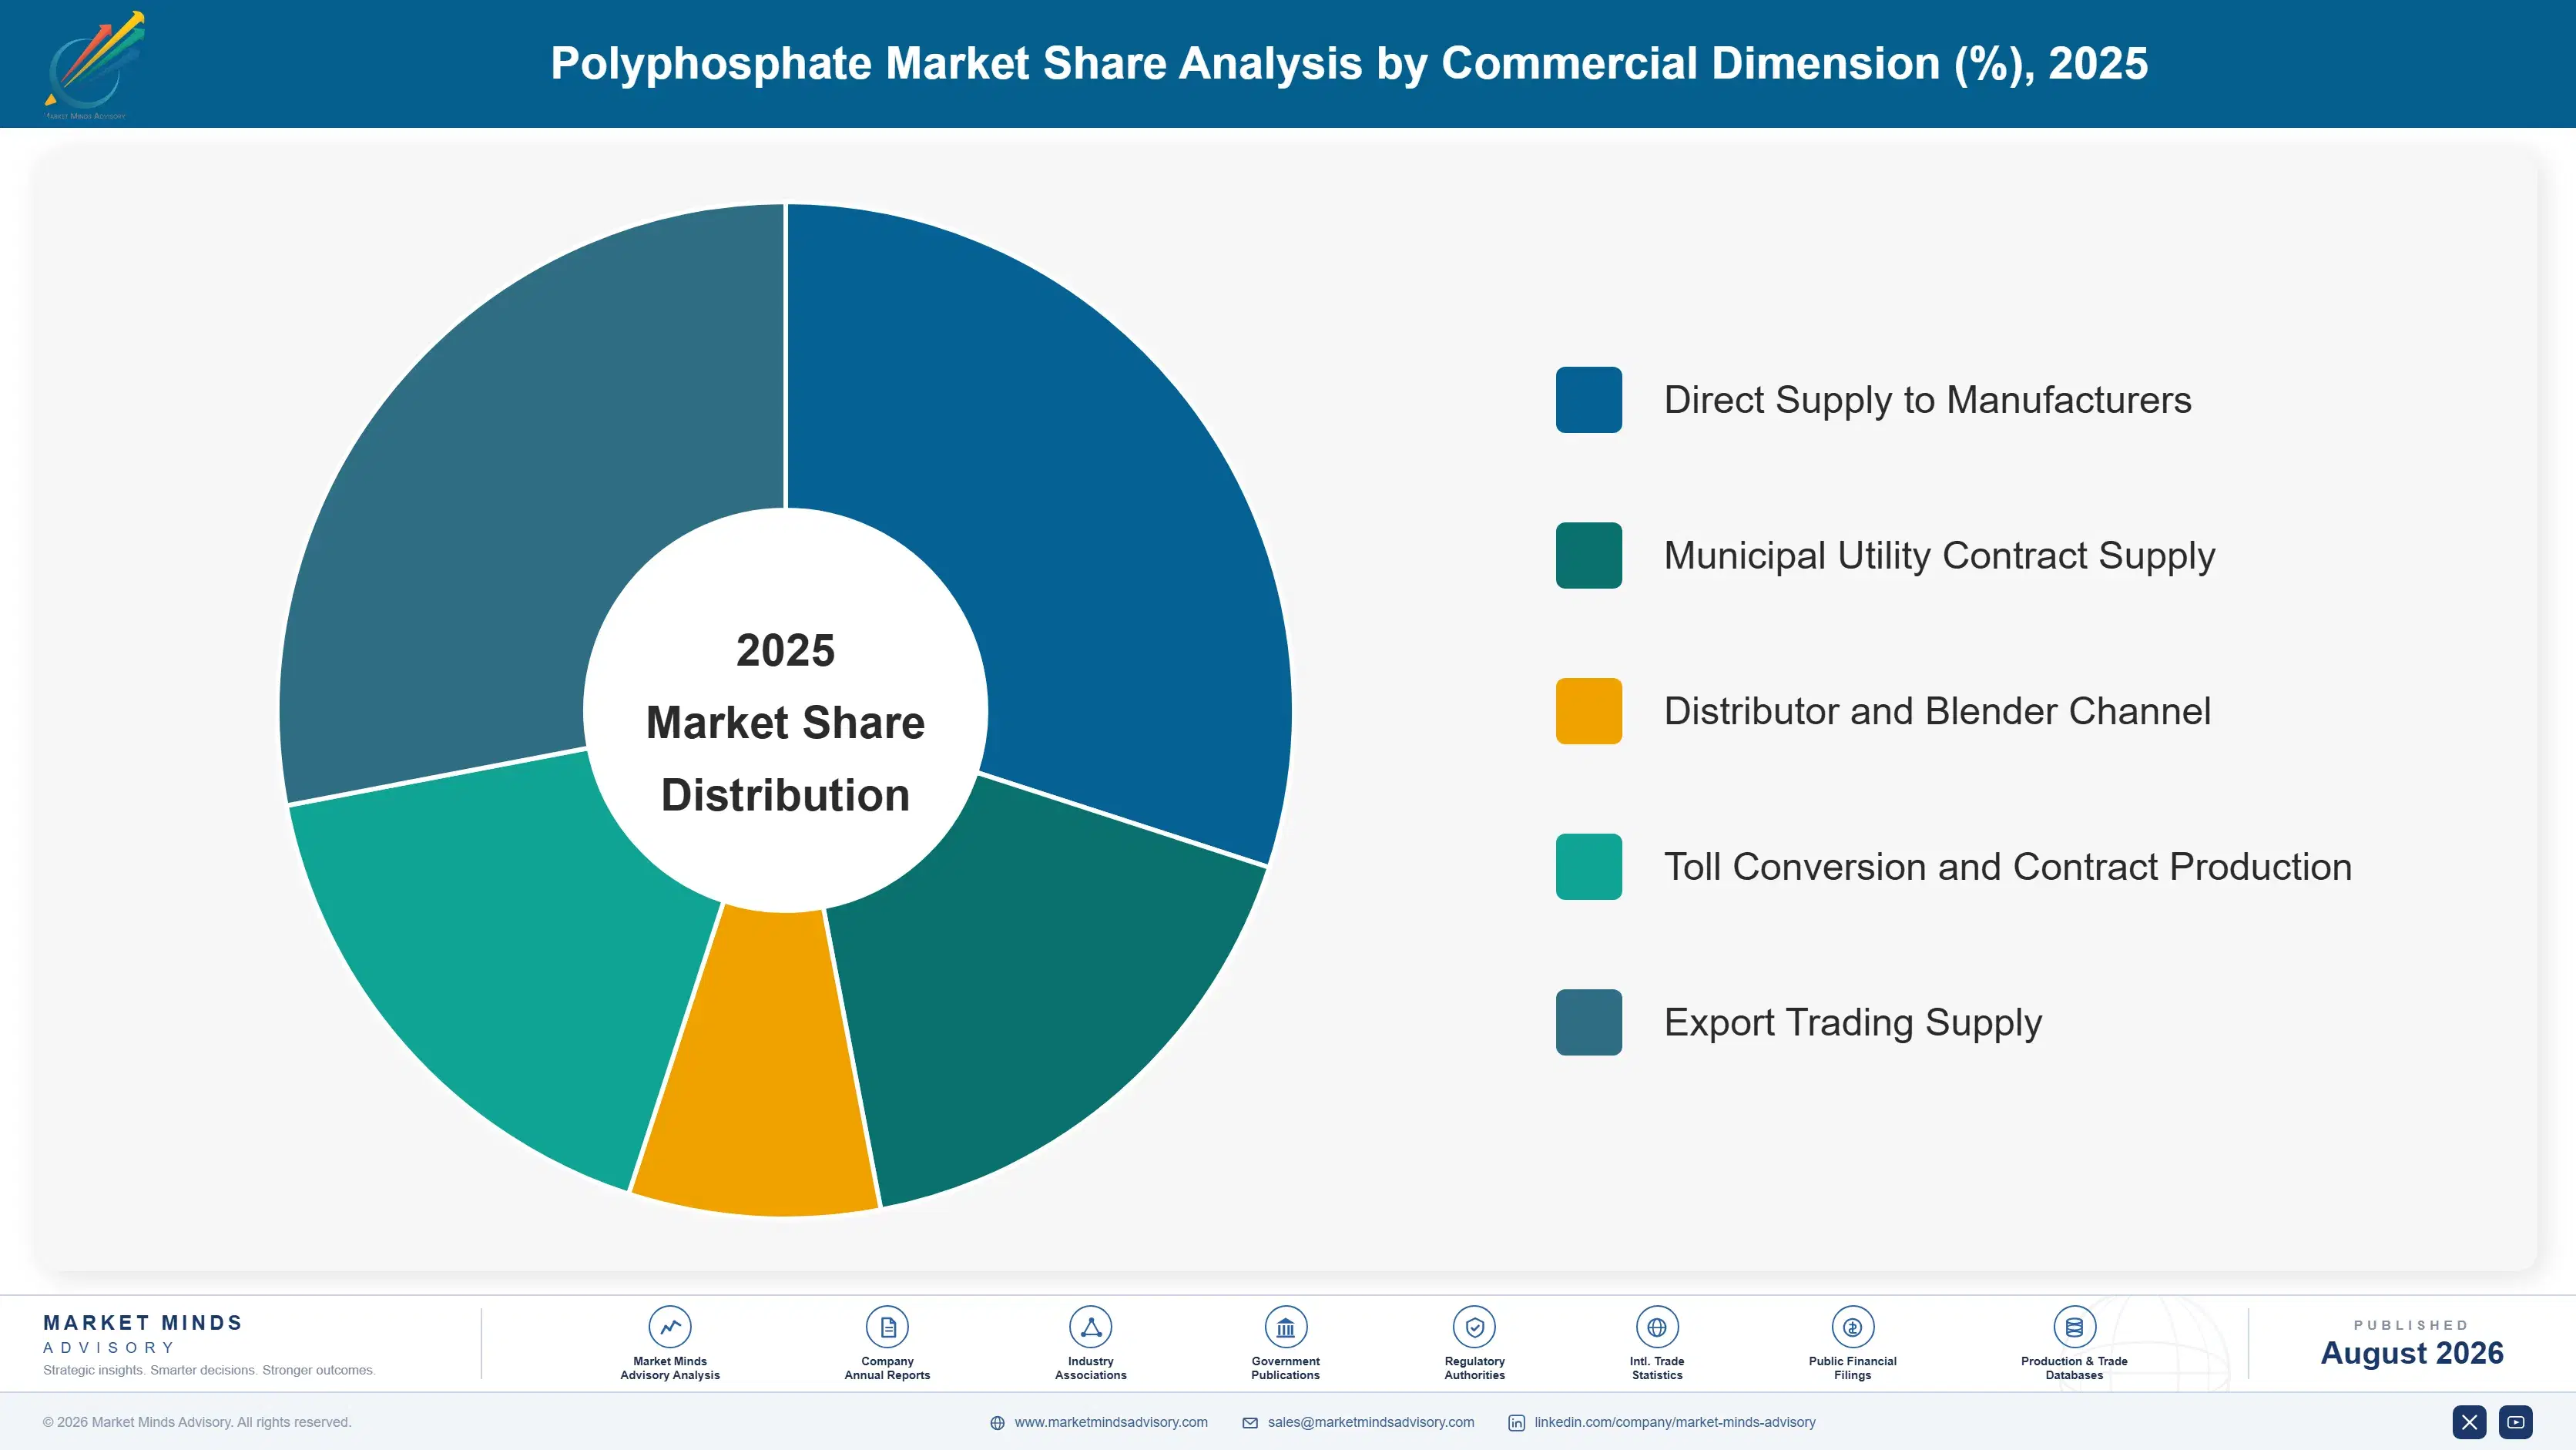
Five application grades divide this market on the specification and documentation the material carries rather than on the specific salt chemistry involved. Grade determines purity requirement, regulatory burden, pricing power and qualification difficulty together, and the same chemical compound sells at entirely different prices depending which grade it has been produced and documented to.
polyphosphate-market-trends-growth-market-share-analysis-1787335735842

Food Grade Polyphosphates

Growing at 7.5% and the fastest part of this market. Food grade polyphosphates hold water in meat, poultry and seafood, control texture in processed cheese and stabilise emulsions across a wide range of manufactured foods, and no functional alternative does the same job at anything like the same cost. That is the awkward truth behind the clean-label pressure: reformulation projects keep running and keep concluding that the replacement costs more and works less well. Regulatory reviews of phosphate additive intake in Europe have tightened permitted use levels rather than removing the additives, which suits established suppliers with the documentation to demonstrate compliance and disadvantages anybody selling on price alone into food applications.
CAGR 7.5%

Water Treatment Grade Polyphosphates

Growing at 6.4% on polyphosphates used in industrial water treatment for corrosion inhibition, scale control and sequestration across municipal drinking water systems, cooling circuits and boiler feed. Lead and copper pipe corrosion control in municipal drinking water is the demand anchor, and it grew considerably after regulators in the United States tightened lead action levels and utilities were required to demonstrate treatment. Orthophosphate blends dominate that application. Utility procurement is contract-based, technically specified and slow to change supplier, which suits producers with local blending capability and service capacity. Price competition is real but service reliability decides most municipal accounts rather than cost per tonne alone. Local blending and service capability decide most awards.
CAGR 6.4%
Full segment breakdown across 5 segments available in the complete report.

Regional Architecture and Country Demand Map

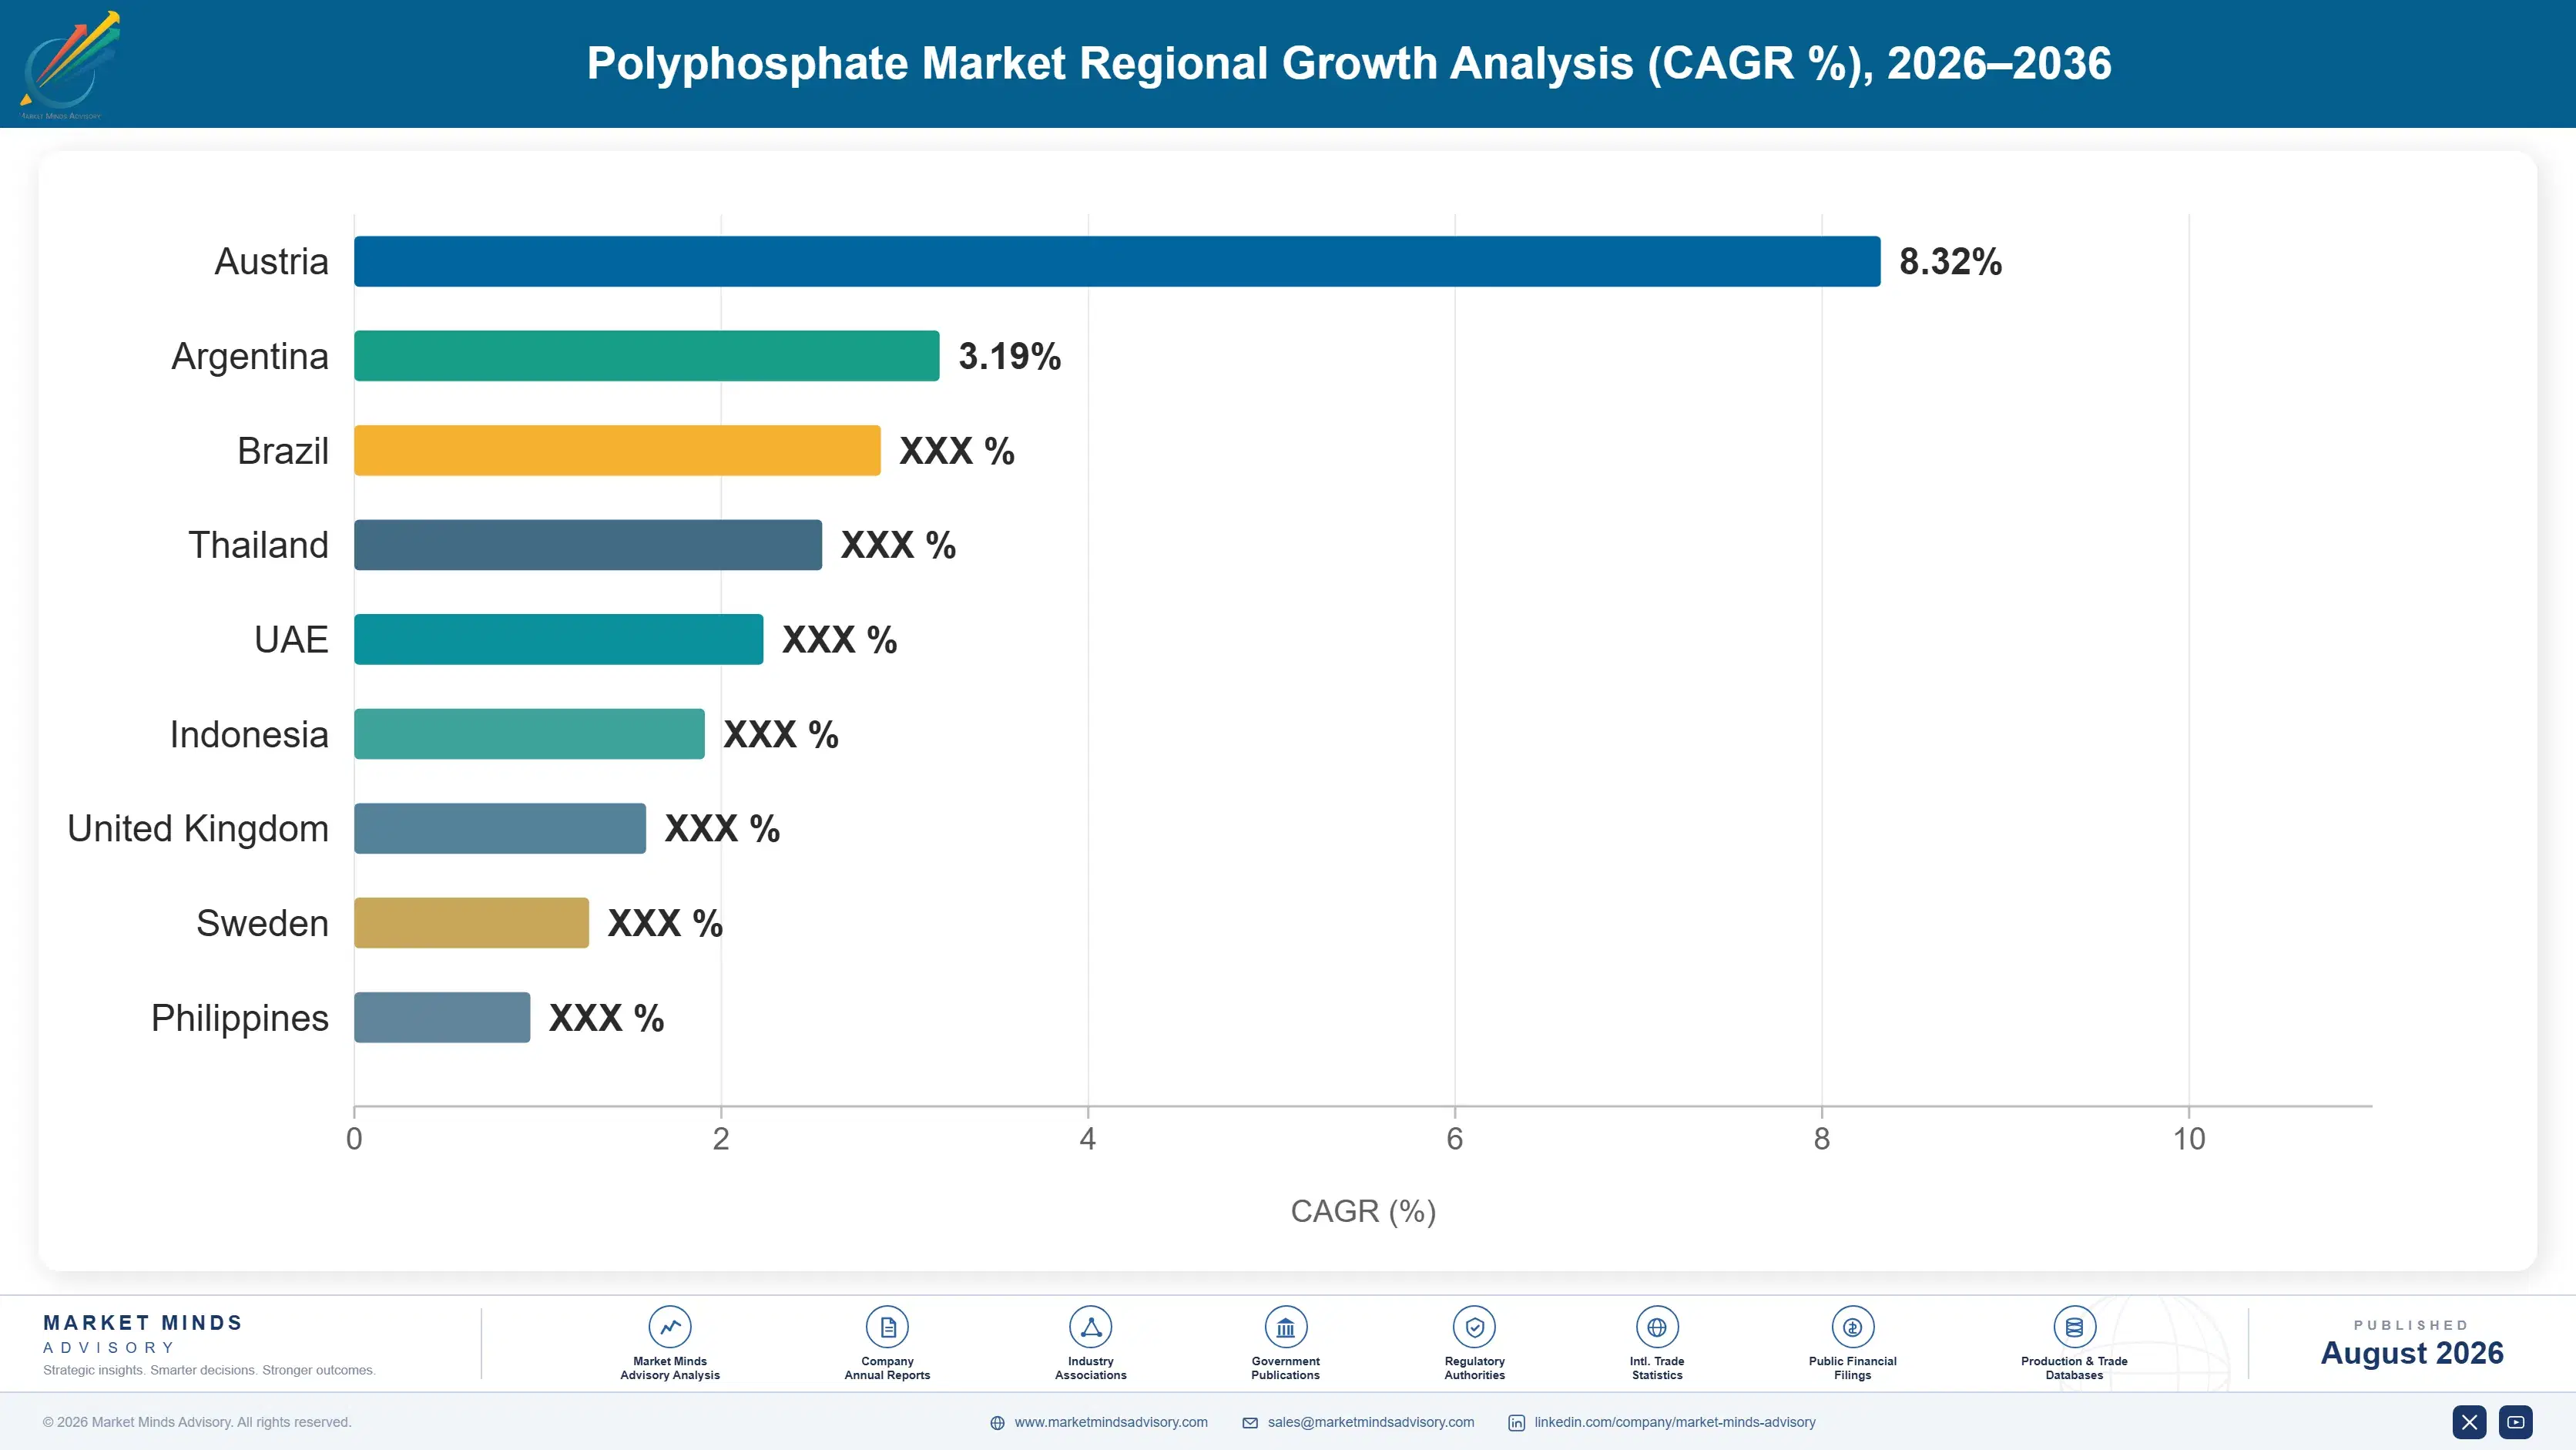
East Asia holds 31% of global value on Chinese processed food manufacturing and domestic phosphate production supplying both its own converters and a large share of world export volume. North America follows at 24% on water treatment demand, while South Asia and Pacific grows fastest.

East Asia

China dominates this region on two counts that reinforce each other. Domestic phosphate rock production and a large converter base supply both its own processed food manufacturing and a substantial share of world polyphosphate export volume, which gives Chinese producers scale advantages that importing regions cannot replicate. Environmental enforcement in Hubei, Yunnan and Guizhou has closed smaller operations and consolidated production toward larger integrated players. Japanese and Korean demand is smaller, technically demanding and weighted toward high purity food and electronic grades where specification tightness rather than delivered cost decides supply relationships and qualification runs considerably longer. Export volume from Chinese converters reaches almost every regional market in some form or another.
Share: 31% | CAGR: 6.0% (2026 to 2036)

North America

Water treatment is what distinguishes this region and lead corrosion control drove most of the recent growth. Revised lead action levels obliged utilities across the country to demonstrate corrosion control treatment, and service line replacement programmes running for a decade or more mean the treatment requirement continues throughout rather than ending with the pipes. Food grade demand is large and mature, with processed meat and cheese manufacturing the anchor applications. Clean-label pressure is real but has moved more slowly than campaigners forecast. Domestic production capacity is meaningful though rock is largely imported, and Florida reserves are considerably depleted against their historical position. Rock imports leave domestic converters exposed to world pricing regardless.
Share: 24% | CAGR: 5.3% (2026 to 2036)
Regional intelligence for 5 additional markets available in the complete report: Western Europe, South Asia and Pacific, Latin America, Middle East and Africa, Eastern Europe. Contact sales@marketmindsadvisory.com.
polyphosphate-market-trends-growth-country-cagr-analysis-1787335736357

Where Polyphosphate Producers Earn Returns

Four positions separate producers earning durable returns from those converting merchant acid on thin spreads: integrating back toward rock or acid supply, holding food grade compliance documentation, winning municipal utility contracts on service rather than price, and building blended systems that reduce phosphate content without removing it. Only the first is genuinely closed to newcomers.

Integrate Back Toward Rock Or Acid Supply

Phosphate rock and purified acid run near 44% of manufactured cost and price on fertiliser demand that has nothing to do with polyphosphate need. Producers integrated back into rock or acid hold cost positions 18% to 25% better than merchant converters during the tightness that fertiliser cycles create without warning. The capital is substantial and the commitment long, which is exactly why the advantage persists rather than being competed away by anybody willing to spend enough. Merchant converters compete on service and specialty grades because competing on cost is simply not available to them.
Market Impact: Improves cost position by as much as 25%

Hold Food Grade Compliance Documentation Across Jurisdictions

European authorities tightened permitted phosphate intake levels rather than banning the additives, which turned regulatory documentation into a commercial asset rather than an administrative cost. Suppliers demonstrating compliance at revised levels across multiple jurisdictions realise roughly 41% premium pricing over technical grade and hold food accounts that price-led competitors cannot enter. Maintaining that capability costs around 4% of revenue annually, and reviews recur, which means the obligation is permanent rather than settled. Purchasing decisions have moved from procurement toward technical and regulatory affairs teams, which changes the conversation entirely for the supplier.
Market Impact: Realises roughly 41% premium over technical grade material

Win Municipal Contracts On Service Rather Than Price

A corrosion control treatment failure is a public health event rather than a commercial disappointment, which is why utilities weigh reliability far above cost per tonne and why contracts run around three years with reluctant switching. Suppliers holding local blending capacity and technical service capability retain municipal accounts through pricing cycles that would lose them elsewhere, protecting 20% to 30% of volume during periods when competitors undercut. Service capability rather than plant scale is what wins these. Plant scale matters far less here than a technician who answers the phone.
Market Impact: Protects up to 30% of contracted utility volume

Build Blended Systems That Reduce Rather Than Remove

Reformulation projects mostly conclude that phosphate alternatives cost more and hold less water, but retailer commitment to shorter ingredient lists erodes developed market volume by roughly 2% annually regardless of what the technical work shows. Blended systems combining reduced phosphate with functional co-ingredients keep the performance while shortening the declaration, which retains accounts that would otherwise leave entirely. Development cost is modest against the volume defended, and the work transfers across customers readily. Retailers are asking for shorter declarations rather than for phosphate-free products, which is a very different requirement to meet.
Market Impact: Defends the 2% of volume eroding each year

Who Controls the Margin Pool

Concentration reads at 48% for the top five measured on polyphosphate production revenue, the basis used throughout this section, and it understates real market power considerably. Prayon and ICL hold integrated positions back toward acid supply. Innophos brings food grade documentation depth. Chengxing operates at Chinese scale with domestic rock behind it, and Aditya Birla serves growing Indian demand directly.
Competition runs on three fronts. Feedstock integration is the first and decides cost position outright, since rock and acid dominate manufactured cost. Food grade documentation is the second, and tightened intake rules turned it from administration into commercial advantage. Municipal service capability is the third, where reliability rather than price retains contracts that a treatment failure would end permanently.

Pressure arrives from two directions. Chinese producers hold domestic rock and converter scale that importing regions cannot replicate, and environmental consolidation has strengthened the survivors rather than weakening the position. Separately, Moroccan producers are moving downstream from rock into higher value derivatives. Rankings will shift toward integrated producers with food documentation rather than merchant converters competing on spread. Merchant converters competing on spread alone have the weakest position of all.
polyphosphate-market-trends-growth-company-positioning-matrix-1787335736878

Competitive Moat and Risk Dimensions

PRAYON

Moat: Purified acid integration depth

Integration back into purified phosphoric acid production removes the largest single cost exposure any polyphosphate producer carries and protects margin during the fertiliser-driven tightness that periodically hits merchant buyers hardest. Process technology developed and licensed across the industry also provides a revenue line and technical standing that pure converters have no equivalent of at all.
PRAYON

Risk: European volume erosion exposure

A large share of food grade volume sits in European markets where retailer clean-label commitment erodes demand steadily and where tightened intake levels cap growth even in applications that retain phosphates. Rock itself is imported, which leaves the upstream position dependent on Moroccan and other supply that the business does not control.
ICL GROUP

Moat: Integrated mineral resource base

Ownership of phosphate rock resources alongside downstream conversion gives the group a cost position merchant converters cannot approach, and the breadth across food, industrial and agricultural phosphates spreads fixed cost across far more volume than any single-application producer manages. Food grade documentation across multiple jurisdictions supports the premium applications directly.
ICL GROUP

Risk: Fertiliser cycle earnings volatility

Substantial agricultural phosphate exposure means group earnings swing with crop economics and grain prices in ways that the specialty polyphosphate business does not, which can constrain investment in the specialty side at exactly the wrong point in a cycle. Regional operating and geopolitical risk also affects the resource base directly.

Players Tracked

Prominent Players

Prayon
Innophos
ICL Group
Chengxing Group
Aditya Birla Chemicals

Other Key Players

OCP Group
Nutrien
Mosaic Company
Solvay
Budenheim
Fosfa
Hubei Xingfa Chemicals
Yunnan Phosphate Chemical
Wengfu Group
Zhejiang Ruixing
Jiangyin Chengxing
Sichuan Blue Sword
Kemira
Univar Solutions
TIB Chemicals

Recent Developments

FEBRUARY 2025

Utility corrosion control contract renewed on service performance

A large American water utility renewed its corrosion control chemical supply contract with the incumbent on a three-year term despite lower competing bids, citing treatment consistency and technical service response as the deciding factors rather than delivered cost per tonne. The renewed term runs through to 2028.
Signal: Municipal buyers price treatment failure risk far above the delivered cost savings a switch would produce
JUNE 2025

Downstream derivative capacity commissioned at rock producing origin

A phosphate rock producer commissioned downstream derivative capacity at its own origin, converting rock into higher value industrial and food grade material rather than shipping it as raw feedstock to converters operating on merchant purchase economics elsewhere. Merchant converters buying from that origin were not consulted.
Signal: Rock producers moving downstream compress the spread that merchant converters have historically operated within for decades
OCTOBER 2025

Reduced phosphate blended system launched for processed meat

A specialty producer launched a blended functional system combining reduced polyphosphate content with co-ingredients delivering comparable water holding, aimed at processed meat manufacturers under retailer pressure to shorten ingredient declarations without accepting a yield loss. Three processed meat manufacturers began commercial trials within the same quarter.
Signal: Reduction rather than removal is where reformulation demand is genuinely settling right across developed food markets today

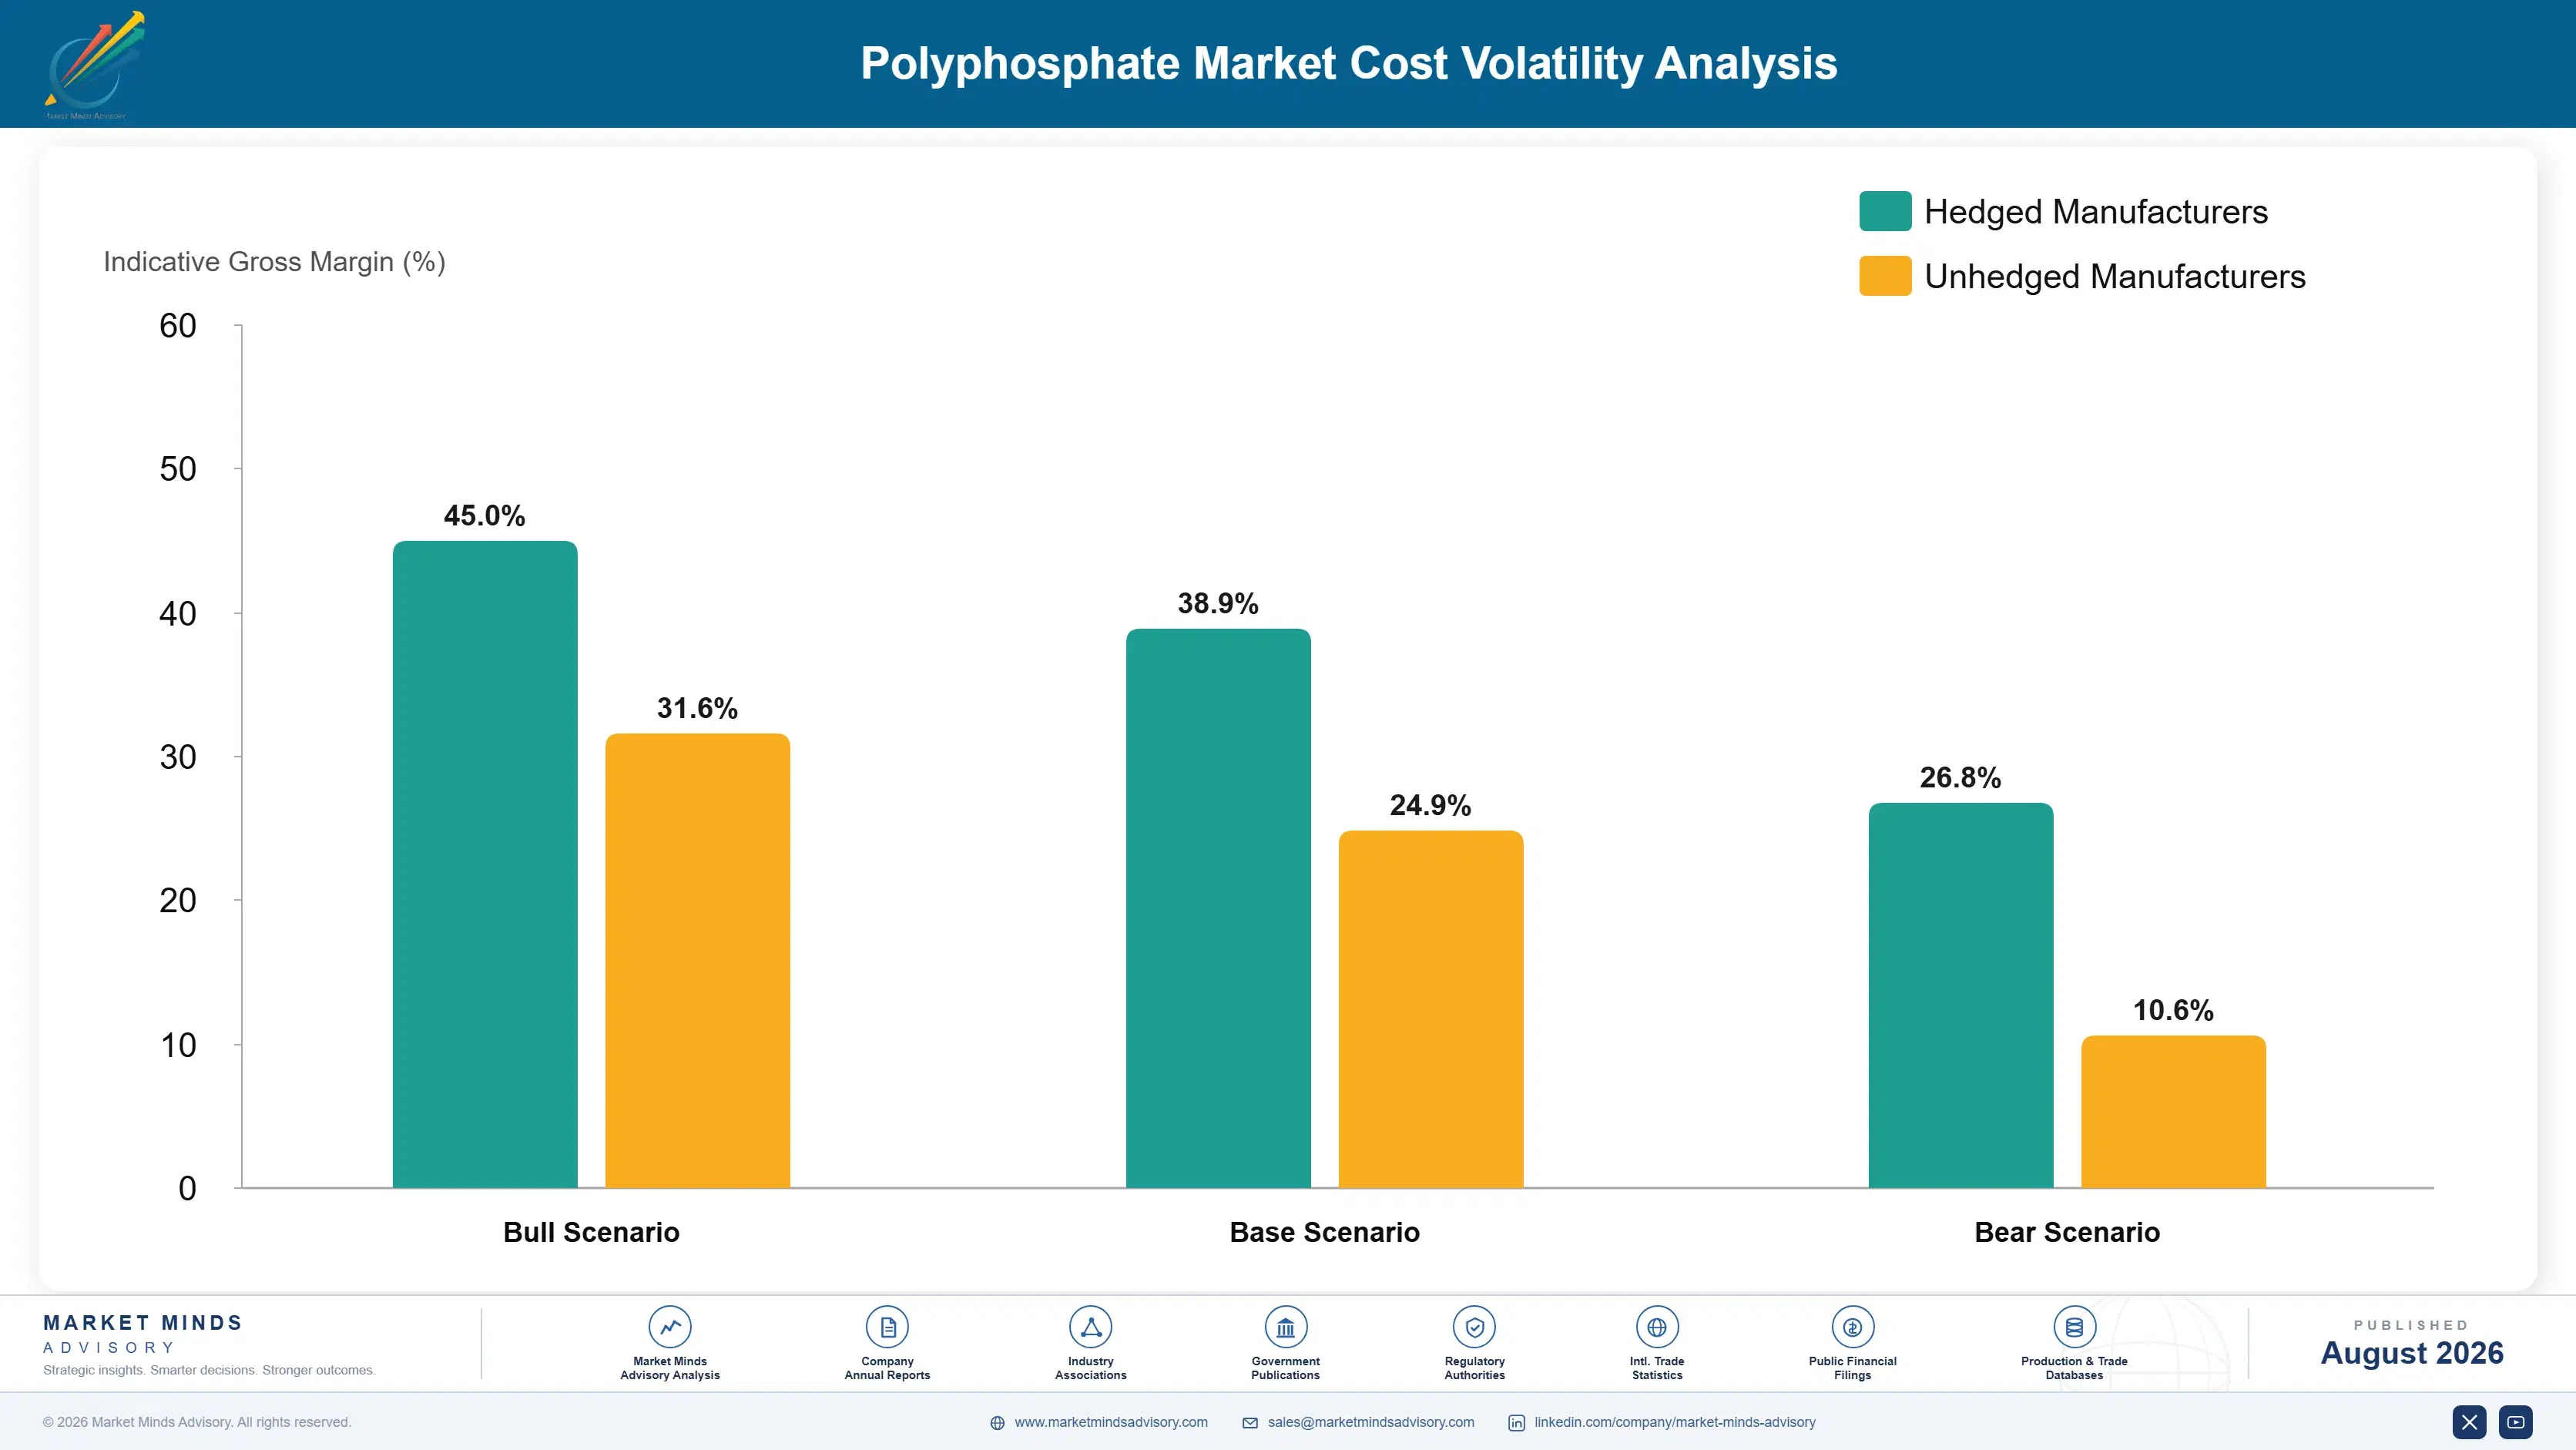
What Drives Polyphosphate Cost Position

Phosphate rock and purified phosphoric acid account for roughly 44% of manufactured cost, and the share runs higher in food grades where purification requirements are tighter. Energy for calcination and drying adds around 19%, making these genuinely energy-intensive processes. Soda ash and alkali contribute about 11%, packaging and logistics roughly 13% given the tonnage involved, and quality, testing and regulatory documentation close to 7%.
Phosphate rock pricing rose sharply through 2021 and 2022 on fertiliser demand and export restrictions from major producing countries, then remained above the previous decade's baseline, with United States Geological Survey mineral commodity data showing the shift clearly. Energy costs for calcination rose in parallel across European operations, according to International Energy Agency data, compressing merchant converter margins across two consecutive years. Merchant converters absorbed most of both.

The disadvantage mechanism is feedstock integration and it separates producers absolutely rather than by degree. An integrated producer holding rock or acid carries cost 18% to 25% below a merchant converter buying at market during tightness, and there is no commercial arrangement that closes that gap. Exposure also varies by region, since Chinese producers hold domestic rock while European and Indian converters import almost all of theirs.
polyphosphate-market-trends-growth-cost-volatility-analysis-1787335737072

Contract purified acid on multi-year committed volume terms

Acid represents the largest cost exposure a merchant converter carries and prices on fertiliser demand that ignores polyphosphate need entirely. Multi-year committed volume secures both allocation and predictable cost through the tightness that fertiliser cycles create without warning. Allocation matters more than price during those periods, which is the part converters consistently underestimate until supply actually tightens on them.

Invest in calcination and drying energy efficiency

Calcination and drying account for most of the energy in polyphosphate production, and heat recovery and kiln optimisation cut consumption materially against European pricing that has stayed elevated since 2022. Payback runs several years at current energy costs. Producers who invested before the price rise now hold a durable cost advantage over those still deferring the capital decision.

Weight the portfolio toward documented food and specialty grades

Technical grade competes on delivered cost against integrated producers who will always win that contest, while food and specialty grades price on documentation and performance where a converter can genuinely compete. Shifting mix defends margin without requiring upstream capital. The constraint is qualification, since food accounts take around twelve months to win and cannot be entered quickly when spreads compress.

Portfolio Architecture for Margin Defence

Portfolio economics here divide on feedstock position and documentation rather than on salt chemistry. Technical grade sold on delivered cost per tonne pits a merchant converter directly against integrated producers holding rock or acid, and that is a contest the converter loses whenever feedstock tightens, which it periodically does. The word periodically is doing a lot of work in that sentence.
The middle tier is water treatment grade under municipal contract. Utilities weigh treatment reliability far above cost per tonne because a corrosion control failure is a public health event, contracts run around three years, and switching is reluctant. Margins reach the mid twenties and hold through pricing cycles that would lose industrial volume outright. Local blending and service capability are what actually secure them.

Above both sits documented food grade. Tightened intake rules turned compliance documentation into a commercial asset, supporting roughly 41% premium pricing over technical material and holding accounts that price-led competitors cannot enter. Margins reach the high thirties. The position requires regulatory capability maintained across jurisdictions where reviews recur, which is a permanent obligation rather than a completed investment. Reviews recur, which keeps the obligation live.

Volume / Commodity-Adjacent

Technical grade sold on delivered cost per tonne into industrial applications. The range reflects feedstock position rather than commercial skill, and merchant converters lose this contest whenever rock or acid tightens.
Gross Margin: 9 to 16%

Premium / Certified

Water treatment grade supplied under municipal contract on service reliability. The range reflects whether local blending and technical service capability accompany the supply, which is what utilities actually weigh. Switching is reluctant.
Gross Margin: 21 to 29%

Sustainability / Regulatory / Next-Generation

Documented food grade meeting tightened intake compliance across jurisdictions. The wide range reflects documentation breadth and whether blended reduced-phosphate systems accompany the base material into the account. Reviews recur rather than settling.
Gross Margin: 33 to 42%
polyphosphate-market-trends-growth-portfolio-architecture-1787335737566

High-value Sub-segments and Strategic Watch-out

Documented Food Grade Supply

High value and high growth together. Tightened intake rules turned compliance into a commercial asset supporting roughly 41% premiums. The wide range reflects documentation breadth across jurisdictions and whether blended systems accompany the base material. Price-led competitors simply cannot hold on to these accounts at all.
Gross Margin: 33 to 42%

Municipal Water Treatment Contracts

High value on steady growth and the most defensible ordinary position here. Utilities weigh reliability far above price because failure is a public health event. The range reflects whether local blending and service capability accompany the supply. Incumbents renew through cycles that would lose industrial volume.
Gross Margin: 21 to 29%

Reduced Phosphate Blended Systems

A genuinely growing pool defending volume that reformulation would otherwise remove. Reduction rather than removal is where developed market demand is settling. The range reflects co-ingredient cost and how much development work each customer application requires. The development work transfers across customers more readily than expected.
Gross Margin: 27 to 36%

Technical Grade Industrial Volume

The strategic watch-out. Volumes are large but integrated producers hold a cost position merchant converters cannot approach during feedstock tightness. The range reflects rock and acid access rather than any commercial decision made downstream. Feedstock access decides this whole contest before it has even started.
Gross Margin: 9 to 16%

How Polyphosphate Demand Actually Repeats

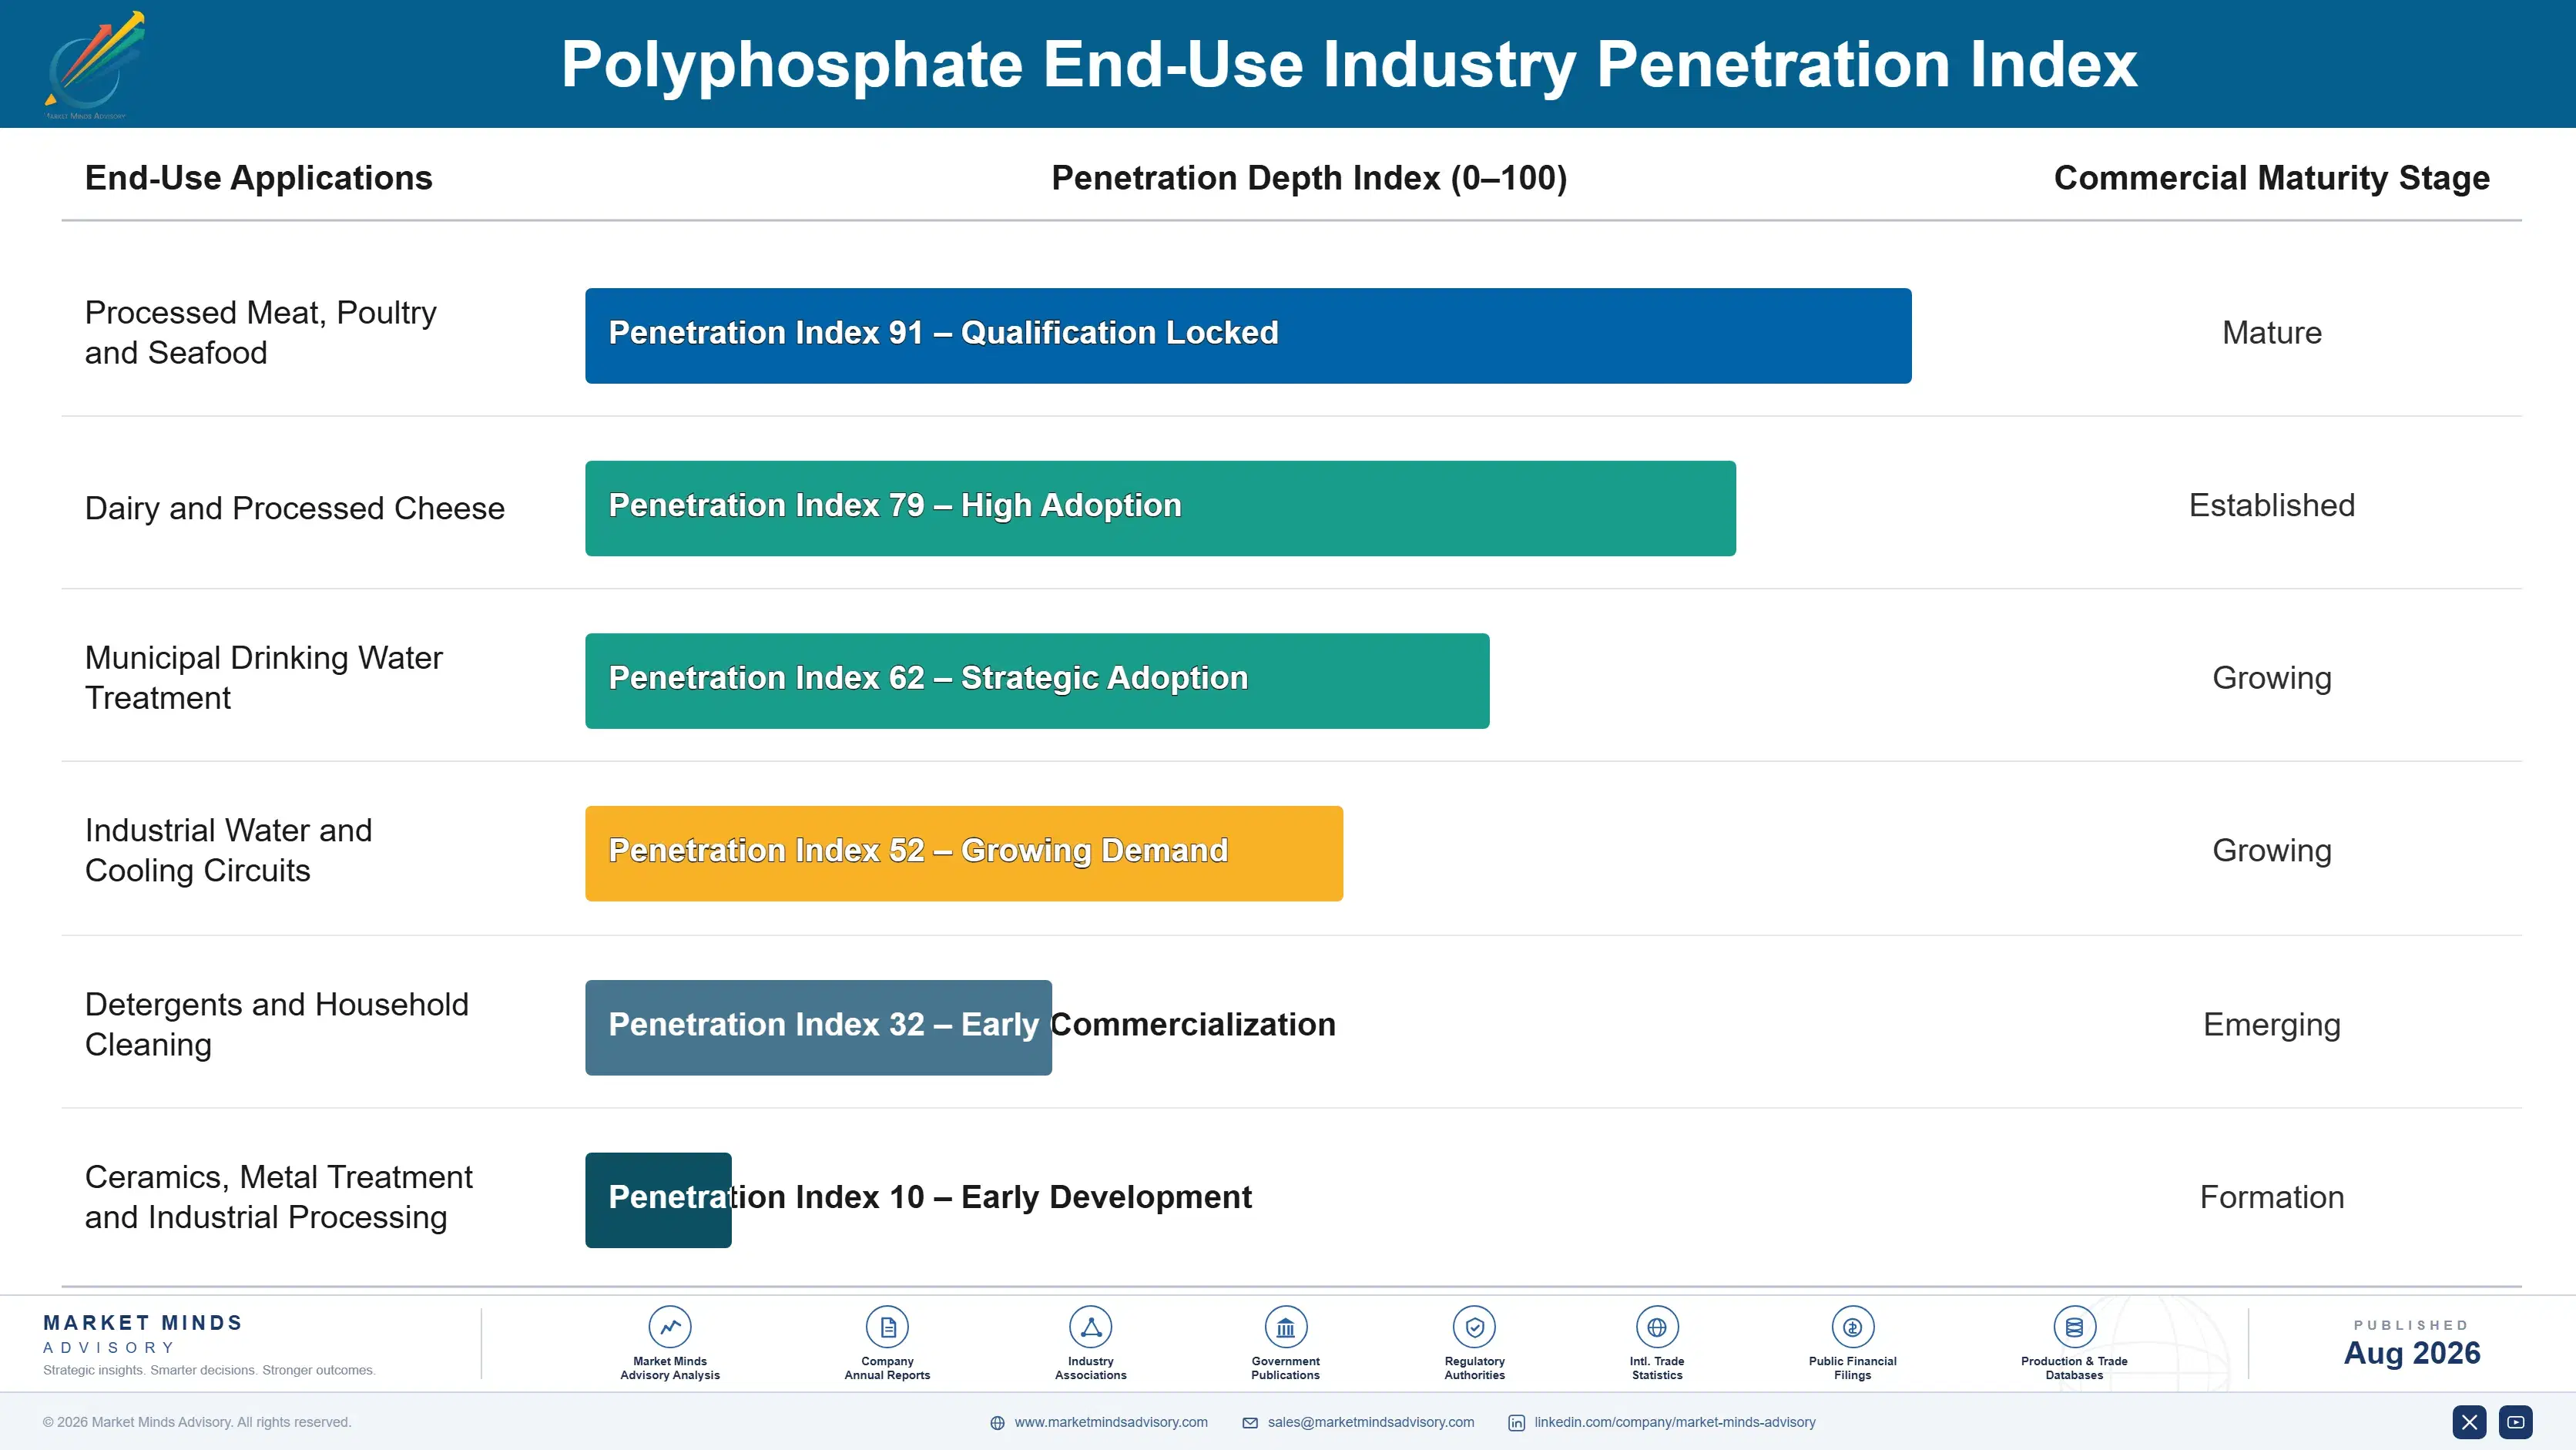
Two repeat mechanisms operate here and both are unusually durable. Municipal water treatment contracts run around three years and renew reluctantly, because a corrosion control failure carries consequences no procurement saving justifies risking. Food grade positions repeat for as long as a formulation is produced, since requalification costs more than any price difference recovers and the additive is named in specifications the manufacturer has already validated.
Stickiness varies sharply by application. Municipal treatment holds best of all, with incumbents renewing through pricing cycles that would lose any industrial account. Processed meat and cheese formulations hold well, since water holding performance is measured in yield and formulators do not experiment casually with it. Detergent applications stabilised after phosphate removal reshaped the segment. Technical industrial volume holds worst, switching on delivered cost without hesitation whatever.

The buyer profile has changed considerably. Food purchasing once ran through procurement functions treating phosphates as an ordinary commodity input bought on price. Regulatory tightening moved the decision toward technical and regulatory affairs teams who weigh compliance documentation above delivered cost, which rewards suppliers with genuine regulatory capability and disadvantages those whose commercial argument was only ever the price.
polyphosphate-market-trends-growth-end-use-penetration-index-1787335738060

Where To Compete And Why

These are among the four positions where our research anticipates prominent divergence between winners and laggards over the coming forecast period. Each is grounded in the demand model, the regulatory perimeter, and the announced capacity pipeline.
01 / FEEDSTOCK INTEGRATION POSITION

Rock decides who wins on cost

Phosphate rock and purified acid run near 44% of manufactured cost and price on agricultural fertiliser demand that pays no attention whatever to polyphosphate need. Integrated producers hold cost positions 18% to 25% better than merchant converters during the tightness that fertiliser cycles create without any warning at all. The capital required is substantial and the commitment long, which is precisely why that advantage persists rather than being competed away by anybody willing to spend enough money to buy their way into it.
02 / COMPLIANCE DOCUMENTATION DEPTH

Tightening made paperwork an asset

European authorities tightened permitted phosphate intake levels rather than banning the additives, which converted regulatory documentation from an administrative cost into a genuine commercial asset almost overnight. Suppliers demonstrating compliance at revised levels across jurisdictions realise roughly 41% premium pricing over technical grade material, and hold food accounts that price-led competitors cannot enter at all. Maintaining that capability costs around 4% of revenue annually and the reviews recur, so the obligation is permanent rather than something a producer completes once and then puts behind it.
03 / MUNICIPAL SERVICE RELIABILITY

Utilities buy reliability, not tonnage

A corrosion control treatment failure is a public health event rather than a commercial disappointment, which is why utilities weigh reliability far above cost per tonne when awarding and renewing contracts. Suppliers holding local blending capacity and technical service capability retain municipal accounts through pricing cycles that would lose industrial volume outright, protecting 20% to 30% of contracted volume through periods when competitors undercut sharply. Service capability rather than plant scale is what actually wins and then keeps these municipal accounts.
04 / REDUCTION FORMULATION DEVELOPMENT

Shorter lists, not removed ingredients

Reformulation projects mostly conclude that phosphate alternatives cost more and hold less water, yet retailer commitment to shorter ingredient declarations still erodes developed market volume by roughly 2% each year regardless. Blended systems combining reduced phosphate with functional co-ingredients keep the performance while shortening the declaration, retaining accounts that would otherwise leave the category entirely and never come back. Development cost is modest against the volume defended and the work transfers across customers far more readily than most producers expect.

Engagement Snapshot From the Field

A live engagement with an industry participant carrying material or product regulatory and market exposure ahead of a defining policy shift, showing how our research translates into a defensible multi-year portfolio strategy.
MARKET MINDS ADVISORY · CLIENT ENGAGEMENT SUMMARY
Polyphosphate Producer Strategic Portfolio Review and Transition Roadmap 2026·Investment Scenario on Polyphosphate Exposure Evaluation 2025-26
CLIENT PROFILE
A European merchant polyphosphate converter with annual revenue near $240 million (client-reported, unverified by MMA), roughly 68% of it in technical and industrial grades with the balance split between food and water treatment. The business held modern conversion capacity and good regional distribution, but bought all purified acid on the merchant market with no integration whatsoever.
STRATEGIC CHALLENGE
Acid pricing driven by fertiliser demand had compressed technical grade margins to near nothing across two consecutive years while integrated competitors held position comfortably. Management needed to decide between pursuing upstream integration, shifting portfolio weight toward documented food and water treatment grades, or accepting the spread and competing on operating cost alone.
MMA APPROACH
MMA modelled realised margin by grade against acid cost across four years of the client's own data, benchmarked cost position against integrated European and Chinese competitors, and assessed food grade qualification requirements with prospective customers. Twenty-three expert interviews with food manufacturers, utility procurement leads and acid suppliers tested where the client could genuinely compete.
KEY FINDINGS
  1. Technical grade contribution fell to near zero during every period of acid tightness, and the pattern had repeated three times in six years without the client changing its portfolio weighting at all.
  2. Documented food grade accounts delivered roughly 26 percentage points more margin than technical volume and had never been lost to a competitor on price alone in the accounts examined.
  3. Utility procurement leads uniformly ranked treatment reliability and service response above delivered cost, and two named incumbent switching as a risk they would not take without cause.
  4. Upstream acid integration was assessed as requiring capital well beyond the client's capacity and a timeline longer than the margin pressure would allow it to survive.
CLIENT PROFILE
A European merchant polyphosphate converter with annual revenue near $240 million (client-reported, unverified by MMA), roughly 68% of it in technical and industrial grades with the balance split between food and water treatment. The business held modern conversion capacity and good regional distribution, but bought all purified acid on the merchant market with no integration whatsoever.
STRATEGIC CHALLENGE
Acid pricing driven by fertiliser demand had compressed technical grade margins to near nothing across two consecutive years while integrated competitors held position comfortably. Management needed to decide between pursuing upstream integration, shifting portfolio weight toward documented food and water treatment grades, or accepting the spread and competing on operating cost alone.
MMA APPROACH
MMA modelled realised margin by grade against acid cost across four years of the client's own data, benchmarked cost position against integrated European and Chinese competitors, and assessed food grade qualification requirements with prospective customers. Twenty-three expert interviews with food manufacturers, utility procurement leads and acid suppliers tested where the client could genuinely compete.
KEY FINDINGS
  1. Technical grade contribution fell to near zero during every period of acid tightness, and the pattern had repeated three times in six years without the client changing its portfolio weighting at all.
  2. Documented food grade accounts delivered roughly 26 percentage points more margin than technical volume and had never been lost to a competitor on price alone in the accounts examined.
  3. Utility procurement leads uniformly ranked treatment reliability and service response above delivered cost, and two named incumbent switching as a risk they would not take without cause.
  4. Upstream acid integration was assessed as requiring capital well beyond the client's capacity and a timeline longer than the margin pressure would allow it to survive.
RECOMMENDED STRATEGY
Phase 1: Phase one: contract purified acid on multi-year committed volume to secure allocation and predictable cost, since integration is not achievable within the available timeframe. Phase 2: Phase two: shift portfolio weight decisively toward documented food grade, accepting the twelve-month qualification timeline as the cost of a defensible margin position. Phase 3: Phase three: build local blending and technical service capability to pursue municipal water treatment contracts where reliability rather than price decides awards.
OUTCOME
The client moved food and water treatment from 32% to 51% of volume across eighteen months and secured multi-year acid contracts covering most of its requirement (client-reported, unverified by MMA). Blended gross margin improved by roughly seven points, two municipal contracts were won on service terms, and technical grade capacity was partially redeployed to specialty production.

Frequently Asked Questions

Foundational context covering the market sizes, CAGR, scope, country, region and competition that inform every finding below. This section is provided to cover basics and most often pre-purchase conversations, answered from the MMA Primary Research Dataset.

What is the current size of the Polyphosphate Market?

The global polyphosphate market was valued at $3.40 billion in 2025, reaching an estimated $3.57 billion in 2026. That covers condensed phosphate salts across food, water treatment, detergent and industrial applications.

How large will the Polyphosphate Market be by 2036?

MMA forecasts the market reaching $5.82 billion by 2036, an increase of $2.25 billion over the 2026 base. That represents an expansion multiple of 1.63 times across the forecast period.

What is the CAGR for the Polyphosphate Market 2026 to 2036?

The base case compound annual growth rate is 5.0%, with a bull case of 6.1% and a bear case of 3.8%. Historical growth between 2020 and 2025 ran at 4.1% annually.

Which segment is growing fastest?

Food grade polyphosphates grow at 7.5%, a full 1.50 times the market rate, since no alternative holds water in meat at comparable cost. Water treatment grade follows at 6.4% annually.

Who are the major companies in the Polyphosphate Market?

Prayon, Innophos, ICL Group, Chengxing Group and Aditya Birla Chemicals lead on polyphosphate production revenue. Together they account for roughly 48%, though rock supply concentration runs considerably higher.

Which country is growing fastest?

India grows fastest at 8.2% annually, driven by packaged meat, poultry and processed dairy manufacturing scaling from a modest base without much clean-label constraint. China follows closely.

Report Segmentation Architecture

The full report scope spans multiple orthogonal segmentation dimensions, with cross-tabulated demand data provided for each dimension pair. Coverage extends further to regional breakdowns, trend trajectories, and the competitive detail needed to support segment-level decision-making.

By Application Grade

  • Food Grade Polyphosphates
  • Water Treatment Grade Polyphosphates
  • Detergent Grade Polyphosphates
  • Technical and Industrial Grade
  • Specialty and Reduced Phosphate Systems

By End-Use Industry

  • Processed Meat, Poultry and Seafood
  • Dairy and Processed Cheese
  • Municipal Drinking Water Treatment
  • Industrial Water and Cooling Circuits
  • Detergents and Household Cleaning
  • Ceramics, Metal Treatment and Industrial Processing

By Commercial Dimension

  • Direct Supply to Manufacturers
  • Municipal Utility Contract Supply
  • Distributor and Blender Channel
  • Toll Conversion and Contract Production
  • Export Trading Supply

By Region

  • North America
  • Western Europe
  • East Asia
  • South Asia and Pacific
  • Latin America
  • Middle East and Africa
  • Eastern Europe

Scope, Methodology, and Coverage

Every figure in this report is reproducible from documented input assumptions. The scope below maps the historical period, the forecast horizon, the segmentation dimensions, and the countries covered, alongside the underlying primary and qualitative methodology.
Historical Period
2020 to 2025
Forecast Period
2026 to 2036
Base Year
2025 (USD billions; MMA Primary Research Dataset, August 2026)
Market Definition
This report covers condensed phosphate salts including sodium tripolyphosphate, sodium hexametaphosphate, tetrasodium pyrophosphate, sodium acid pyrophosphate, and potassium and calcium polyphosphates, supplied into food, water treatment, detergent, industrial and specialty applications across direct, utility contract, distributor and toll conversion channels. Orthophosphate fertilisers, phosphoric acid sold as such, elemental phosphorus and phosphorus trichloride derivatives, organophosphate flame retardants, and phosphate rock sold as raw feedstock are excluded from the sizing.
Quantitative Units
USD billions at producer realised value; volume in thousand tonnes; realised pricing in USD per tonne.
Segmentation Dimensions
By application grade; by end-use industry; by commercial dimension; by region.
Regions Covered
North America, Western Europe, East Asia, South Asia and Pacific, Latin America, Middle East and Africa, Eastern Europe
Countries Covered
China, Japan, South Korea, India, Thailand, Vietnam, Indonesia, Australia, United States, Canada, Mexico, Brazil, Germany, France, Italy, Spain, Poland, Turkey, Morocco, South Africa.
Key Companies Profiled
Prayon, Innophos, ICL Group, Chengxing Group, Aditya Birla Chemicals, OCP Group, Nutrien, Mosaic Company, Solvay, Budenheim, Hubei Xingfa Chemicals, Yunnan Phosphate Chemical, Wengfu Group, Kemira and others.
Quantitative Methodology
Primary survey, n=3,800 respondents, Q4 2025, six countries; demand-side model with trade association cross-validation
Qualitative Methodology
47 expert interviews, Q4 2025; applied to validate demand model assumptions, identify emerging dynamics, and assess competitive positioning
Report Format
PDF and XLSX data workbook (Word format preview document)
Publisher
Market Minds Advisory
Report Code
MMA-2026-CHM-110
Published
August 2026
Contact
sales@marketmindsadvisory.com | www.marketmindsadvisory.com

Purchase the full Polyphosphate Market Report (2026 to 2036).

The full report sizes the polyphosphate market across five application grades, six end-use categories and seven regions, with tonnage and per tonne pricing detail behind every value estimate. It profiles twenty companies on feedstock integration, compliance documentation and municipal service capability. Regional chapters cover additive regulation, water treatment obligations and converter structure by market. Cost analysis quantifies rock, acid and calcination energy exposure by integration position. Regulatory analysis maps phosphate intake limits and drinking water corrosion control requirements across all the major jurisdictions concerned in turn.
Tonnage and per tonne pricing by application grade
Phosphate intake regulation compared across major jurisdictions
Rock and acid integration positions mapped by producer
Municipal corrosion control obligations and contract structures
Competitive position assessments across twenty companies
Reduced phosphate blended system development and adoption analysis

Built For The People Who Decide

From boardroom strategy to bench-side execution, this report is read cover-to-cover by leaders shaping the next decade of their industry, turning demand scenarios, market dynamics and valuation benchmarks into decisions.
CXOs/ Presidents/ VPs/ Managers
M&A and Corporate Development
Strategy Teams and R&D Heads
Procurement and Product Directors
Regulatory and Compliance Leaders
Investor Relations and Equity Analysts