Market Minds Advisory
Polymeric Sand Market

Polymeric Sand Market: Outdoor Living Demand Reshapes a North American Paver-Jointing Category

Outdoor living space renovation is pulling polymeric sand demand toward permeable and storm-resistant formulations faster than Techniseal and Alliance can requalify products, even as this remains an almost entirely North American hardscaping category.

Lead Analyst

Bilal Shaikh

Published

September 2026

Make Smarter Decisions with Customized Research Insights

Request a free sample report and evaluate market opportunities, growth trends, and competitive dynamics relevant to your business needs.

2025 MARKET VALUE$0.6BMarket Size 2025
2036 FORECAST VALUE$1.2BBase Case , 2026 to 2036
CAGR 2026 TO 20366.4 %Bull 7.5% / Bear 5.2%
INCREMENTAL OPPORTUNITY$0.6BNet 10- year value creation
EXPANSION MULTIPLE1.86x2036 value over 2026 base
Strategic Levers
M&A Pipeline
Regional Outlook
Country Rankings
Competitive Intelligence
Segmental Deep-dive
Call-Us : 91 93563 13602

Executive Snapshot and Market Trajectory

Polymeric sand remains almost exclusively a North American hardscaping product, and rising outdoor living space renovation spending is pushing manufacturers toward permeable and storm-resistant formulations faster than most retail distribution networks can restock. Buyers face few genuine alternatives given how few competitors match that scale at national distribution reach today.
Residential patio and driveway jointing sand accounts for the largest share of volume, but permeable and eco-friendly formulations are growing fastest as municipalities tighten stormwater runoff regulations on new hardscape installations. North America commands the overwhelming majority of global demand, a concentration this category carries that few other construction materials share at all. Buyers increasingly weigh both formulation type and regulatory compliance when selecting a supplier each season across most metropolitan markets.
Techniseal and Alliance set formulation and distribution benchmarks that smaller regional producers struggle to match at retail scale. Tightening stormwater permeability requirements and rapidly evolving storm-resistant polymer chemistry are both reshaping which producers can keep pace with contractor and homeowner expectations each year. Buyers increasingly diversify across multiple qualified suppliers rather than depend on any single producer for critical volume across regional markets.
Market Definition
The polymeric sand market covers sand and polymer binder blends sold as jointing material for concrete pavers, natural stone, and patio block installations, including standard, permeable, and natural stone formulations. It excludes the pavers and stone units themselves, base aggregate materials, and traditional unbound jointing sand without polymer binder.
Base Year Value
$0.6B in 2025 (MMA Primary Research Dataset, August 2026)
Forecast Period
2026 to 2036, eleven discrete annual values
CAGR
6.4% base case. Bull 7.5%. Bear 5.2%.
Fastest Growth Segment
Permeable and Eco-Friendly Polymeric Sand: 9.8% CAGR
Fastest Growth Country
Australia: 8.2% CAGR
Fastest Growth Region
South Asia and Pacific: 8.4% CAGR
Largest Region
North America: 68% of 2025 global value
Market Leaders
Techniseal Inc., Alliance Designer Products Inc., Quikrete Companies Inc., SRW Products Inc., Unilock Ltd. Source: MMA Analysis based on company annual reports and primary research, July 2026.
Primary Survey
n=3,800 procurement and R&D decision-makers, Q4 2025, six countries
Methodology
Demand-side build-up, cross-validated against public data, 47 expert interviews

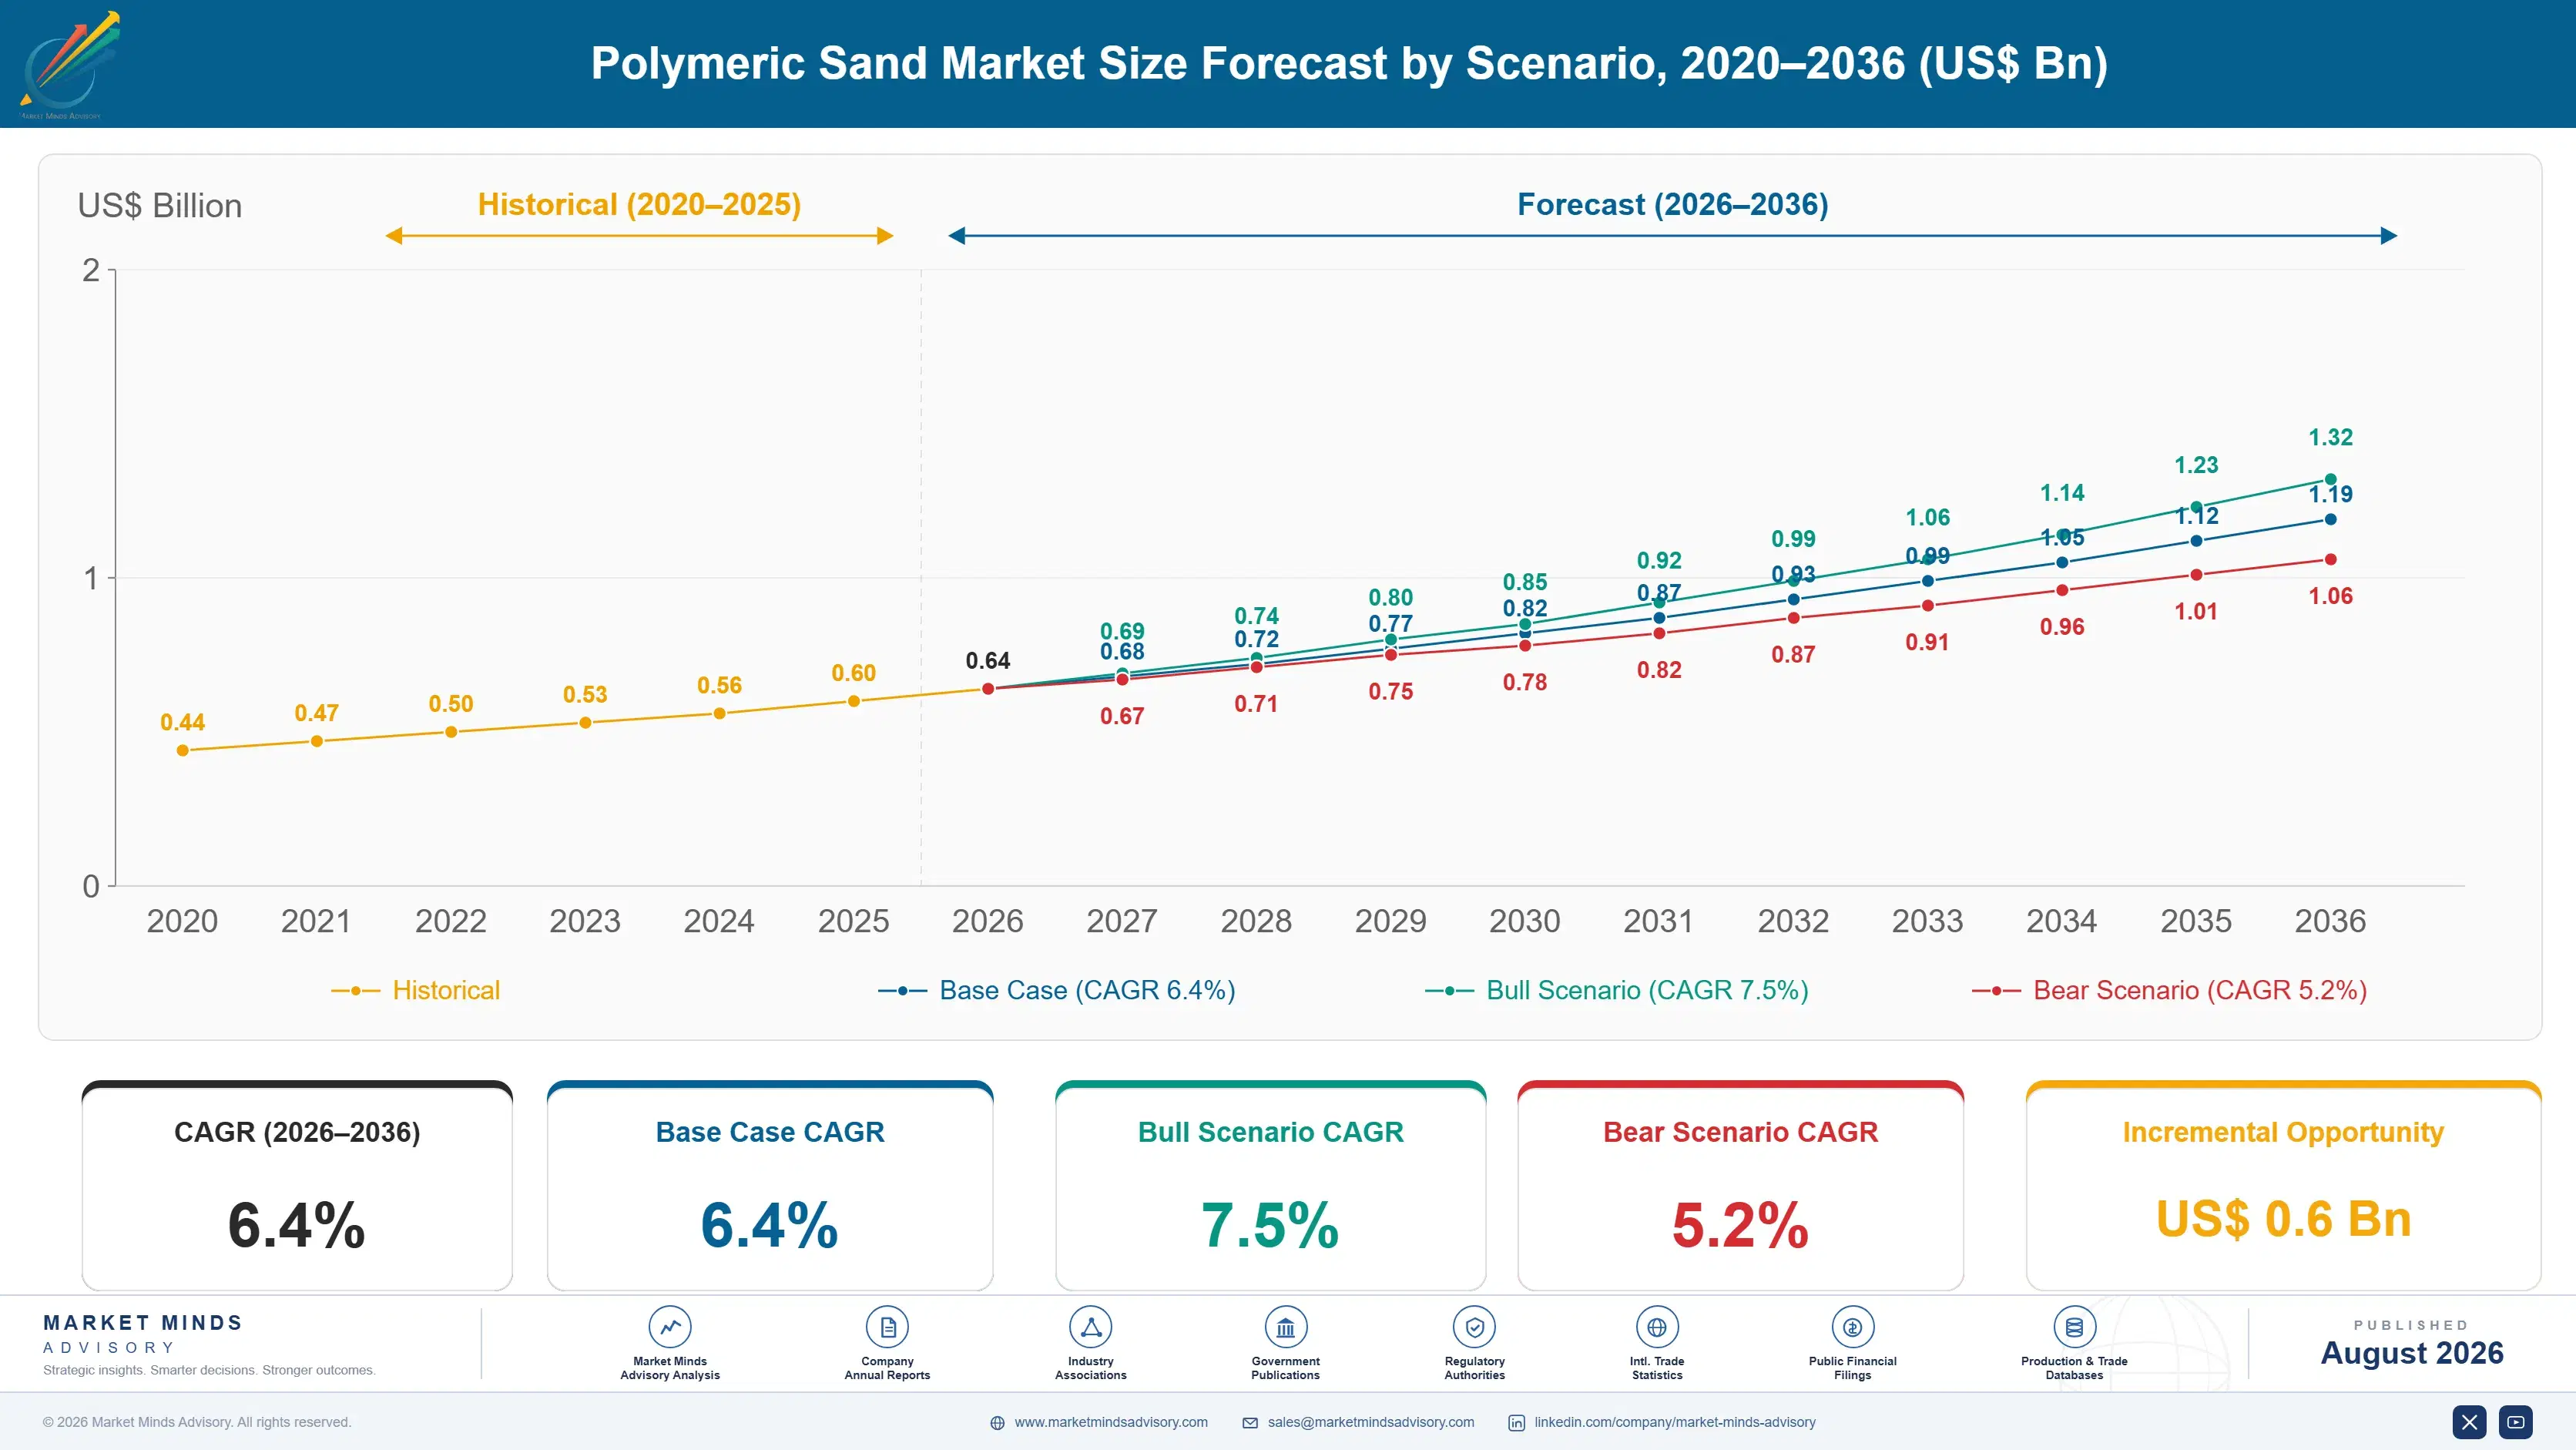
Polymeric Sand Market Forecast Scenarios

polymeric-sand-market-size-forecast-scenario-1787302900159
Polymeric sand demand grew steadily across 2020 to 2025, with pandemic-era outdoor living space renovation spending offsetting new construction slowdowns tied to higher mortgage rates. The market grew at an estimated 5.4% historical CAGR across the period, reflecting that largely offsetting mix of renovation-driven and new-construction demand across major regional markets each year, a pattern likely to continue across the industry.
The base case assumes outdoor living renovation activity continues at an elevated pace through 2028, permeable formulation adoption expands as more municipalities tighten stormwater regulations, and producers add incremental standard and permeable production capacity to meet both established and emerging demand pools. Together these three commercial mechanisms support a 6.4% forecast CAGR, with residential patio and driveway jointing sand remaining the anchor category even as permeable formulations narrow the value gap each year.
The bull case centers on an unusually strong outdoor renovation season pulling jointing sand demand well beyond current distributor inventory. The bear case centers on a renewed housing and renovation spending slowdown, whether from sustained high interest rates or reduced discretionary spending, which would strand incremental production capacity across manufacturers nationwide for several years across the industry.

Outdoor Living Demand Meets Tightening Stormwater Rules

Polymeric sand sits at the intersection of aggregate processing and polymer chemistry, since producers must formulate blends that cure properly across a wide range of climate and moisture conditions while resisting the efflorescence and haze problems that plagued early generations of the product. That formulation challenge has kept the producer base concentrated among companies with genuine polymer chemistry expertise rather than simple aggregate blending.
MARKET CONCENTRATION (CR5)58%Top five producers hold majority share of volume today
AVERAGE SELLING PRICE$42 per 50-lb bagReflects polymer content, joint width, and coverage rate
TOP PRODUCING COUNTRY SHAREUnited States, 61%Largest single national base for production capacity today
CAPACITY UTILIZATION RATE77%Producers running near practical ceiling during peak season
TRADE INTENSITY19% cross-borderMost volume stays within its producing country region
POLYMER COST SHARE41% of COGSLargest single cost line in production overall today
Commercially, the market splits between a mature residential patio and driveway base sold through big-box retail and landscape supply distribution, and a smaller but faster-growing permeable tier sold on stormwater compliance rather than aesthetic finish alone. Commercial hardscape and natural stone jointing round out demand with project-specific purchasing tied to municipal and institutional installation schedules. Pricing differs meaningfully across each tier described.
Over the next decade, formulation performance will matter more than aggregate sourcing alone, since most established producers already source comparable base sand from regional quarries. The producers that can add incremental permeable and storm-resistant formulation capacity fastest stand to capture a widening share of a market that stormwater regulation is reshaping as much as homeowner taste is, across every major producing region today.
"Polymeric sand looks like a commodity until you watch a bag fail in the field. The chemistry is the whole business, the sand is basically free."
Director, Building Materials Practice · MMA Construction & Industrial Equipment

Market Trends

Permeable Formulation Adoption Accelerates Very Rapidly

Municipalities across major US metropolitan areas have continued tightening stormwater runoff regulations on new hardscape installations, driving contractors and homeowners toward permeable polymeric sand formulations that allow water infiltration through paver joints rather than diverting it to storm drains. Techniseal and comparable producers have expanded permeable product lines since 2023, targeting both residential and commercial projects subject to impervious surface coverage limits under local stormwater ordinances. Producers that qualify permeable formulations for major municipal approved-products lists are capturing specification wins that standard formulation competitors cannot bid on, a qualification gap widening as more jurisdictions adopt low-impact development standards.
Market Impact: Requires 1 bag per installation
Storm-Resistant Formulation Chemistry Improves Very Significantly

Producers are racing to improve haze-resistant and efflorescence-resistant polymer chemistry after years of contractor complaints about early-generation products failing during heavy rain events shortly after installation. Newer formulations cure faster and resist washout during the critical first 24 to 48 hours after application, directly reducing the callback and reinstallation costs that damaged contractor confidence in the category during its early years. Manufacturers including Alliance and SRW have both disclosed reformulated product launches referencing faster cure times and improved rain resistance, aiming to win back contractor trust and expand use in regions with less predictable weather patterns during installation season.
Market Impact: Qualifies installations under 100+

Market Opportunities and Growth Drivers

Outdoor Living Space Renovation Spending Grows

Homeowner spending on outdoor living space renovation, including patios, walkways, and driveway upgrades, has continued climbing since 2023 as homeowners prioritize outdoor entertaining space improvements over larger discretionary purchases. Each new or renovated paver installation requires jointing sand as a near-mandatory companion purchase, meaning outdoor renovation spending translates almost directly into polymeric sand demand without the substitution flexibility buyers have in less specialized categories. Producers are responding by expanding retail distribution partnerships with home improvement chains to capture impulse and project-driven purchasing as renovation activity climbs across major suburban markets nationwide.
Market Impact: Concentrates demand in 1 core regio

Municipal Stormwater Regulation Tightening Expands Demand

Municipalities across major metropolitan areas are tightening impervious surface coverage limits and stormwater management requirements for new residential and commercial hardscape installations, driven by growing flood risk awareness and aging municipal drainage infrastructure that cannot absorb additional runoff. Permeable polymeric sand formulations qualify hardscape installations for reduced impervious surface classification under many local ordinances, creating a direct regulatory incentive that did not exist as prominently before 2020. Producers are responding by expanding permeable formulation certification testing and working directly with municipal planning departments to simplify approved-product qualification for contractors and homeowners.
Market Impact: Slows adoption 2 to 3 years

Market Restraints and Challenges

Near-Total Dependence on North American Demand

Polymeric sand remains almost exclusively a North American hardscaping product, since most other major markets favor mortar-set paving, open-joint installations, or traditional unbound sand for both climate and construction tradition reasons, leaving producers with limited diversification options outside the United States and Canada. That concentration means any sustained North American housing or renovation slowdown hits the entire industry, with no alternative market to absorb excess capacity. Producers are responding by testing expansion into markets like Australia where paver hardscaping culture resembles North American patterns, though building genuine scale outside North America remains a multi-decade undertaking given entrenched paving traditions elsewhere.
Market Impact: Expands product lines across 10+ st

Contractor Confidence Recovery From Early Formulation Failures

Early-generation polymeric sand products developed haze, efflorescence, and washout problems that damaged contractor and homeowner confidence in the category during its first decade of widespread adoption, and some contractors still default to traditional unbound sand or polymeric alternatives from unfamiliarity with improved modern formulations. That lingering skepticism slows adoption among contractors who experienced early product failures firsthand, even as current formulations have largely resolved the underlying chemistry problems. Producers are responding by investing in contractor education programs and extended product warranties to rebuild confidence, though changing established contractor habits takes years of consistent field performance to fully achieve.
Market Impact: Cuts cure time to 48 hours
3 additional market trends, 4 additional growth drivers, and 3 additional restraints and challenges are covered in the full report. Contact sales@marketmindsadvisory.com to access the complete intelligence.

Segment CAGR and Growth Architecture

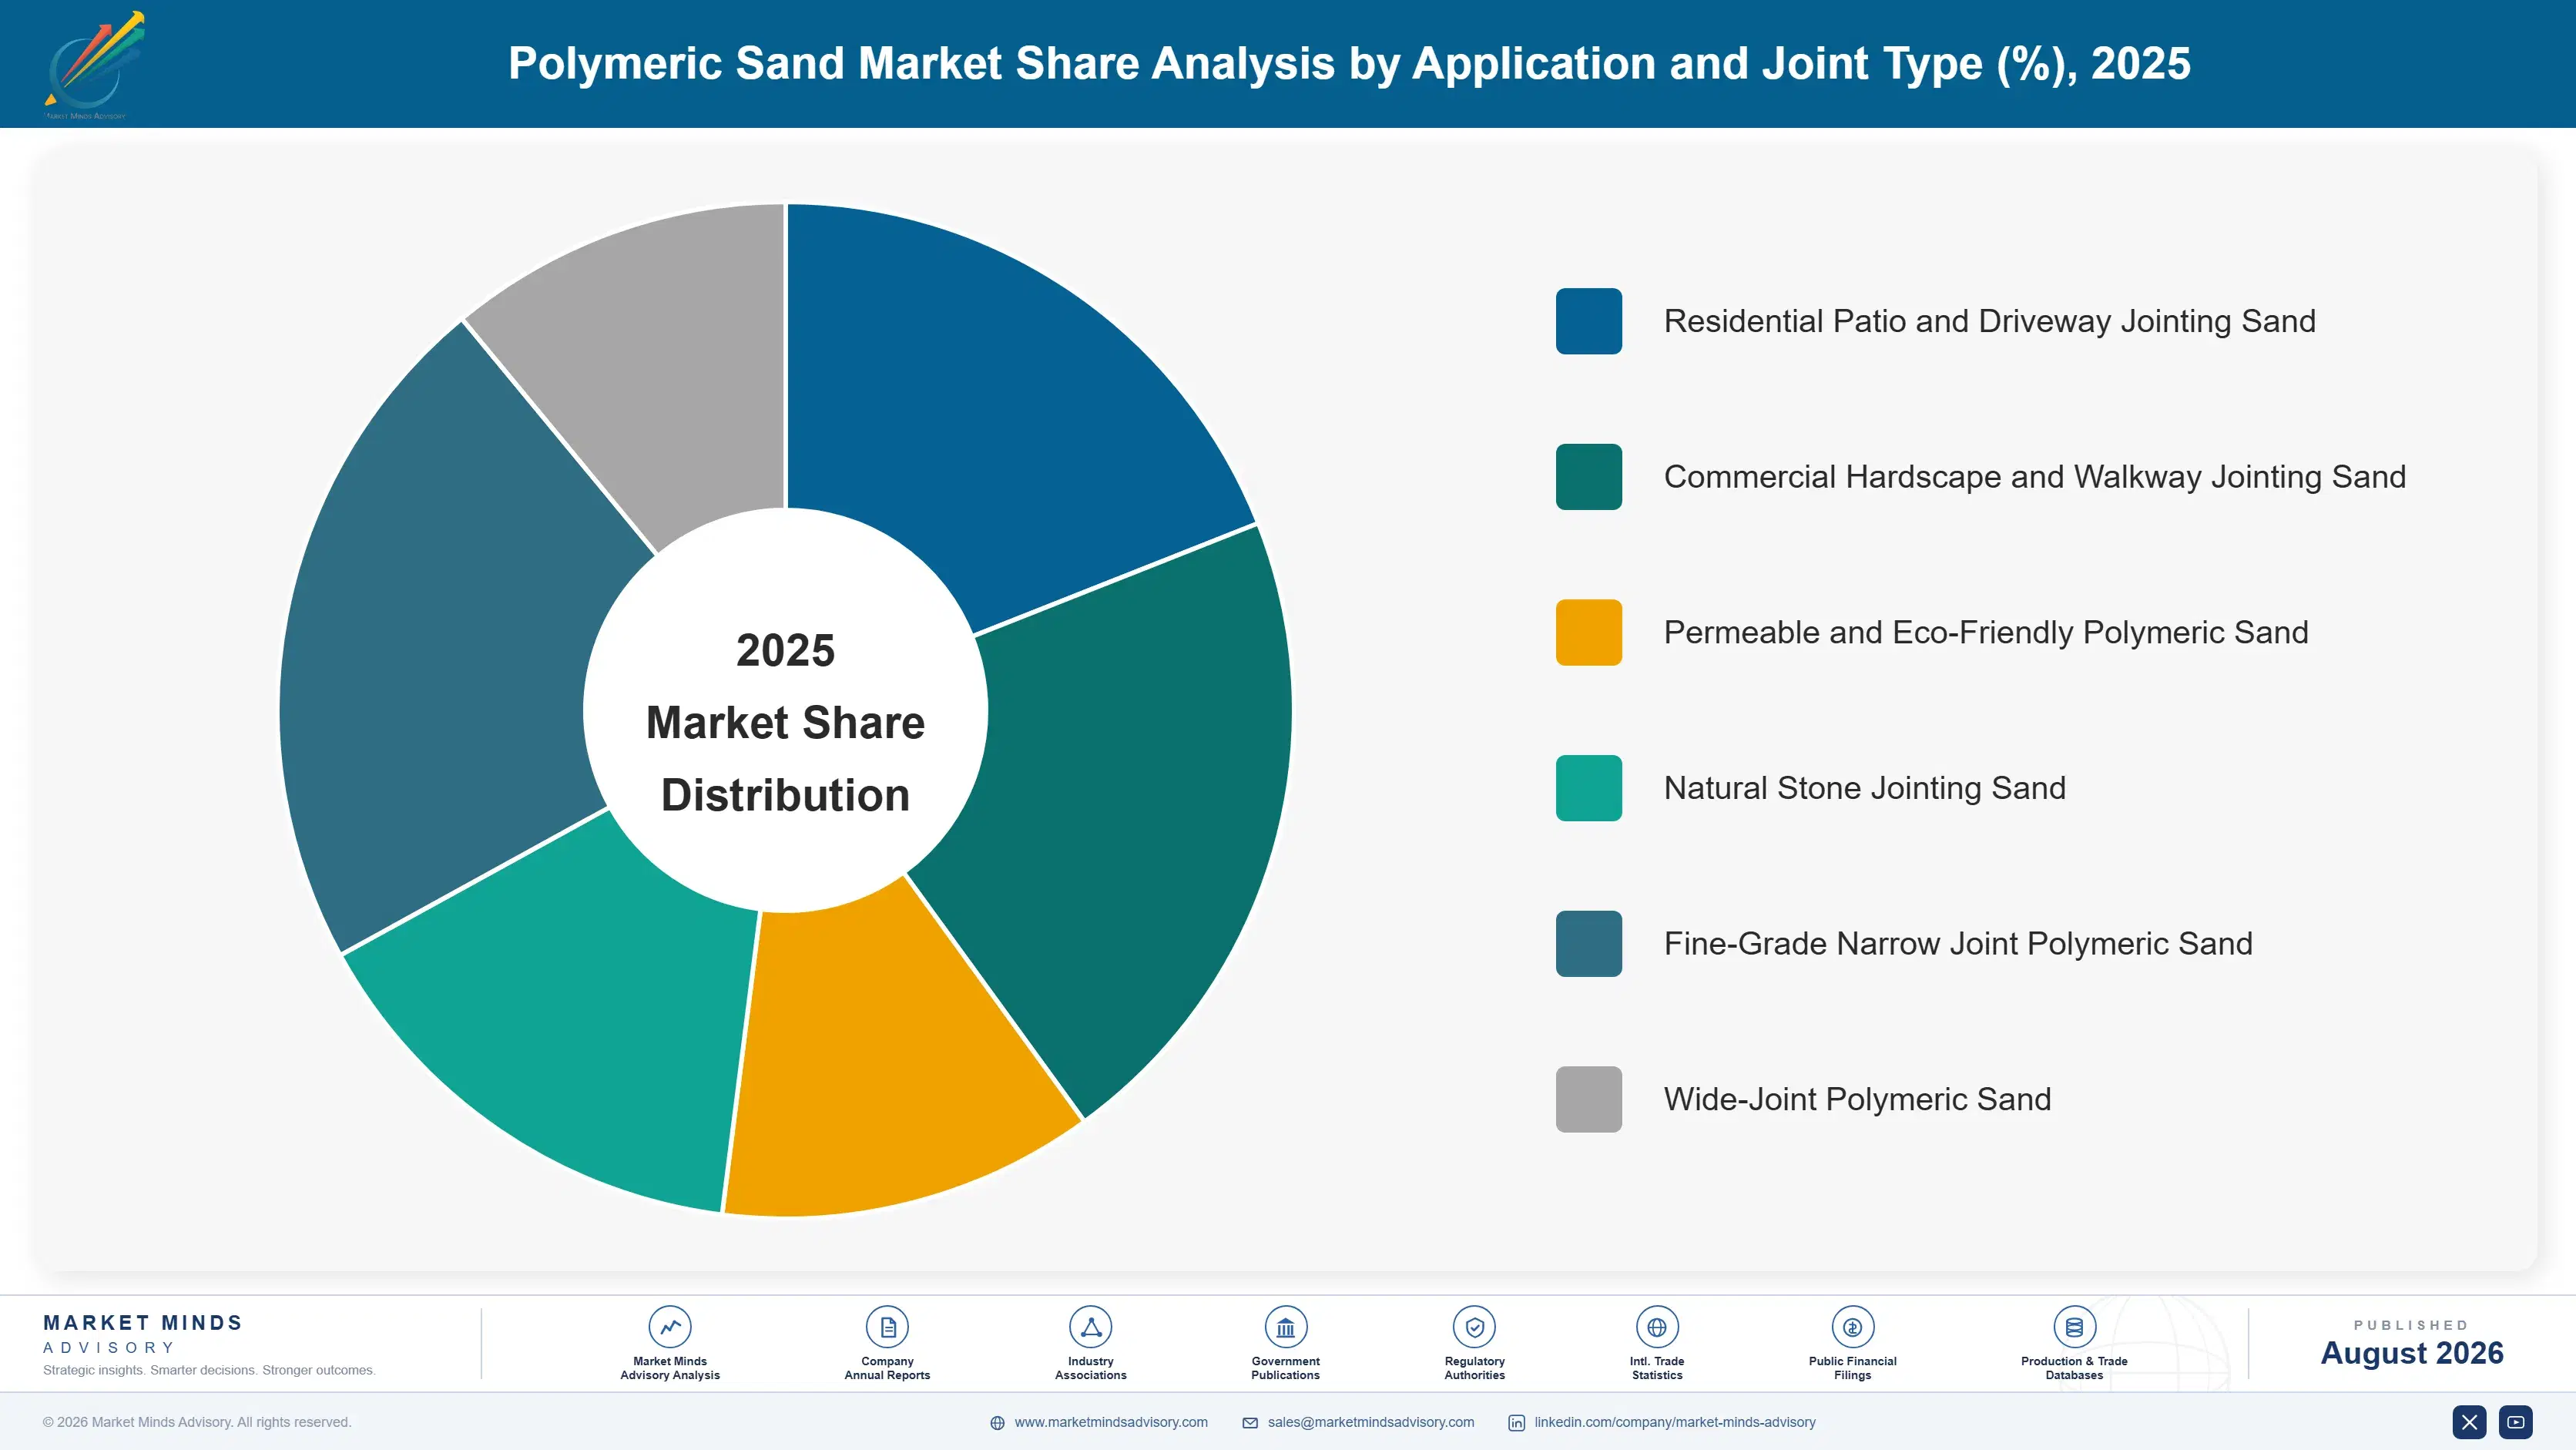
Polymeric sand segments by application and joint width, the classification producers and contractors use to set formulation, coverage rate, and installation method, since residential, commercial, and permeable buyers each negotiate under distinct commercial and technical terms across the industry. Producers price each category differently depending on formulation depth and regulatory alignment required each year.
polymeric-sand-market-market-share-analysis-1787302900709

Permeable and Eco-Friendly Polymeric Sand

Permeable and eco-friendly polymeric sand is the fastest-growing segment as municipalities tighten stormwater runoff regulations on new hardscape installations across major metropolitan areas nationwide. Techniseal and comparable producers have expanded permeable product lines since 2023, targeting residential and commercial projects subject to impervious surface coverage limits under local stormwater ordinances. Producers that qualify permeable formulations for municipal approved-products lists are capturing specification wins that standard formulation competitors cannot access, a qualification advantage that compounds as more jurisdictions adopt low-impact development standards for new construction. If permeable formulation adoption continues expanding at the current regulatory pace, this segment could approach a meaningful share of total category value within the next decade, a trajectory no other formulation category currently matches.
CAGR 9.8%

Commercial Hardscape and Walkway Jointing Sand

Commercial hardscape and walkway jointing sand is the second-fastest-growing segment as municipalities, universities, and commercial property developers increasingly specify polymeric sand over traditional unbound sand for high-traffic pedestrian areas requiring durability and reduced maintenance. Commercial installations typically require larger volume orders and more rigorous specification documentation than residential projects, favoring producers with established institutional purchasing relationships and proven large-scale installation track records. Quikrete and Unilock have both expanded commercial-grade product lines specifically targeting municipal and institutional contracts, where durability and weed-resistance claims matter more to purchasing decisions than aesthetic color matching. This segment carries meaningfully higher per-project volume than residential work, though sales cycles run longer given institutional procurement and bidding requirements that residential retail purchasing does not involve.
CAGR 7.6%
Full segment breakdown across 6 segments available in the complete report.

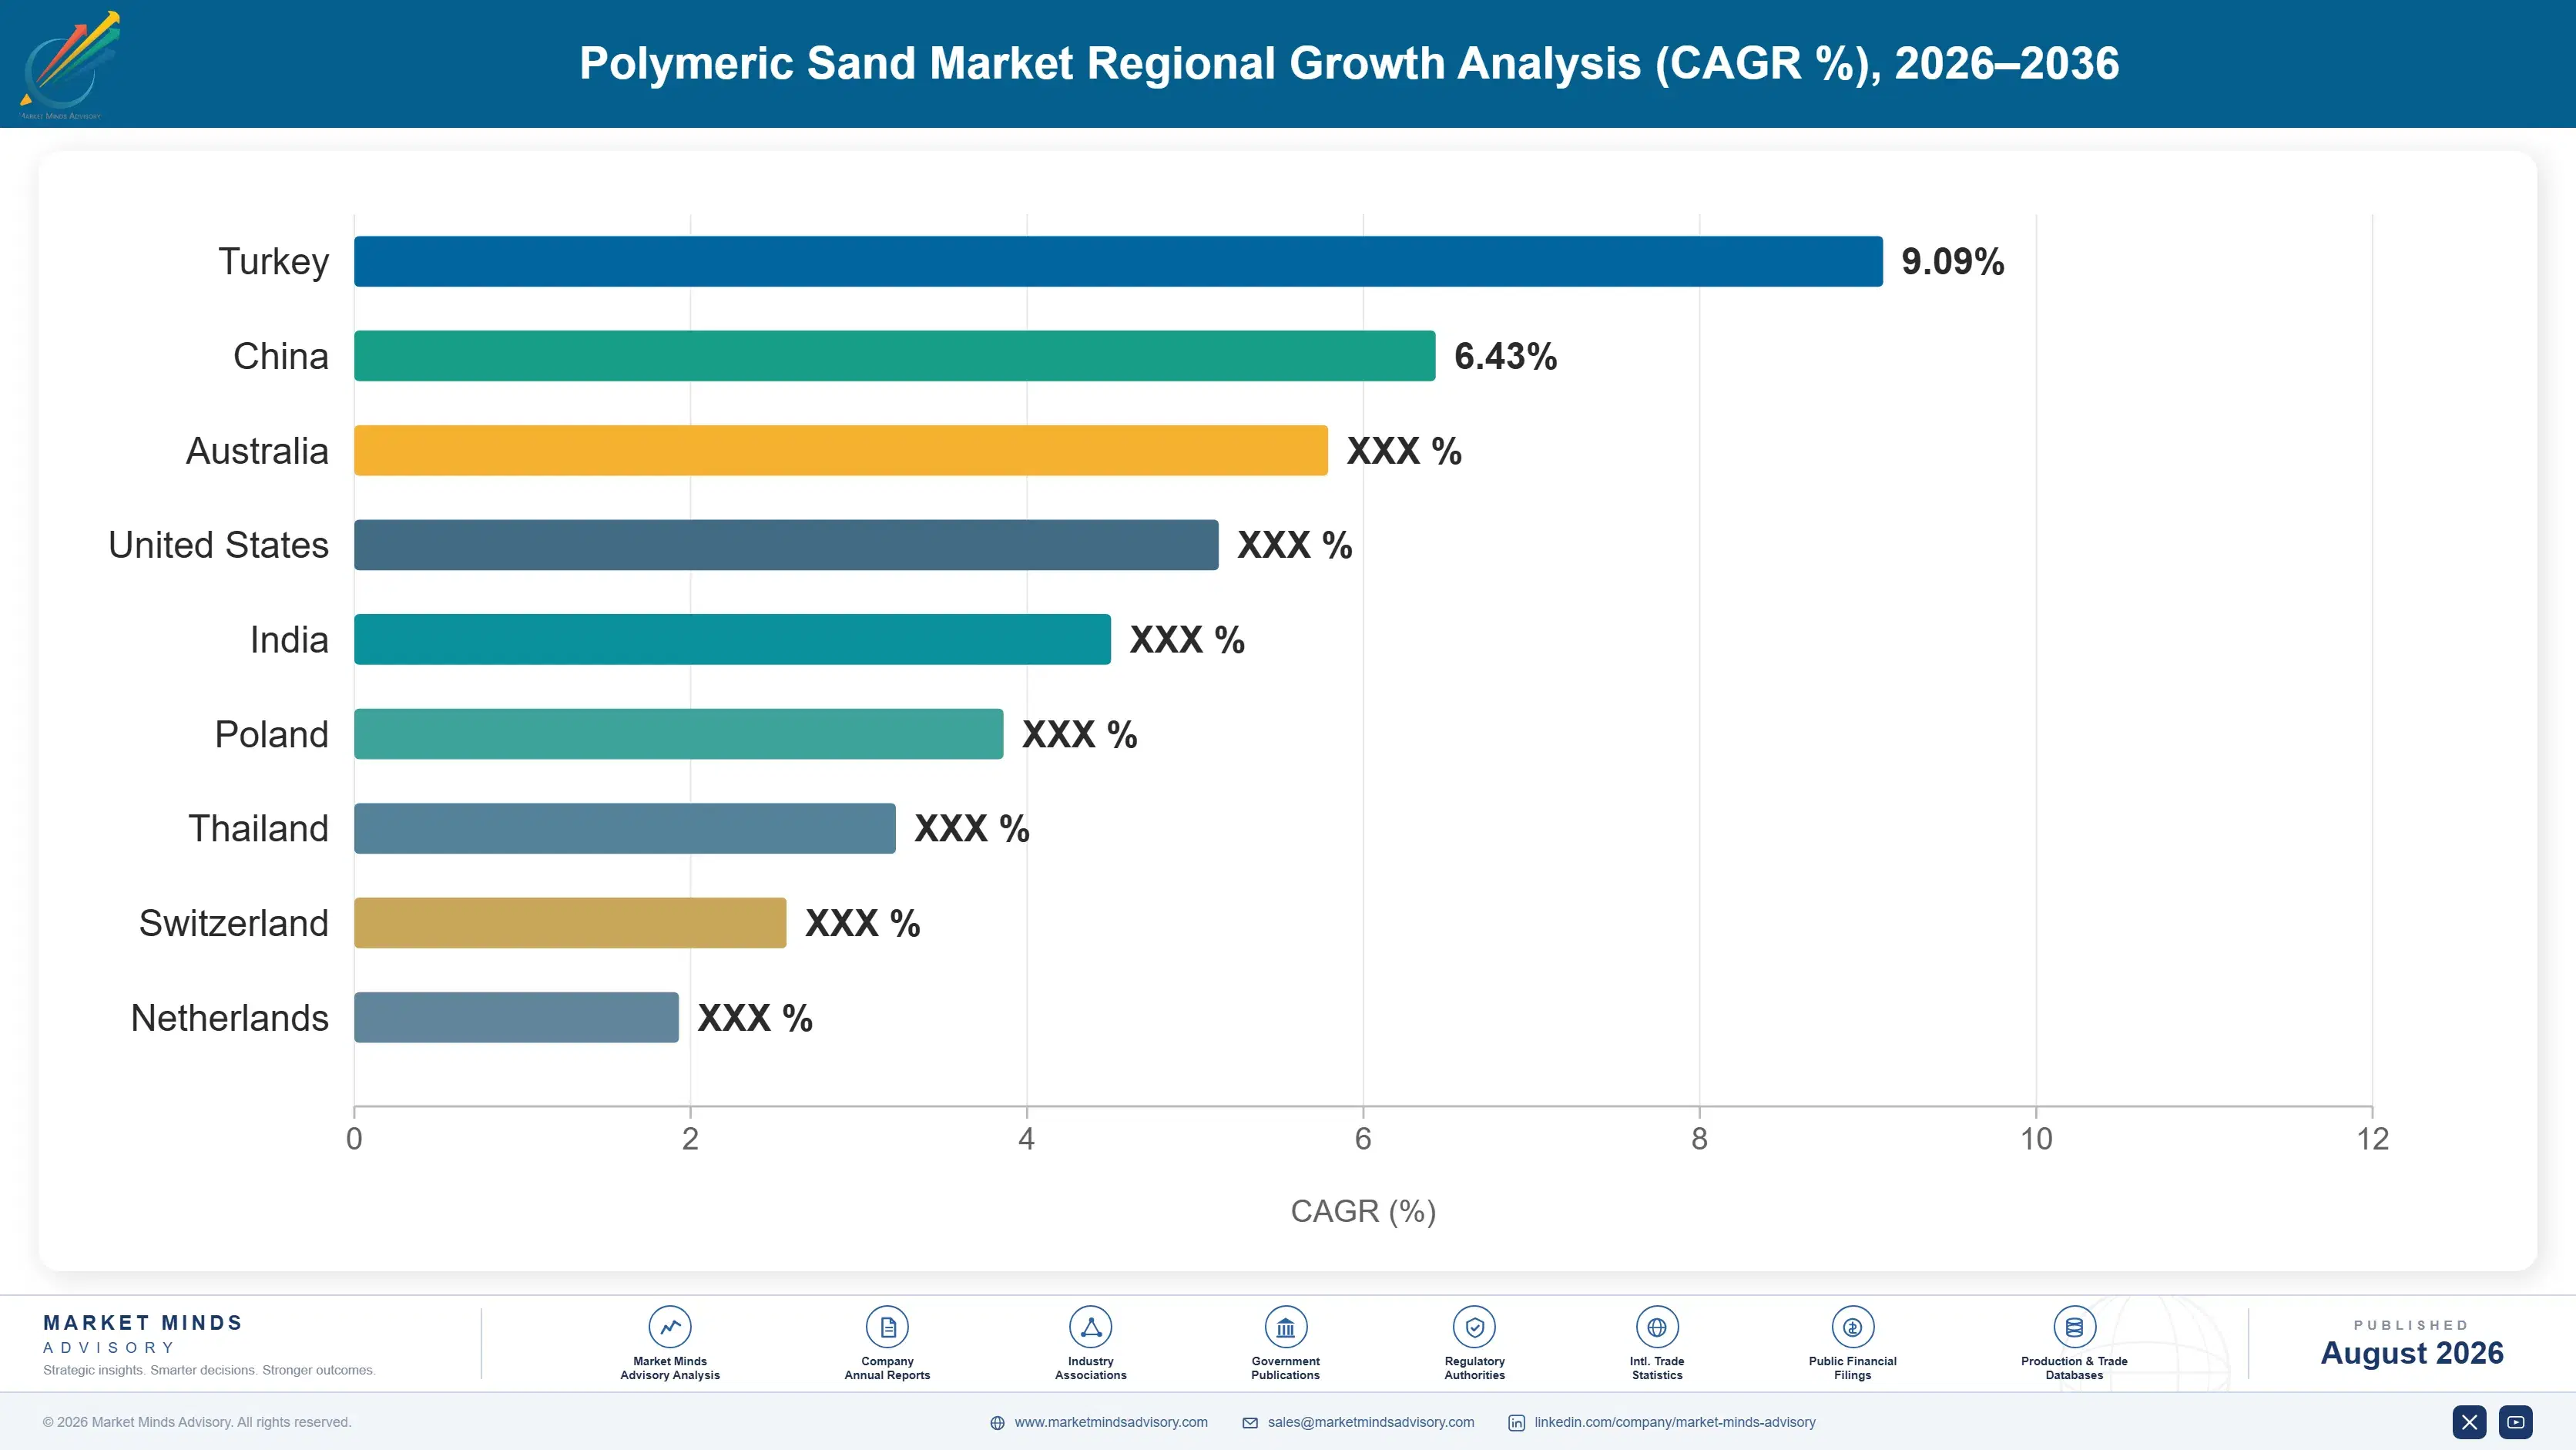
Regional Architecture and Country Demand Map

Polymeric sand demand concentrates overwhelmingly in North America rather than following global construction activity broadly. North America leads by a wide margin given the category's near-exclusive use in paver hardscaping there, while most other regions favor mortar-set or unbound jointing methods instead. South Asia and Pacific follows given similar conditions.

North America

The United States accounts for the vast majority of North America's polymeric sand demand, a share far above this region's typical band across MMA's broader construction materials coverage, justified because polymeric sand functions as the default paver jointing material across the overwhelming majority of US hardscape installations. Outdoor living space renovation spending across suburban markets nationwide represents the largest demand driver, since patio and driveway paver projects treat jointing sand as a near-mandatory companion purchase. Canada contributes a smaller but steady share tied to its own residential hardscaping and landscape supply retail sector, with Techniseal's home market advantage strong there. Mexico's contribution remains modest but is growing as suburban housing developments adopt North American-style paver hardscaping over traditional alternatives.
Share: 68% | CAGR: 7.0% (2026 to 2036)

Western Europe

Western Europe holds a share of global polymeric sand demand well below this region's typical band, justified because mortar-set paving and traditional unbound jointing sand remain the dominant installation methods across most of the region for both construction tradition and climate reasons that favor those approaches over polymeric alternatives. Germany, France, and the United Kingdom account for what limited demand exists, concentrated mostly in residential patio projects where polymeric sand competes on installation speed against mortar-set alternatives. Growth here trails every other major region given how entrenched traditional jointing methods remain across most new construction and renovation projects. Producers serving this market operate at a fundamentally smaller scale than their North American counterparts given the category's niche regional position.
Share: 14% | CAGR: 4.8% (2026 to 2036)
Regional intelligence for 5 additional markets available in the complete report: East Asia, South Asia and Pacific, Latin America, Middle East and Africa, Eastern Europe. Contact sales@marketmindsadvisory.com.
polymeric-sand-market-country-cagr-analysis-1787302901267

Where Polymeric Sand Producers Are Capturing Margin

Four commercial moves separate polymeric sand producers capturing outsized margin from those competing purely on delivered bag price, each tied to formulation depth, regulatory qualification, or retail distribution reach that shields volume from commodity price competition across the industry each year. Each move requires a different mix of capital investment and multi-year commercial commitment before it meaningfully improves margin.

Permeable Formulation Certification Growth Strategy Program

Producers investing in permeable formulation certification testing across major municipal approved-products lists are capturing the regulatory-driven demand shift toward compliant products in stormwater-restricted jurisdictions, a category commanding meaningfully higher margins than standard formulations. Developing and certifying a permeable formulation typically costs $2 million to $6 million in infiltration rate testing and municipal qualification investment across major metropolitan markets. Producers without permeable certification increasingly lose contractor specification in stormwater-restricted jurisdictions as homeowners and municipalities chase the compliance benefits that only certified products provide legitimately. Producers without such investment risk permanent exclusion from stormwater-compliant procurement programs industry-wide.
Market Impact: Costs $2 to $6 million per new cert

Storm-Resistant Chemistry Development Growth Strategy Program

Producers developing faster-curing, storm-resistant polymer chemistry are positioning to win back contractor accounts lost to early-generation formulation failures, rather than ceding those accounts permanently to unbound sand alternatives. Developing a next-generation storm-resistant formulation typically costs $3 million to $8 million in polymer chemistry research and accelerated weathering testing against variable climate conditions. Producers without this formulation investment risk losing contractor accounts entirely once competitors demonstrate consistently reliable field performance across a full installation season. Producers without competitive reformulation increasingly cede these accounts to better-prepared rivals investing in faster-curing chemistry across every major market.
Market Impact: Costs $3 to $8 million per new form

Big-Box Retail Distribution Partnership Growth Strategy

Producers securing prominent shelf placement and exclusive distribution agreements with major home improvement retailers are capturing premium retail pricing and impulse purchase volume that smaller producers selling only through landscape supply yards cannot access. These retail partnerships typically carry meaningful volume commitments and marketing co-investment requirements, reflecting the value retailers place on proven sell-through performance and reliable seasonal restocking. Producers able to demonstrate consistent retail performance increasingly win expanded shelf space over smaller competitors lacking comparable distribution scale. These partnerships typically cost $500,000 to $2 million annually in marketing co-investment and volume guarantees.
Market Impact: Commands 5 to 10% premium at retail

Contractor Education and Warranty Program Development

Producers investing in contractor education programs and extended product warranties are rebuilding confidence among contractors who experienced early-generation formulation failures, capturing specification loyalty that price-only competitors cannot replicate quickly. Building a comprehensive contractor education and warranty program typically costs $1 million to $3 million annually in training infrastructure and extended warranty reserve funding. Producers without these programs increasingly struggle to win back contractors who defaulted to unbound sand alternatives after early product failures damaged category-wide trust. Producers without these programs increasingly cede specification loyalty to better-prepared competitors investing in trust rebuilding.
Market Impact: Costs $1 to $3 million annually per

Who Controls the Margin Pool

The top five producers hold an estimated 58% of global polymeric sand shipment volume, a moderate-high concentration reflecting the formulation expertise and retail distribution scale required to compete at national scale. Techniseal and Alliance lead on formulation breadth and retail distribution relationships, while a second tier of regional producers competes on price for standard residential formulations that do not require permeable or commercial-grade certification.
Current competitive activity centers on three fronts. Permeable formulation certification investment is opening a new front for producers willing to commit testing capital ahead of further municipal regulatory tightening. Storm-resistant chemistry development is becoming increasingly important as producers compete to win back contractor accounts lost to early formulation failures. And several producers are pursuing expanded big-box retail distribution partnerships to capture impulse purchase volume.

Emerging pressure comes from smaller regional producers moving up the formulation curve as they invest in permeable and storm-resistant chemistry, though matching Techniseal or Alliance's national retail distribution breadth remains years away for most. If these challengers close that formulation gap, expect share to shift within specific regional markets first, before any material pressure reaches the largest incumbents given how deeply embedded existing retail distribution relationships are across the industry.
polymeric-sand-market-company-positioning-matrix-1787302901802

Competitive Moat and Risk Dimensions

TECHNISEAL INC.

Moat: Original Polymeric Sand Patent Legacy

Techniseal's early polymeric sand patents and decades of accumulated formulation expertise give it a reputation for reliability that newer entrants struggle to match, particularly among contractors who remember the category's early formulation problems. That legacy generates default consideration among contractors prioritizing proven field performance. That reputation shapes contractor purchasing decisions well beyond Techniseal's own direct sales.
TECHNISEAL INC.

Risk: Vulnerability to Store Brands

Techniseal's premium positioning leaves it more exposed than lower-cost competitors to private-label and store-brand polymeric sand products that big-box retailers increasingly offer, particularly among price-sensitive homeowners undertaking do-it-yourself installation projects. That vulnerability grows each season as retailers expand private-label offerings targeting the same price-sensitive homeowner segment Techniseal has traditionally served.
ALLIANCE DESIGNER PRODUCTS INC.

Moat: Gator Brand Retail Distribution Reach

Alliance's Gator brand holds prominent shelf placement across major home improvement retailers nationwide, giving it consumer visibility that smaller regional producers cannot match without comparable marketing investment. This retail reach drives impulse and project-driven purchasing that specialty distributors alone cannot generate, across most major retail markets nationwide each season.
ALLIANCE DESIGNER PRODUCTS INC.

Risk: Formulation Commoditization by Competitors

Alliance's retail-focused positioning leaves it more exposed to formulation commoditization as competitors replicate its core chemistry, potentially eroding the differentiation that originally justified its premium retail shelf position over less-branded alternatives. That erosion risk grows each season as more competitors replicate Alliance's formulation without matching its retail distribution investment.

Players Tracked

Prominent Players

Techniseal Inc.
Alliance Designer Products Inc.
Quikrete Companies Inc.
SRW Products Inc.
Unilock Ltd.

Other Key Players

Oldcastle APG Inc.
Envirosand Inc.
DOMINATOR Polymeric Sand Inc.
G2 Polymeric Sand LLC
ProKoat Inc.
Romeo's Hardscape Supply LLC
Levelast Corporation
Spec Mix Inc.
Bonsal American Inc.
Basalite Concrete Products LLC
Rinox Inc.
Permacon Group Inc.
Sika Corporation
Hanover Architectural Products
Belgard

Recent Developments

MARCH 2025

Techniseal Expands Permeable Formulation Production Capacity

Techniseal commissioned additional permeable polymeric sand production capacity at its facility, expanding dedicated output to meet rising municipal stormwater compliance demand. The expansion followed distributor commitments signed as more municipalities tightened impervious surface regulations. Similar expansions are expected across other regional facilities. Industry analysts expect similar investments soon.
Signal: Confirms producers are pre-committing capa
SEPTEMBER 2024

Alliance Signs Expanded Retail Distribution Agreement

Alliance secured a multi-year distribution agreement with a major national home improvement retailer covering prominent shelf placement across store locations, guaranteeing defined volume through 2028. The agreement reflects retailers' broader push to lock in reliable seasonal supply ahead of peak renovation demand. Similar agreements are expected across other qualified producers.
Signal: Shows retailers prioritizing supply certai
JANUARY 2025

SRW Products Announces Storm-Resistant Formulation Launch

SRW Products announced a reformulated storm-resistant polymeric sand product designed to cure faster and resist washout during heavy rain events shortly after installation. The launch followed sustained contractor pressure for more reliable formulations after years of early-generation product complaints. Industry analysts expect similar launches from competing producers soon.
Signal: Signals storm-resistant chemistry is becom

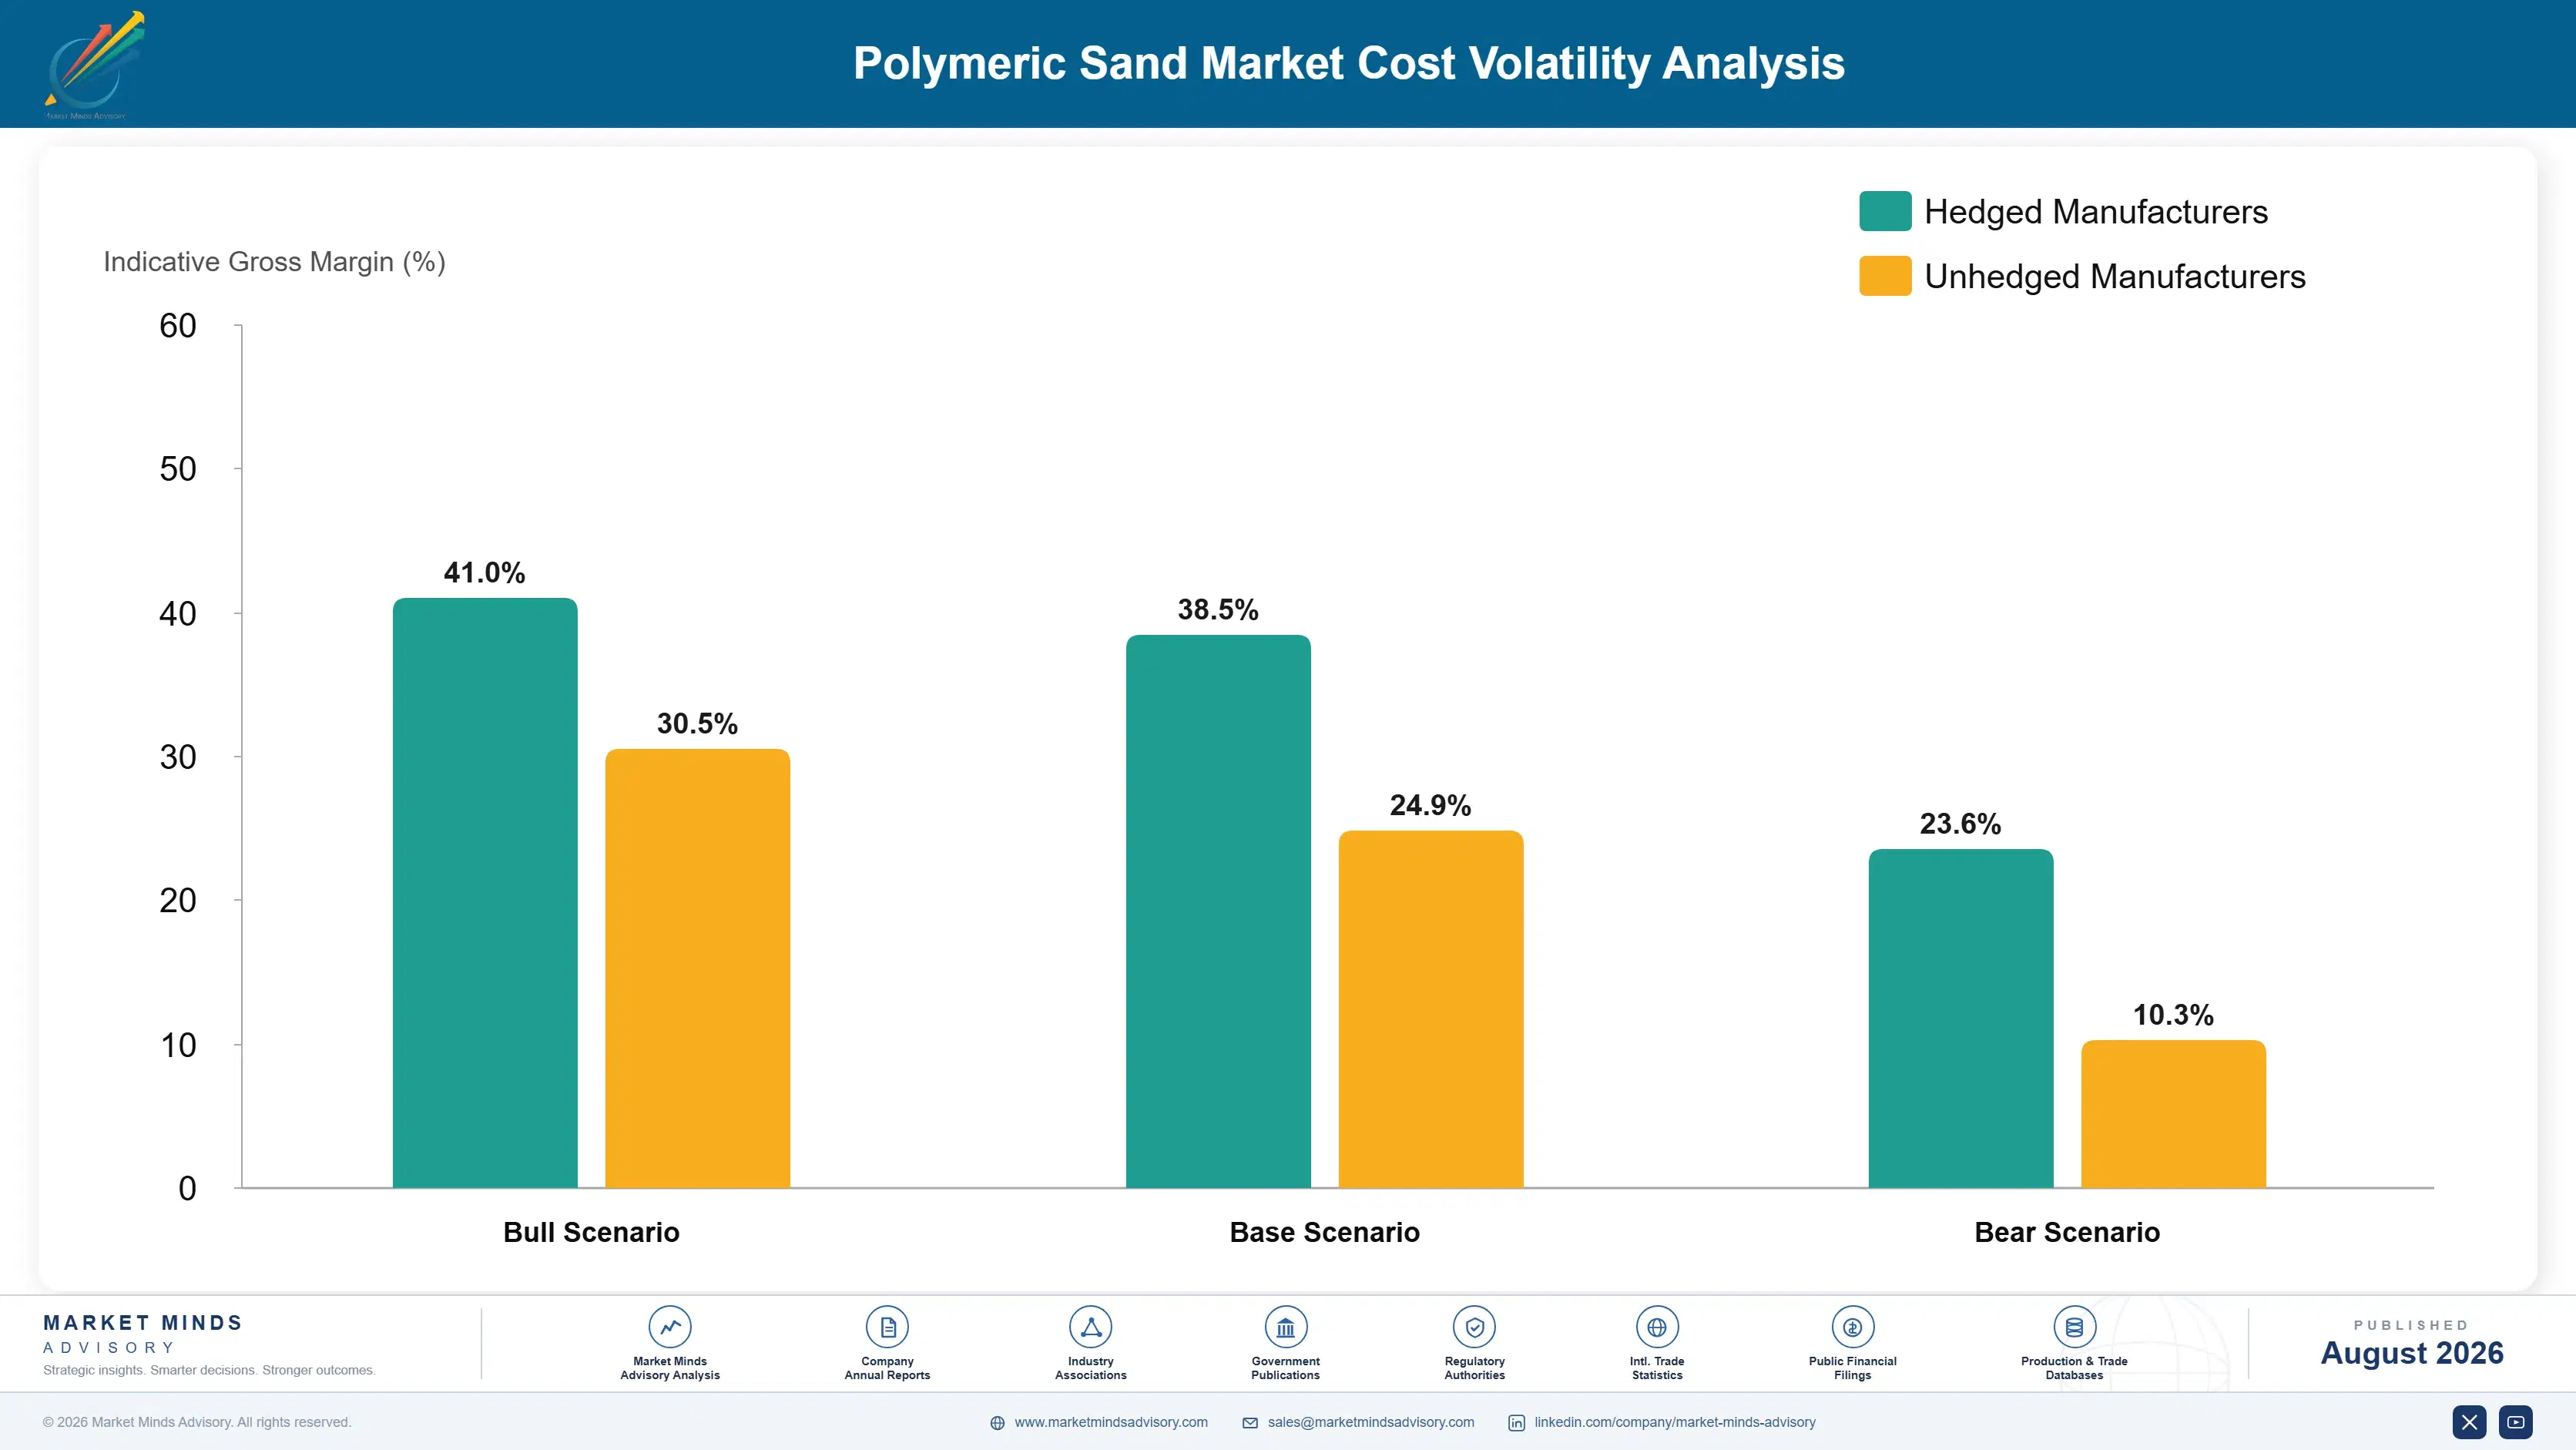
Polymer Resin Dependence and Sand Cost Exposure

Polymer binder resin and graded sand together account for roughly 41% of cost of goods sold in polymeric sand production, with polymer resin pricing tied closely to petrochemical feedstock markets while sand sourcing depends on regional quarry proximity and grading specifications. Packaging and freight add a further meaningful share, given the bulky, heavy nature of bagged product shipped to retail and landscape supply distribution points.
Polymer resin prices spiked during 2021 and 2022 as petrochemical feedstock markets tightened, with several producers reporting input cost increases exceeding 22% in their 2022 annual reports before pricing stabilized through 2023. Industry supply chain reviews have flagged polymer resin as polymeric sand production's single most volatile cost component, more than other inputs. Several producers have publicly flagged this resin exposure as a leading operational risk heading into 2026.

Smaller regional producers without long-term polymer resin supply agreements absorbed the 2021 and 2022 price spike hardest, losing distributor bids to larger competitors including Techniseal and Alliance that had negotiated priority resin allocation years in advance. Producers with secured resin supply weathered the volatility far better than those dependent on spot market purchasing, a cost advantage that persists most sharply across smaller regional producers today.
polymeric-sand-market-cost-volatility-analysis-1787302901998

Long-Term Polymer Resin Supply Agreements

Larger producers are locking in multi-year polymer resin supply agreements directly with petrochemical suppliers, guaranteeing predictable input costs ahead of demand increases rather than relying on spot market pricing that has grown increasingly volatile since 2021. This approach adds cost certainty to production planning even when spot resin pricing swings sharply during periods of tight allocation.

Regional Quarry Proximity Investment

Several producers are locating new production facilities closer to regional sand quarry sources to reduce transportation cost and lead time exposure, particularly in high-demand suburban markets where freight cost represents a meaningful share of delivered product price. This proximity strategy meaningfully reduces both transportation cost and delivery lead time versus facilities located farther from quarry sources.

Product Portfolio Diversification Strategy

Producers are pursuing permeable and commercial-grade formulation qualification partly to diversify revenue beyond standard residential formulations most exposed to resin cost pass-through limitations under competitive retail pricing pressure. This diversification strategy also spreads producer revenue across a broader set of application categories, reducing dependence on any single feedstock or pricing cycle for volume consistently overall.

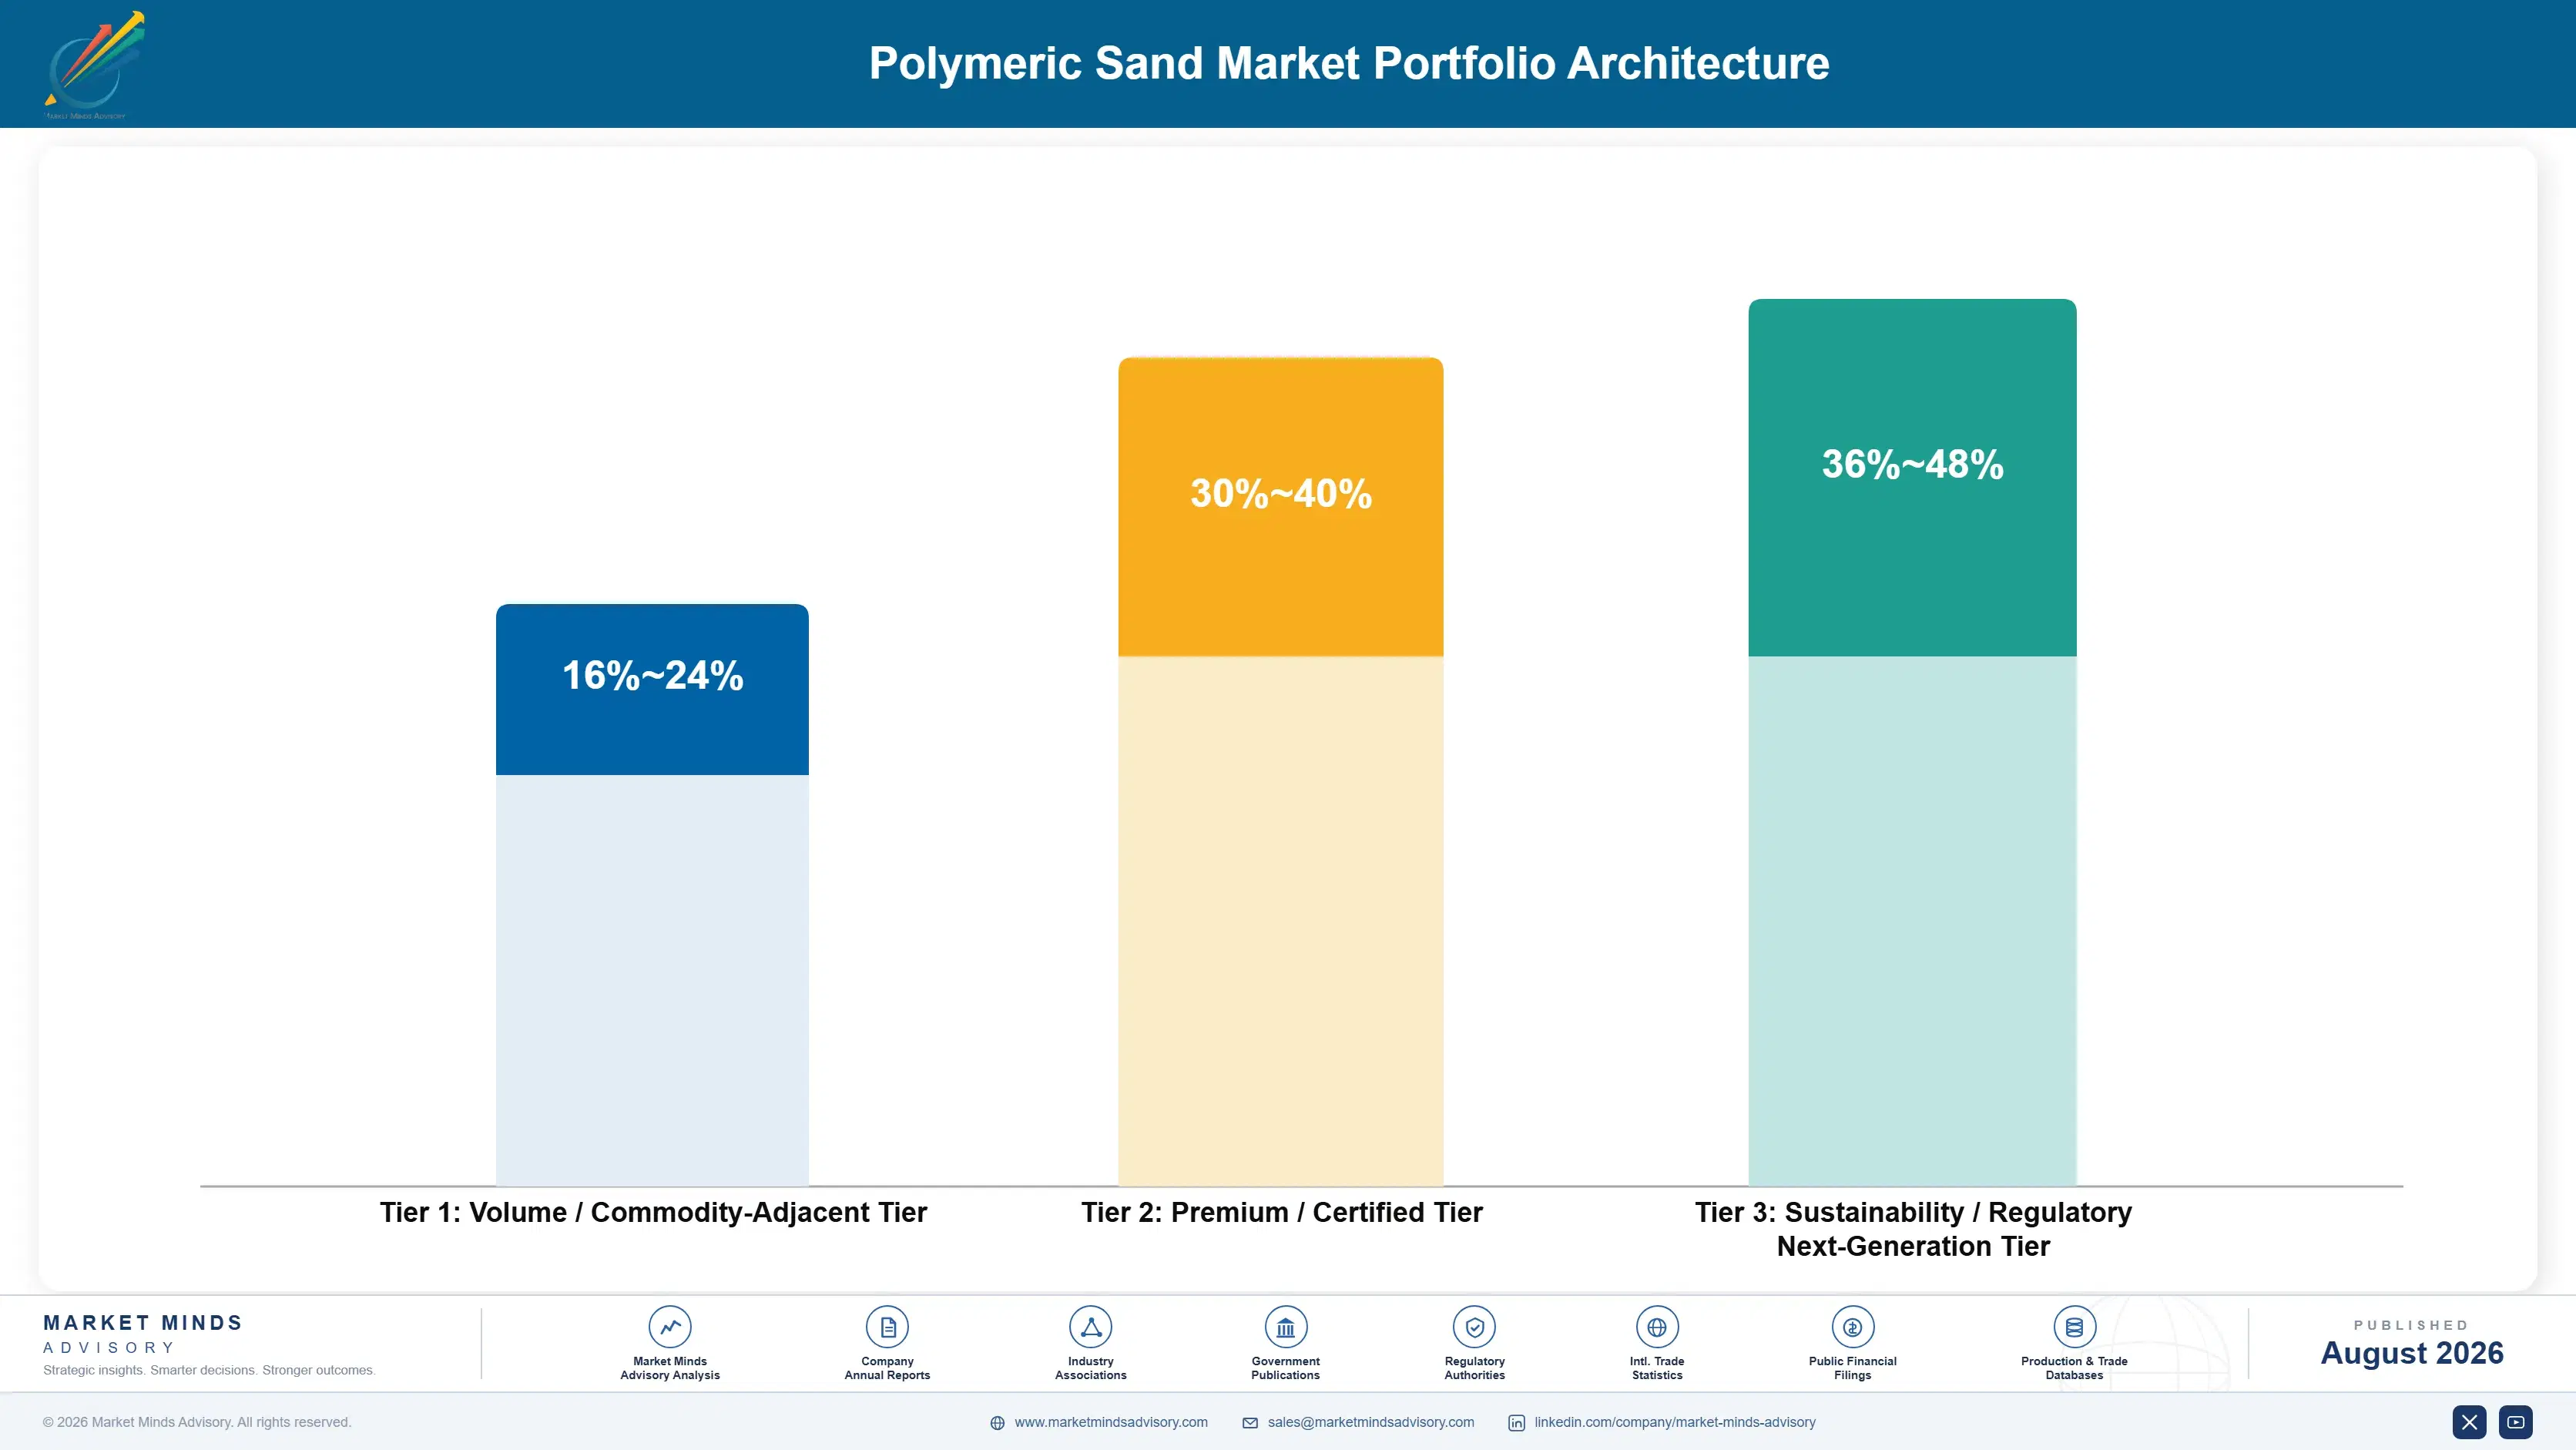
Portfolio Architecture for Margin Defence

Polymeric sand portfolios span three margin tiers, from commodity-adjacent standard residential formulations sold largely on price, through certified commercial-grade and natural stone formulations carrying application-specific premiums, toward a next-generation tier built around permeable and storm-resistant formulations still gaining share. Gross margin widens at each tier as formulation complexity and certification depth increase across the industry. Buyers pay for certification depth, not ma
The volume versus premium tension centers on production allocation. Producers must choose between dedicating capacity to high-margin permeable and commercial-grade programs with growing but smaller volume, or serving standard residential demand that fills out production capacity across a typical year. Producers without spare capacity favor higher-margin programs where competition remains thin. That decision shapes which producers win the highest-margin accounts each year.

High-value margin pools concentrate in permeable and storm-resistant formulation programs, where certification barriers and formulation complexity keep competition thin and buyers pay a premium for regulatory compliance and proven performance. Standard residential formulations remain the volume anchor but carry the thinnest margins across the portfolio, leaving smaller producers with fewer diversification options than larger competitors. Producers that diversify across premium and volume tiers capture the widest margin spread today.

Volume / Commodity-Adjacent Tier

Standard residential formulations sold largely on price and retail availability without permeable or commercial-grade certification premiums, across most residential retail buyer segments nationwide each year consistently overall today and beyond.
Gross Margin: 16%-24%

Premium / Certified Tier

Commercial-grade and natural stone formulations sold under distributor and institutional agreements carrying application-specific pricing power built through years of proven field performance and long-term institutional purchasing relationships nationwide today and beyond.
Gross Margin: 30%-40%

Sustainability / Regulatory / Next-Generation Tier

Permeable and storm-resistant formulations in active municipal qualification, commanding premium pricing against limited proven alternatives as regulators expand stormwater compliance requirements across most major metropolitan markets nationwide today and beyond.
Gross Margin: 36%-48%
polymeric-sand-market-portfolio-architecture-1787302902510

Renovation Cycles Drive Recurring Category Demand

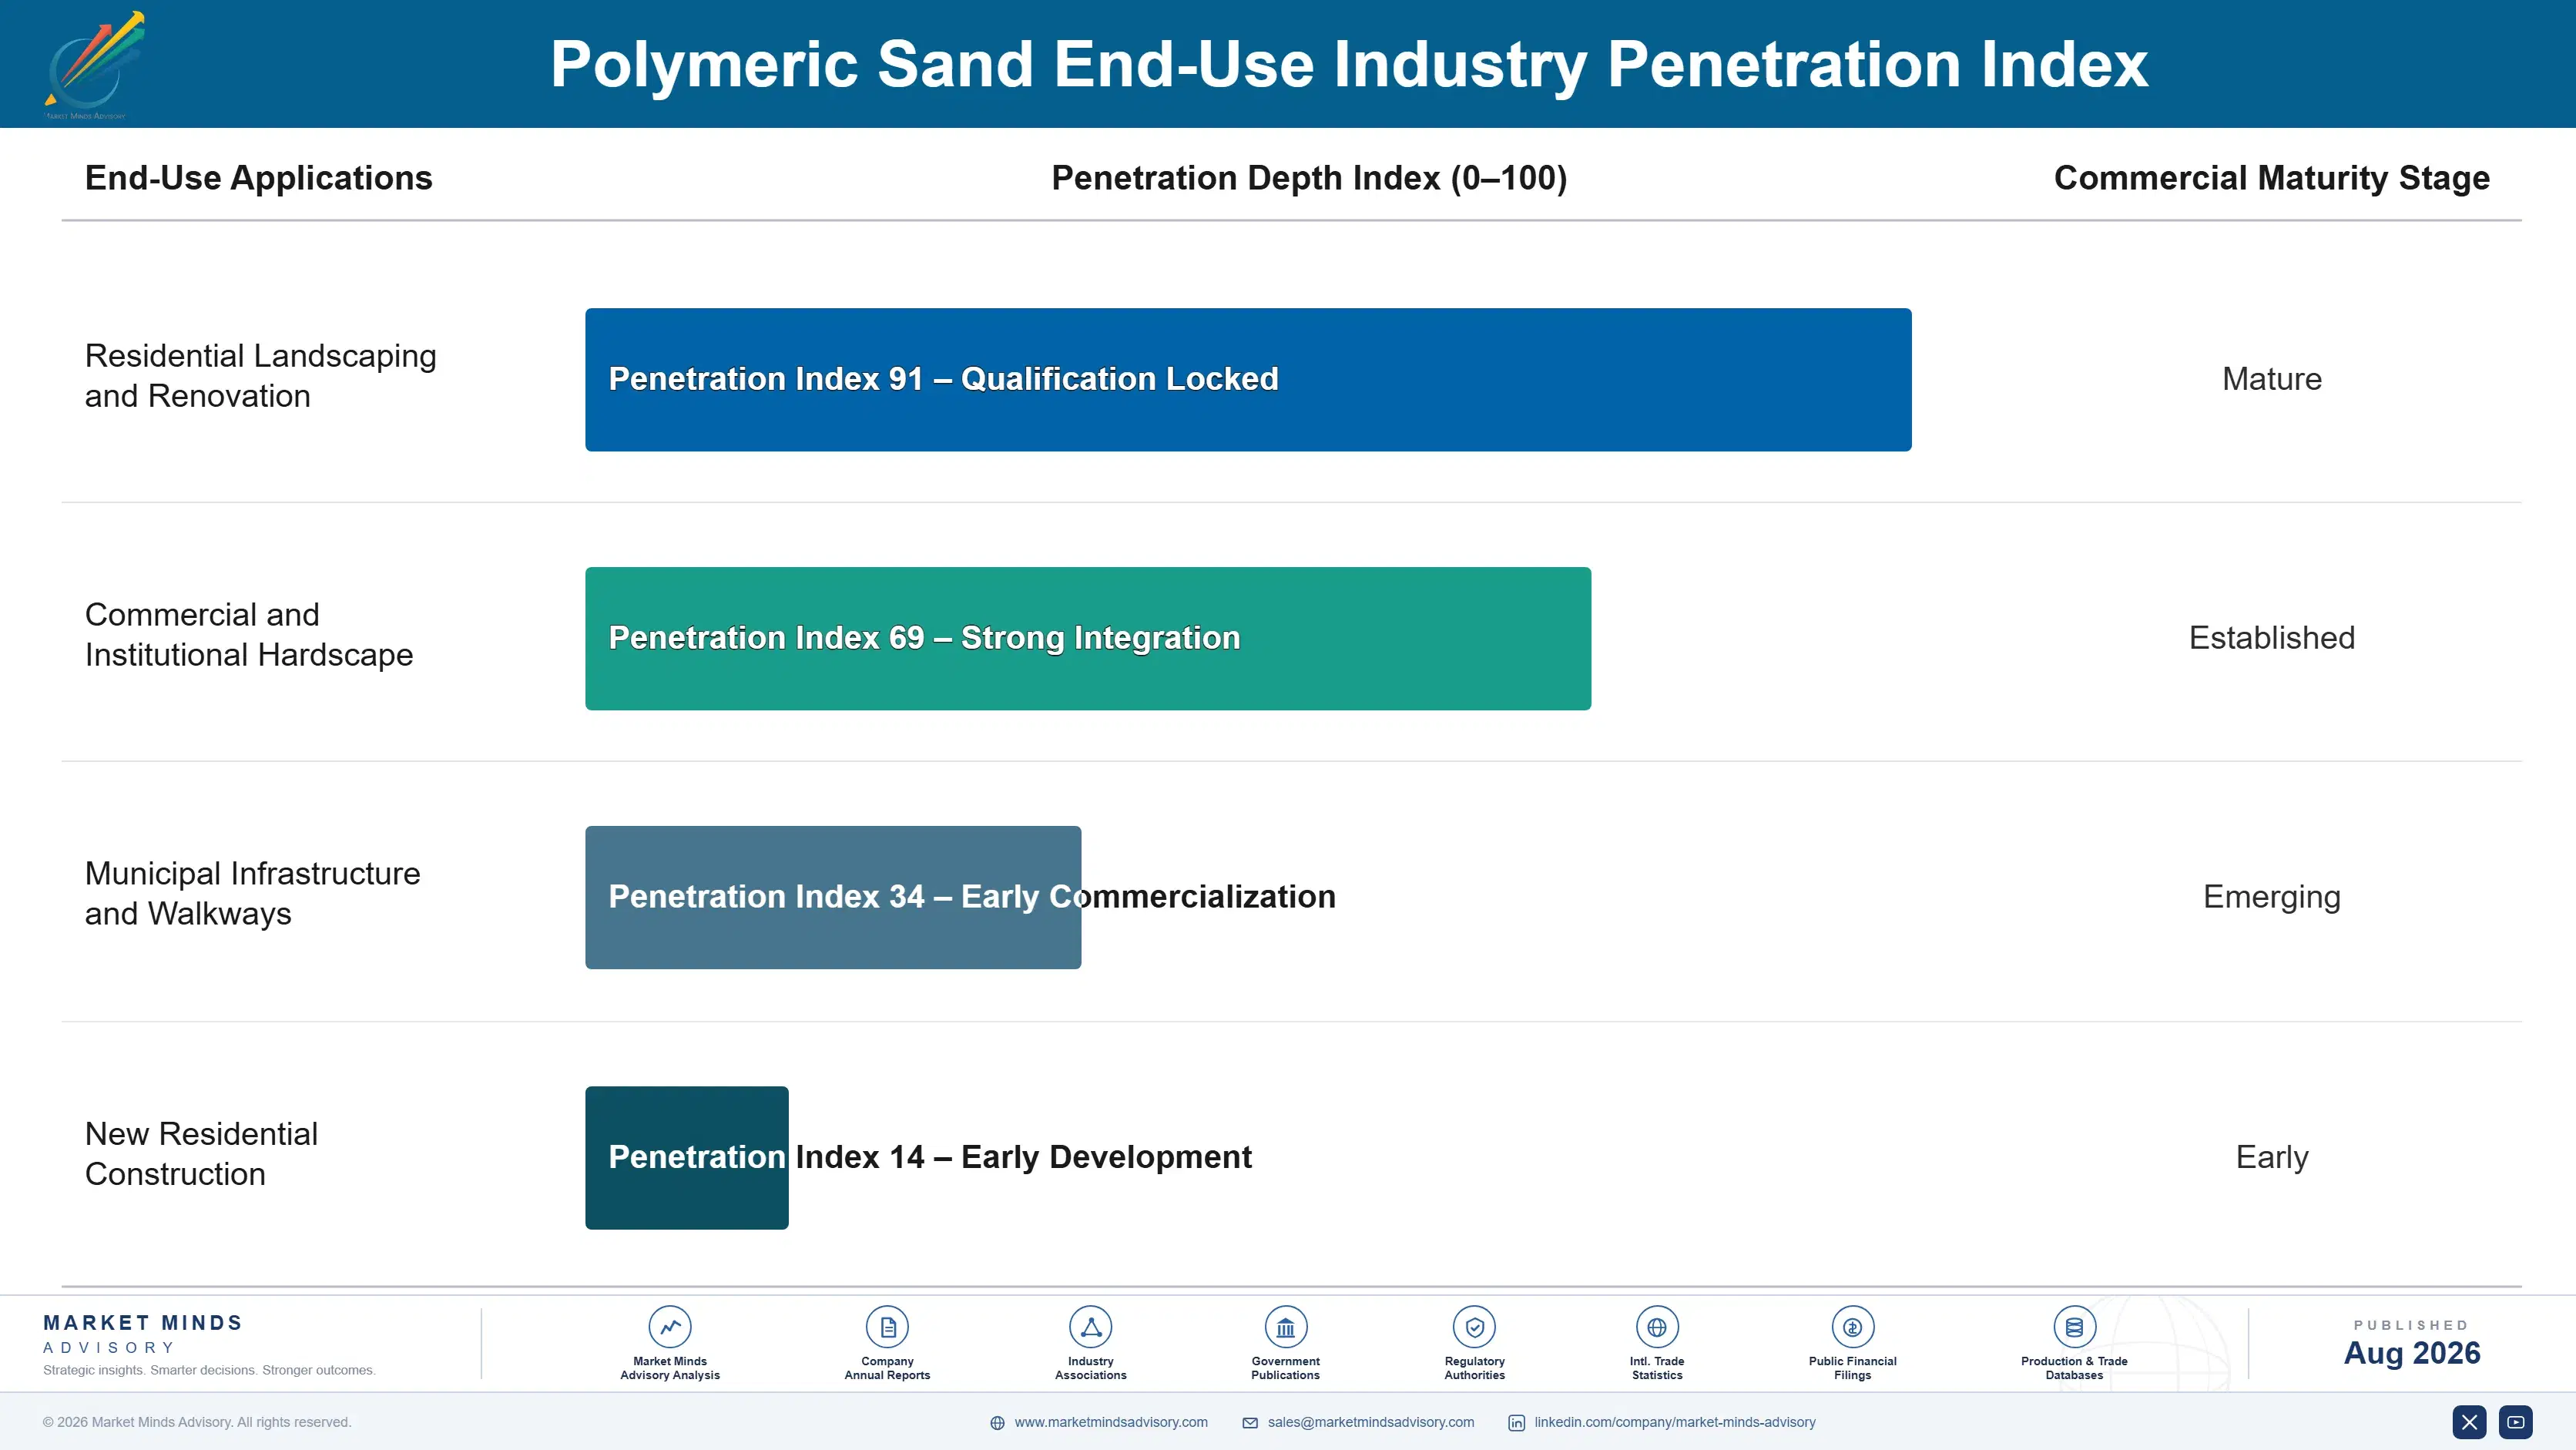
Polymeric sand purchasing behaves more like a recurring renovation-linked event than a one-time purchase, since paver installations periodically require joint sand refreshing as the original material erodes or degrades over five to ten years, creating a recurring replacement cycle layered atop new installation demand. That renovation-driven pattern creates seasonal demand surges concentrated in spring and summer months across most North American markets, even as any single homeowner rarely purch
Adoption depth varies sharply by end-use vertical. Residential homeowners and landscape contractors show growing interest in permeable and storm-resistant formulations as differentiated options, while commercial and municipal buyers prioritize proven durability and specification compliance over aesthetic features, since institutional procurement timelines often constrain product selection more than contractor preference alone.

A generational shift is underway as younger homeowners increasingly research formulation performance and stormwater compliance online before contractors arrive, rather than deferring entirely to contractor product recommendations as previous generations typically did. That shift is giving producers with strong direct consumer brand recognition, like Techniseal and Alliance, an advantage over smaller regional producers that historically competed purely on contractor relationships.
polymeric-sand-market-end-use-penetration-index-1787302903002

Where Polymeric Sand Producers Should Focus

These are among the four positions where our research anticipates prominent divergence between winners and laggards over the coming forecast period. Each is grounded in the demand model, the regulatory perimeter, and the announced capacity pipeline.
01 / PERMEABLE CERTIFICATION STRATEGY

Expand municipal certification before regulatory mandates tighten further

Municipalities across major metropolitan areas are increasingly requiring or incentivizing permeable jointing systems, and producers without certified product lines are losing contractor specification to better-certified competitors as this shift accelerates. Certification testing requires meaningful upfront investment but opens a category commanding durably higher margins than standard formulations. Producers waiting until regulatory mandates tighten further will find themselves racing to catch up against incumbents who invested years earlier, a gap that widens each season certification investment lags behind competitor programs already underway.
02 / STORM-RESISTANT REFORMULATION TIMING

Invest in next-generation chemistry before contractor trust further erodes

Contractors who experienced early-generation formulation failures have not universally returned to the category, leaving a genuine opportunity for producers willing to fund reformulation testing ahead of confirmed contractor confidence recovery. Waiting for trust to rebuild organically risks losing these contractors permanently to traditional unbound sand alternatives. The capital required is meaningful but positions early movers to capture a category still recovering from its own early formulation reputation problems, a window that will not stay open indefinitely once contractor habits fully solidify.
03 / RETAIL DISTRIBUTION EXPANSION STRATEGY

Prioritize big-box shelf placement ahead of the next renovation season

Producers with prominent retail shelf placement capture impulse purchase volume and premium pricing that specialty distributor-only competitors cannot access, an advantage that compounds with every renovation season. Producers relying primarily on landscape supply yard distribution remain persistently exposed to lower volume and weaker consumer brand recognition. Building these retail relationships now, ahead of peak spring renovation demand, protects long-term category position against competitors already expanding shelf presence, a pattern likely to repeat with each subsequent renovation season nationwide across every major regional retail market.
04 / NORTH AMERICAN CONCENTRATION RISK

Diversify cautiously into Australia and adjacent growth markets

Polymeric sand remains almost exclusively a North American product, and producers depending entirely on that single region carry meaningful concentration risk if a sustained housing or renovation slowdown were to hit simultaneously across the United States and Canada. Australia's growing adoption of paver hardscaping and polymeric jointing sand offers a genuine, if still small, diversification opportunity worth early investment. Producers that establish early distribution relationships in emerging adjacent markets gain a meaningful head start over competitors still entirely dependent on North American demand cycles.

Engagement Snapshot From the Field

A live engagement with an industry participant carrying material or product regulatory and market exposure ahead of a defining policy shift, showing how our research translates into a defensible multi-year portfolio strategy.
MARKET MINDS ADVISORY · CLIENT ENGAGEMENT SUMMARY
Polymeric Sand Producer Strategic Portfolio Review and Transition Roadmap 2026·Investment Scenario on Polymeric Sand Exposure Evaluation 2025-26
CLIENT PROFILE
The client is a regional polymeric sand manufacturer serving the northeastern United States, with annual revenue in the low tens of millions of dollars (client-reported, unverified by MMA). The client faced growing pressure from national competitors capturing retail shelf space faster through superior distribution relationships and broader formulation portfolios. The client sought an independent assessment before committing significant new capital.
STRATEGIC CHALLENGE
The client needed to decide how much capital to invest in expanding retail distribution and permeable formulation certification, given uncertainty over whether regional stormwater regulation would tighten as quickly as national trends suggested, while balancing capital constraints typical of a regional manufacturer competing against larger national producers, while managing seasonal cash flow limitations common among mid-sized regional producers.
MMA APPROACH
MMA benchmarked the client's certification portfolio and retail distribution reach against three national competitors and modeled two regulatory adoption scenarios against the client's existing and planned production capacity, incorporating primary interview data from contractors and retailers on formulation preference and purchasing behavior. The analysis also benchmarked retail shelf placement economics across three competing regional producers pursuing similar expansion strategies.
KEY FINDINGS
  1. The client's limited permeable certification portfolio left it unable to capture a meaningful share of the regulatory-driven demand shift accelerating across its core northeastern state markets.
  2. Competitors with prominent big-box retail shelf placement were winning impulse purchase volume even when the client's base pricing was more competitive at landscape supply yards.
  3. Storm-resistant reformulation required capital the client could reasonably justify only if paired with confirmed retail distribution commitments rather than speculative market entry.
  4. Polymer resin price exposure at the client's facility posed a greater near-term margin risk than any distribution or certification gap the client had originally prioritized in planning.
CLIENT PROFILE
The client is a regional polymeric sand manufacturer serving the northeastern United States, with annual revenue in the low tens of millions of dollars (client-reported, unverified by MMA). The client faced growing pressure from national competitors capturing retail shelf space faster through superior distribution relationships and broader formulation portfolios. The client sought an independent assessment before committing significant new capital.
STRATEGIC CHALLENGE
The client needed to decide how much capital to invest in expanding retail distribution and permeable formulation certification, given uncertainty over whether regional stormwater regulation would tighten as quickly as national trends suggested, while balancing capital constraints typical of a regional manufacturer competing against larger national producers, while managing seasonal cash flow limitations common among mid-sized regional producers.
MMA APPROACH
MMA benchmarked the client's certification portfolio and retail distribution reach against three national competitors and modeled two regulatory adoption scenarios against the client's existing and planned production capacity, incorporating primary interview data from contractors and retailers on formulation preference and purchasing behavior. The analysis also benchmarked retail shelf placement economics across three competing regional producers pursuing similar expansion strategies.
KEY FINDINGS
  1. The client's limited permeable certification portfolio left it unable to capture a meaningful share of the regulatory-driven demand shift accelerating across its core northeastern state markets.
  2. Competitors with prominent big-box retail shelf placement were winning impulse purchase volume even when the client's base pricing was more competitive at landscape supply yards.
  3. Storm-resistant reformulation required capital the client could reasonably justify only if paired with confirmed retail distribution commitments rather than speculative market entry.
  4. Polymer resin price exposure at the client's facility posed a greater near-term margin risk than any distribution or certification gap the client had originally prioritized in planning.
RECOMMENDED STRATEGY
Phase 1: Phase 1 (Months 1 to 4): Complete permeable formulation certification testing and secure long-term polymer resin supply agreements and document results. Phase 2: Phase 2 (Months 5 to 10): Expand retail distribution partnerships to improve shelf placement and seasonal restocking reliability and validate performance. Phase 3: Phase 3 (Months 11 to 15): Launch reformulated storm-resistant product line supported by expanded contractor education programming across all target markets.
OUTCOME
Within fifteen months of implementation, the client completed permeable certification and expanded its retail distribution footprint across two additional northeastern states. Client-reported seasonal sell-through rates improved by an estimated 17% over the following year across its newly expanded distribution footprint, though this figure is client-reported and unverified by MMA.

Frequently Asked Questions

Foundational context covering the market sizes, CAGR, scope, country, region and competition that inform every finding below. This section is provided to cover basics and most often pre-purchase conversations, answered from the MMA Primary Research Dataset.

What is the current size of the Polymeric Sand Market?

The global polymeric sand market reached an estimated $0.62 billion in 2025. Residential patio and driveway jointing sand accounts for the largest share of that volume.

How large will the Polymeric Sand Market be by 2036?

MMA forecasts the market will reach approximately $1.23 billion by 2036. That represents a 1.86x expansion over the 2026 base value across the ten-year forecast period.

What is the CAGR for the Polymeric Sand Market 2026 to 2036?

The base case forecast CAGR is 6.4%, with a bull case of 7.5% and a bear case of 5.2% depending on renovation spending and stormwater regulation adoption pace.

Which segment is growing fastest?

Permeable and Eco-Friendly Polymeric Sand is growing fastest at a 9.8% CAGR, roughly 1.53 times the overall market rate, as municipalities tighten stormwater runoff regulations.

Who are the major companies in the Polymeric Sand Market?

Techniseal, Alliance Designer Products, Quikrete Companies, SRW Products, and Unilock lead the market. Together the top five hold an estimated 58% of global shipment volume.

Which country is growing fastest?

Australia leads growth as homeowners increasingly adopt polymeric sand over traditional jointing methods, growing at an estimated 8.2% CAGR through 2036 from a still-small base.

Report Segmentation Architecture

The full report scope spans multiple orthogonal segmentation dimensions, with cross-tabulated demand data provided for each dimension pair. Coverage extends further to regional breakdowns, trend trajectories, and the competitive detail needed to support segment-level decision-making.

By Application and Joint Type

  • Residential Patio and Driveway Jointing Sand
  • Commercial Hardscape and Walkway Jointing Sand
  • Permeable and Eco-Friendly Polymeric Sand
  • Natural Stone Jointing Sand
  • Fine-Grade Narrow Joint Polymeric Sand
  • Wide-Joint Polymeric Sand

By End-Use Industry

  • Residential Landscaping and Renovation
  • Commercial and Institutional Hardscape
  • Municipal Infrastructure and Walkways
  • New Residential Construction

By Commercial Dimension

  • Big-Box Retail Distribution
  • Landscape Supply Yard Distribution
  • Contractor Direct Purchasing
  • Municipal and Institutional Procurement

By Region

  • North America
  • Western Europe
  • East Asia
  • South Asia and Pacific
  • Latin America
  • Middle East and Africa
  • Eastern Europe

Scope, Methodology, and Coverage

Every figure in this report is reproducible from documented input assumptions. The scope below maps the historical period, the forecast horizon, the segmentation dimensions, and the countries covered, alongside the underlying primary and qualitative methodology.
Historical Period
2020 to 2025
Forecast Period
2026 to 2036
Base Year
2025 (USD billions; MMA Primary Research Dataset, August 2026)
Market Definition
This report covers sand and polymer binder blends sold as jointing material for concrete pavers, natural stone, and patio block installations, including standard, permeable, and natural stone formulations. It excludes the pavers and stone units themselves, base aggregate materials, and traditional unbound jointing sand without polymer binder.
Quantitative Units
USD billions (current prices); metric tonnes and retail bag units shipped where disclosed
Segmentation Dimensions
By Application and Joint Type; By End-Use Industry; By Commercial Dimension; By Region
Regions Covered
North America, Western Europe, East Asia, South Asia and Pacific, Latin America, Middle East and Africa, Eastern Europe
Countries Covered
USA, China, Germany, France, UK, Japan, South Korea, India, Australia, Canada, Brazil, Mexico, Indonesia, Vietnam, Thailand, Malaysia, UAE, Saudi Arabia, South Africa, Nigeria, Turkey, Poland, Netherlands, Italy, Spain, Sweden, Switzerland, Argentina, Colombia, New Zealand, and additional markets relevant to this sector
Key Companies Profiled
Techniseal Inc., Alliance Designer Products Inc., Quikrete Companies Inc., SRW Products Inc., Unilock Ltd., Oldcastle APG Inc., Envirosand Inc., DOMINATOR Polymeric Sand Inc., G2 Polymeric Sand LLC, ProKoat Inc., Romeo's Hardscape Supply LLC, Levelast Corporation, Spec Mix Inc., Bonsal American Inc., Basalite Concrete Products LLC, Rinox Inc., Permacon Group Inc., Sika Corporation, Hanover Architectural Products, Belgard
Quantitative Methodology
Primary survey, n=3,800 respondents, Q4 2025, six countries; demand-side model with trade association cross-validation
Qualitative Methodology
47 expert interviews, Q4 2025; applied to validate demand model assumptions, identify emerging dynamics, and assess competitive positioning
Report Format
PDF and XLSX data workbook (Word format preview document)
Publisher
Market Minds Advisory
Report Code
MMA-2026-CON-149
Published
August 2026
Contact
sales@marketmindsadvisory.com | www.marketmindsadvisory.com

Purchase the full Polymeric Sand Market Report (2026 to 2036).

The full report delivers an assessment of the global polymeric sand market across all six application and joint type segments and seven world regions through 2036. It includes competitive profiling of twenty active producers, primary survey data from contractors and retailers, and a dedicated deep-dive on stormwater regulation adoption. Buyers receive access to underlying segment and regional data tables alongside the full narrative analysis, supporting both capacity planning and retail distribution strategy decisions. The report also benchmarks revenue lever adoption and input cost exposure across the top twenty profiled companies, drawing on MMA's primary survey of 3,800 respondents and 47 expert interviews conducted in Q4 2025.
Twenty-company competitive profiling and margin benchmarking
Six-segment application type forecast data and tables
Seven-region demand and CAGR breakdown data
Stormwater regulation adoption deep-dive overview analysis
Polymer resin supply chain risk assessment
Primary interview data from contractors and retailers

Built For The People Who Decide

From boardroom strategy to bench-side execution, this report is read cover-to-cover by leaders shaping the next decade of their industry, turning demand scenarios, market dynamics and valuation benchmarks into decisions.
CXOs/ Presidents/ VPs/ Managers
M&A and Corporate Development
Strategy Teams and R&D Heads
Procurement and Product Directors
Regulatory and Compliance Leaders
Investor Relations and Equity Analysts