Market Minds Advisory
Polymer Concrete Market

Polymer Concrete Market: Certified Performance Testing Redefines Infrastructure Specification

Polymer concrete demand is shifting from generic precast drainage covers toward certified corrosion-resistant and load-rated formulations for water infrastructure and industrial flooring, forcing manufacturers to compete on documented performance testing rather than unit price alone.

Lead Analyst

Bilal Shaikh

Published

September 2026

Make Smarter Decisions with Customized Research Insights

Request a free sample report and evaluate market opportunities, growth trends, and competitive dynamics relevant to your business needs.

2025 MARKET VALUE$1.3BMarket Size 2025
2036 FORECAST VALUE$2.9BBase Case , 2026 to 2036
CAGR 2026 TO 20367.6 %Bull 8.8% / Bear 6.4%
INCREMENTAL OPPORTUNITY$1.5BNet 10- year value creation
EXPANSION MULTIPLE2.07x2036 value over 2026 base
Strategic Levers
M&A Pipeline
Regional Outlook
Country Rankings
Competitive Intelligence
Segmental Deep-dive
Call-Us : 91 93563 13602

Executive Snapshot and Market Trajectory

Infrastructure engineers no longer buy polymer concrete products on catalog price alone. Water utilities and industrial facility operators now specify certified load-rated and corrosion-resistant formulations before approving a supplier, pushing manufacturers to compete on documented performance testing rather than unit cost alone across every major infrastructure replacement project nationwide.
Growth right now is concentrated in corrosion-resistant pipe and conduit systems, as water and wastewater utilities replace aging infrastructure with chemically resistant polymer concrete formulations ahead of conventional concrete alternatives. East Asia now holds the largest share of global demand, anchored by the sheer scale of China's infrastructure construction and manufacturing base, while South Asia and Pacific grows fastest as India's expanding water infrastructure and industrial facility construction both scale simultaneously across major manufacturing corridors.
Precast manufacturers are consolidating regional production through targeted capacity additions rather than large mergers, as established players add certified testing capability ahead of competitors still relying on standard commodity-grade output. Competitive pressure is intensifying as Asian manufacturers undercut established Western suppliers on price for standard drainage products, while tightening water infrastructure corrosion resistance regulation pushes smaller manufacturers to invest in certified performance testing infrastructure they previously avoided, forcing product reformulation.
Market Definition
The polymer concrete market covers resin-bound aggregate composite products including precast manhole covers, drainage channels, industrial machine bases, structural panels, pipe systems, and repair mortars engineered for corrosion resistance and load-bearing performance. It excludes conventional Portland cement concrete, fiber-reinforced plastic composites sold independently of aggregate binding, and asphalt-based paving products.
Base Year Value
$1.3B in 2025 (MMA Primary Research Dataset, August 2026)
Forecast Period
2026 to 2036, eleven discrete annual values
CAGR
7.6% base case. Bull 8.8%. Bear 6.4%.
Fastest Growth Segment
Corrosion-Resistant Pipe and Conduit Systems: 10.4% CAGR
Fastest Growth Country
India: 11.8% CAGR
Fastest Growth Region
South Asia and Pacific: 9.7% CAGR
Largest Region
East Asia: 28% of 2025 global value
Market Leaders
ACO Group, Hauraton GmbH & Co. KG, Sika AG, Fibrelite Composites Ltd, Christy Concrete Products. Source: MMA Analysis based on company annual reports.
Primary Survey
n=3,800 procurement and R&D decision-makers, Q4 2025, six countries
Methodology
Demand-side build-up, cross-validated against public data, 47 expert interviews

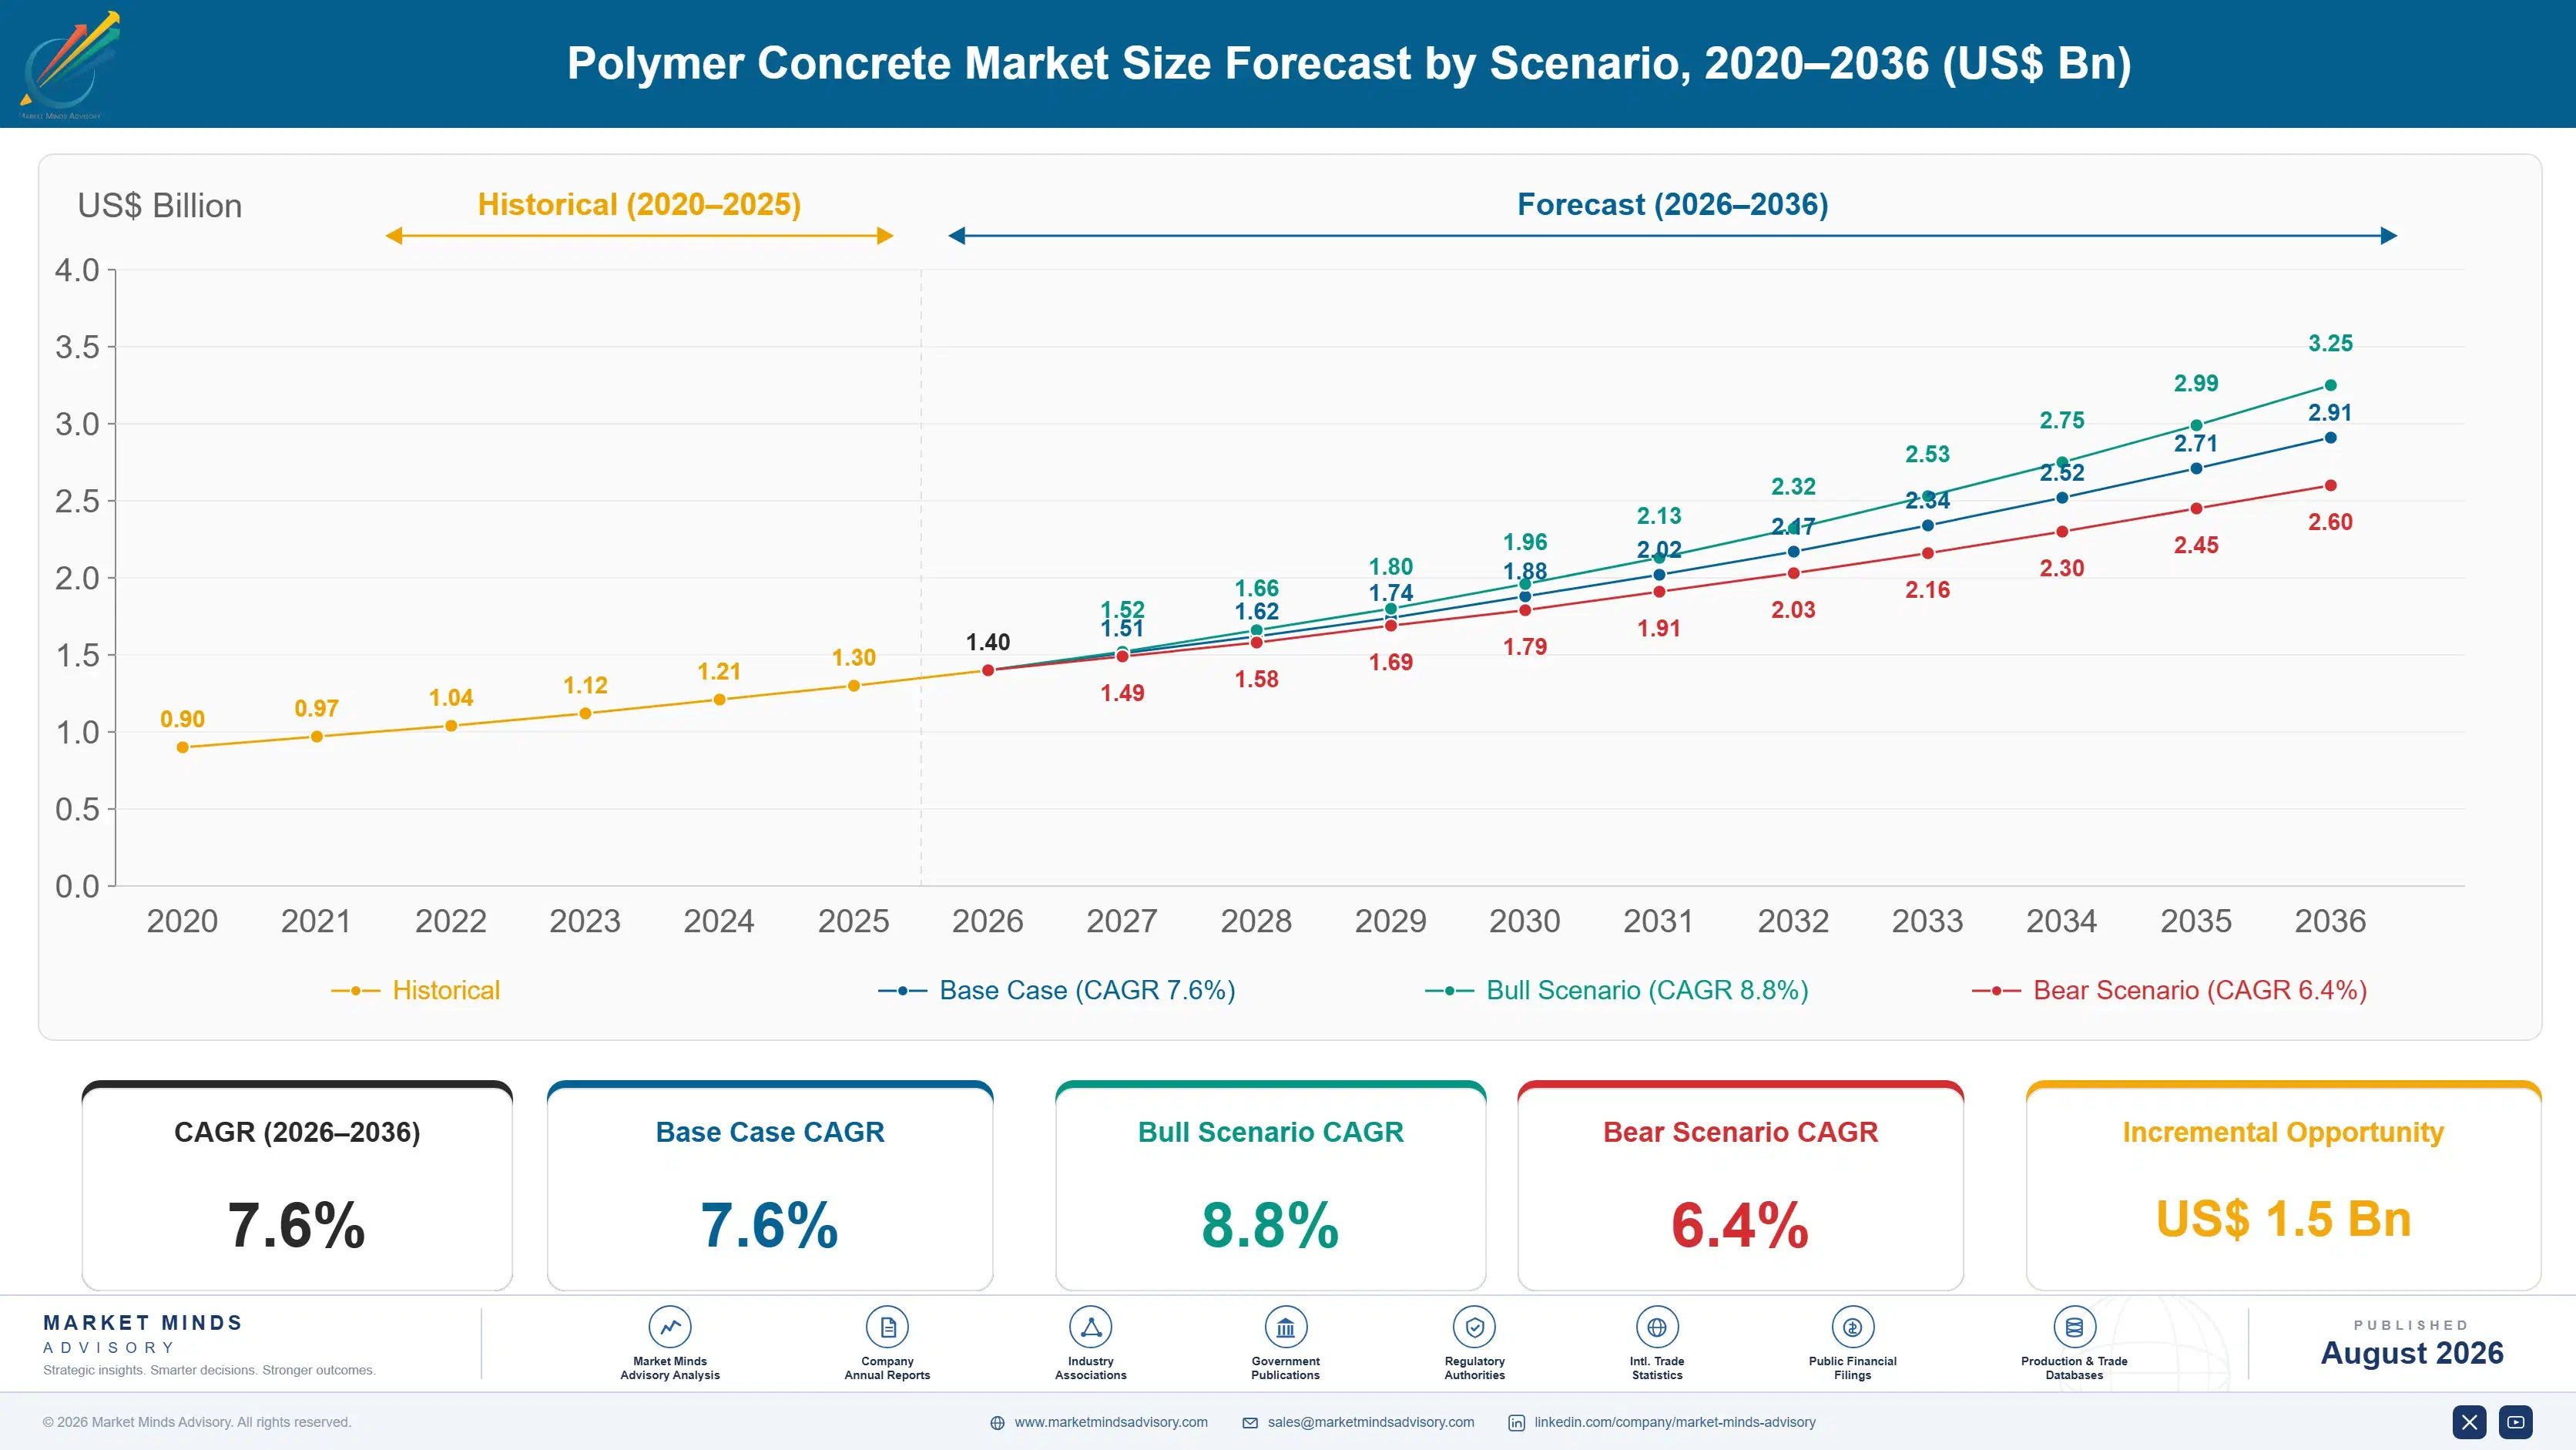
Polymer Concrete Market Forecast Scenarios

polymer-concrete-market-size-forecast-scenario-1787302582957
Between 2020 and 2025 the market grew at roughly 6.9% a year, recovering from pandemic-era construction delays before accelerating as water infrastructure and industrial facility investment resumed deferred capacity expansion. Stricter corrosion resistance and load-rating regulation introduced during the period pushed manufacturers toward certified performance-tested product lines, pulling compliant producers ahead of competitors still selling standard uncertified formulations facing tightening specification requirements.
The base case carries the market to 2.9 billion dollars by 2036 on three mechanisms. First, water infrastructure replacement is converting standard concrete specifications into certified corrosion-resistant polymer formulations across most municipal and industrial contracts. Second, East Asian manufacturing capacity is scaling faster than the traditional Western production base that historically anchored global polymer concrete supply. Third, industrial facility construction growth in South Asia and Pacific is creating polymer concrete demand that did not previously exist at meaningful scale.
The bull case reaches roughly 8.8% annual growth if water infrastructure investment accelerates faster than currently funded and industrial construction expands ahead of plan. The bear case falls near 6.4% if municipal capital budgets tighten and manufacturers defer certification upgrades to manage costs during periods of weaker infrastructure spending nationwide across major metropolitan water systems.

Where Certified Performance Testing Redefines Polymer Concrete Specification

Polymer concrete products used to be a commodity purchase decided mostly on catalog price and delivery time; now infrastructure engineers specify formulations against documented load-rating and corrosion-resistance testing before approving a supplier for large-scale municipal or industrial contracts. Every batch must demonstrate a measurable performance outcome an engineer can certify against structural and chemical exposure requirements. That documented performance, not catalog price alone, inc
MARKET CONCENTRATION (CR5)24%Top five manufacturers hold under a quarter of volume
AVERAGE SELLING PRICEUSD 2,400 per metric tonBlended price across drainage, structural, and repair formulations
TOP PRODUCING COUNTRY SHAREChina, 24% of global outputLargest single national source of polymer concrete manufacturing
LOAD-RATING CERTIFICATION RATE41% of SKUs certifiedShare of products carrying recognized load-bearing performance credentials
TRADE INTENSITY17% cross-borderAbout a sixth of product volume crosses a border
PRODUCT SERVICE LIFE25 to 40 yearsTypical operating lifespan before operators replace installed products
Commercially the market behaves like a specialty materials business wearing a construction products label. Aggregate and resin cost is a modest share of unit price; the certification testing and formulation engineering required to substantiate a performance claim drives most of the value premium manufacturers actually capture. Utilities rarely switch product suppliers once a manufacturer clears their approved-vendor qualification review, since switching means restarting a lengthy requalification process against an unproven alternative supplier.
The next decade turns on three forces: water infrastructure replacement converting standard specifications into certified corrosion-resistant categories, East Asian manufacturing scaling ahead of Western supply, and industrial construction growth in South Asia creating demand that did not previously exist. Manufacturers positioned across all three will set the pace industry-wide, while single-lever commodity specialists fall behind.
"A drainage channel that cracks under load isn't a warranty claim, it's a road closure. That's why engineers want the load-rating certificate, not just the catalog spec sheet."
Director, Construction Materials and Infrastructure Products Practice · MMA Cons

Market Trends

Certified Load-Rated Formulations Gain Broad Specification

Polymer concrete formulations engineered to document validated load-bearing capacity and consistent chemical resistance have moved from specialized industrial pilot programs into standard procurement specifications across municipal drainage, water treatment, and industrial flooring categories. Infrastructure engineers now request documented load-rating certificates and traceable batch records before qualifying a new supplier, converting what was once a differentiating premium feature into a baseline procurement requirement undifferentiated commodity manufacturers can no longer avoid. That specification shift has compressed the timeline manufacturers have to build accredited testing capability before losing contract renewal opportunities to better-prepared competitors already holding recognized certifications.
Market Impact: Adds demand from 2,800 new faciliti
East Asian Manufacturing Scale Reshapes Demand

China's infrastructure construction and manufacturing base has scaled polymer concrete demand far faster than Western markets over the past five years, converting the region into the world's largest single source of both consumption and manufacturing capacity as infrastructure construction continues at unprecedented scale. That demand growth has let regional manufacturers win multi-year municipal supply contracts directly from water utilities and industrial facility operators that previously sourced exclusively from established Western manufacturers. Western manufacturers are responding by expanding regional production and investing more heavily in certified testing technology that Asian competitors cannot yet replicate at comparable manufacturing cost.
Market Impact: Adds 3,900 facilities to compliance

Market Opportunities and Growth Drivers

Water Infrastructure Growth Expands Product Demand

New water and wastewater infrastructure construction across South Asia, East Asia, and Latin America is creating polymer concrete demand that did not previously exist at meaningful commercial scale, since each new treatment facility and pipeline network requires a complete initial product inventory spanning drainage, pipe, and containment categories before service can begin. That construction-driven demand behaves differently from replacement demand in mature facilities, since new utilities specify product technology fresh rather than working around existing supplier relationships built over years. Manufacturers with established regional distribution are capturing that new-facility demand directly from global suppliers still building equivalent regional infrastructure.
Market Impact: Cuts manufacturer margins by 6 poin

Corrosion Resistance Regulation Raises Performance Standards

Updated water infrastructure corrosion resistance guidance from national and municipal engineering regulators has raised the certified chemical-resistance and load-rating threshold water and wastewater operators must demonstrate before regulators will approve continued installation permits across most jurisdictions. That regulatory tightening has pulled a much broader share of infrastructure capital budgets toward certified polymer concrete products, since engineering auditors increasingly flag uncertified standard concrete alternatives as a compliance risk during routine facility inspections. Manufacturers with established certification testing infrastructure are capturing that expanding compliance-driven budget directly from suppliers still relying on legacy uncertified specifications that predate current performance requirements.
Market Impact: Delays project delivery by 7 weeks

Market Restraints and Challenges

Resin Cost Volatility Pressures Manufacturer Margins

Epoxy and polyester resin inputs, the base binders for most polymer concrete formulations, have experienced sharp price swings tied to petrochemical commodity markets, and that volatility has squeezed manufacturer margins that municipal supply contracts typically fix for multi-year terms without adjustment clauses. The root cause is that most municipal supply contracts were negotiated before volatility became a persistent feature of resin markets, leaving manufacturers exposed to cost increases they cannot pass through until renewal. Some manufacturers are responding by negotiating shorter contract terms with price adjustment clauses tied to published indices.
Market Impact: Cuts field failure rate by 26%

Precast Curing Capacity Limits Production Flexibility

Certified precast curing and testing capacity remains limited relative to the pace of rising infrastructure demand, and manufacturers serving multiple simultaneous municipal contracts face real capacity constraints whenever several large infrastructure projects require certified product supply within the same construction window. The root cause is that curing and testing infrastructure investment has not scaled as fast as downstream demand, so manufacturers compete directly for a limited pool of certified production capacity across most manufacturing regions. That capacity constraint creates real allocation risk for developers working against fixed construction schedules. Some manufacturers are responding by investing in additional curing capacity.
Market Impact: Shifts 15% of demand to Asia
3 additional market trends, 4 additional growth drivers, and 3 additional restraints and challenges are covered in the full report. Contact sales@marketmindsadvisory.com to access the complete intelligence.

Segment CAGR and Growth Architecture

Segmentation follows product application, a single functional-logic that groups polymer concrete demand by the structural or infrastructure role a finished product serves rather than by which industry vertical eventually purchases it. Each application category carries its own load-rating specification, certification pathway, and pricing structure, so commercial position tracks the product application rather than the buyer industry.
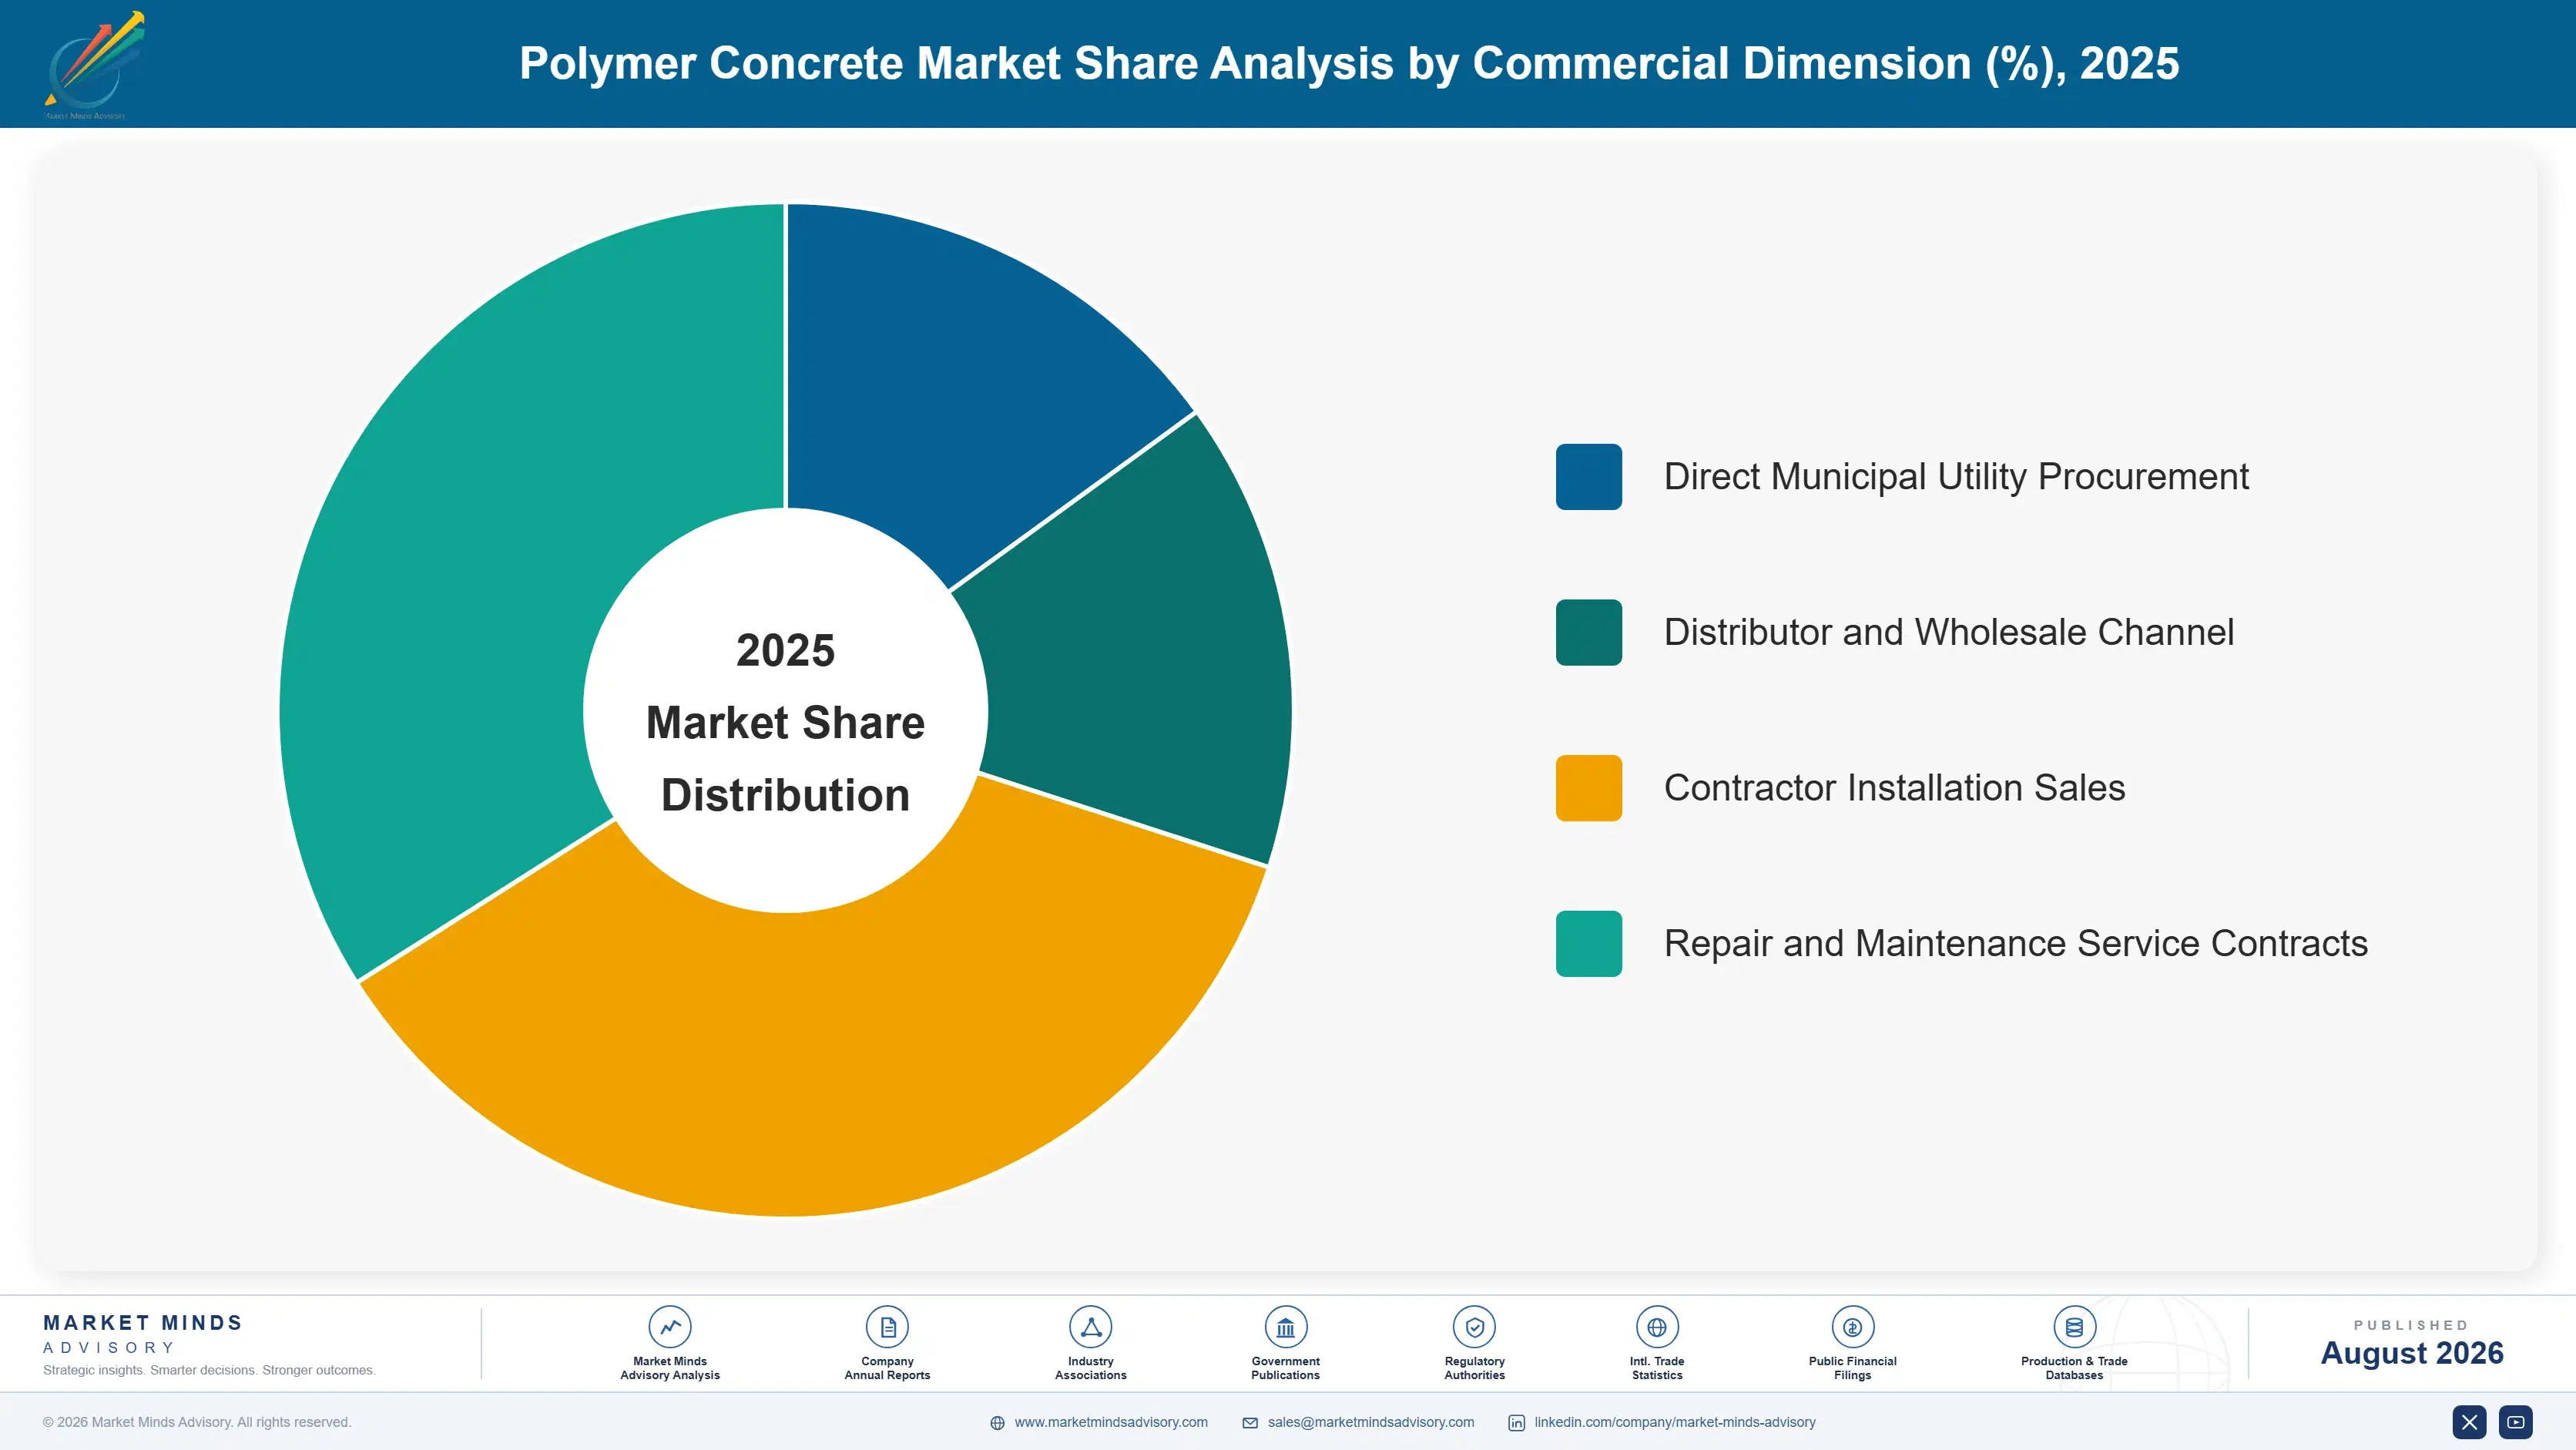
polymer-concrete-market-market-share-analysis-1787302583489

Corrosion-Resistant Pipe and Conduit Systems

Corrosion-resistant pipe and conduit systems grow fastest at 10.4%, about 1.37 times the overall market rate, as water and wastewater utilities replace aging infrastructure with chemically resistant polymer concrete formulations ahead of conventional concrete alternatives. Municipal water utilities and industrial chemical processors dominate current volume, valued for certified chemical-resistance and load-rating documentation that engineers and regulators increasingly require before approving a system for installation. The segment commands premium pricing relative to standard concrete pipe, reflecting both the specialized resin investment involved and the certification testing manufacturers have made to support specific corrosion-resistance claims. Manufacturers with early certification investment are winning premium contracts directly from suppliers still relying on standard concrete alternatives that engineers increasingly reject.
CAGR 10.4%

Industrial Machine Bases and Foundations

Industrial machine bases and foundations grow second-fastest at 8.9%, driven by precision manufacturing facility expansion that requires vibration-damping and dimensional-stability performance exceeding what standard concrete foundations can reliably provide across most production environments. The technology uses fine-aggregate resin composite formulations engineered for vibration absorption and thermal stability compared with conventional concrete bases that provide comparatively lower precision performance and added maintenance cost. Growth concentrates specifically among precision machining, semiconductor, and automation equipment applications, where dimensional tolerance requirements and expanding automation investment increasingly favor polymer concrete bases over standard alternatives previously deemed acceptable. Manufacturers with validated vibration-damping certification are winning specification directly from suppliers whose offerings lack comparable certified performance history across major manufacturing facility programs nationwide.
CAGR 8.9%
Full segment breakdown across 6 segments available in the complete report.

Regional Architecture and Country Demand Map

Demand concentrates where infrastructure construction scale and industrial manufacturing base intersect, which increasingly means East Asia rather than the historically dominant North American base. China's sheer infrastructure construction scale is pulling deployment east even as North America retains meaningful specialty-grade production serving domestic utilities directly.

North America

North America holds 25% of global value, retaining meaningful specialty-grade production capacity serving domestic water utilities and industrial facility operators directly. ACO Group and Christy Concrete Products both maintain established manufacturing and distribution operations, giving American engineers direct access to certified product supply generated specifically for local regulatory requirements. Growth of 8.2% outpaces the overall market rate as aging infrastructure replacement and expanding corrosion-resistance mandates continue pulling capital toward certified product upgrades across major metropolitan water systems. The region's established regulatory infrastructure means new formulations often gain acceptance here first before expanding into other markets worldwide, giving domestic manufacturers a genuine first-mover certification advantage over slower-moving international rivals across most categories.
Share: 25% | CAGR: 8.2% (2026 to 2036)

Western Europe

Western Europe accounts for 20% of value, a mature base shaped by some of the world's most established infrastructure durability regulatory infrastructure and utility procurement sophistication anywhere. ACO Group and Hauraton both run substantial European manufacturing and distribution operations, positioned to serve the continent's increasingly standardized procurement framework under EU infrastructure durability and drainage regulation. Regulatory scrutiny over load-rating and corrosion-resistance claims runs notably stricter here than in less-regulated markets, pushing manufacturers toward extensively documented, evidence-backed certification from the outset of any product launch. Growth of 6.1% trails the global rate directly because the region's polymer concrete market, while sophisticated, is growing more slowly than the newer infrastructure programs scaling across Asian markets.
Share: 20% | CAGR: 6.1% (2026 to 2036)
Regional intelligence for 5 additional markets available in the complete report: East Asia, South Asia and Pacific, Latin America, Middle East and Africa, Eastern Europe. Contact sales@marketmindsadvisory.com.
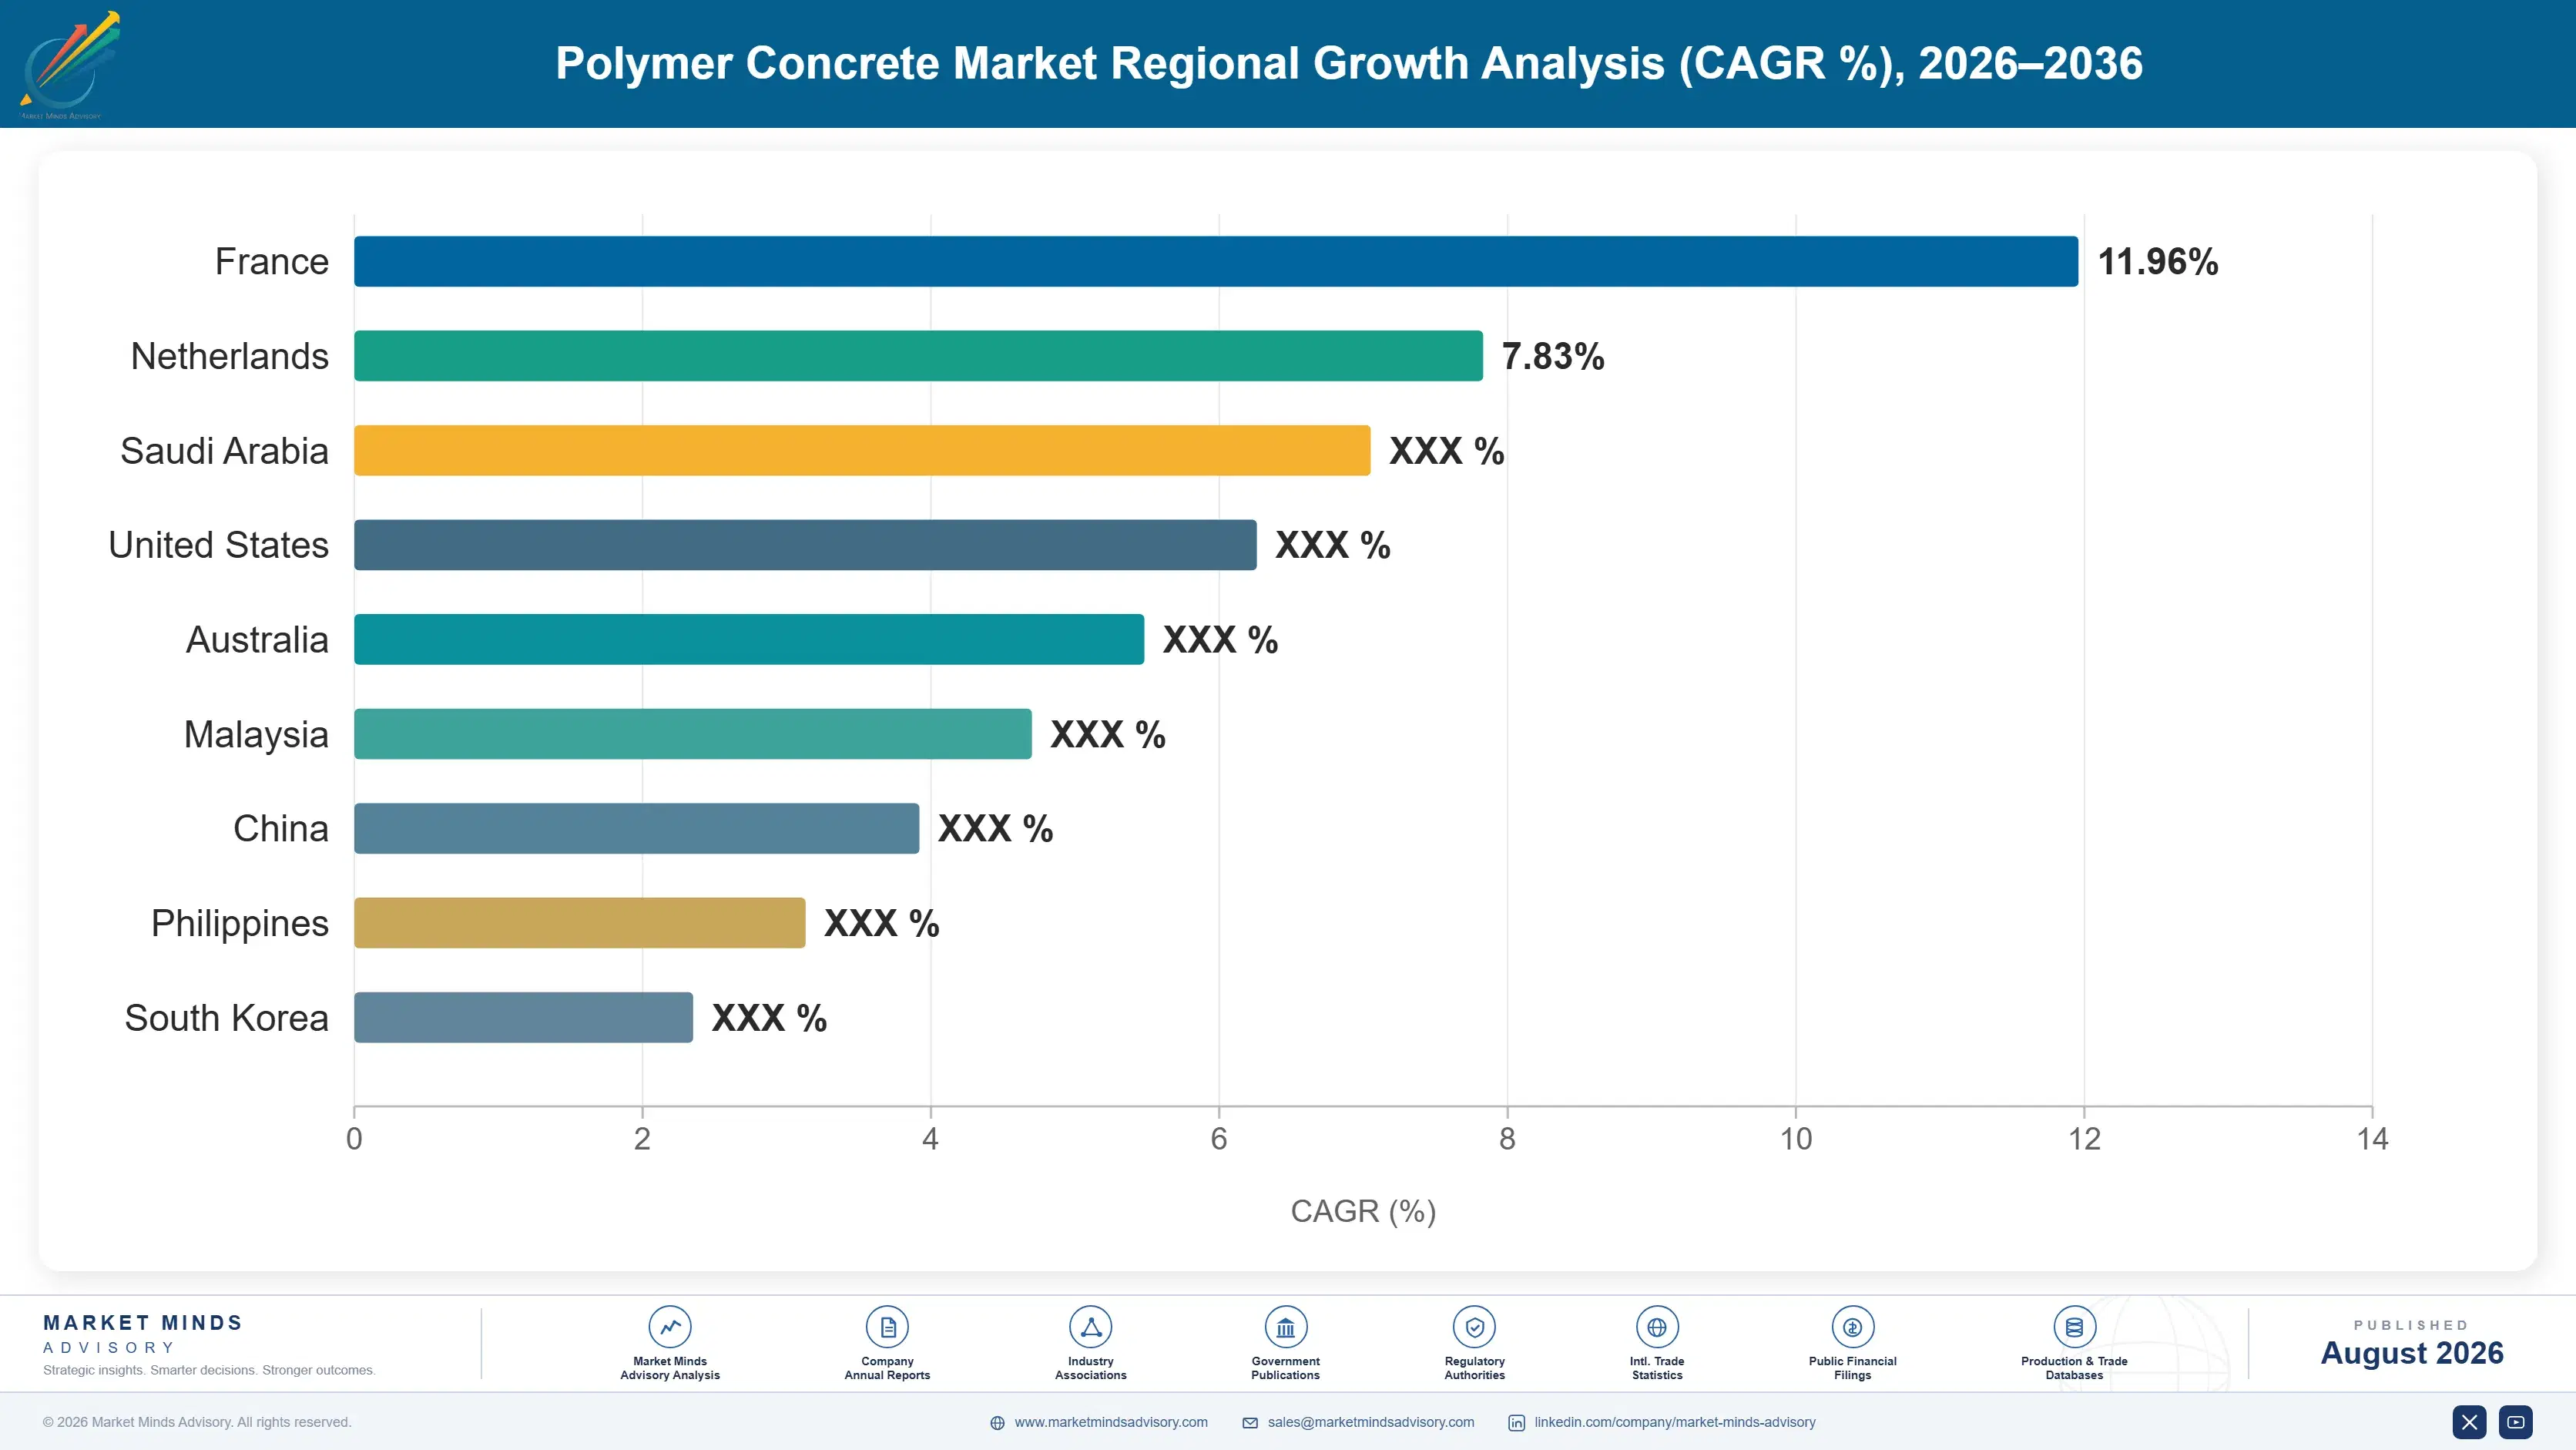
polymer-concrete-market-country-cagr-analysis-1787302583992

How Manufacturers Can Capture Certification Value

Selling polymer concrete products on catalog price alone leaves the highest-margin part of this market on the table. The four moves below shift revenue toward positions that command a premium over commodity concrete alternatives: certified load-rating documentation, regional manufacturing localization, curing capacity investment, and long-term qualified-supplier contracts that smaller competitors cannot easily replicate quickly.

Invest In Certified Load-Rating Documentation Systems

Manufacturers that invest in certified load-rating and corrosion-resistance documentation capability, rather than relying on third-party labs for every batch, capture a documented price premium of roughly 15% to 26% from infrastructure engineers that increasingly require certified performance data before qualifying a new product supplier. That testing investment costs real money and takes time to build, but it converts a generic commodity sale into manufacturer-specific, defensible performance evidence competitors relying on slower third-party testing queues cannot match on speed. ACO Group and Sika have both built in-house certification programs to capture this premium ahead of smaller regional competitors.
Market Impact: Captures a 15% to 26% certified per

Localize Production Closer To Infrastructure Hubs

Manufacturers that build regional production capacity closer to major water infrastructure and industrial construction hubs, rather than shipping finished products from centralized global production facilities, capture faster delivery times and reduced logistics cost that increasingly matter to engineers managing tight construction timelines. That localized capacity typically captures 10% to 18% more contract value than centralized production models, since infrastructure developers increasingly weight supply chain reliability alongside price when qualifying product suppliers for multi-year contracts. Manufacturers with established regional manufacturing footprints are winning contract renewals directly from suppliers still shipping product from distant centralized facilities with longer lead times.
Market Impact: Captures 10% to 18% more contract r

Expand Curing Capacity For Certified Production

Manufacturers that invest in dedicated curing and testing capacity for certified production lines, rather than allocating standard commodity lines to premium orders, capture faster qualification turnaround and reduced allocation risk that increasingly matters to engineers managing fixed construction schedules against tight qualification windows. That curing investment typically captures 13% to 22% more contract value than competitors relying on shared standard-grade production capacity, since developers increasingly weight supply reliability alongside price when qualifying suppliers for multi-year contracts. Manufacturers with established dedicated curing lines are winning contract renewals directly from competitors still facing capacity allocation constraints across major qualification cycles.
Market Impact: Captures 13% to 22% more contract r

Offer Long-Term Qualified-Supplier Volume Supply Contracts

Manufacturers that offer long-term qualified-supplier volume contracts, rather than selling products on a one-time transactional basis, capture recurring revenue that funds curing and testing investment competitors dependent on inconsistent one-time sales cannot easily match. That contract structure typically captures 12% to 21% more lifetime customer value than one-time sales, since predictable recurring revenue reduces customer acquisition cost pressure and lets manufacturers invest further ahead of near-term project results across the business. Manufacturers with established long-term contract programs are winning renewals directly from competitors selling products without any ongoing qualified-supplier relationship in place today.
Market Impact: Captures 12% to 21% more lifetime c

Who Controls the Margin Pool

Concentration sits at a low CR5 of 24%, reflecting a fragmented market split between regional precast manufacturers with localized production reach and specialized formulation developers with narrower but deeper certification depth. The gap between the top five and the next tier is real but moderate: leaders combine certification depth with broad distribution reach, while challengers typically compete only on regional commodity supply. All participants are assessed on one basis: disclosed polyme
Competition today runs across three dimensions. First, certified load-rating depth, since a manufacturer with published testing data wins municipal contracts competitors relying on unverified claims cannot match. Second, regional manufacturing capability, as manufacturers with localized production can offer delivery speed competitors shipping from distant facilities cannot sustain. Third, curing capacity breadth, since manufacturers with dedicated testing infrastructure capture trust-sensitive utility relationships competitors cannot reach.

Pressure is building from Asian manufacturers who have closed much of the certification gap on standard products while undercutting Western incumbents sharply on price. Regional specialists are pushing into premium certified territory, competing directly against established manufacturers on certification positioning. Rankings will shift toward manufacturers who pair certification depth with genuine regional manufacturing capability, since neither alone wins the largest contracts.
polymer-concrete-market-company-positioning-matrix-1787302584514

Competitive Moat and Risk Dimensions

ACO GROUP

Moat: Broad Certified Product Portfolio

ACO Group operates one of the industry's most extensive polymer concrete product portfolios, spanning drainage, structural, and industrial base categories that smaller specialized manufacturers cannot replicate without years of comparable engineering investment. That portfolio breadth lets ACO win multi-category municipal contracts that competitors selling single-format products alone cannot credibly compete for on convenience.
ACO GROUP

Risk: Broad Focus Limits Innovation Speed

ACO's broad drainage portfolio means polymer concrete-specific innovation investment competes internally against dozens of other product categories for capital and management attention, limiting how quickly it can respond to emerging corrosion-resistance specification trends. Specialized certification-focused competitors can move faster on innovation, potentially capturing premium infrastructure contracts before ACO's broader portfolio can respond.
HAURATON GMBH & CO. KG

Moat: Deep Drainage Technical Expertise

Hauraton operates decades-deep drainage-specific technical expertise spanning channel design, hydraulic engineering, and load-rating certification, generating a trusted qualification channel that smaller unknown developers cannot replicate without comparable relationship investment over many years. That expertise depth lets Hauraton secure pilot deployments and expedited procurement review that competitors without established engineer trust cannot credibly access as quickly.
HAURATON GMBH & CO. KG

Risk: Limited Industrial Base Exposure

Hauraton's drainage-focused specialization limits its exposure to the faster-growing industrial machine base and structural panel segments relative to more diversified competitors offering broader product portfolios. As industrial applications grow faster than traditional drainage categories, Hauraton risks ceding volume growth to competitors better positioned across multiple application categories.

Players Tracked

Prominent Players

ACO Group
Hauraton GmbH & Co. KG
Sika AG
Fibrelite Composites Ltd
Christy Concrete Products

Other Key Players

Zurn Elkay Water Solutions Corporation
Jonite Pte Ltd
Composite Advantage LLC
Furnco International
BIRCO GmbH
MEA Water Management GmbH
Quikrete Companies, Inc.
Fosroc International Limited
Master Builders Solutions
Euclid Chemical Company
Sto SE & Co. KGaA
Trelleborg AB
Strongwell Corporation
ULMA Construction
Wavin N.V.

Recent Developments

MARCH 2025

ACO Group Expands Certified Testing Production Capacity

ACO Group announced expanded manufacturing capacity for its certified load-rated polymer concrete line, adding dedicated production to serve accelerating infrastructure demand for validated corrosion-resistance performance. The organic expansion, not a joint venture or acquisition, followed three years of rising municipal demand for certified product supply nationwide.
Signal: Signals established construction materials
SEPTEMBER 2024

Sika Acquires Regional Polymer Concrete Formulation Specialist

Sika completed the acquisition of a regional polymer concrete formulation specialist for an undisclosed sum, adding dedicated certified production capacity to its existing repair mortar business. The deal gives Sika direct formulation capability it previously accessed only through third-party supply agreements with outside contract partners.
Signal: Signals large construction chemicals manuf
MAY 2025

Christy Concrete Products and an Indian Water Utility Group Form Supply Partnership

Christy Concrete Products and a major Indian water utility group formed a partnership to supply certified polymer concrete locally for the group's expanding infrastructure network. The partnership targets deployment across several new production sites within three years, combining Christy's certification expertise with its partner's regional processing scale directly.
Signal: Signals Western manufacturers increasingly

Epoxy and Polyester Resin Exposure

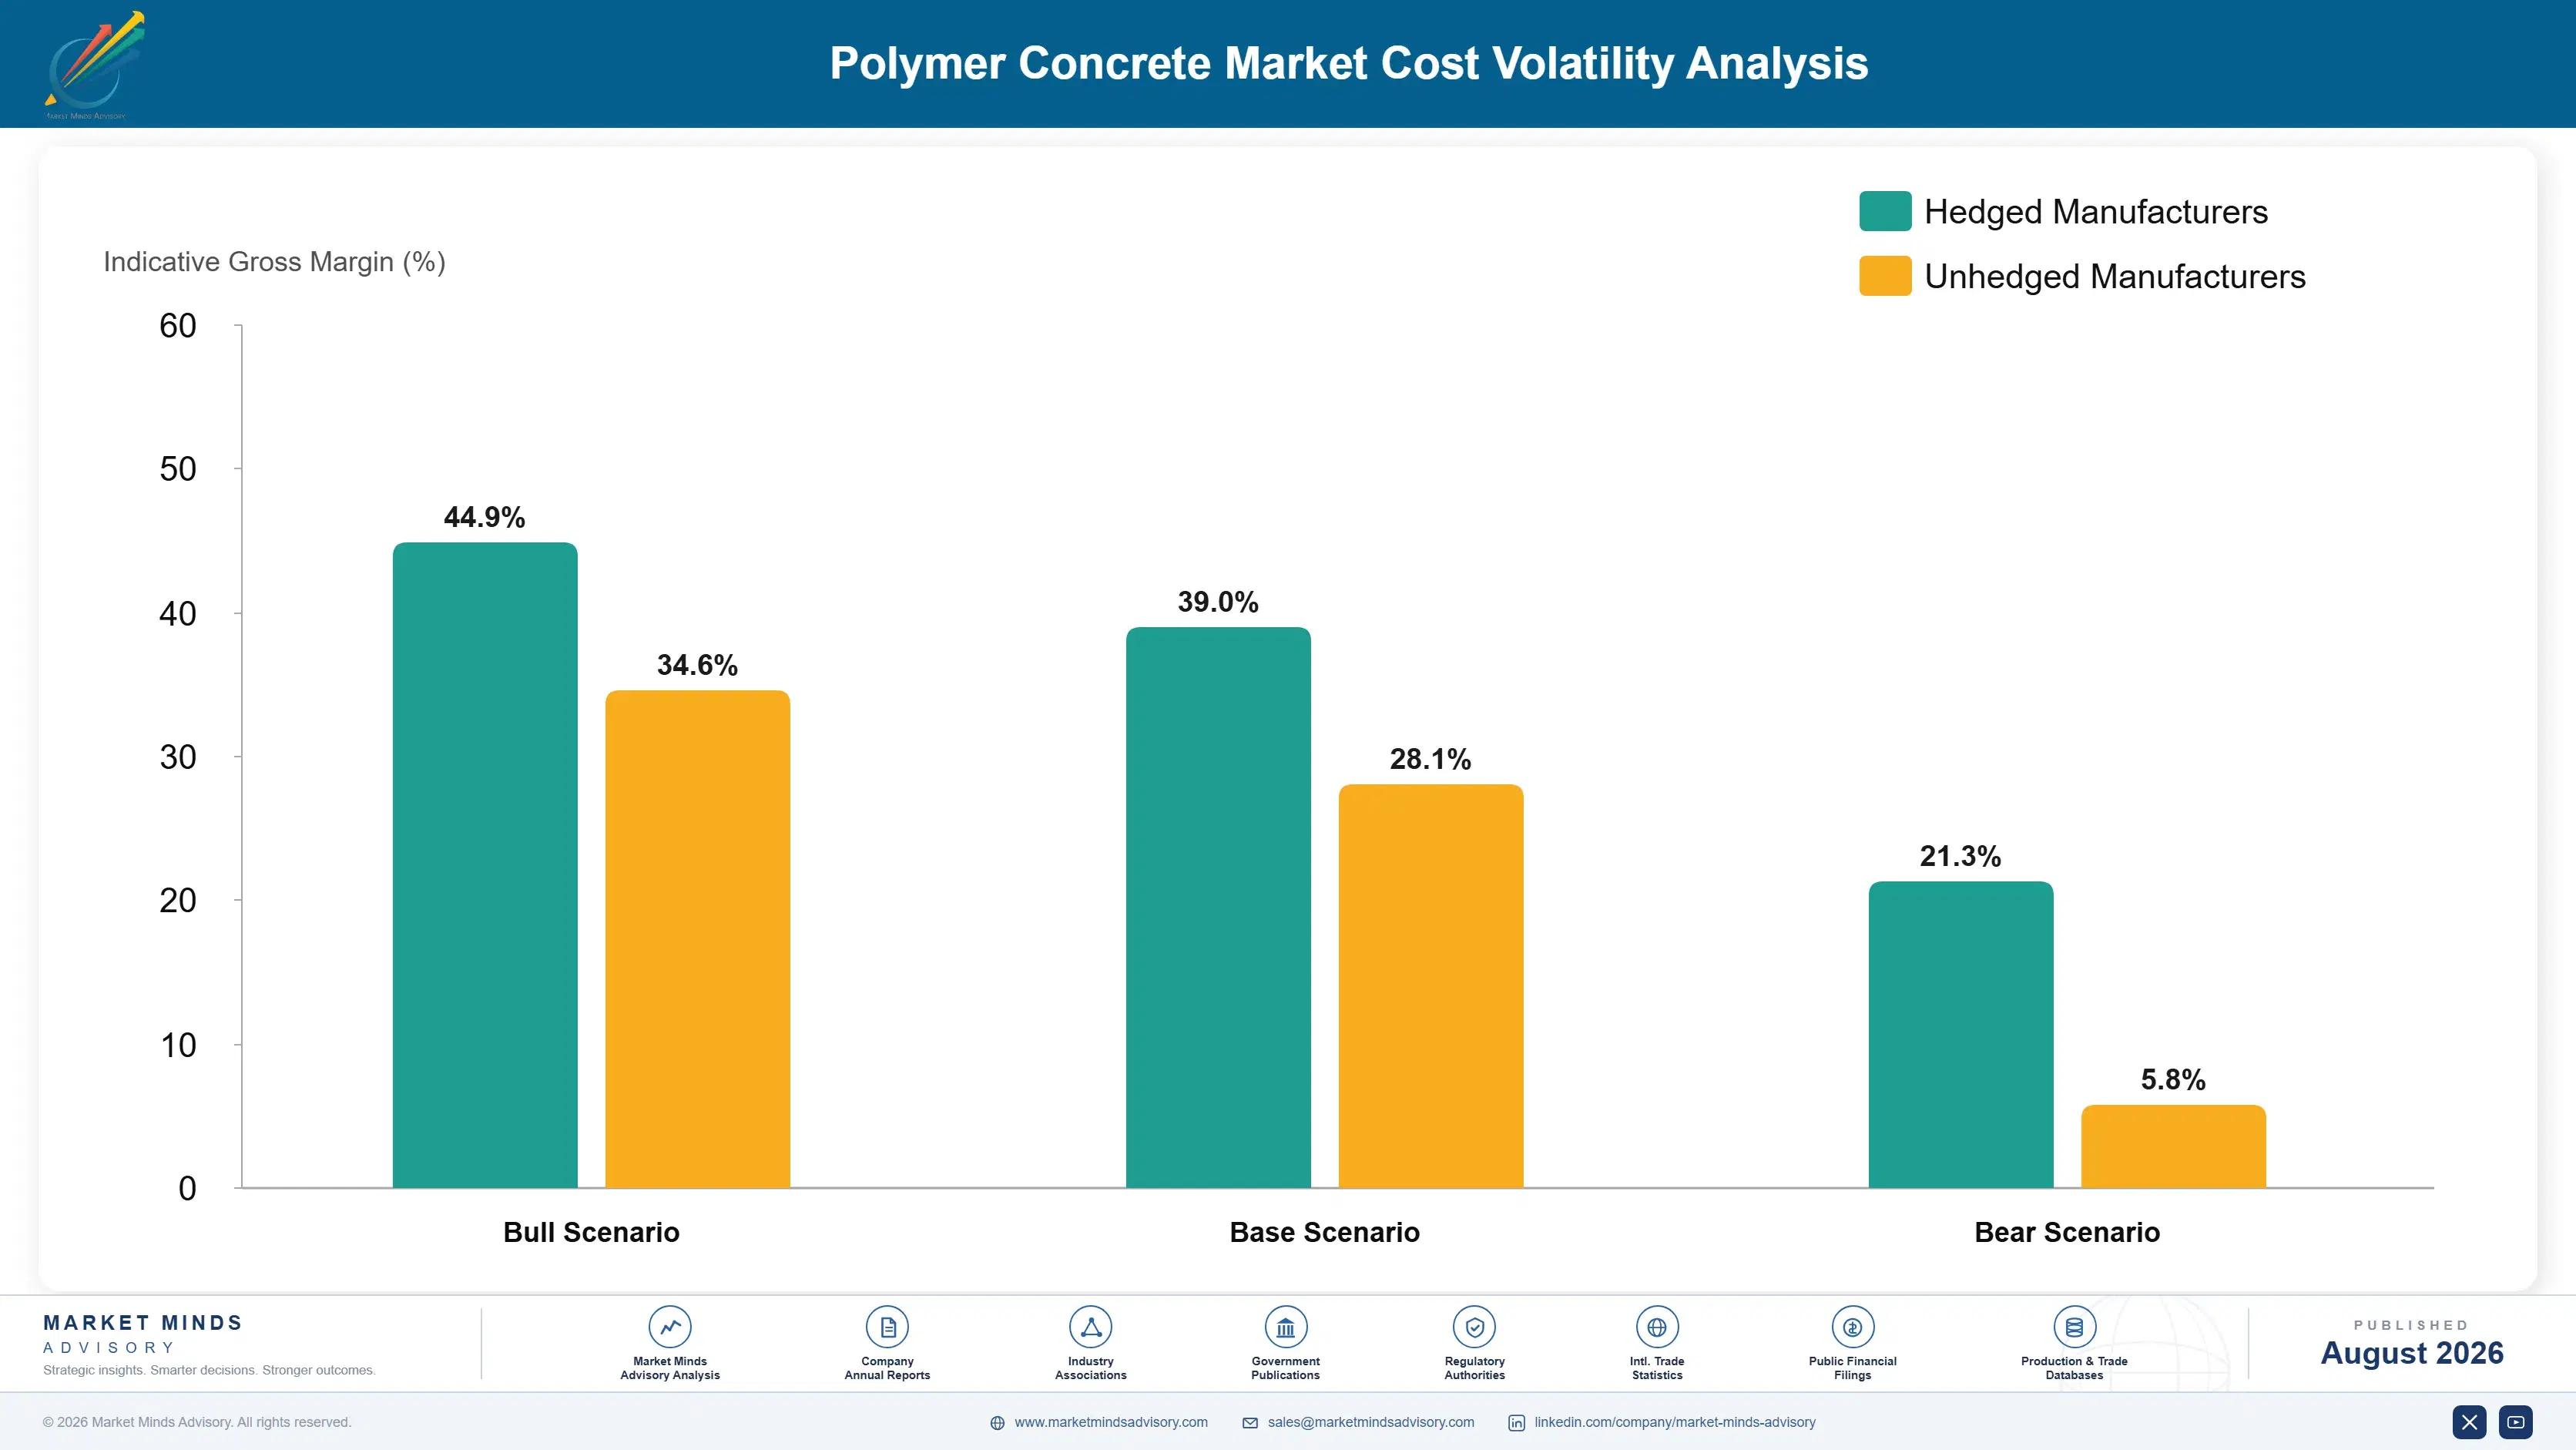
Epoxy and polyester resin binders together make up roughly 42% to 50% of cost of goods sold across polymer concrete formulations, well above conventional concrete economics, since both binders trace directly to volatile petrochemical commodity markets. Component costs trace to global propylene and styrene feedstock pricing, while curing costs track energy and catalyst supply cycles.
The 2021 to 2022 supply constraint illustrated the exposure directly. Industry data recorded epoxy and polyester resin costs reaching multi-year highs through 2022 as global petrochemical supply chain disruption affected specialty resin manufacturing capacity broadly across most regions. Sika's 2022 Annual Report disclosed elevated raw material and logistics costs across its construction chemicals supply chain, attributing margin pressure partly to resin volatility that took several quarters to ease meaningfully.

Smaller regional manufacturers without long-term resin supply agreements absorbed the cost spike hardest, since their purchase volumes were too small to secure the favorable supply contracts that larger manufacturers like ACO and Sika negotiate directly with resin suppliers. That gap compounds: large manufacturers can pre-purchase resin months ahead using capacity smaller competitors lack, leaving regional specialists exposed every time a resin cycle repeats.
polymer-concrete-market-cost-volatility-analysis-1787302584710

Secure Multi-Year Resin Supply Contracts

Negotiating multi-year fixed or indexed resin supply agreements directly with petrochemical suppliers, rather than buying on the spot market, secures allocation priority during shortage cycles and smooths cost volatility. The approach requires committing to volume forecasts years in advance, a real forecasting risk, but it has protected larger manufacturers' margins through two resin constraint cycles since 2020.

Diversify Resin Sourcing Across Suppliers

Qualifying more than one resin supplier for epoxy and polyester binder inputs, rather than relying on a single producer, reduces exposure to any single supply disruption or allocation decision during a shortage. Requalification takes real quality validation time, so manufacturers are prioritizing it for their highest-volume product lines first before extending diversified sourcing across their full catalog over time.

Pass Through Cost Via Indexed Pricing

Structuring municipal supply contracts with resin-indexed pricing clauses, rather than fixed long-term pricing, shifts some cost exposure to utility buyers who absorb resin volatility through periodic price adjustments tied to published indices. Manufacturers have increasingly negotiated indexed pricing structures to protect margin on multi-year contracts while still offering price predictability during periods of stable resin cost.

Portfolio Architecture for Margin Defence

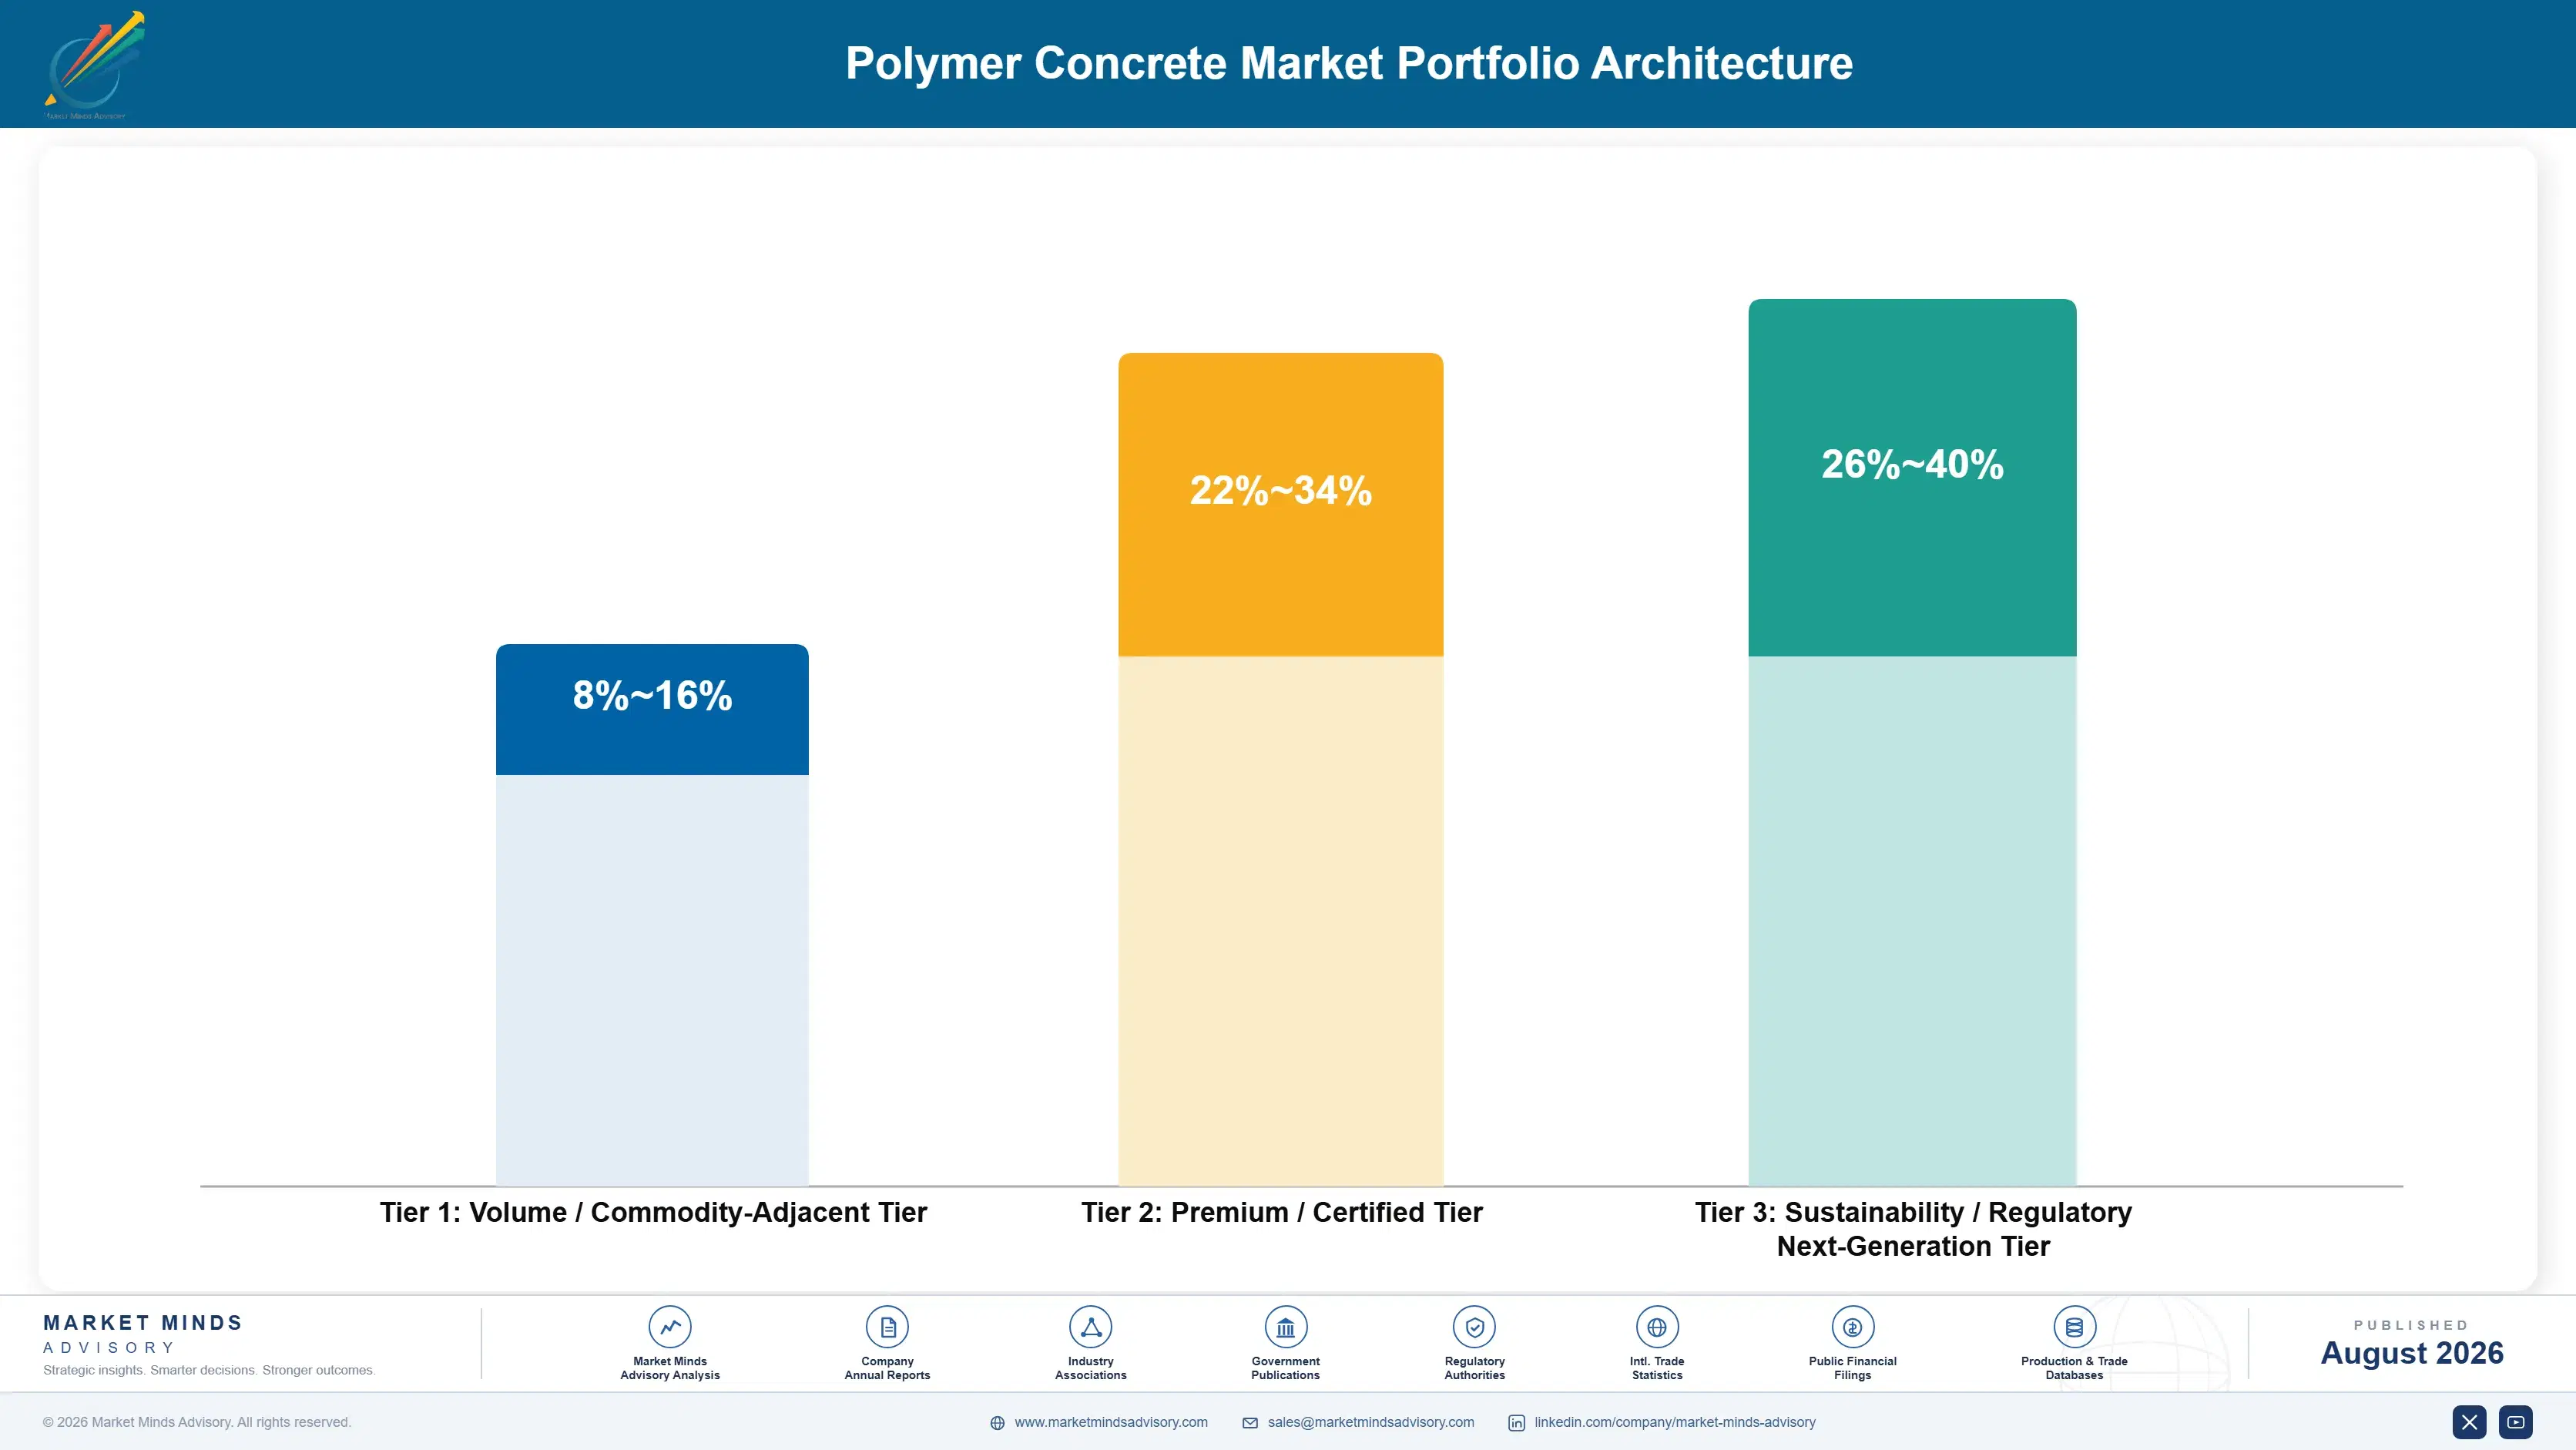
The portfolio splits into three tiers with wide margin separation tied to certification depth and formulation sophistication rather than raw resin cost alone. Standard uncertified products sold on price and basic compliance carry thin margins. Certified corrosion-resistant and load-rated formulations backed by published testing data carry the strongest margins. A third tier of next-generation smart-monitoring and sustainability formulations is still scaling toward proven, repeatable commercial e
The tension between commodity volume and premium certified products shapes how manufacturers allocate capital: commodity sales fund the manufacturing scale and distribution reach that make premium products attractive to sell against, while certification programs fund the testing investment and formulation engineering that create genuine competitive protection. Manufacturers that lean too far toward commodity volume risk losing the certification depth that differentiates them; those leaning too far toward premium risk under-utilized commodity capacity.

High-value pools concentrate specifically in corrosion-resistant pipe and machine base formulations, where technical barriers and municipal switching costs both run highest. Standard uncertified drainage products used in general infrastructure formation generate volume but thin, price-competitive margins, since multiple manufacturers can supply functionally similar formulations against the same basic specification.

Volume / Commodity-Adjacent Tier

Standard uncertified drainage and cover products sold against several regional manufacturers competing primarily on price, delivery time, and basic compliance specification across large municipal commodity orders placed year round across most distribution channels nationwide.
Gross Margin: 8-16%

Premium / Certified Tier

Certified corrosion-resistant and load-rated formulations backed by published testing data and accreditation certification that municipal utilities increasingly require before approving a new supplier for any facility-wide deployment use nationwide and abroad.
Gross Margin: 22-34%

Sustainability / Regulatory / Next-Generation Tier

Smart-monitoring and next-generation sustainability formulations still scaling toward proven, repeatable commercial economics across a broad and varied utility customer base of different infrastructure sizes and maturity levels right now globally.
Gross Margin: 26-40%
polymer-concrete-market-portfolio-architecture-1787302585201

Why Certification Locks In Utilities

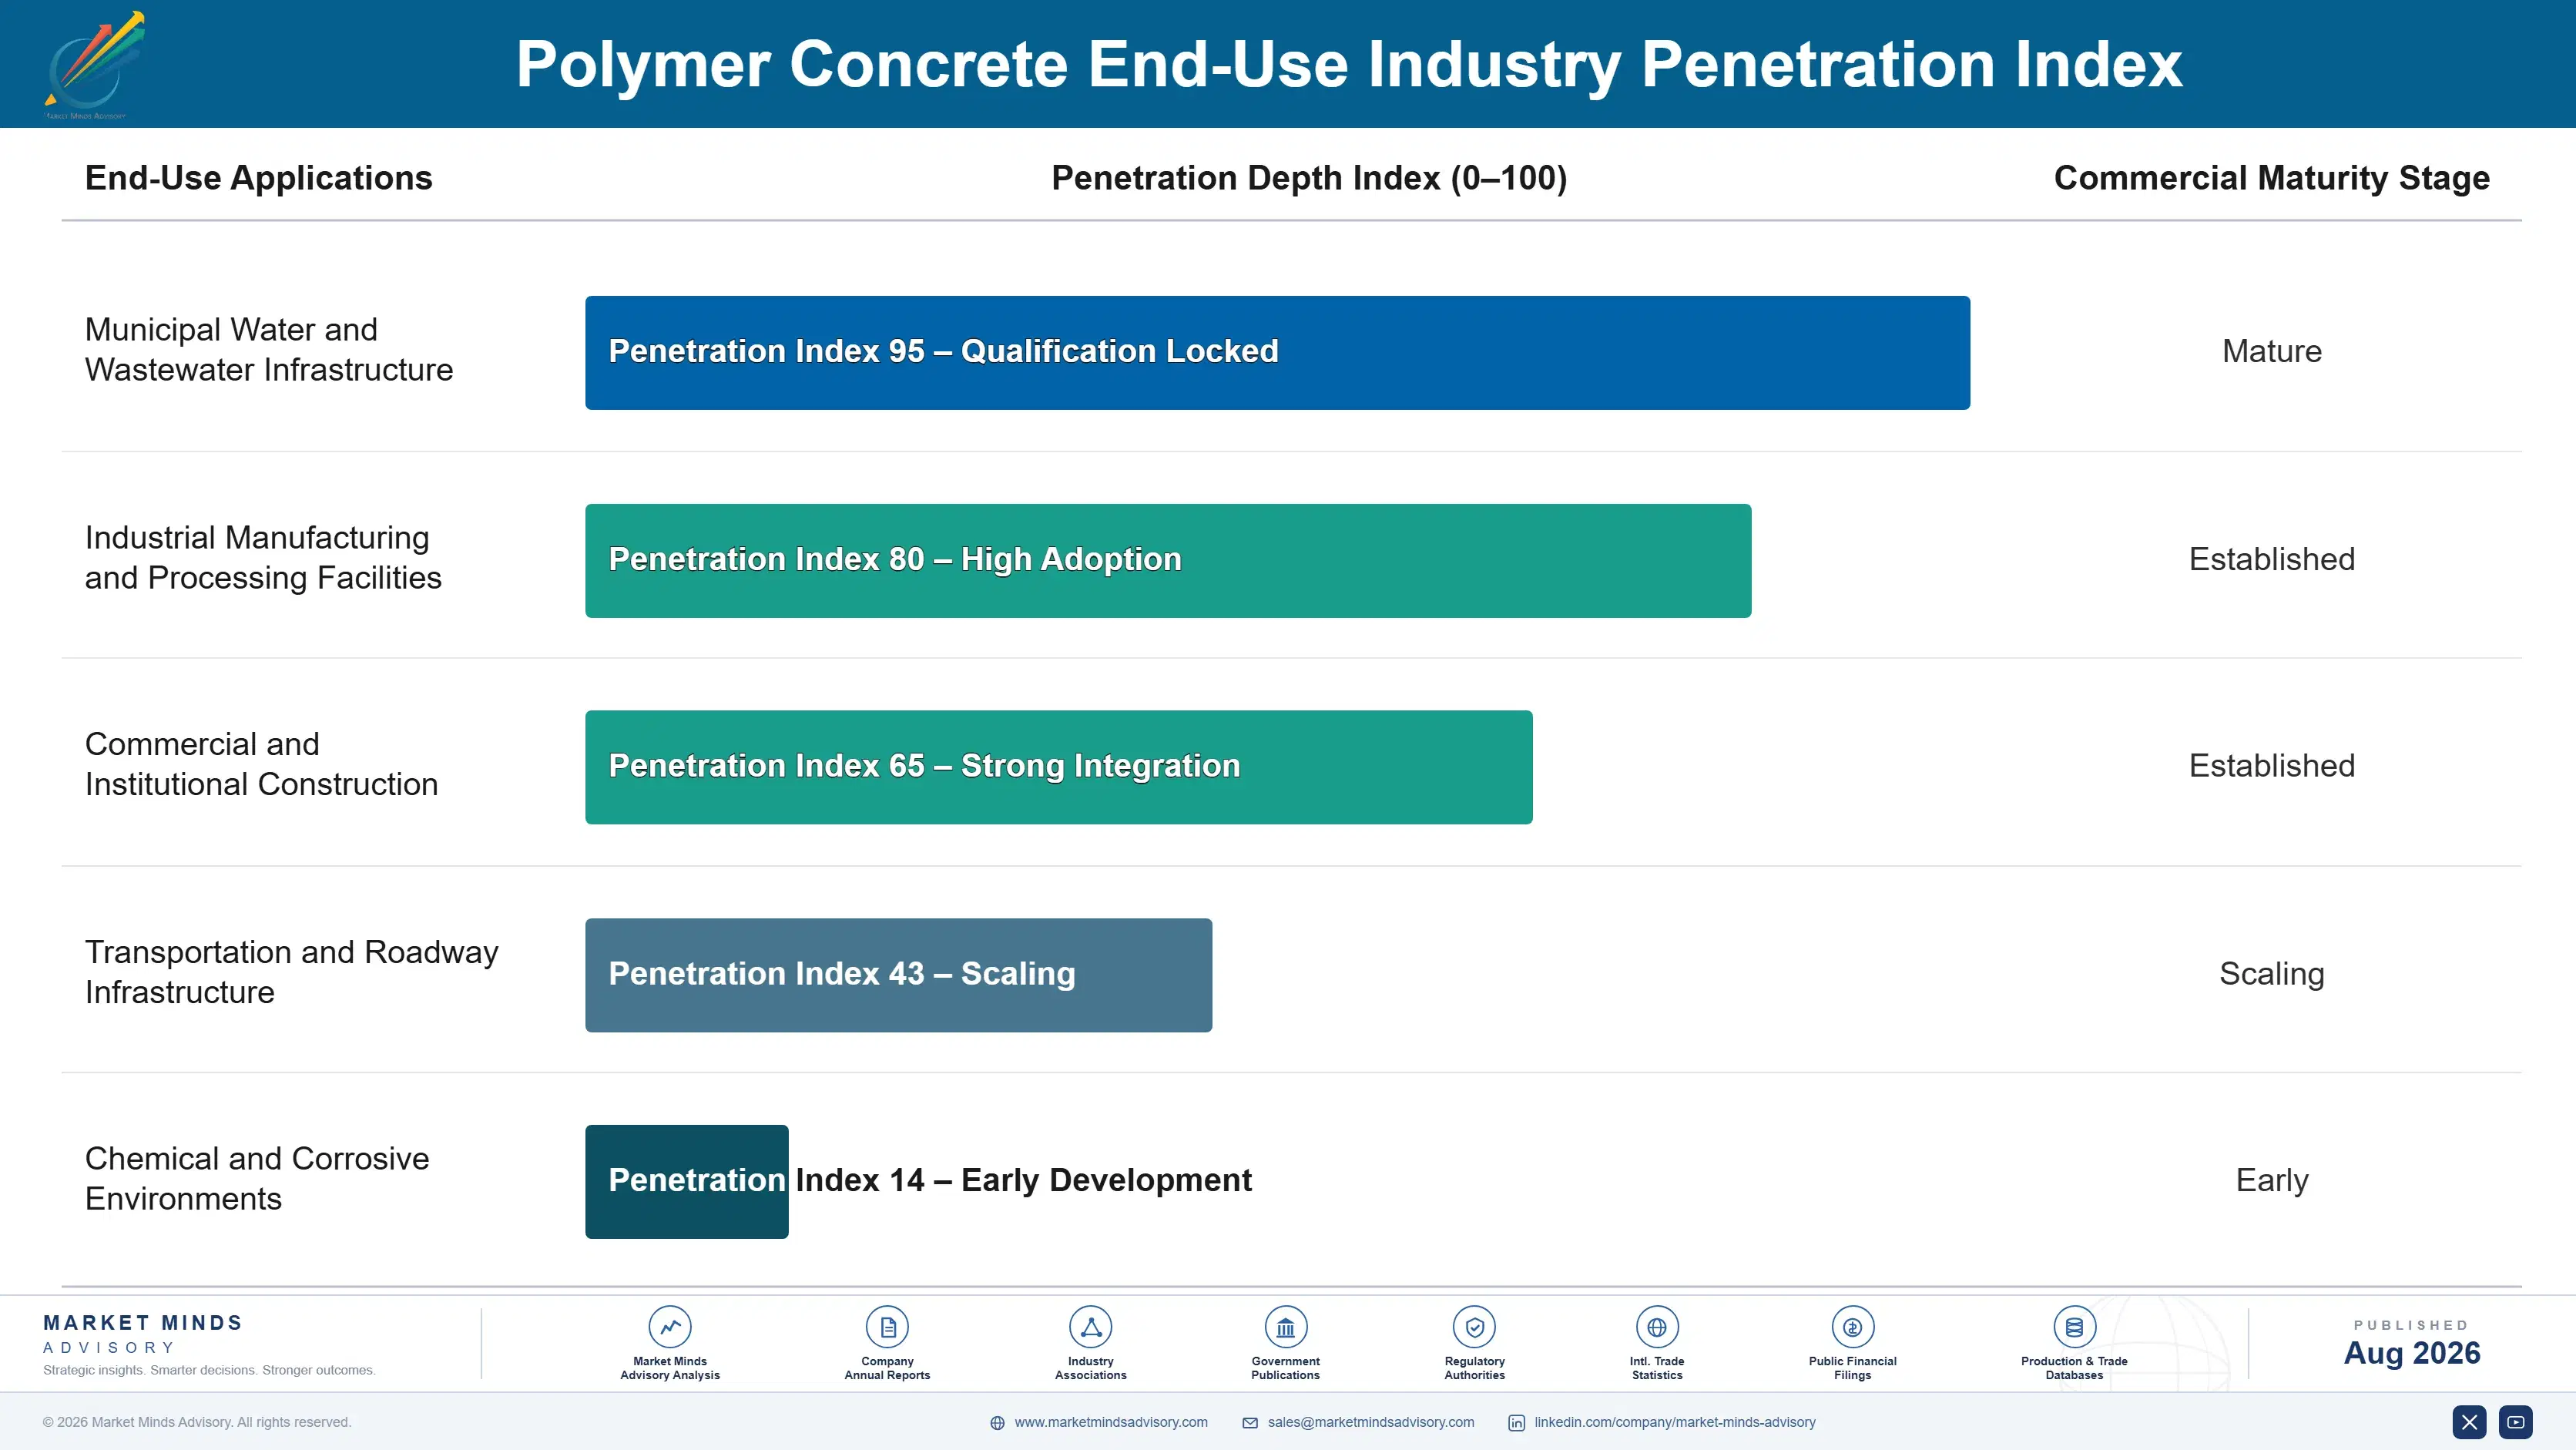
Demand here behaves like an annuity once a manufacturer wins a utility's approved-vendor qualification, because a utility rarely switches away from a qualified product supplier given the lengthy requalification process an unproven alternative would require. A manufacturer that wins the original qualification typically retains that utility relationship for years of continuous multi-year contracting, converting an initial qualification win into a recurring, largely captive purchasing relationship
Adoption depth varies sharply by utility type. Large municipal water authorities switch product suppliers rarely, given the extensive requalification review involved in adopting a new system and the perceived compliance risk of an unproven alternative, which makes their supplier relationships the stickiest in the market. Smaller industrial facility operators treat product procurement more like a commodity purchase and switch suppliers more readily based on price, giving them real negotiating leverage large utilities typically do not exercise.

Buyer profiles are shifting generationally too. A newer cohort of infrastructure engineers, trained under stricter post-pandemic durability and resilience standards, now weighs a supplier's certification depth and testing transparency as heavily as price, a shift that favors manufacturers with genuine engineering capability over commodity suppliers competing purely on unit cost.
polymer-concrete-market-end-use-penetration-index-1787302585691

Where MMA Sees This Market Heading

These are among the four positions where our research anticipates prominent divergence between winners and laggards over the coming forecast period. Each is grounded in the demand model, the regulatory perimeter, and the announced capacity pipeline.
01 / CERTIFICATION TESTING PREMIUM

Documented load-rating data will separate winners from unverified suppliers

Manufacturers with credible, documented load-rating and corrosion-resistance certification data will keep winning municipal contracts and multi-year renewal behavior regardless of price, because infrastructure engineers increasingly demand proof before approving a product supplier rather than accepting unverified performance claims. Manufacturers without that certification depth will increasingly compete only on commoditized price against formulations facing genuine credibility risk in an increasingly scrutinized municipal procurement environment. Expect continued investment in certification testing infrastructure as unverified suppliers race to close the evidence gap before utilities stop qualifying their products entirely.
02 / EAST ASIAN MANUFACTURING SCALE

East Asia's share keeps growing as infrastructure construction expands

East Asia already holds a substantial regional share at 28% and grows near the top of its band as China's sheer infrastructure construction scale pulls deployment east at real, sustained pace year after year across every category tracked. Domestic Chinese manufacturers are closing the certification and engineering gap with Western incumbents faster than most industry observers expected just a few years ago. Multinationals that fail to build direct Asian manufacturing relationships risk losing one of the largest volume opportunities in the entire global market.
03 / REGIONAL MANUFACTURING CAPTURE

Localized production will command real premium over centralized supply

Manufacturers who build genuine regional manufacturing capability will capture the delivery speed and supply chain reliability premium that infrastructure engineers increasingly weight alongside price when qualifying suppliers for multi-year contracts nationwide. The approach commands genuine margin precisely because it removes the logistics uncertainty centralized-production competitors would otherwise pass on to engineers managing tight construction timelines from scratch and at real cost. Expect regional manufacturing capability to become standard practice across the entire top supplier tier well within the ten-year forecast window.
04 / CURING CAPACITY ADVANTAGE

Dedicated curing capacity will keep separating credible suppliers from unverified ones

Manufacturers who invest in genuine dedicated curing and testing capacity will keep winning trust-sensitive utility operators that unverified competitors simply cannot reach once compliance and allocation scrutiny intensifies across the broader market. That curing depth commands genuine commercial value precisely because it removes performance-uncertainty risk utilities would otherwise bear themselves when purchasing from an unverified or uncertified supplier outright. Expect curing capacity depth to become a standard differentiator across the entire top supplier tier well within the ten-year forecast window.

Engagement Snapshot From the Field

A live engagement with an industry participant carrying material or product regulatory and market exposure ahead of a defining policy shift, showing how our research translates into a defensible multi-year portfolio strategy.
MARKET MINDS ADVISORY · CLIENT ENGAGEMENT SUMMARY
Polymer Concrete Producer Strategic Portfolio Review and Transition Roadmap 2026·Investment Scenario on Polymer Concrete Exposure Evaluation 2025-26
CLIENT PROFILE
A regional municipal water authority serving five districts approached MMA while evaluating whether to upgrade its legacy concrete drainage infrastructure ahead of a planned capacity expansion. The client reported annual product procurement and maintenance spend near USD 7 million across three separate suppliers, with growing compliance exposure tied to aging drainage infrastructure across its oldest district (client-reported, unverified by MMA).
STRATEGIC CHALLENGE
Management knew a polymer concrete upgrade would reduce compliance exposure and support the capacity expansion but worried about installation downtime during the transition and whether a phased upgrade approach could maintain service continuity. The engineering team wanted immediate replacement; the operations team worried about disruption; and authority leadership needed a clear risk mitigation plan before committing.
MMA APPROACH
MMA benchmarked infrastructure upgrade practices and compliance outcomes across comparable regional water authorities, modeled the compliance risk and disruption reduction a phased upgrade could realistically deliver, and quantified the exposure the client faced without prioritizing its oldest district first. We also assessed which of two candidate suppliers held certification depth sufficient to support the expansion.
KEY FINDINGS
  1. Aging drainage infrastructure at the oldest district was creating measurable compliance exposure, with two inspection cycles flagged for elevated failure rates during a recent internal audit (client-reported, unverified by MMA).
  2. A phased upgrade prioritizing the oldest district first could reduce compliance exposure meaningfully within the first seven months while limiting disruption across the remaining four districts.
  3. One of the client's two candidate suppliers already held certification depth sufficient to support expanded capacity without requiring an entirely new qualification process.
  4. Comparable water authorities that phased their infrastructure upgrades saw measurably lower compliance overruns than authorities pursuing simultaneous district-wide replacement all at once.
CLIENT PROFILE
A regional municipal water authority serving five districts approached MMA while evaluating whether to upgrade its legacy concrete drainage infrastructure ahead of a planned capacity expansion. The client reported annual product procurement and maintenance spend near USD 7 million across three separate suppliers, with growing compliance exposure tied to aging drainage infrastructure across its oldest district (client-reported, unverified by MMA).
STRATEGIC CHALLENGE
Management knew a polymer concrete upgrade would reduce compliance exposure and support the capacity expansion but worried about installation downtime during the transition and whether a phased upgrade approach could maintain service continuity. The engineering team wanted immediate replacement; the operations team worried about disruption; and authority leadership needed a clear risk mitigation plan before committing.
MMA APPROACH
MMA benchmarked infrastructure upgrade practices and compliance outcomes across comparable regional water authorities, modeled the compliance risk and disruption reduction a phased upgrade could realistically deliver, and quantified the exposure the client faced without prioritizing its oldest district first. We also assessed which of two candidate suppliers held certification depth sufficient to support the expansion.
KEY FINDINGS
  1. Aging drainage infrastructure at the oldest district was creating measurable compliance exposure, with two inspection cycles flagged for elevated failure rates during a recent internal audit (client-reported, unverified by MMA).
  2. A phased upgrade prioritizing the oldest district first could reduce compliance exposure meaningfully within the first seven months while limiting disruption across the remaining four districts.
  3. One of the client's two candidate suppliers already held certification depth sufficient to support expanded capacity without requiring an entirely new qualification process.
  4. Comparable water authorities that phased their infrastructure upgrades saw measurably lower compliance overruns than authorities pursuing simultaneous district-wide replacement all at once.
RECOMMENDED STRATEGY
Phase 1: Phase 1 (0 to 4 months): Audit existing drainage infrastructure and identify the highest-failure-rate district across all five service districts. Phase 2: Phase 2 (4 to 10 months): Upgrade the oldest district first while maintaining full service continuity throughout the transition period. Phase 3: Phase 3 (10 to 16 months): Complete upgrades across the remaining four districts ahead of the planned infrastructure expansion date.
OUTCOME
The client completed its phased infrastructure upgrade within fifteen months and supported its planned capacity expansion without any compliance incidents. Failure rates declined meaningfully following the upgrade, and the client reported avoided costs worth roughly USD 1.2 million in the following year from reduced compliance and maintenance spend (client-reported, unverified by MMA).

Frequently Asked Questions

Foundational context covering the market sizes, CAGR, scope, country, region and competition that inform every finding below. This section is provided to cover basics and most often pre-purchase conversations, answered from the MMA Primary Research Dataset.

What is the current size of the Polymer Concrete Market?

The market stood at USD 1.3 billion in 2025, spanning drainage, structural, machine base, pipe, decorative, and repair mortar categories. Corrosion-resistant pipe and conduit systems are the fastest-growing segment within that base.

How large will the Polymer Concrete Market be by 2036?

The market is projected to reach USD 2.9 billion by 2036 under the base case scenario. That represents roughly 2.07 times the 2026 value of USD 1.4 billion.

What is the CAGR for the Polymer Concrete Market 2026 to 2036?

The base case CAGR is 7.6% annually through 2036. The bull case reaches 8.8% on faster infrastructure investment, while the bear case falls to 6.4%.

Which segment is growing fastest?

Corrosion-resistant pipe and conduit systems grow fastest at 10.4% annually, well ahead of conventional drainage categories. That pace is roughly 1.37 times the overall market growth rate through 2036.

Who are the major companies in the Polymer Concrete Market?

ACO Group, Hauraton, Sika, Fibrelite Composites, and Christy Concrete Products lead the market on disclosed segment revenue worldwide, ahead of fifteen other named competitors profiled in the full report.

Which country is growing fastest?

India grows fastest among all countries at 11.8% annually, ahead of other major Asian infrastructure markets. Growth is driven by expanding water infrastructure and industrial facility construction investment.

Report Segmentation Architecture

The full report scope spans multiple orthogonal segmentation dimensions, with cross-tabulated demand data provided for each dimension pair. Coverage extends further to regional breakdowns, trend trajectories, and the competitive detail needed to support segment-level decision-making.

By Product Application

  • Precast Manhole Covers and Drainage Channels
  • Industrial Machine Bases and Foundations
  • Precast Structural Panels and Facades
  • Corrosion-Resistant Pipe and Conduit Systems
  • Decorative and Architectural Cast Products
  • Repair Mortars and Overlay Systems

By End-Use Industry

  • Municipal Water and Wastewater Infrastructure
  • Industrial Manufacturing and Processing Facilities
  • Commercial and Institutional Construction
  • Transportation and Roadway Infrastructure
  • Chemical and Corrosive Environments

By Commercial Dimension

  • Direct Municipal Utility Procurement
  • Distributor and Wholesale Channel
  • Contractor Installation Sales
  • Repair and Maintenance Service Contracts

By Region

  • North America
  • Western Europe
  • East Asia
  • South Asia and Pacific
  • Latin America
  • Middle East and Africa
  • Eastern Europe

Scope, Methodology, and Coverage

Every figure in this report is reproducible from documented input assumptions. The scope below maps the historical period, the forecast horizon, the segmentation dimensions, and the countries covered, alongside the underlying primary and qualitative methodology.
Historical Period
2020 to 2025
Forecast Period
2026 to 2036
Base Year
2025 (USD billions; MMA Primary Research Dataset, August 2026)
Market Definition
The polymer concrete market covers resin-bound aggregate composite products including precast manhole covers, drainage channels, industrial machine bases, structural panels, pipe systems, and repair mortars engineered for corrosion resistance and load-bearing performance. It excludes conventional Portland cement concrete, fiber-reinforced plastic composites sold independently of aggregate binding, and asphalt-based paving products.
Quantitative Units
USD billions (current prices); thousand metric tons shipped where applicable
Segmentation Dimensions
By Product Application; By End-Use Industry; By Commercial Dimension; By Region
Regions Covered
North America, Western Europe, East Asia, South Asia and Pacific, Latin America, Middle East and Africa, Eastern Europe
Countries Covered
USA, China, Germany, France, UK, Japan, South Korea, India, Australia, Canada, Brazil, Mexico, Indonesia, Vietnam, Saudi Arabia, UAE, South Africa, Nigeria, Poland, Netherlands, Italy, Spain, Sweden, Switzerland, Argentina, Colombia, Singapore, and additional markets relevant to this sector
Key Companies Profiled
ACO Group, Hauraton GmbH & Co. KG, Sika AG, Fibrelite Composites Ltd, Christy Concrete Products, Zurn Elkay Water Solutions Corporation, Jonite Pte Ltd, Composite Advantage LLC, Furnco International, BIRCO GmbH, MEA Water Management GmbH, Quikrete Companies, Inc., Fosroc International Limited, Master Builders Solutions, Euclid Chemical Company, Sto SE & Co. KGaA, Trelleborg AB, Strongwell Corporation, ULMA Construction, Wavin N.V.
Quantitative Methodology
Primary survey, n=3,800 respondents, Q4 2025, six countries; demand-side model with trade association cross-validation
Qualitative Methodology
47 expert interviews, Q4 2025; applied to validate demand model assumptions, identify emerging dynamics, and assess competitive positioning
Report Format
PDF and XLSX data workbook (Word format preview document)
Publisher
Market Minds Advisory
Report Code
MMA-2026-CON-415
Published
August 2026
Contact
sales@marketmindsadvisory.com | www.marketmindsadvisory.com

Purchase the full Polymer Concrete Market Report (2026 to 2036).

The full MMA Polymer Concrete report sizes the market across six product applications, five end-use industries, four commercial models, and seven regions through 2036. It profiles 20 manufacturers on a consistent basis of disclosed polymer concrete segment revenue, scoring each on certified load-rating depth, regional manufacturing capability, and curing capacity breadth. Scenario models quantify how water infrastructure replacement, East Asian manufacturing scale, and corrosion-resistance regulation move both demand and realizable pricing. The report also includes resin cost modeling by category, a certified performance investment framework across major product applications, and a regional manufacturing feasibility model built for procurement, engineering, and manufacturing strategy teams.
Six-category segmentation with cross-tabulated regional demand data
Twenty-company competitive benchmarking on consistent revenue basis
Certified performance investment framework across major product applications
Resin cost and sourcing exposure modeling by category
Scenario forecasts through 2036 under bull and bear cases
Case study on regional municipal water authority infrastructure upgrade

Built For The People Who Decide

From boardroom strategy to bench-side execution, this report is read cover-to-cover by leaders shaping the next decade of their industry, turning demand scenarios, market dynamics and valuation benchmarks into decisions.
CXOs/ Presidents/ VPs/ Managers
M&A and Corporate Development
Strategy Teams and R&D Heads
Procurement and Product Directors
Regulatory and Compliance Leaders
Investor Relations and Equity Analysts