Market Minds Advisory
Polyethylene Corrugated Packaging Market

Polyethylene Corrugated Packaging Market: Trip Counts, Return Logistics and the Case Against Buying Boxes Twice

A plastic corrugated tote costs about eleven times what a cardboard box does and pays for itself somewhere around trip nine, provided somebody actually remembers to bring the thing back.

Lead Analyst

Bilal Shaikh

Published

September 2026

Make Smarter Decisions with Customized Research Insights

Request a free sample report and evaluate market opportunities, growth trends, and competitive dynamics relevant to your business needs.

2025 MARKET VALUE$2.1BMarket Size 2025
2036 FORECAST VALUE$4.5BBase Case , 2026 to 2036
CAGR 2026 TO 20367.2 %Bull 8.4% / Bear 6.0%
INCREMENTAL OPPORTUNITY$2.3BNet 10- year value creation
EXPANSION MULTIPLE2.00x2036 value over 2026 base
Strategic Levers
M&A Pipeline
Regional Outlook
Country Rankings
Competitive Intelligence
Segmental Deep-dive
Call-Us : 91 93563 13602

Executive Snapshot and Market Trajectory

Plastic corrugated board is bought for one reason: the box comes back. Everything else about it, the water resistance, the cleanability, the puncture strength, matters only because those properties are what let a container survive being used repeatedly. Nothing else about the material justifies the price.
Closed-loop returnable tote systems compound at 10.8%, exactly 1.50 times the market, because the trip economics only work when return is guaranteed rather than hoped for. East Asia holds 29% of demand on automotive and electronics manufacturing density. Resin runs near 61% of extruder cost, so polymer pricing sets the payback arithmetic directly. Payback lands around trip nine, and a container that never returns never gets there. Recovery is the only variable that matters.
Concentration is low at 36%. Extruding twinwall sheet is not difficult; the barrier is the die-cutting, welding and fitting-out that turns sheet into a container built for a customer's exact part. That fitting-out work is where the margin is. Part-specific inserts and dunnage eliminate the line-side damage that justifies a programme, and designing them requires knowing the customer's components. Extrusion alone qualifies nobody for the work worth having.
Market Definition
The market covers extruded twinwall and multiwall polyolefin corrugated sheet and the containers fabricated from it, spanning closed-loop returnable tote systems, protective layer pads and dividers, one-way and limited-trip shipping boxes, dunnage and part-specific inserts, printed retail and display formats, and electrostatic-dissipative containers. Corrugated fibreboard packaging, injection-moulded crates and bins, rigid bulk containers, and thermoformed trays are excluded.
Base Year Value
$2.1B in 2025 (MMA Primary Research Dataset, August 2026)
Forecast Period
2026 to 2036, eleven discrete annual values
CAGR
7.2% base case. Bull 8.4%. Bear 6.0%.
Fastest Growth Segment
Closed-Loop Returnable Tote Systems: 10.8% CAGR
Fastest Growth Country
India: 10.2% CAGR
Fastest Growth Region
South Asia and Pacific: 9.4% CAGR
Largest Region
East Asia: 29% of 2025 global value
Market Leaders
Coroplast, DS Smith Plastics, Inteplast Group, Karton, Primex Plastics. Source: MMA Analysis based on company annual reports.
Primary Survey
n=3,800 procurement and R&D decision-makers, Q4 2025, six countries
Methodology
Demand-side build-up, cross-validated against public data, 47 expert interviews

Polyethylene Corrugated Packaging Market Forecast Scenarios

polyethylene-corrugated-packaging-market-size-forecast-scenario-1787308654878
Growth ran at an implied 5.9% across 2020 to 2025, and automotive supply chain rebuilding drove much of it. Component shortages forced manufacturers to rethink parts handling, and the ones who moved to returnable containers during that period generally kept them. Fibreboard price volatility through the same years made the payback comparison look considerably better than usual.
The base case at 7.2% rests on three mechanisms. Automotive and electronics manufacturers keep converting parts handling to returnable systems as line-side damage costs get measured properly. Grocery and produce distribution keeps adopting reusable formats on hygiene and waste grounds. And single-use plastic rules increasingly exempt reusable formats, which turns a liability into an advantage. Closed-loop systems compound at 10.8% against a market at 7.2%, and dissipative containers take further share.
The bull case at 8.4% assumes closed-loop return rates improve enough through tracking technology that trip counts rise materially above current assumptions. The bear case at 6.0% follows from fibreboard prices falling and holding low, which lengthens payback beyond what capital committees will approve, alongside recycled content rules eventually reaching polyolefin containers themselves. Both hinge on recovery rather than on the container itself.

The Box That Has to Come Back

The whole commercial argument rests on one number. A plastic corrugated tote costs around eleven times what an equivalent fibreboard box does, and it beats the box on total cost somewhere around trip nine. Everything after that is saving. Everything before it is a worse deal than the cardboard the customer already had. Trip nine is the whole argument in one number.
TOP FIVE CONCENTRATION36%Combined share held by the five largest container producers
PAYBACK TRIP COUNT9 tripsJourneys needed before a returnable container beats fibreboard
RESIN COST SHARE61% of COGSPolyolefin resin as a proportion of the extruder cost base
CLOSED-LOOP RETURN RATE94%Container recovery achieved within controlled closed manufacturing loops
OPEN-LOOP RETURN RATE63%Recovery where the container leaves a controlled distribution network
TYPICAL SERVICE LIFE5 yearsWorking life before wear and impact damage force replacement
Which makes return rate the only variable that genuinely matters. Closed manufacturing loops, where a container moves between a supplier and an assembly plant on a fixed circuit, recover around 94% and the arithmetic works comfortably. Open distribution, where the container reaches a retailer or a customer site outside any controlled network, recovers about 63% and the payback frequently never arrives. Nobody measures their own recovery before approving a programme, which is the recurring failure.
That distinction explains the segment growth rates and it explains why so many reusable packaging programmes disappoint. The container is fine. The logistics that were supposed to bring it back were designed as an afterthought, by people who costed the containers carefully and the return transport not at all. Closed-loop systems compound at 10.8% precisely because they solve the part that actually fails.
"Every failed reusable programme I have seen had a beautiful container specification and a return process described in one sentence. The sentence usually started with the word 'suppliers'."
Principal, Reusable and Industrial Packaging Practice · MMA Reusable and Industr

Market Trends

Closed-Loop Systems Replace Optimistic Return Assumptions

Reusable packaging programmes have historically been costed on assumed return rates that open distribution never delivered, and recovery near 63% outside controlled networks turns a nine trip payback into something considerably longer. Manufacturers have responded by confining returnable systems to closed circuits between fixed sites, where recovery runs around 94% and the arithmetic holds. Closed-loop tote systems compound at 10.8% against a market at 7.2% as a result, and the shift is about logistics design rather than any change in the container itself. Programmes failed because return transport was designed by nobody in particular.
Market Impact: Payback reached at 9 trips

Single-Use Rules Turn Plastic Into the Compliant Option

Packaging waste regulation increasingly distinguishes reusable systems from single-use formats rather than treating all plastic identically, and a container designed for five years of service falls on the favourable side of that line. That reverses the usual regulatory position for a polyolefin product. Grocery, produce and food service distribution are converting fastest, since their waste volumes are visible and their distribution networks are already closed enough to support recovery at acceptable rates. Fee exemptions make the payback comparison look better than it did. Waste volumes are visible in those categories.
Market Impact: Return rates holding near 94%

Market Opportunities and Growth Drivers

Line-Side Damage Costs Get Measured for the First Time

Manufacturers converting to returnable containers usually discover that fibreboard part damage was costing considerably more than anybody had recorded, because damaged components were scrapped at the line without ever being attributed to packaging. Part-specific inserts and dunnage in a rigid container eliminate most of it. Once that cost is visible, the nine trip payback stops being the deciding argument and damage reduction takes over, which is a considerably easier case to make to an operations budget. Damage reduction of 40% or more is common once part-specific dunnage replaces loose fibreboard packing.
Market Impact: Payback slipping past 9 trips

Water Resistance and Cleanability Open Food and Produce Work

Polyolefin corrugated shrugs off moisture, washes down and survives chilled and wet environments that destroy fibreboard within a single trip. Produce packing, seafood distribution, meat processing and food service all operate in exactly those conditions, and hygiene requirements make a washable container genuinely valuable rather than merely convenient. These applications also tend to run inside closed distribution networks, which supports the recovery rates the trip economics require to work at all. Fibreboard fails outright here rather than merely costing less, which removes the price comparison. Recovery in these networks runs near 94%.
Market Impact: Payback extending beyond 9 trips

Market Restraints and Challenges

Return Logistics Are Costed as an Afterthought

Reusable programmes are approved on container cost and trip count with return transport treated as free, and it never is. The root cause is that packaging teams own the container budget while logistics owns the return leg, so nobody costs the whole system. Suppliers mitigate by modelling total cost including return transport, cleaning and storage before quoting, which frequently kills a bad programme early and makes the good ones durable rather than disappointing after eighteen months. Recovery at 63% outside controlled networks is where the model breaks. Almost nobody measures their own recovery before approval.
Market Impact: Recovery differing 94% versus 63%

Fibreboard Price Falls Reset the Comparison Downward

The payback case depends heavily on what a fibreboard box costs, and when recovered fibre prices fall the comparison lengthens beyond what capital committees will approve. The root cause is that one side of the comparison is a commodity and the other is a capital purchase. Suppliers mitigate by arguing damage reduction and hygiene rather than pure box cost, and by targeting applications where fibreboard fails outright rather than merely costing less. Chilled, wet and wash-down applications hold volume through those cycles. Moisture and wash-down destroy a fibreboard box in one trip, which removes the comparison rather than winning it.
Market Impact: Service life reaching 5 years
3 additional market trends, 4 additional growth drivers, and 2 additional restraints and challenges are covered in the full report. Contact sales@marketmindsadvisory.com to access the complete intelligence.

Segment CAGR and Growth Architecture

Segmentation follows container function and loop design, because whether a container returns and how it is fitted out determine everything about the economics. A buyer choosing between a returnable tote system and a one-way box is deciding whether their logistics can actually support recovery at all. Six functional classes sit in the hierarchy, separated by loop design and fitting-out depth.
polyethylene-corrugated-packaging-market-market-share-analysis-1787308655411

Closed-Loop Returnable Tote Systems

Closed-loop systems compound at 10.8%, exactly 1.50 times the market, because they are the only configuration where the trip economics reliably work. A container moving on a fixed circuit between a supplier and an assembly plant recovers at around 94%, which comfortably clears the nine trip payback and keeps clearing it across a five year service life. Fitting out matters as much as the container: part-specific inserts, dividers and dunnage are what eliminate the line-side damage that usually justifies the programme in the first place. The engineering work is in the fitting rather than the box, and suppliers who model return transport, cleaning and storage before quoting build programmes that survive rather than ones that disappoint after eighteen months.
CAGR 10.8%

Electrostatic-Dissipative Containers

Conductive and dissipative containers grow at 9.1% on electronics manufacturing, where an ordinary polyolefin container will destroy the components it is carrying. Carbon-loaded or surface-treated sheet controls charge generation and dissipation within specified resistance ranges, and those ranges are verified rather than claimed, since a failure is invisible until the assembled board fails test. The material costs substantially more than standard sheet and the qualification is genuinely technical rather than commercial. Electronics contract manufacturers and semiconductor handling operations are the main buyers, and they run closed loops naturally because their supply chains are already tightly controlled. That combination of technical barrier and reliable recovery makes it the best margin position in the category.
CAGR 9.1%
Full segment breakdown across 6 segments available in the complete report.

Regional Architecture and Country Demand Map

Demand tracks manufacturing density and distribution network structure together, since a returnable container needs both something worth protecting and a closed circuit to travel on. Automotive and electronics assembly predict volume better than general economic size. East Asia leads on assembly density and supplier park structure.

East Asia

East Asia holds 29% of global demand, growing at 8.2%. Chinese automotive and electronics assembly is the largest concentration of closed-loop container demand anywhere, and the supplier parks built around major assembly plants create exactly the fixed circuits the trip economics require. Japanese manufacturing has used returnable containers longest and most systematically, with container specification treated as part of production engineering rather than as procurement. Korean and Taiwanese electronics manufacturing drives the electrostatic-dissipative segment hardest, since component sensitivity there is severe. Regional sheet extrusion capacity is extensive, and competition on standard twinwall is intense and largely price-based. Fitting-out capability is thinner than extrusion capacity, which leaves the engineered programme work to a smaller group of specialists.
Share: 29% | CAGR: 8.2% (2026 to 2036)

North America

Twenty-five percent of demand sits in North America, growing at 6.9%. Automotive assembly and its supplier base account for the largest volume, with returnable container programmes well established across the major manufacturers and their tier one suppliers. Electronics manufacturing drives dissipative container demand. Grocery and produce distribution has converted more slowly than Europe, largely because distribution networks are longer and recovery correspondingly harder. Fabrication capability is strong and fragmented, with many regional converters buying sheet and fitting out containers to customer specification rather than extruding themselves. Reusable format regulatory exemptions have arrived more slowly and less uniformly than in Europe, which leaves the commercial argument resting on damage reduction and trip economics rather than on any compliance advantage.
Share: 25% | CAGR: 6.9% (2026 to 2036)
Regional intelligence for 5 additional markets available in the complete report: Western Europe, South Asia and Pacific, Latin America, Middle East and Africa, Eastern Europe. Contact sales@marketmindsadvisory.com.
polyethylene-corrugated-packaging-market-country-cagr-analysis-1787308655939

Selling the Loop Rather Than the Container

Reusable containers are quoted per unit against fibreboard boxes by buyers who have not costed the return leg. Every position worth holding here involves modelling the whole system before quoting anything. Four qualify, and two of them will occasionally talk a customer out of buying at all. That honesty is what makes the surviving programmes durable.

Model Return Transport Before Quoting Any Container

Programmes get approved on container cost and trip count with return transport, cleaning and storage treated as free, which is why so many disappoint after eighteen months. Suppliers who model the whole system, including the empty return leg, either build a programme that holds for five years or identify early that the logistics cannot support one. Recovery at 94% in closed loops against 63% in open distribution is the number that decides it, and almost no buyer has measured their own. Killing a bad programme early costs one quotation and saves a customer relationship.
Market Impact: Recovery differing 94% against 63%

Quantify Line-Side Damage Before Discussing Box Price

Fibreboard part damage is scrapped at the line and rarely attributed to packaging, so the cost is invisible until somebody measures it. Part-specific inserts and dunnage in a rigid container eliminate most of it, and once that number exists the nine trip payback stops being the argument at all. Damage reduction reaches an operations budget where capital payback reaches a committee that has already declined three similar proposals this year, which is a materially better audience. Damage reduction of 40% or more is common once part-specific dunnage replaces loose fibreboard packing, and that figure is what changes the conversation.
Market Impact: Payback arriving at 9 trips or some

Hold Dissipative Qualification for Electronics Handling

Electrostatic-dissipative containers require verified resistance ranges rather than claimed ones, because a failure is invisible until an assembled board fails test. That makes the qualification technical rather than commercial, and it excludes most fabricators from the work entirely. The segment grows at 9.1% and carries the best margin in the category, and electronics supply chains run closed loops naturally, so recovery rates support the economics without any additional logistics design at all. Verified resistance testing has already excluded fabricators who were selling declared performance they had never measured, which narrows the field considerably before any commercial discussion starts.
Market Impact: Dissipative containers compounding

Target Applications Where Fibreboard Fails Outright

Where the comparison is purely on cost, a fibreboard price fall lengthens payback beyond what any committee approves. Where moisture, wash-down or chilled conditions destroy a fibreboard box within one trip, there is no comparison to lose. Produce, seafood, meat processing and food service all sit there and mostly run closed enough distribution. Suppliers who prioritise those applications hold volume through fibreboard price cycles that remove everyone else. A five year service life in wash-down conditions beats any price comparison, since fibreboard does not survive a single trip there and recovery in these networks runs near 94%.
Market Impact: Service life extending across 5 ful

Who Controls the Margin Pool

Five producers hold 36% measured on polyolefin corrugated sheet and container revenue, the basis used consistently here. Concentration is low because extruding twinwall sheet is not technically difficult, and hundreds of regional fabricators buy sheet and convert it. Coroplast and DS Smith Plastics lead on fabrication breadth and programme design rather than on any extrusion advantage.
Competition operates on three dimensions. Fitting-out and part-specific insert design decides who can solve a manufacturer's damage problem rather than just supplying a box. Loop design capability decides whether a programme survives its second year. And dissipative material qualification decides participation in electronics work that most fabricators cannot approach. Extrusion capability itself qualifies nobody at all.

Two pressures are moving position. Closed-loop growth rewards suppliers who model return logistics and steadily exposes those selling containers alone. Meanwhile regional sheet extrusion capacity keeps expanding in Asia, which compresses standard twinwall pricing further. Rankings will shift toward whoever pairs programme design with genuine technical material capability. Recycled content rules will eventually reach polyolefin containers themselves, and post-consumer polypropylene consistent enough for twinwall extrusion is not reliably available at scale yet, which is a problem the whole category shares.
polyethylene-corrugated-packaging-market-company-positioning-matrix-1787308656466

Competitive Moat and Risk Dimensions

COROPLAST

Moat: Fabrication and fitting-out breadth

Coroplast operates extrusion alongside extensive die-cutting, welding and fitting-out capability, which means it supplies a container engineered around a customer's specific part rather than a standard box. The insert and dunnage design is what eliminates line-side damage, and that engineering is considerably harder to replicate than the sheet extrusion underneath it.
COROPLAST

Risk: Return logistics programme design

Closed-loop systems compound at 10.8% and succeed or fail on return transport, cleaning and storage design rather than on the container. Suppliers who model whole-system cost before quoting build programmes that hold, and a fabrication-led producer competes at a disadvantage against one that has built genuine logistics consulting capability.
DS SMITH PLASTICS

Moat: Pooling and loop management

DS Smith Plastics combines container supply with pooling and loop management, which addresses the return rate problem directly rather than leaving it to the customer. Recovery at 94% in a managed loop against 63% in open distribution decides whether a programme pays back, and managing that is a service business rather than a manufacturing one.
DS SMITH PLASTICS

Risk: Dissipative material qualification depth

Electrostatic-dissipative containers grow at 9.1% with the best margins in the category and require verified resistance performance rather than claimed specification. Producers whose strength lies in loop services rather than material science compete at a disadvantage in electronics handling, where the qualification excludes most of the field before commercial discussion begins.

Players Tracked

Prominent Players

Coroplast
DS Smith Plastics
Inteplast Group
Karton
Primex Plastics

Other Key Players

Distriplast
Corex Plastics
Twinplast
Plasgad Plastic Products
Sabic Polymershapes
Northern Ireland Plastics
Kartonplast
Yamakoh
Shanghai Naxilai Plastic
Suzhou Sanjiang Plastic
Gilman Brothers
Simona Plastics
Akyapak Plastik
Regency Plastics
Polymer Solutions International

Recent Developments

JANUARY 2025

Packaging waste rules formally distinguish reusable from single-use formats

European packaging regulation set separate treatment for containers designed for repeated service life, exempting them from fee structures applied to single-use plastic. This was a regulatory scope decision rather than a commercial development among producers, and reusable formats moved onto the favourable side of the line.
Signal: A regulatory exemption converts a polyolef
MAY 2025

Automotive suppliers report return rate shortfalls on open circuits

Tier one automotive suppliers reported returnable container recovery well below programme assumptions on routes extending outside controlled supplier parks, extending payback substantially. This reflects operating experience across the supply base rather than any transaction between packaging producers. Several programmes were confined to shorter circuits as a result.
Signal: Payback assumptions built on optimistic re
SEPTEMBER 2025

Electronics manufacturers tighten dissipative container resistance verification

Electronics contract manufacturers moved from accepting supplier-declared resistance values to requiring independent verification on dissipative containers, following component failures traced to charge damage. These were customer quality policy changes rather than developments among the container fabricators involved. Fabricators unable to demonstrate measured performance lost the work outright.
Signal: Verified resistance testing excludes those

Resin, Extrusion Energy and Conversion

Polyolefin resin accounts for roughly 61% of extruder cost of goods, predominantly polypropylene with polyethylene grades in specific applications. Extrusion energy adds around 12%, and it is a heavier load than most flexible packaging carries because twinwall profile extrusion runs hot and slow. Die-cutting, welding, fitting out and printing account for most of the remainder, and that conversion work is where margin is actually earned.
Polypropylene pricing moved sharply through 2021 and 2022 and again in 2025, and extruders recovered it unevenly because container programmes are quoted against multi-year payback models customers resist reopening. Company annual reports across the industrial packaging groups disclose the resulting margin effects. Energy Information Administration data on petrochemical feedstock pricing documents the underlying movement through the same period. Reopening a payback model a customer has already presented internally is considerably harder.

Exposure divides between extruders and fabricators. Extruders carry the full resin exposure against sheet pricing that competes with imported material. Fabricators buying sheet carry a pass-through cost and earn their margin on conversion, which insulates them from polymer movement considerably. Producers doing both hold better cost visibility, and dissipative material carries carbon loading cost that moves on its own supply dynamics.
polyethylene-corrugated-packaging-market-cost-volatility-analysis-1787308656662

Quote container programmes with resin adjustment clauses

Multi-year returnable programmes quoted at fixed prices against monthly polymer movement transfer the whole cycle to the extruder. Building a resin adjustment clause into the initial programme, with a defined reference and reset period, is far easier than reopening a payback model a customer has already presented to their capital committee once. Customers accept it at quotation stage.

Weight conversion work over sheet volume in the mix

Sheet extrusion competes against imported material on price and earns little, while die-cutting, welding and fitting out carry the margin and the technical barrier. Deliberately weighting the order book toward fitted-out programmes rather than plain sheet supply improves realised margin without requiring any additional extrusion capacity at all. Extrusion utilisation suffers slightly and margin improves considerably.

Source dissipative additives against qualified alternates

Carbon loading and surface treatment additives for dissipative sheet move on specialty supply dynamics separate from commodity polymer, and customers now require verified resistance performance rather than declared values. Qualifying a second additive source against the same verified resistance range avoids losing electronics work outright when a single supply route tightens. One qualification round covers it.

Portfolio Architecture for Margin Defence

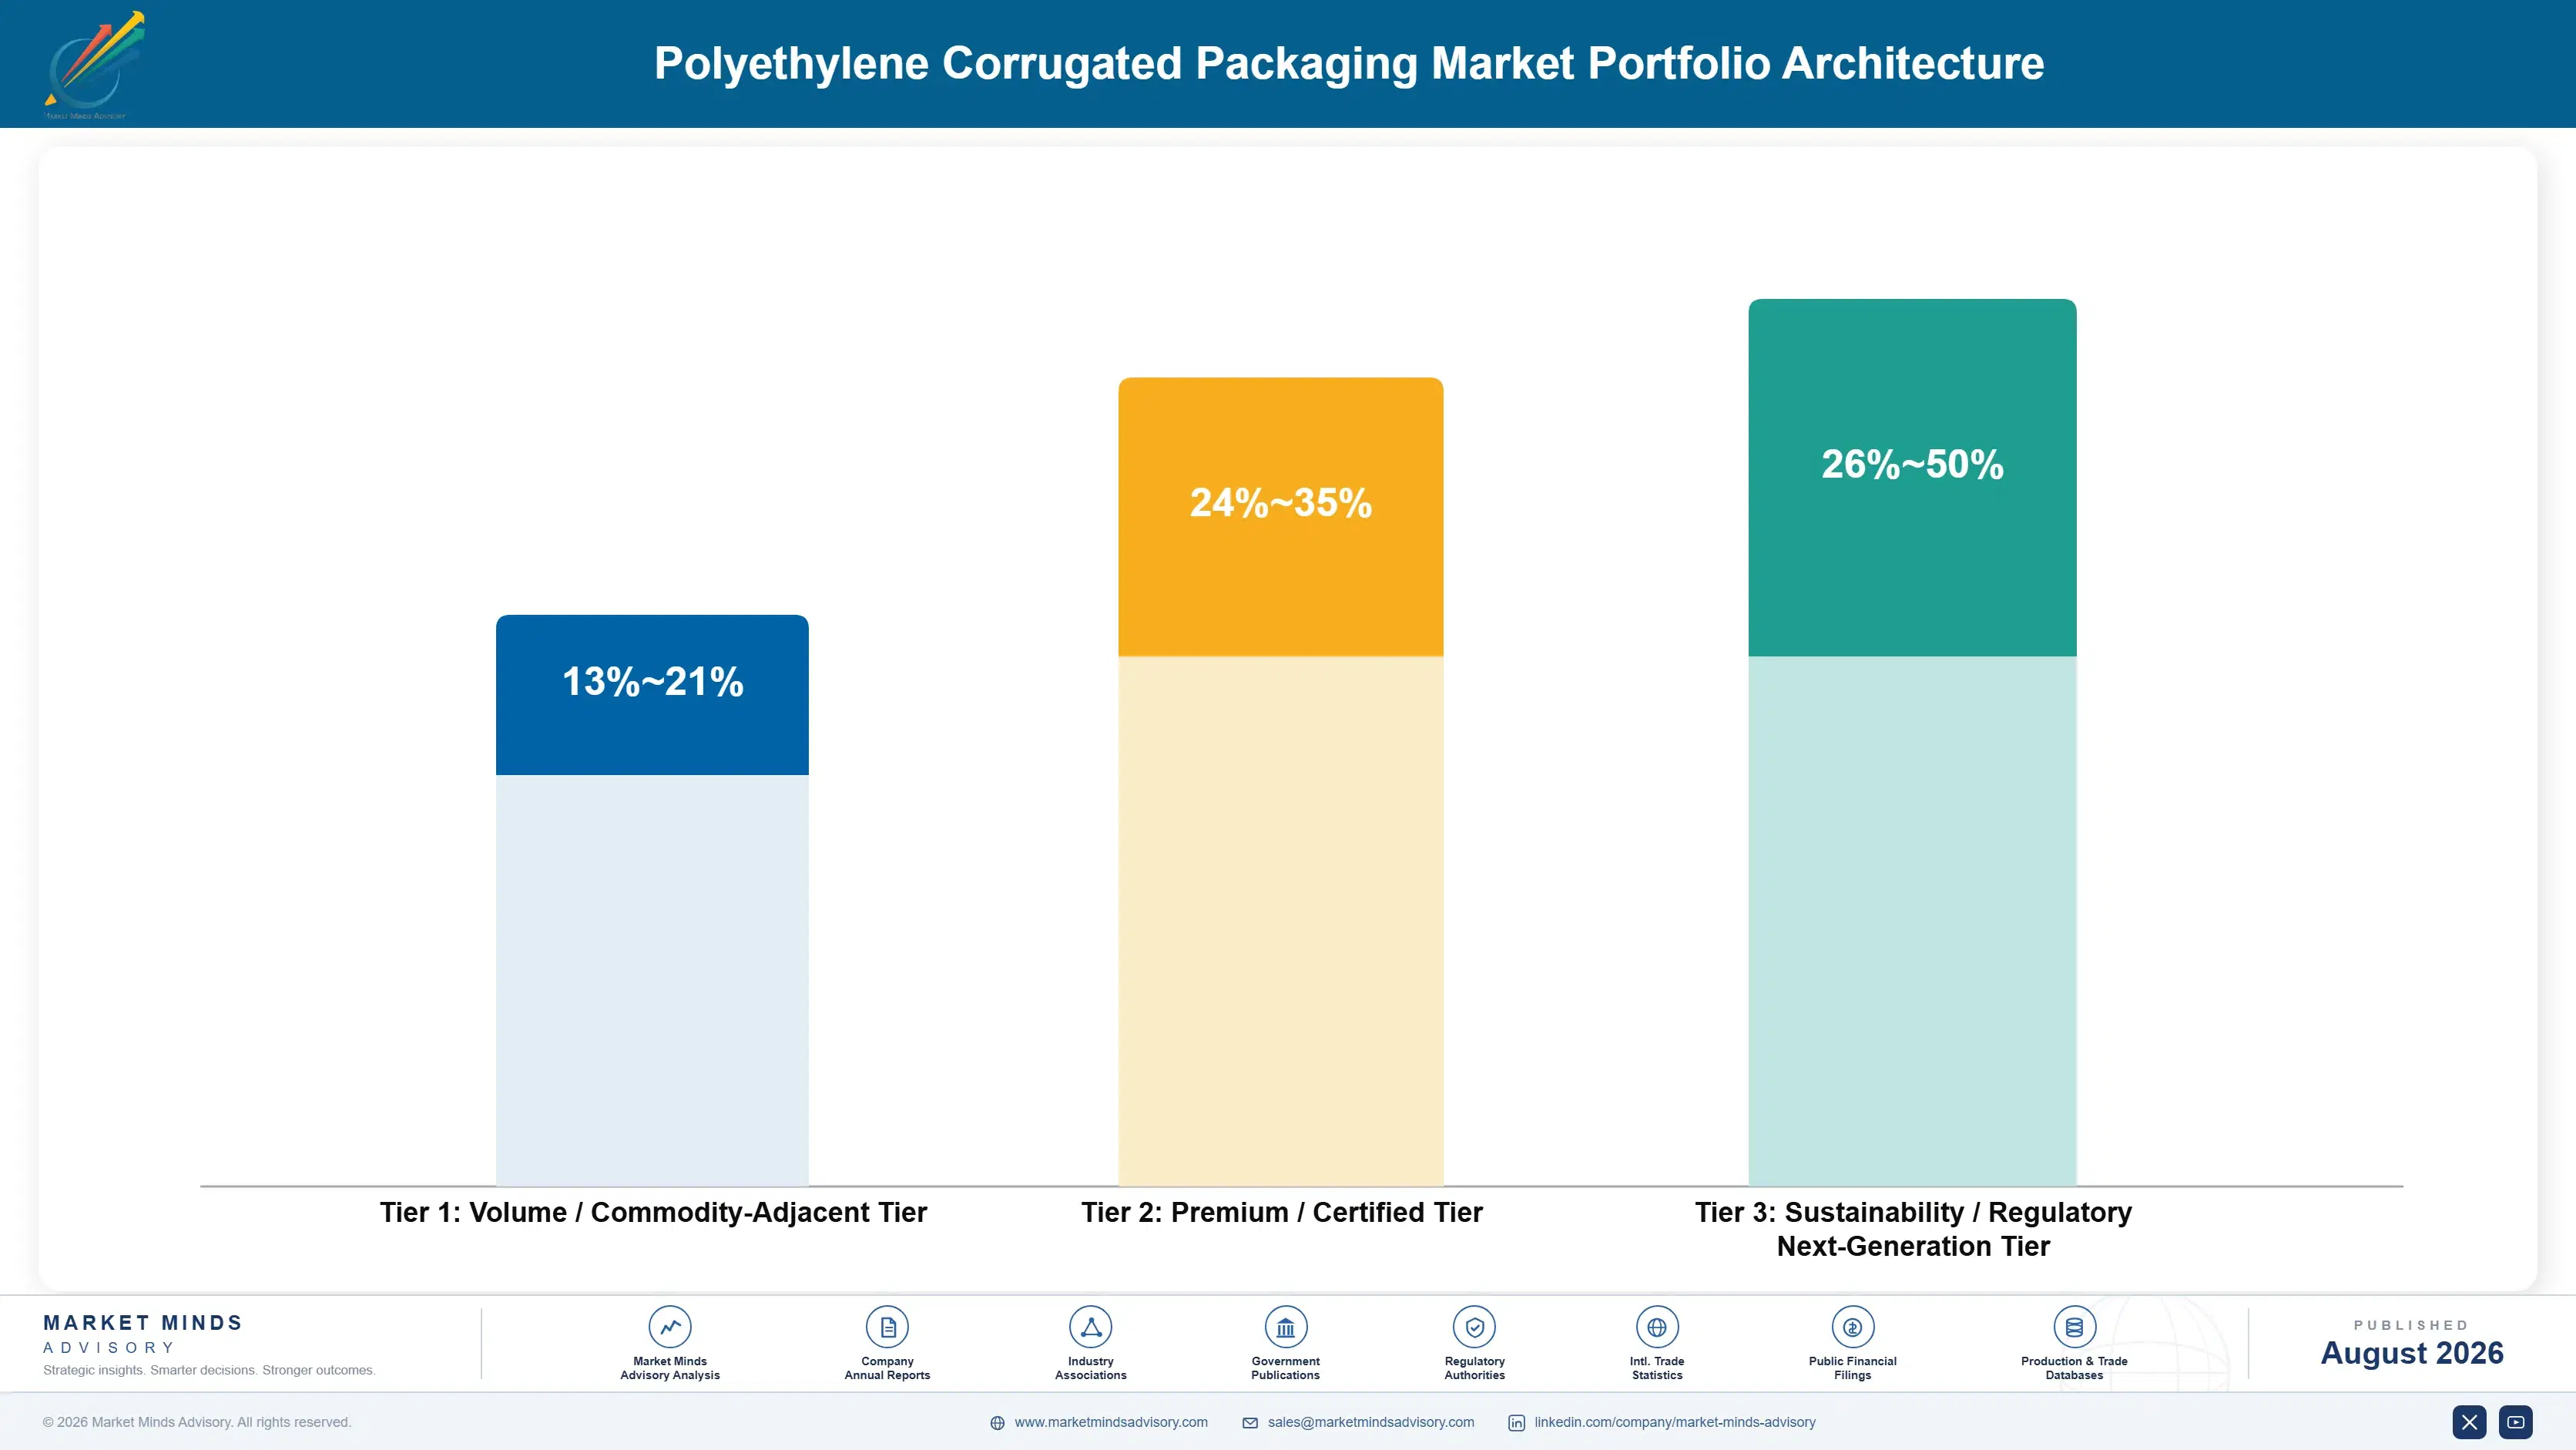
The portfolio separates on whether the container returns and what it has to protect. Plain sheet and one-way boxes are commodity extrusion competing against fibreboard and imports. Layer pads and dividers add modest conversion. Closed-loop tote systems add part-specific fitting out and loop design. Dissipative containers add verified material performance that most fabricators cannot supply at all. Printed retail formats sit apart again, competing on appearance rather than on protection.
The tension is between sheet volume and conversion margin. Extrusion capacity needs feeding and plain sheet does that at thin margin against imported material. Fitted-out programmes carry the margin and consume far less sheet per revenue dollar. Producers weighted entirely toward extrusion find themselves competing on resin cost, which is not a contest anybody in a high-cost region wins for long.

High-value pools concentrate where the container solves a problem rather than replacing a box. Closed-loop programmes with modelled return logistics, part-specific dunnage design and verified dissipative performance all qualify, and none of them is decided on price per container. What they share is that the customer is buying an outcome rather than a container, and the supplier has to understand their operation to describe it.

Volume / Commodity-Adjacent Tier

Plain twinwall sheet, one-way boxes and simple layer pads sold on price per square metre against fibreboard and imported material. Extrusion capability alone supplies it, and margin tracks the resin market almost exactly.
Gross Margin: 13-21%

Premium / Certified Tier

Closed-loop returnable tote systems with part-specific inserts, dividers and dunnage engineered to a customer's components. Fitting-out capability and damage reduction evidence qualify the supplier well before price enters the discussion.
Gross Margin: 24-35%

Sustainability / Regulatory / Next-Generation Tier

Electrostatic-dissipative containers with independently verified resistance performance, plus recycled-content sheet meeting reusable format exemptions. The wide margin range separates verified technical capability from producers still reselling declared specifications they never measured.
Gross Margin: 26-50%
polyethylene-corrugated-packaging-market-portfolio-architecture-1787308657164

High-value Sub-segments and Strategic Watch-out

Closed-Loop Returnable Tote Systems

Compounding at 10.8% because recovery near 94% is the only configuration where nine trip payback reliably works. Loop design rather than container specification is what separates programmes that survive from those quietly abandoned after two years. Return logistics design rather than container engineering is the whole discipline here.
Gross Margin: 26-35%

Electrostatic-Dissipative Containers

Growing at 9.1% with the best margin in the category, on verified resistance performance that most fabricators cannot demonstrate. Electronics supply chains run closed loops naturally, so recovery supports the economics without extra logistics work. Independent verification requirements have narrowed the qualified supplier field sharply.
Gross Margin: 34-50%

One-Way and Plain Sheet Formats

The volume core at 4.2%, competing against fibreboard and imported sheet on price per square metre with margin tracking resin directly. It feeds extrusion capacity and contributes very little above the cost of running it. Imported sheet effectively sets the going price across most of the regions.
Gross Margin: 13-21%

Recycled Content Sheet Formats

The strategic watch-out. Recycled content rules will eventually reach polyolefin containers themselves, and post-consumer polypropylene of sufficient consistency for twinwall extrusion is not reliably available at scale yet. Extrusion consistency rather than supply volume is what currently blocks it, and no producer has solved that at commercial scale.
Gross Margin: 18-40%

Buying Fleets, Not Boxes

The revenue shape here is unusual. A closed-loop programme is a fleet purchase followed by five years of near-silence, then replacement of whatever has been damaged or lost, which typically runs between eight and fourteen percent of the fleet annually. That attrition is the annuity, and it is far more predictable than the initial sale. Suppliers who track fleet condition rather than waiting for reorders keep the replacement business automatically. Reorders rarely come as tenders.
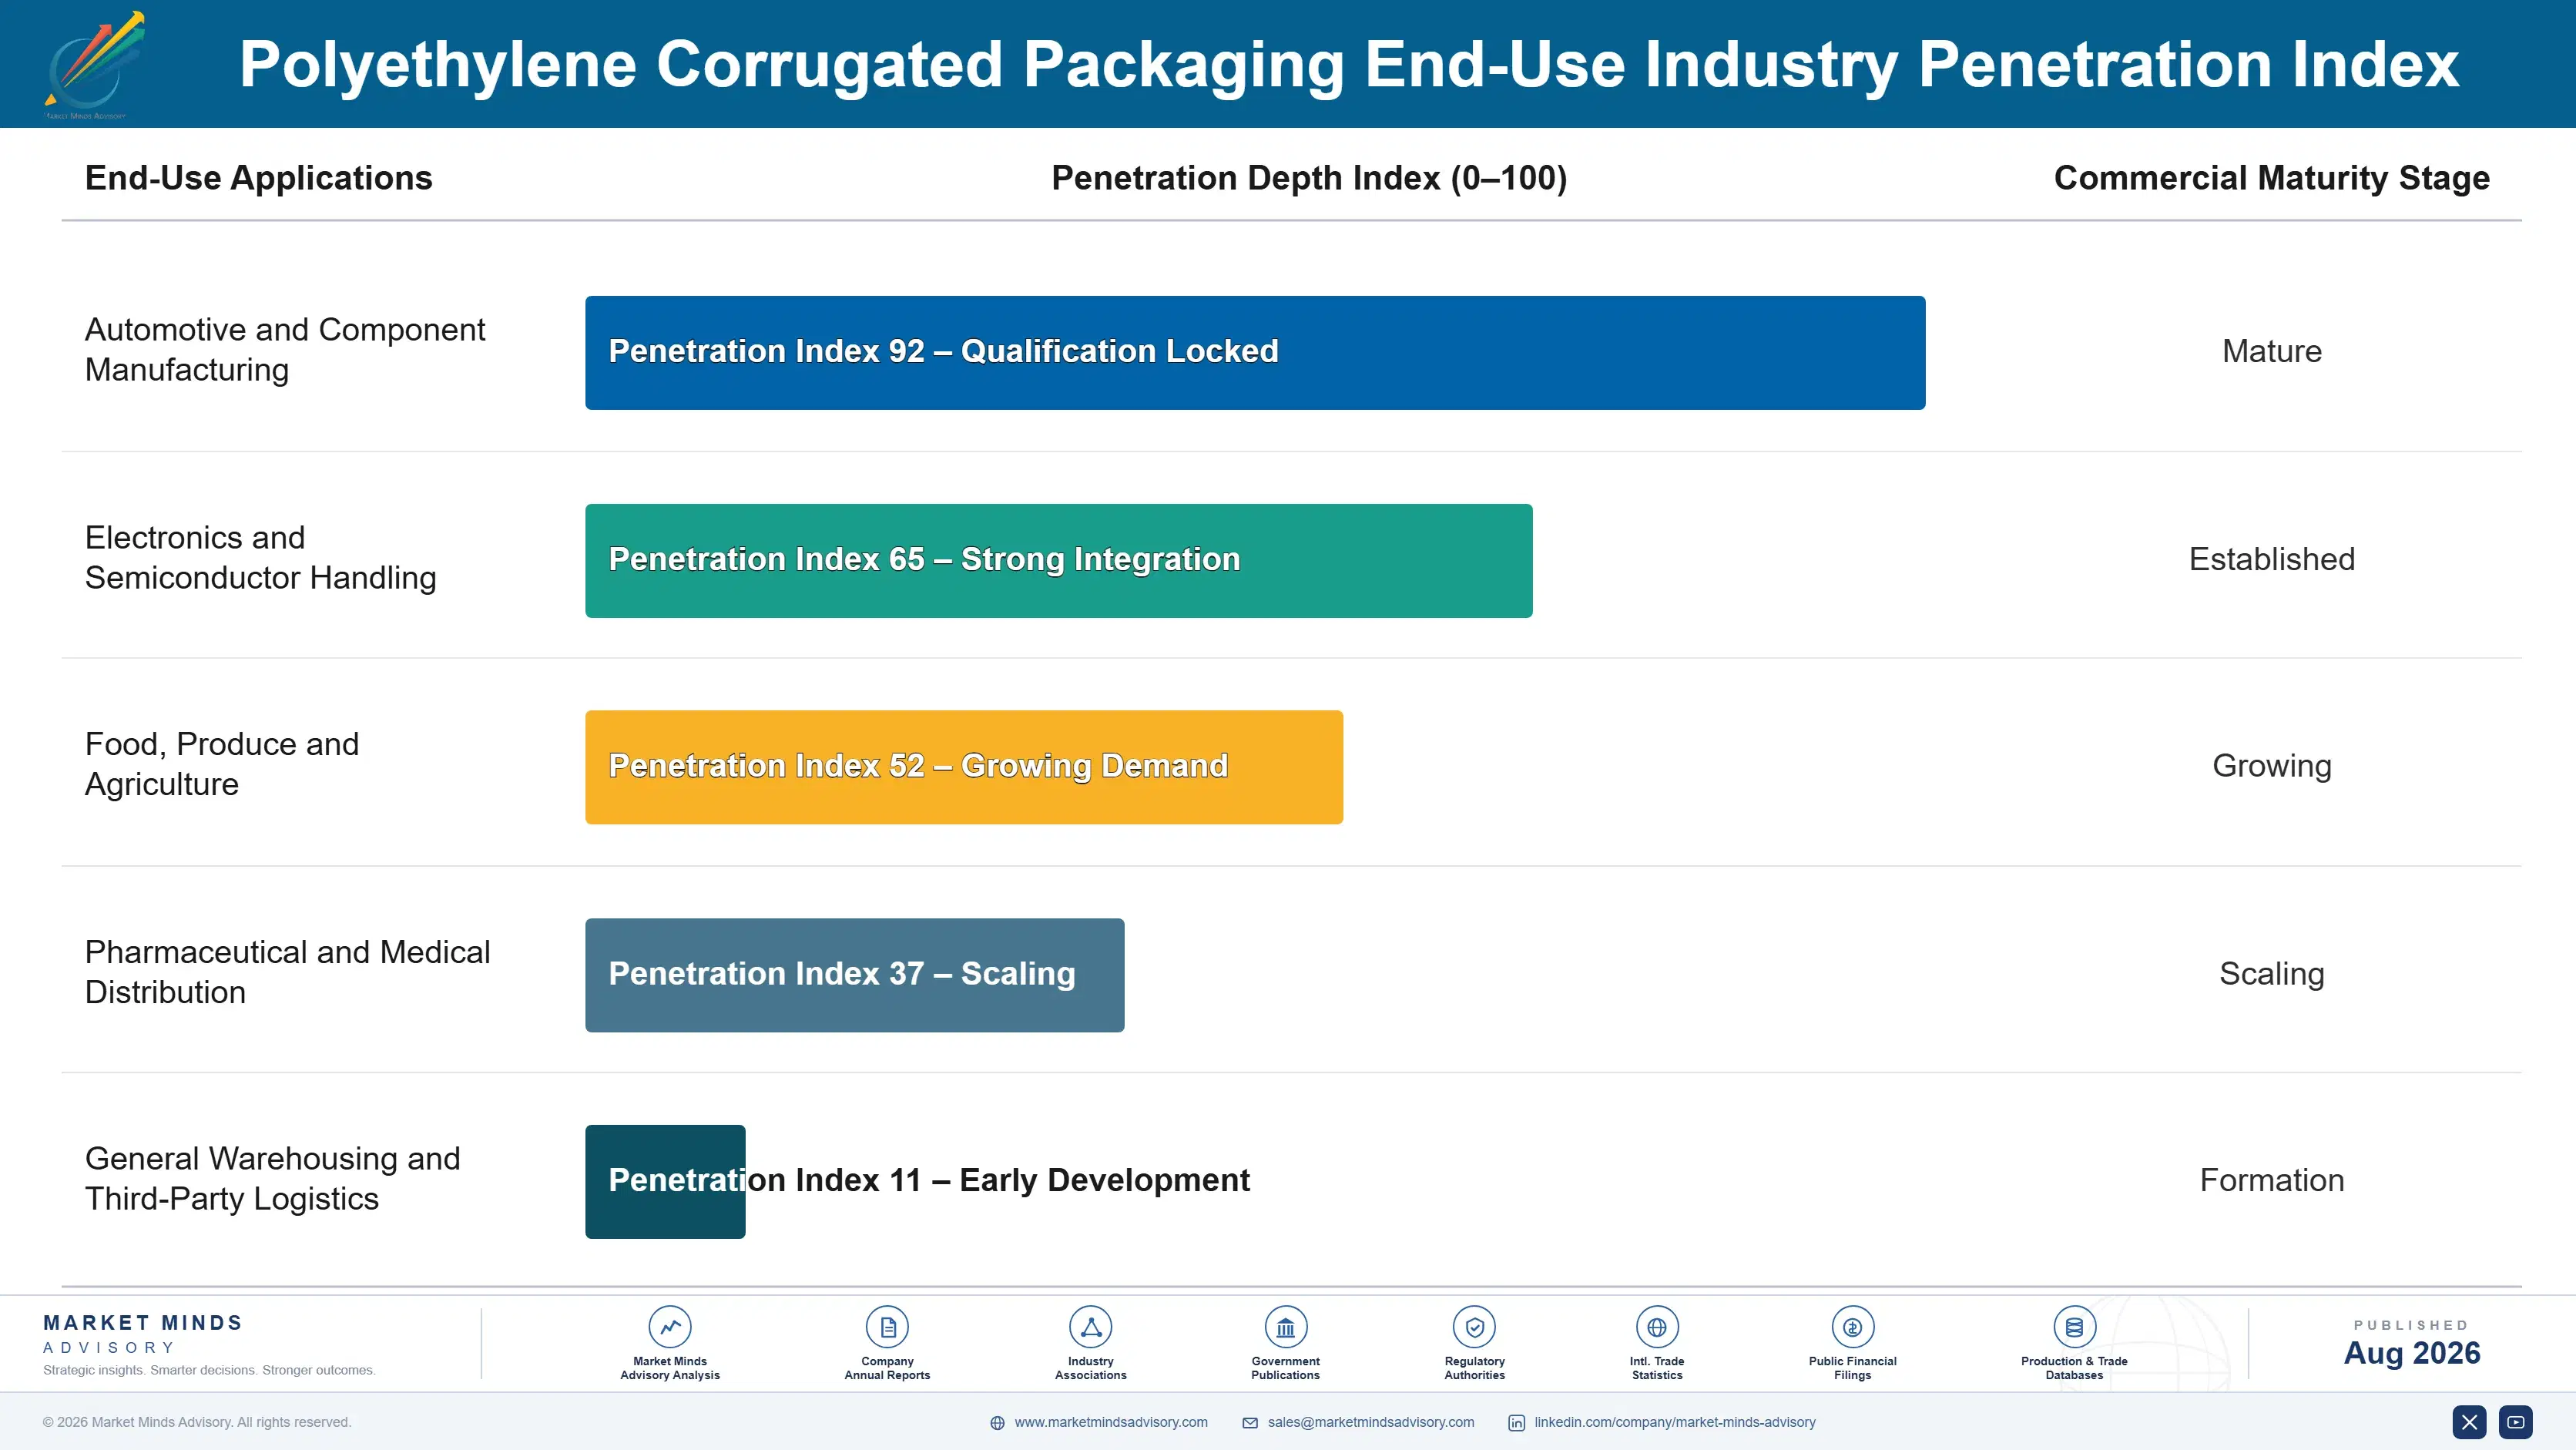
Depth varies by loop control and part value. Automotive and electronics manufacturers buy deepest, with fixed circuits, valuable components and measurable damage costs together. Food and produce distribution buys steadily where hygiene justifies it. General warehousing buys episodically and often abandons programmes when recovery disappoints. Retail-facing distribution buys least, because containers leaving a controlled network rarely come back.

The deciding population sits across two functions that rarely talk. Packaging or purchasing owns the container budget, and logistics owns the return leg that determines whether the programme works. Suppliers who model both, and present a single system cost, reach a decision the two functions could not reach separately. Presenting a single system cost is what gets a decision made.
polyethylene-corrugated-packaging-market-end-use-penetration-index-1787308657654

Where Container Producers Win

These are among the four positions where our research anticipates prominent divergence between winners and laggards over the coming forecast period. Each is grounded in the demand model, the regulatory perimeter, and the announced capacity pipeline.
01 / RETURN LOGISTICS MODELLING

The container is fine and the return leg was never costed

Reusable programmes get approved on container price and trip count with return transport, cleaning and storage treated as free, which is why so many are quietly abandoned in their second year. Recovery at 94% in closed loops against 63% in open distribution is the number that decides everything, and almost no buyer has measured their own. Suppliers who model the full system either build something durable or kill a bad programme early, and the second outcome protects the relationship better than a bad sale ever would.
02 / DAMAGE COST VISIBILITY

Scrapped parts are never attributed to the packaging

Fibreboard part damage gets scrapped at the line and rarely recorded against packaging at all, so the cost stays invisible until somebody measures it deliberately. Part-specific inserts and dunnage eliminate most of it, and once that figure exists the nine trip payback stops being the argument. Damage reduction reaches an operations budget rather than a capital committee that has already declined three similar proposals this year, and reductions of 40% or more are common once part-specific dunnage replaces loose fibreboard.
03 / DISSIPATIVE VERIFICATION CAPABILITY

Declared resistance stopped being accepted after boards failed

Electronics manufacturers now demand independently verified resistance performance on dissipative containers rather than accepting supplier-declared values, following component failures traced back to charge damage. That single change excludes most fabricators from a segment growing at 9.1% and carrying the best margins available in the whole category. Electronics supply chains also run closed loops naturally, so recovery supports the trip economics without any additional logistics design work being needed, which makes it the cleanest technical barrier available anywhere in this category.
04 / FIBREBOARD-PROOF APPLICATION TARGETING

Compete where the cardboard box simply does not survive

When the comparison is purely on cost, a fall in recovered fibre prices lengthens payback well past what any capital committee will approve, and the whole pipeline stalls at once. Where moisture, wash-down or chilled conditions destroy fibreboard in a single trip, that comparison does not exist. Produce, seafood, meat processing and food service all sit there, and most of them already run distribution closed enough to recover containers reliably, which means volume holds through cycles that stall every purely cost-driven programme.

Engagement Snapshot From the Field

A live engagement with an industry participant carrying material or product regulatory and market exposure ahead of a defining policy shift, showing how our research translates into a defensible multi-year portfolio strategy.
MARKET MINDS ADVISORY · CLIENT ENGAGEMENT SUMMARY
Polyethylene Corrugated Packaging Producer Strategic Portfolio Review and Transition Roadmap 2026·Investment Scenario on Polyethylene Corrugated Packaging Exposure Evaluation 2025-26
CLIENT PROFILE
A powertrain component manufacturer supplying four vehicle assembly plants across three countries from two production sites, with roughly EUR 1.2 billion in revenue (client-reported, unverified by MMA). A returnable container programme introduced in 2021 covered around 60% of shipped volume, and the business believed it was underperforming without knowing why. Return performance had never been measured by route.
STRATEGIC CHALLENGE
Container replacement purchasing had risen every year since launch and now exceeded the original fleet investment amortised annually. Operations attributed the losses to damage in handling. Nobody had reconciled containers shipped against containers returned by route, and the programme's payback model had never been revisited after approval. Three years of replacement spending had accumulated without anyone questioning the explanation.
MMA APPROACH
MMA reconciled outbound and inbound container movements by route across eighteen months, separating damage write-offs from containers that simply never came back. Return transport cost, cleaning and storage were costed against the original payback model, and recovery was compared between routes inside and outside the supplier park. Line-side part damage rates were compared against the pre-programme baseline.
KEY FINDINGS
  1. Recovery on the two routes inside the assembly supplier park ran at 91%, while the two longer cross-border routes recovered only 58%, and the payback model had assumed 95% across all four.
  2. Losses rather than damage accounted for 73% of replacement purchasing, which invalidated the handling damage explanation operations had been working to for three years.
  3. Return transport had never been costed at all, and empty return legs on the cross-border routes consumed roughly a third of the savings the programme was reporting.
  4. Line-side part damage had fallen by 44% since launch, a benefit worth considerably more than the container savings and one nobody had quantified or claimed.
CLIENT PROFILE
A powertrain component manufacturer supplying four vehicle assembly plants across three countries from two production sites, with roughly EUR 1.2 billion in revenue (client-reported, unverified by MMA). A returnable container programme introduced in 2021 covered around 60% of shipped volume, and the business believed it was underperforming without knowing why. Return performance had never been measured by route.
STRATEGIC CHALLENGE
Container replacement purchasing had risen every year since launch and now exceeded the original fleet investment amortised annually. Operations attributed the losses to damage in handling. Nobody had reconciled containers shipped against containers returned by route, and the programme's payback model had never been revisited after approval. Three years of replacement spending had accumulated without anyone questioning the explanation.
MMA APPROACH
MMA reconciled outbound and inbound container movements by route across eighteen months, separating damage write-offs from containers that simply never came back. Return transport cost, cleaning and storage were costed against the original payback model, and recovery was compared between routes inside and outside the supplier park. Line-side part damage rates were compared against the pre-programme baseline.
KEY FINDINGS
  1. Recovery on the two routes inside the assembly supplier park ran at 91%, while the two longer cross-border routes recovered only 58%, and the payback model had assumed 95% across all four.
  2. Losses rather than damage accounted for 73% of replacement purchasing, which invalidated the handling damage explanation operations had been working to for three years.
  3. Return transport had never been costed at all, and empty return legs on the cross-border routes consumed roughly a third of the savings the programme was reporting.
  4. Line-side part damage had fallen by 44% since launch, a benefit worth considerably more than the container savings and one nobody had quantified or claimed.
RECOMMENDED STRATEGY
Phase 1: Phase 1 (months 1 to 4): Move the two cross-border routes to one-way containers and confine the returnable fleet to the supplier park circuits. Phase 2: Phase 2 (months 4 to 12): Rebuild the payback model with measured recovery and full return transport cost, then reissue it to finance. Phase 3: Phase 3 (months 12 to 20): Quantify and claim line-side damage reduction as the primary programme benefit rather than container cost savings.
OUTCOME
Container replacement purchasing fell by approximately 61% within eight months of confining the fleet to controlled circuits (client-reported, unverified by MMA). The rebuilt payback model showed the programme genuinely profitable once damage reduction was included, where the original had been marginal and wrong in both directions (client-reported, unverified by MMA). Return logistics are now costed at approval rather than assumed.

Frequently Asked Questions

Foundational context covering the market sizes, CAGR, scope, country, region and competition that inform every finding below. This section is provided to cover basics and most often pre-purchase conversations, answered from the MMA Primary Research Dataset.

What is the current size of the Polyethylene Corrugated Packaging Market?

The global market was worth USD 2.1 billion in 2025, reaching USD 2.25 billion in 2026. East Asia holds the largest regional share at 29% of demand.

How large will the Polyethylene Corrugated Packaging Market be by 2036?

MMA forecasts USD 4.51 billion by 2036, an expansion multiple of 2.00 times the 2026 base. That represents roughly USD 2.26 billion of incremental value.

What is the CAGR for the Polyethylene Corrugated Packaging Market 2026 to 2036?

The base case compounds at 7.2% annually, with a bull case of 8.4% and a bear case of 6.0%. Historical growth from 2020 to 2025 ran at 5.9%.

Which segment is growing fastest?

Closed-loop returnable tote systems compound at 10.8%, exactly 1.50 times the market rate. Recovery near 94% in controlled circuits is what makes the trip economics work.

Who are the major companies in the Polyethylene Corrugated Packaging Market?

Coroplast, DS Smith Plastics, Inteplast Group, Karton and Primex Plastics together hold a combined 36%. Fabrication and programme design rather than extrusion sustains those positions.

Which country is growing fastest?

India compounds at 10.2%, ahead of every other national market. Automotive and two-wheeler manufacturers there are converting their parts handling to returnable containers at pace.

Report Segmentation Architecture

The full report scope spans multiple orthogonal segmentation dimensions, with cross-tabulated demand data provided for each dimension pair. Coverage extends further to regional breakdowns, trend trajectories, and the competitive detail needed to support segment-level decision-making.

By Container Function and Loop Design

  • Closed-Loop Returnable Tote Systems
  • Protective Layer Pads and Dividers
  • One-Way and Limited-Trip Shipping Boxes
  • Dunnage and Part-Specific Inserts
  • Printed Retail and Display Formats
  • Electrostatic-Dissipative Containers

By End-Use Industry

  • Automotive and Component Manufacturing
  • Electronics and Semiconductor Handling
  • Food, Produce and Agriculture
  • Pharmaceutical and Medical Distribution
  • General Warehousing and Third-Party Logistics

By Commercial Dimension

  • Direct Supply to Manufacturers
  • Pooling and Loop Management Services
  • Distributor and Industrial Supply Channel
  • Sheet Supply to Independent Fabricators

By Region

  • North America
  • Western Europe
  • East Asia
  • South Asia and Pacific
  • Latin America
  • Middle East and Africa
  • Eastern Europe

Scope, Methodology, and Coverage

Every figure in this report is reproducible from documented input assumptions. The scope below maps the historical period, the forecast horizon, the segmentation dimensions, and the countries covered, alongside the underlying primary and qualitative methodology.
Historical Period
2020 to 2025
Forecast Period
2026 to 2036
Base Year
2025 (USD billions; MMA Primary Research Dataset, August 2026)
Market Definition
The market covers extruded twinwall and multiwall polyolefin corrugated sheet and the containers fabricated from it, spanning closed-loop returnable tote systems, protective layer pads and dividers, one-way and limited-trip shipping boxes, dunnage and part-specific inserts, printed retail and display formats, and electrostatic-dissipative containers, together with the pooling and loop management services supplied alongside them. Corrugated fibreboard packaging, injection-moulded crates and bins, rigid intermediate bulk containers, thermoformed trays, and pallets are excluded. Sizing is measured at producer revenue in current prices.
Quantitative Units
USD billions (current prices); sheet area in square metres, container units and trip counts where applicable
Segmentation Dimensions
By Container Function and Loop Design; By End-Use Industry; By Commercial Dimension; By Region
Regions Covered
North America, Western Europe, East Asia, South Asia and Pacific, Latin America, Middle East and Africa, Eastern Europe
Countries Covered
USA, China, Germany, France, UK, Japan, South Korea, India, Australia, Canada, Brazil, Mexico, Indonesia, Vietnam, Thailand, Malaysia, Taiwan, UAE, Saudi Arabia, South Africa, Turkey, Poland, Netherlands, Italy, Spain, Sweden, Czech Republic, Slovakia, Hungary, Chile, and additional markets relevant to this sector
Key Companies Profiled
Coroplast, DS Smith Plastics, Inteplast Group, Karton, Primex Plastics, Distriplast, Corex Plastics, Twinplast, Plasgad Plastic Products, Sabic Polymershapes, Northern Ireland Plastics, Kartonplast, Yamakoh, Shanghai Naxilai Plastic, Suzhou Sanjiang Plastic, Gilman Brothers, Simona Plastics, Akyapak Plastik, Regency Plastics, Polymer Solutions International
Quantitative Methodology
Primary survey, n=3,800 respondents, Q4 2025, six countries; demand-side model with trade association cross-validation
Qualitative Methodology
47 expert interviews, Q4 2025; applied to validate demand model assumptions, identify emerging dynamics, and assess competitive positioning
Report Format
PDF and XLSX data workbook (Word format preview document)
Publisher
Market Minds Advisory
Report Code
MMA-2026-PAC-864
Published
August 2026
Contact
sales@marketmindsadvisory.com | www.marketmindsadvisory.com

Purchase the full Polyethylene Corrugated Packaging Market Report (2026 to 2036).

The full report sizes polyolefin corrugated packaging across six container classes, three commercial dimensions and seven regions, with annual forecasts to 2036 under base, bull and bear scenarios. Recovery rates are measured by loop design and route type, which is the variable that determines whether any programme reaches payback at all. Total system cost including return transport, cleaning and storage is modelled against fibreboard alternatives at current and historical prices. Dissipative resistance verification practice is assessed across the fabricator base. Twenty producers are profiled on a consistent sheet and container revenue basis.
Recovery rates measured by loop design and route type
Total system cost modelled against fibreboard at varying prices
Line-side damage reduction quantified by component and industry
Dissipative resistance verification practice assessed across fabricators
Fleet attrition rates tracked by application and handling environment
Reusable format regulatory exemptions mapped by jurisdiction

Built For The People Who Decide

From boardroom strategy to bench-side execution, this report is read cover-to-cover by leaders shaping the next decade of their industry, turning demand scenarios, market dynamics and valuation benchmarks into decisions.
CXOs/ Presidents/ VPs/ Managers
M&A and Corporate Development
Strategy Teams and R&D Heads
Procurement and Product Directors
Regulatory and Compliance Leaders
Investor Relations and Equity Analysts