Market Minds Advisory
Plastic Bottles Market

Plastic Bottles Market: Shipping Air Is Why This Industry Looks The Way It Does

A trailer of empty bottles is 96% air. That single fact produced on-site blow moulding, fifteen year installations inside customer plants, and a competitive structure that has nothing to do with price per bottle.

Lead Analyst

Bilal Shaikh

Published

September 2026

Make Smarter Decisions with Customized Research Insights

Request a free sample report and evaluate market opportunities, growth trends, and competitive dynamics relevant to your business needs.

2025 MARKET VALUE$128.0BMarket Size 2025
2036 FORECAST VALUE$205.6BBase Case , 2026 to 2036
CAGR 2026 TO 20364.4 %Bull 5.6% / Bear 3.2%
INCREMENTAL OPPORTUNITY$71.9BNet 10- year value creation
EXPANSION MULTIPLE1.54x2036 value over 2026 base
Strategic Levers
M&A Pipeline
Regional Outlook
Country Rankings
Competitive Intelligence
Segmental Deep-dive
Call-Us : 91 93563 13602

Executive Snapshot and Market Trajectory

A loaded trailer of empty bottles is roughly 96% air, and that single physical fact has shaped everything commercial about this industry. Producers install blow moulding lines inside their customers' filling plants rather than shipping empties, which turns a supply agreement into a fifteen year physical installation.
The market reaches USD 128.0 billion in 2025 and compounds at 4.4% to USD 205.55 billion by 2036. Bio-based and compostable polymers grow fastest at 6.6%, exactly 1.50 times the market rate, from a genuinely small base. East Asia holds 30% of value on Chinese beverage volume, while South Asia and Pacific takes 15%, above the band this framework applies, on bottled water and beverage penetration climbing fast across India and Southeast Asia.
Concentration sits at 22% across the top five, high where on-site plants exist and low everywhere else, which is really two entirely different markets sharing a single product. Recycled content mandates have produced an odd inversion of the usual economics: food-grade recycled PET now trades roughly 28% above virgin resin. Deposit return infrastructure has therefore become the critical supply asset rather than any recycling technology anybody has built.
Market Definition
The plastic bottles market covers rigid blow-moulded plastic containers with a neck finish designed for liquid or flowable products, spanning polyethylene terephthalate, high-density polyethylene, polypropylene, low-density polyethylene and other polyolefins, bio-based and compostable polymers, and multi-layer barrier resin constructions. Closures and caps sold separately, preforms traded as intermediates, jars and wide-mouth containers without a defined neck, flexible pouches, aerosol containers, glass and metal bottles, and blow moulding machinery are excluded.
Base Year Value
$128.0B in 2025 (MMA Primary Research Dataset, August 2026)
Forecast Period
2026 to 2036, eleven discrete annual values
CAGR
4.4% base case. Bull 5.6%. Bear 3.2%.
Fastest Growth Segment
Bio-Based And Compostable Polymers: 6.6% CAGR
Fastest Growth Country
India: 7.6% CAGR
Fastest Growth Region
South Asia and Pacific: 6.8% CAGR
Largest Region
East Asia: 30% of 2025 global value
Market Leaders
ALPLA, Amcor, Berry Global, Plastipak Holdings, Graham Packaging. Source: MMA Primary Research Dataset, July 2026.
Primary Survey
n=3,800 procurement and R&D decision-makers, Q4 2025, six countries
Methodology
Demand-side build-up, cross-validated against public data, 47 expert interviews

Plastic Bottles Market Forecast Scenarios

plastic-bottles-market-size-forecast-scenario-1787298220572
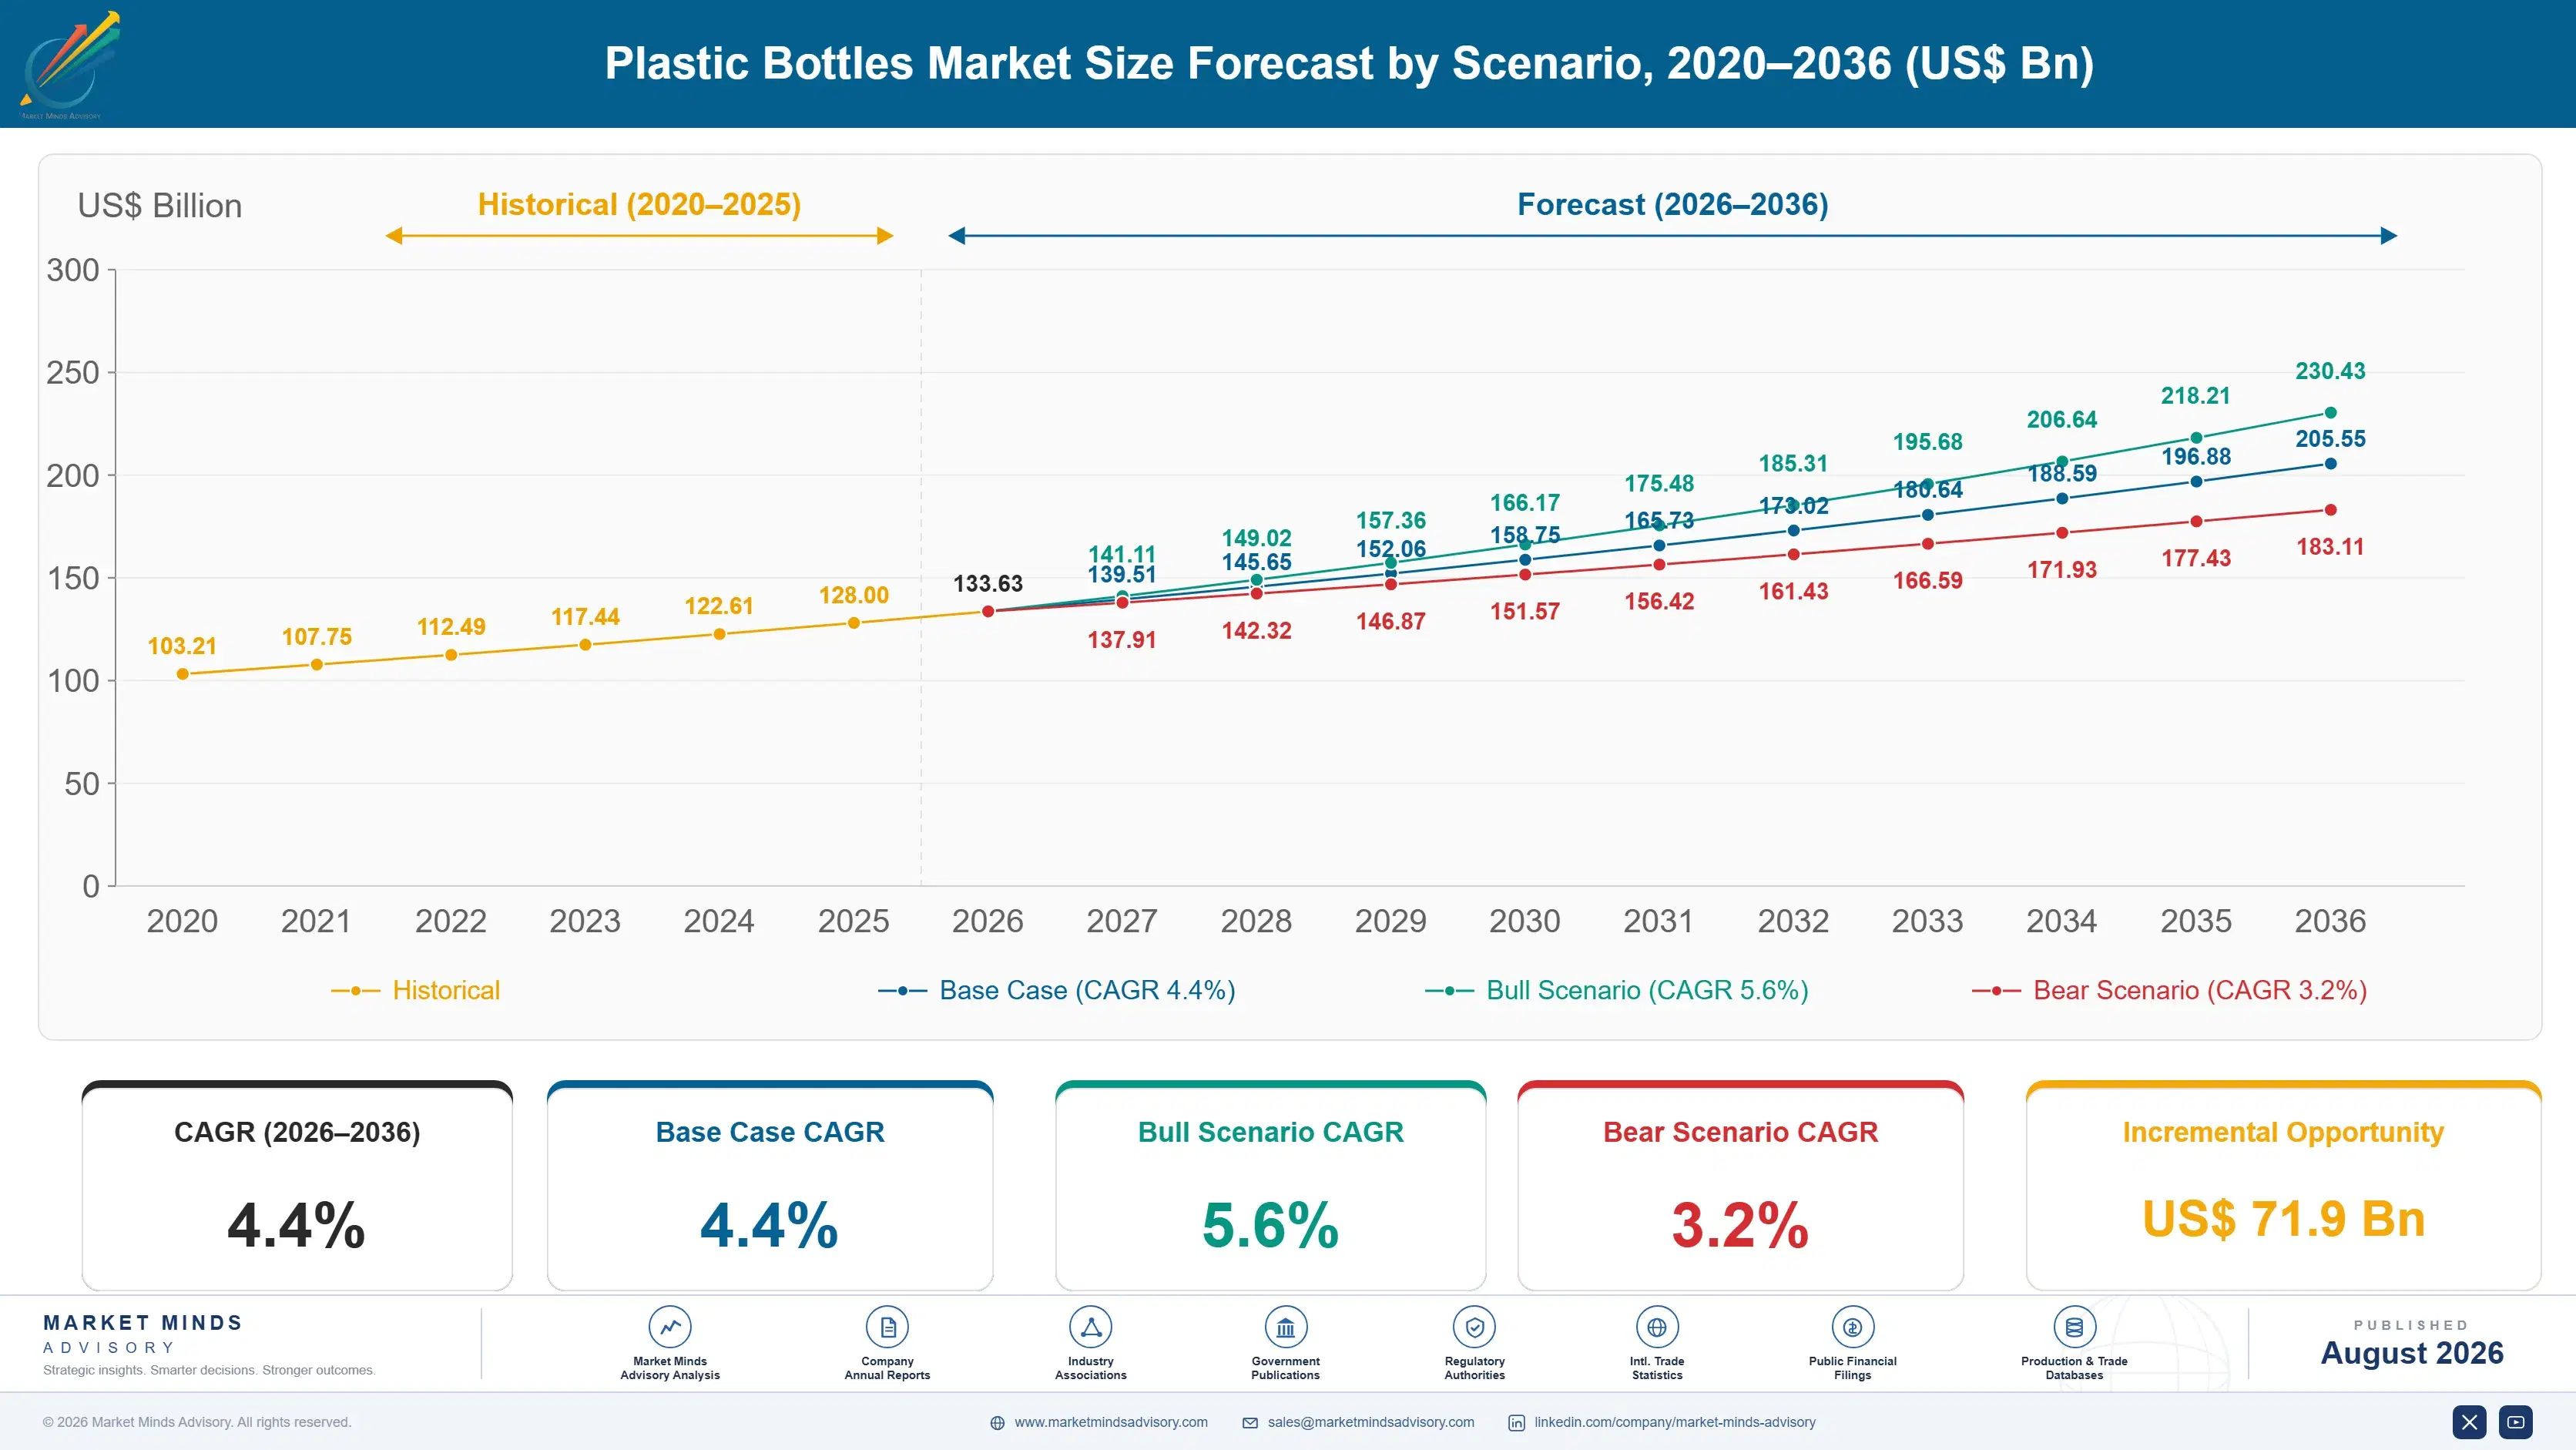
Between 2020 and 2025 this market was pulled by channel and pushed by resin. On-premise beverage consumption collapsed through 2020 while retail multipacks surged, and the mix reversed unevenly afterwards. Resin pricing then moved violently in both directions, and recycled content mandates arrived faster than food-grade recyclate supply could respond. A 3.3% historical CAGR averages a channel shock against a real cost inflation cycle.
Three mechanisms carry the 4.4% base case. Asian beverage penetration is the largest, since bottled water and packaged drinks are still converting from loose and untreated consumption across India and Southeast Asia. Recycled content compliance is the second, because food-grade recyclate costs more than virgin resin and pushes realised value per bottle upward. And personal care premiumisation is the third, adding barrier layers and decoration that plain containers never carried at all.
The 5.6% bull case rests on deposit return schemes spreading across major Asian markets, which would raise collection yields toward the 88% those systems achieve elsewhere and finally close the recyclate supply gap constraining compliance. The 3.2% bear case is refill and concentrate formats scaling in household and personal care, since a refill pouch removes a bottle outright rather than substituting its material.

The Economics Of Moving Nothing

Everything commercially interesting about this industry follows from freight. An empty bottle is almost entirely air, so trucking finished containers more than a couple of hundred kilometres destroys the margin before they arrive. The industry's answer was to move production into the customer's building: blow moulding lines installed inside filling plants, feeding the line directly, under agreements running ten to fifteen years. Roughly 34% of global volume now works this way.
TOP FIVE CONCENTRATION22%Concentrated where on-site plants exist, fragmented everywhere else
ON-SITE PRODUCTION SHARE34%Portion of bottles blown inside the filler's own plant
RECYCLED RESIN PREMIUM28%Amount food grade recyclate costs above equivalent virgin material
BOTTLE WEIGHT REDUCTION40%Lightweighting achieved on a standard water container since launch
EMPTY FREIGHT RATIO96%Share of a loaded trailer occupied by air alone
DEPOSIT RETURN YIELD88%Collection rate achieved where deposit systems currently operate
That structure explains a concentration figure that otherwise looks contradictory. Where on-site installations exist, switching supplier means removing equipment from a working production line, and nobody does that over price. Where bottles are still shipped, competition is brutal and regional. The same product supports two entirely different commercial models, and a top five share of 22% is the average of a very concentrated market and a very fragmented one.
Recycled content rules have inverted the usual economics of recycling. Food-grade recycled PET trades roughly 28% above virgin resin because mandated demand outran the supply of clean, collected, food-approved material. Deposit return systems achieve 88% collection where they operate against far lower rates for kerbside collection, which makes deposit infrastructure the strategic asset rather than any recycling technology.
"People assume recycled resin is the cheap option. It costs more than virgin, and it will keep costing more until somebody builds the collection systems. The bottleneck was never the recycling plant; it was always the bin."
Director, Rigid Packaging And Polymer Circularity Practice · MMA Packaging Pract

Market Trends

Recycled Resin Costs More Than The Virgin Material

Mandated recycled content in food contact bottles arrived considerably faster than the supply of clean, collected, food-approved recyclate, and the predictable result is that food-grade recycled PET now trades roughly 28% above virgin resin. That inverts every assumption about recycling economics that the industry built its sustainability commitments on. Brands are now paying a premium for the privilege of using waste. The binding constraint is collection rather than any shortage of processing capacity, which is precisely why deposit return infrastructure has become the strategic asset in this market rather than any recycling technology.
Market Impact: Consumption below 25 litres yearly
Lightweighting Has Very Nearly Run Its Course

A standard water bottle weighs roughly 40% less than its equivalent did in 2000, achieved through preform redesign, neck finish reduction, and base geometry work across two decades of sustained engineering. What remains is measured in fractions of a gram and runs into genuine performance limits on top load, drop resistance, and line handling. The lever that delivered material and cost reduction for a generation is essentially exhausted, which pushes engineering attention toward recycled content qualification and reuse formats instead. Producers still presenting lightweighting roadmaps are promising something they cannot deliver.
Market Impact: Value rises 3 times per unit

Market Opportunities and Growth Drivers

Asian Beverage Penetration Converts Untreated Consumption

Bottled water and packaged beverages are still displacing untreated municipal supply and loose sales across India, Indonesia, Vietnam, and much of inland China, and each converted litre adds bottle demand permanently rather than cyclically. Indian bottled water consumption per head remains a small fraction of any developed market benchmark and rises every year with urbanisation and rising disposable income. Small format single-serve bottles dominate because they match how households actually purchase. This is comfortably the largest single volume driver anywhere in this market, and it has decades left to run before penetration approaches developed market levels.
Market Impact: Refill removes 30% of units

Personal Care Premiumisation Adds Layers And Decoration

Household and personal care bottles have moved from plain single-layer containers toward multi-layer barrier structures, in-mould labelling, textured finishes, and colour matching that a commodity blow moulder cannot deliver reliably. Brands treat the bottle as the primary shelf differentiator in categories where the formulation is broadly undifferentiated. Value per unit rises considerably even where the number of bottles shipped does not, and the technical requirement narrows the supplier field sharply to those holding decoration and multi-layer capability. Qualification with a brand runs nine to fifteen months and rarely reverses afterwards.
Market Impact: Kerbside yields under 50 percent

Market Restraints and Challenges

Refill And Concentrate Formats Remove Bottles Permanently

A refill pouch or a concentrate tablet displaces every bottle it replaces across the service life of the original container, which is a permanent removal rather than a substitution between materials. The root cause is that household and personal care products are mostly water, and shipping water in bottles is expensive for everybody involved. Commercially this shrinks the addressable unit count in the highest value categories. Participants are mitigating through supplying the refill formats themselves, through durable reusable primary containers, and through beverage categories where refill remains impractical on hygiene grounds.
Market Impact: Recyclate costs 28% above virgin

Food-Grade Recyclate Supply Cannot Meet Mandated Demand

Recycled content requirements bind on dates set by legislation while the collected, sorted, food-approved material to meet them simply does not exist in sufficient volume. The root cause is collection yield rather than processing: deposit systems reach 88% while kerbside collection across most markets falls far short of it. Commercially this drives recyclate pricing above virgin resin and leaves brands facing genuine non-compliance risk. Mitigation runs through investment in deposit return infrastructure, through long-term recyclate offtake contracts, and through chemical recycling routes that remain expensive and unproven at any real scale.
Market Impact: Weight already down 40 percent
2 additional market trends, 4 additional growth drivers, and 3 additional restraints and challenges are covered in the full report. Contact sales@marketmindsadvisory.com to access the complete intelligence.

Segment CAGR and Growth Architecture

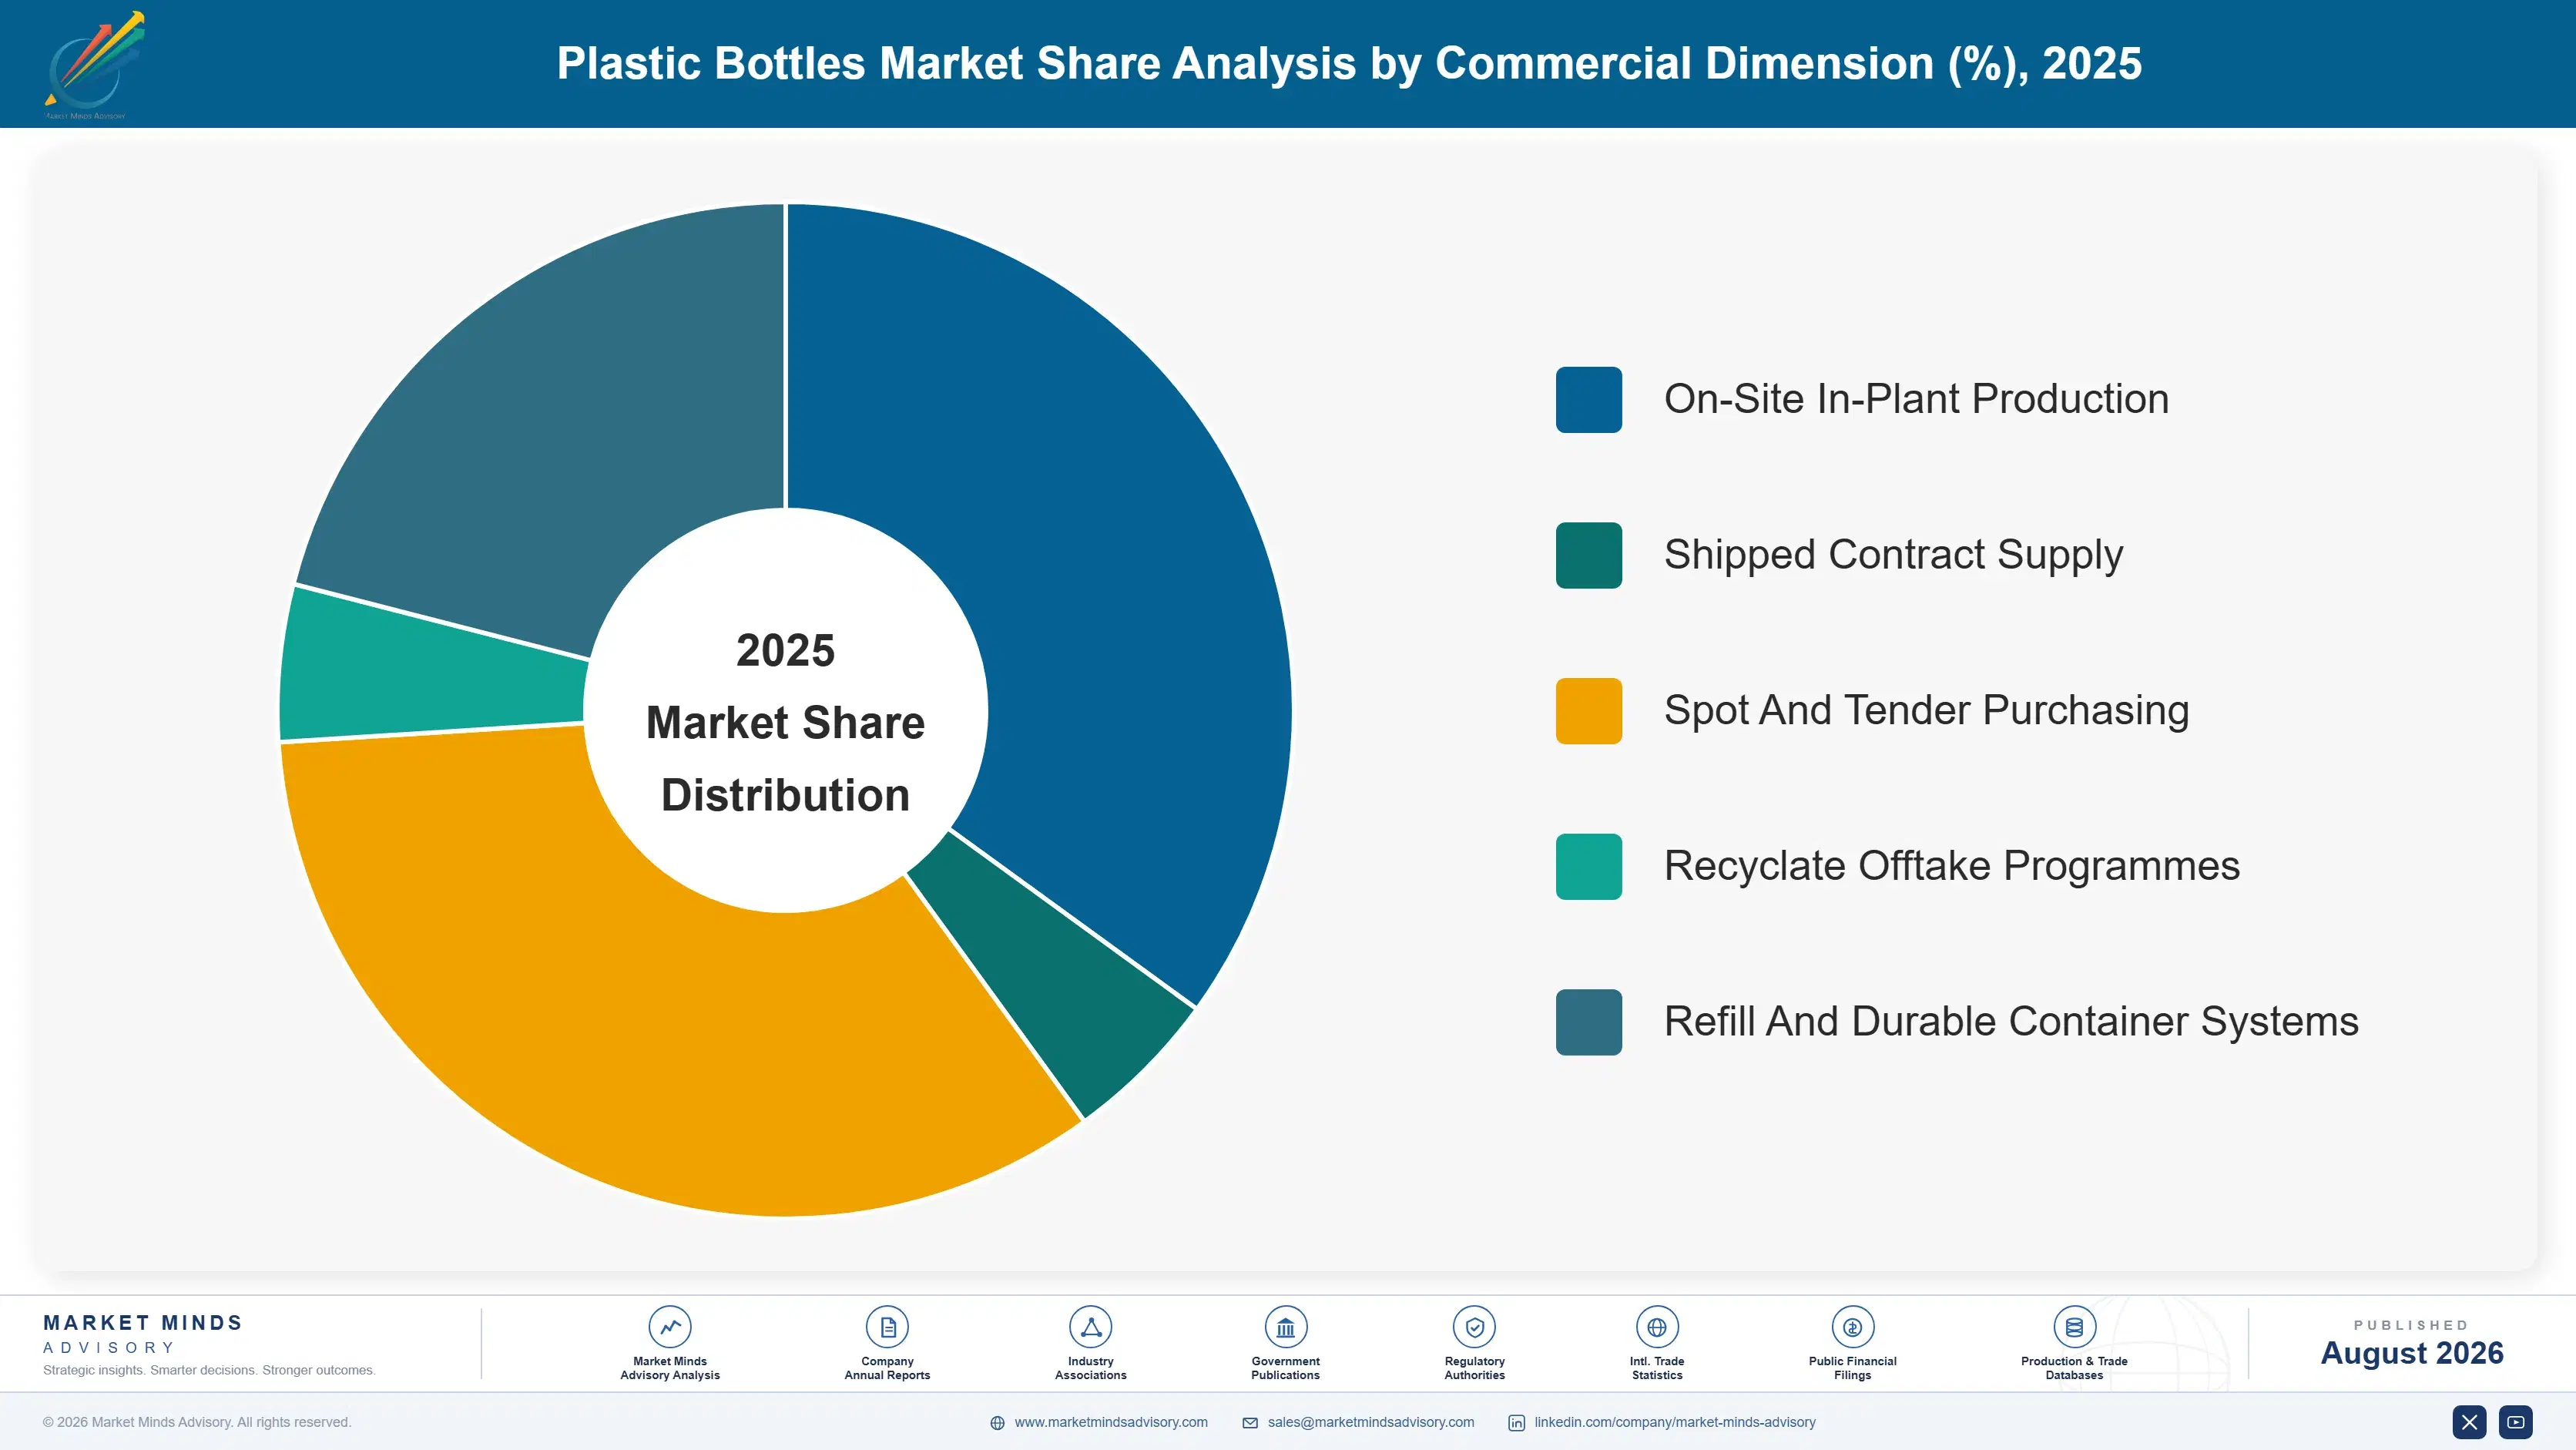
Segmentation follows resin type, because the polymer determines the blow moulding process, the barrier and clarity achievable, the recycled content that can legally be used in food contact, and which producers hold the relevant approvals. Container size, end-use category, and production model are handled in the framework and in commentary rather than being treated as segments here.
plastic-bottles-market-market-share-analysis-1787298221103

Bio-Based And Compostable Polymers

Bio-based and compostable polymers grow fastest at 6.6%, exactly 1.50 times the market rate, from a base small enough that the percentage flatters what is actually shipping. Bio-based polyethylene terephthalate and polyethylene are chemically identical to conventional resin and recycle in the same streams, which makes them the practical choice, while genuinely compostable polymers struggle on barrier and on the absence of composting infrastructure. Cost runs well above conventional resin in every case. Brand commitments rather than regulation or any performance advantage carry the adoption here, and several of those commitments have quietly been deferred over the past two years. Recycling stream compatibility matters more than the feedstock origin does.
CAGR 6.6%

Polyethylene Terephthalate

Polyethylene terephthalate grows at 5.1% and remains the volume engine of this market by a very wide margin, dominating water, carbonated drinks, juices, and increasingly household products on clarity, strength, and recyclability together. It is also the resin recycled content mandates target hardest, which is why food-grade recycled PET now costs roughly 28% more than virgin material. Preform and two-stage production suits on-site installation particularly well, since preforms ship efficiently while finished bottles do not. That is why beverage in-plant lines almost all run this resin. Asian capacity additions have run well ahead of Western ones for a decade, and Indorama and other integrated producers control much of the underlying resin supply into this market.
CAGR 5.1%
Full segment breakdown across 6 segments available in the complete report.

Regional Architecture and Country Demand Map

Freight economics mean bottles are produced close to where they are filled, so regional shares here track beverage and household product filling capacity rather than resin production or consumer spending. One region sits outside this framework's bands as a direct consequence of that filling capacity distribution.

East Asia

East Asia holds 30% of value, the largest share of any region, on Chinese beverage filling capacity that exceeds anything else in the world by a considerable margin. Bottled water, tea, and dairy drinks all consume very large volumes, and domestic producers including Zhuhai Zhongfu supply most of it at prices imported containers could never match. On-site installation is less common than in Western markets, with regional blow moulders shipping short distances instead. Japanese and Korean production is technically sophisticated and heavily lightweighted. Recycled content regulation is developing but not yet binding at European levels. Growth at 5.0% exceeds the global rate on continued beverage volume expansion across the region.
Share: 30% | CAGR: 5.0% (2026 to 2036)

South Asia and Pacific

South Asia and Pacific takes 15% of value against a 12% ceiling in this framework, and Indian bottled water conversion explains most of the breach. Per capita bottled water consumption in India remains a small fraction of developed market levels while rising every single year with urbanisation, unreliable municipal supply, and rising incomes together. Small single-serve formats dominate here because they match household purchasing patterns rather than reflecting any consumer preference. Indonesian and Vietnamese beverage volumes are growing along broadly similar trajectories from comparably low bases. Collection infrastructure is almost entirely informal, which constrains any recycled content ambition. Growth at 6.8% is the fastest of any region in this forecast.
Share: 15% | CAGR: 6.8% (2026 to 2036)
Regional intelligence for 5 additional markets available in the complete report: North America, Western Europe, Latin America, Middle East and Africa, Eastern Europe. Contact sales@marketmindsadvisory.com.
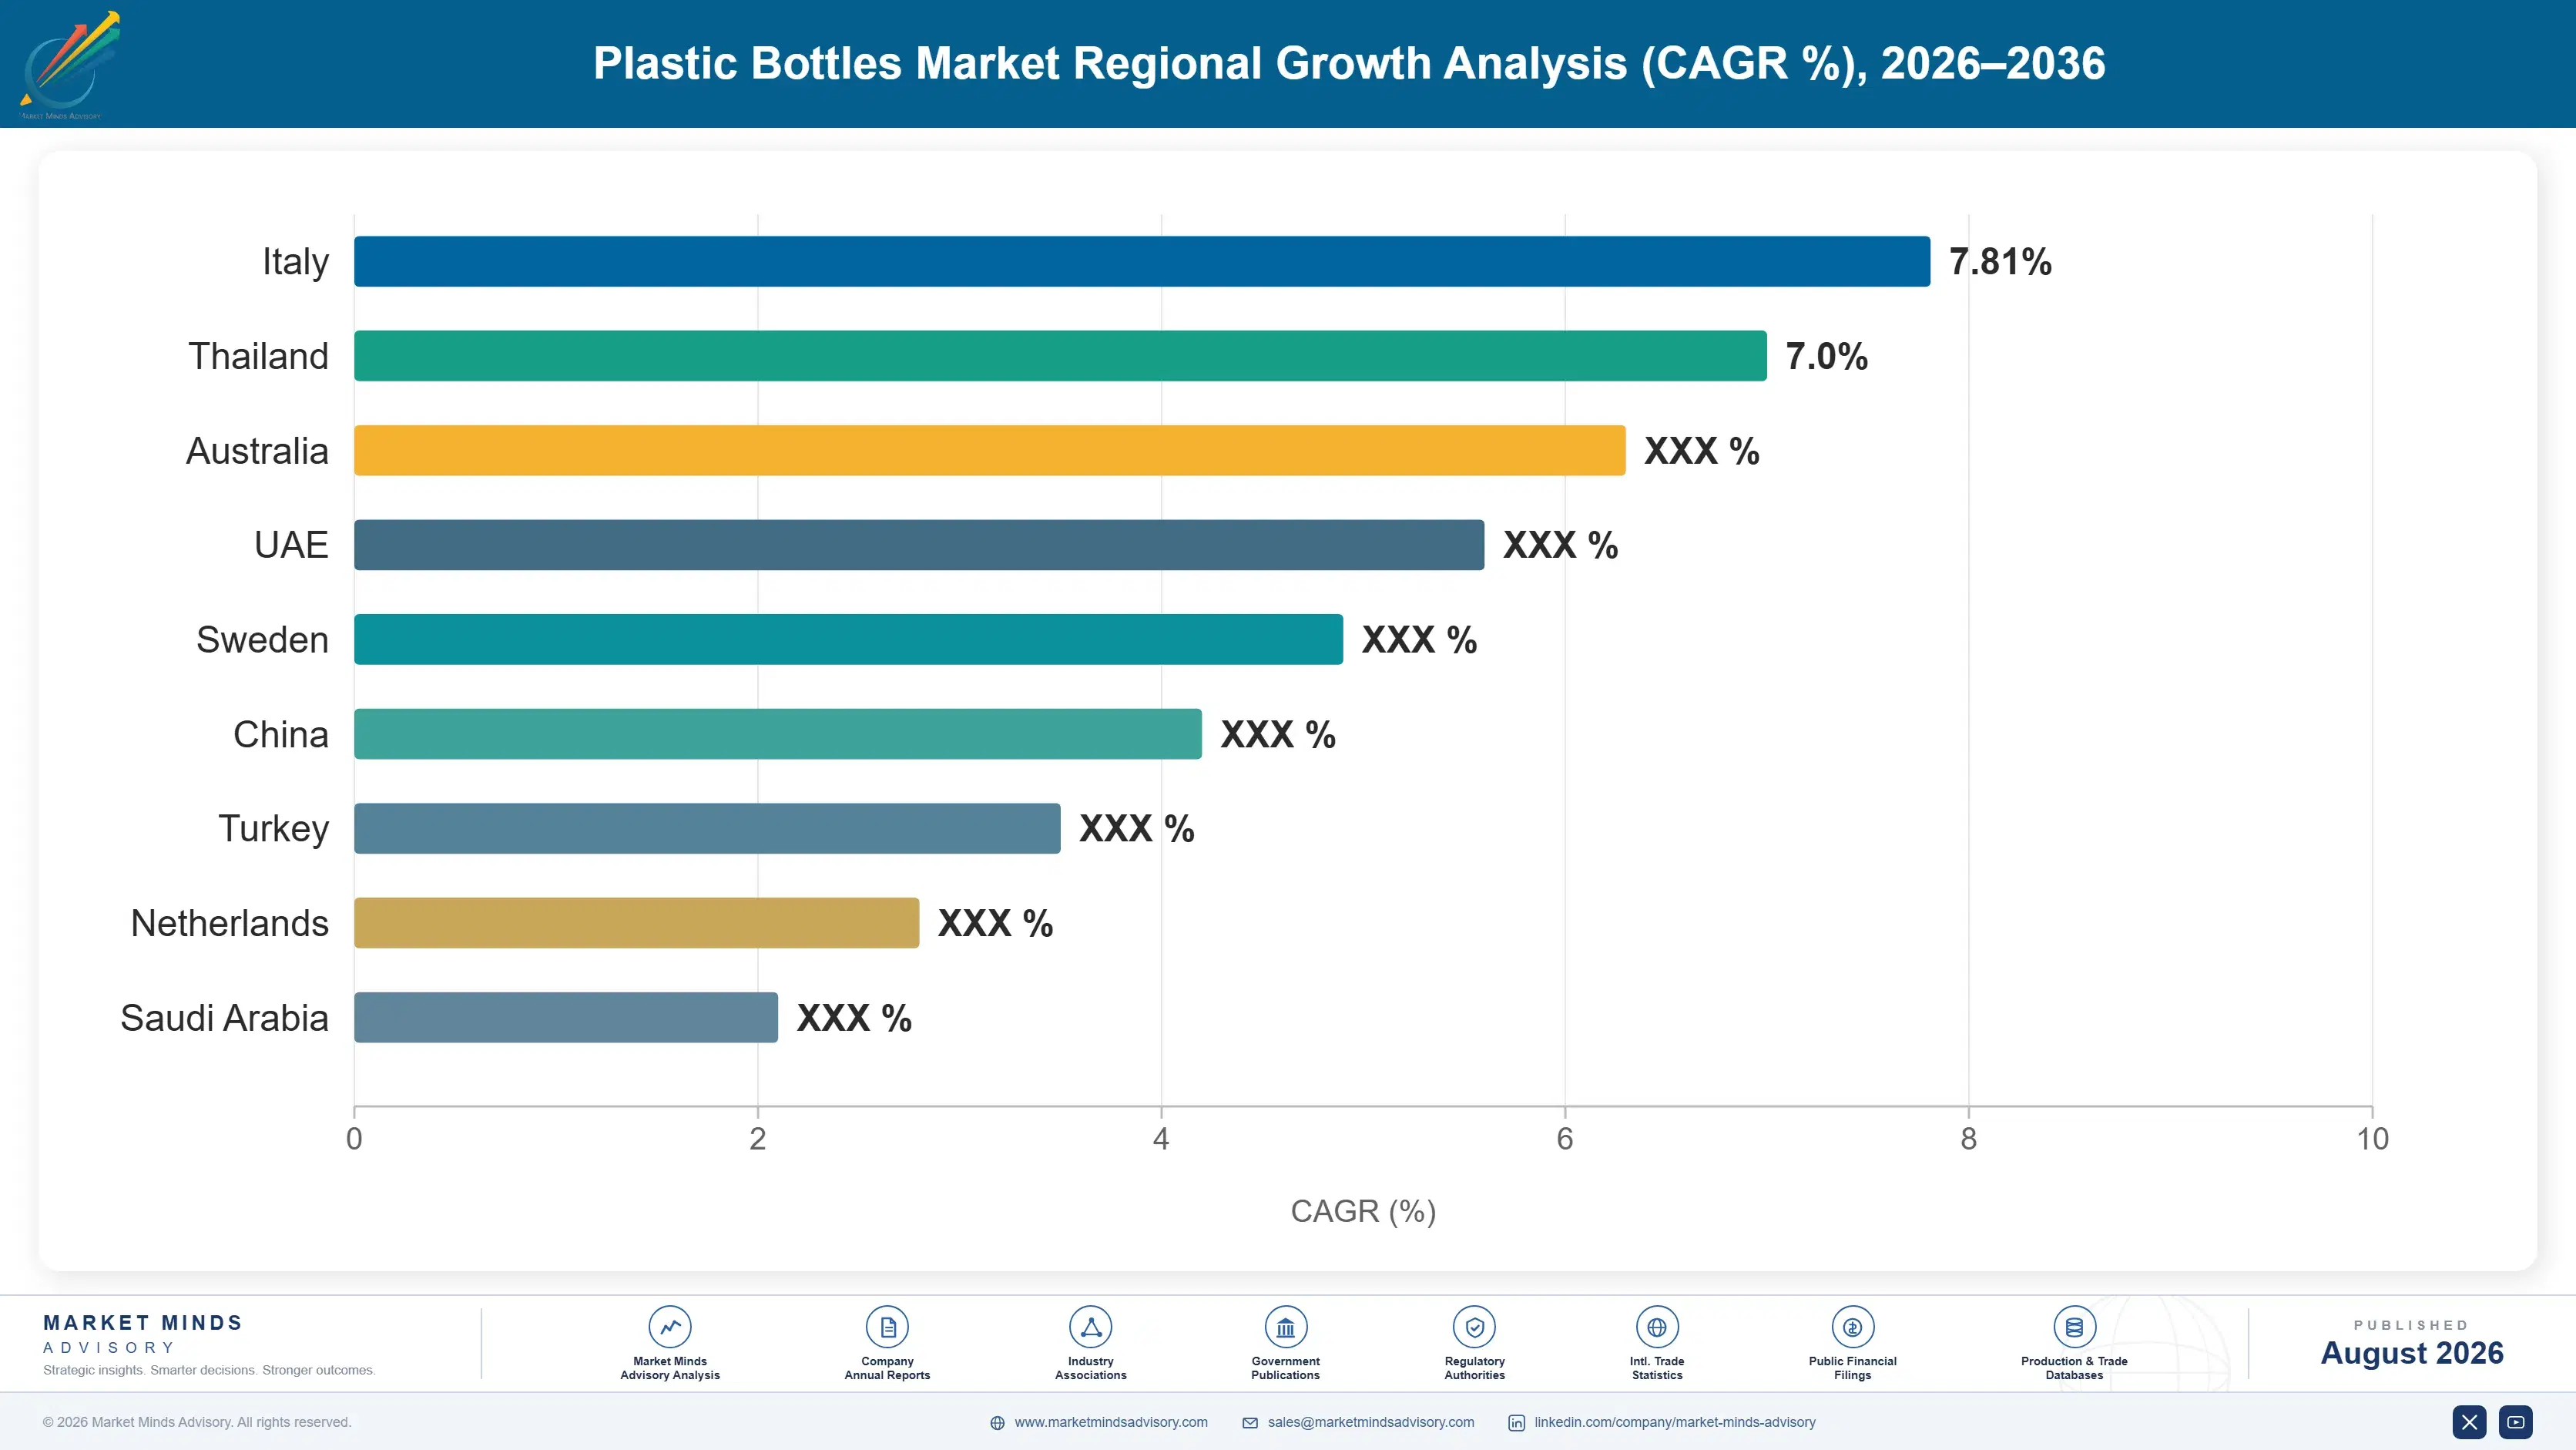
plastic-bottles-market-country-cagr-analysis-1787298221616

Getting Inside The Customer's Building

Price per bottle is a losing conversation in a product this standardised, so every lever here works by changing the physical or contractual relationship instead. On-site installation, recyclate supply security, decoration capability, and refill system participation each do that. Four follow from that, and three of the four make the supplier genuinely difficult to remove at all.

Install Blow Moulding Inside The Filling Plant

A blow moulding line installed in the customer's building removes empty bottle freight entirely, eliminates their inbound container inventory, and converts a supply contract into a physical installation running ten to fifteen years. Capital runs USD 4 million to USD 12 million per line depending on format and speed. Switching supplier then means removing equipment from a working production line, which nobody does over price, and the position survives the procurement reviews that would otherwise retender the business annually. Fillers report that an installed supplier has essentially never been displaced.
Market Impact: Lines cost USD 4 to 12 million each

Contract Food-Grade Recyclate Supply Well Ahead Of Mandates

Recycled content requirements bind on legislated dates while food-approved recyclate trades roughly 28% above virgin resin because collection cannot meet mandated demand. Producers holding multi-year offtake agreements with sorting and recycling operators can guarantee compliance to brand customers who otherwise have no way of achieving it. That guarantee wins contracts outright rather than on price, and the spread widens as each compliance deadline approaches with collection infrastructure still failing to catch up. Offtake terms are being signed three to five years forward as a result, which locks in both volume and relationship.
Market Impact: The recyclate premium currently runs around 28% today

Build Decoration And Multi-Layer Capability For Premium Categories

Household and personal care brands treat the bottle as the primary shelf differentiator, and in-mould labelling, textured finishes, multi-layer barrier structures, and precise colour matching all narrow the supplier field considerably. Converted value per unit runs 2.5 to 4 times that of a plain commodity container. The capability requires tooling investment and process control that commodity blow moulders do not hold, and qualification with a brand typically takes nine to fifteen months and very rarely reverses once complete. Personal care is where the margin differential is widest across this whole market.
Market Impact: Converted value runs 2.5 to 4 times higher

Supply The Refill Systems Rather Than Watching Them

Refill pouches and concentrate formats remove bottles permanently rather than substituting material, and household and personal care are exactly where that shift is running fastest. Producers who supply the durable primary container, the refill format, and the dispensing hardware capture the category rather than losing it. Durable containers carry 3 to 5 times the unit value of a disposable bottle even before refill volumes are counted, and the position holds for as long as the format itself does. Watching this shift from outside means losing the units permanently rather than to another material.
Market Impact: Durable containers carry 3 to 5 times value

Who Controls the Margin Pool

Concentration at 22% across the top five averages two markets that behave nothing alike. Where on-site installations exist, positions are close to unassailable; where bottles are shipped, competition is regional and brutal. All participants here are compared on measured global revenue from rigid blow-moulded plastic bottles specifically, which requires separating that line from closures, preforms, and other rigid formats inside the diversified packaging groups.
Competition runs on installed position and technical capability rather than on unit price in the segments worth holding. ALPLA operates one of the largest on-site installation networks in the world across beverage and household categories. Amcor and Berry both combine bottle production with wider packaging portfolios. Plastipak holds strong positions in beverage alongside its own recycling operations. Graham Packaging competes in household and personal care with decoration depth.

Pressure is coming from recyclate supply rather than from any competitor. Producers who cannot guarantee food-grade recycled content will lose contracts to those who can, regardless of price, and that has pushed several into recycling and collection investment they never intended to make. Rankings shift when a producer secures either an on-site installation at a major filler or a long-term recyclate offtake position, since both last for years.
plastic-bottles-market-company-positioning-matrix-1787298222133

Competitive Moat and Risk Dimensions

ALPLA

Moat: Extensive On-Site Installation Network

ALPLA operates blow moulding lines inside customer filling plants across a very large number of sites worldwide, under agreements running ten to fifteen years. Removing a supplier from inside a working production line is a decision no operations director takes over price. That installed position generates recurring volume that competitors cannot bid against at any margin.
ALPLA

Risk: Capital Intensity Of Installed Positions

Each on-site line represents several million dollars of capital committed to a single customer at a single location for a decade or more. A filler closing a plant, changing format, or moving to refill formats strands that investment with no realistic redeployment. The model that produces the moat also concentrates risk in a way an asset-light competitor avoids entirely.
AMCOR

Moat: Global Multi-Format Packaging Reach

Amcor supplies rigid bottles alongside flexible packaging and closures across most major markets, which lets a multinational brand consolidate packaging procurement across formats and geographies with a single supplier. That breadth wins portfolio-level agreements where a bottle specialist can only bid on part of the requirement, and it makes displacement considerably harder.
AMCOR

Risk: Bottles Competing For Internal Capital

Rigid bottles sit inside a much larger portfolio where capital competes against flexible packaging and healthcare with different return profiles. On-site installation and recyclate offtake both demand sustained investment in a category growing at low single digits. Specialists making bottles their entire strategic priority have built installed positions faster in the categories that matter.

Players Tracked

Prominent Players

ALPLA
Amcor
Berry Global
Plastipak Holdings
Graham Packaging

Other Key Players

Gerresheimer
Alpha Packaging
Resilux
Retal Industries
Zhuhai Zhongfu
Indorama Ventures
CKS Packaging
Comar
Silgan Holdings
Logoplaste
Pretium Packaging
Serioplast
Taiwan Hon Chuan
Nampak
Greif

Recent Developments

FEBRUARY 2025

ALPLA Commissions Additional On-Site Lines At Beverage Customers

ALPLA brought further in-plant blow moulding lines online at beverage filling sites across Europe and Latin America under long-term supply arrangements. The installations were organic capital investments rather than acquisitions, and the company cited freight elimination and customer inventory reduction as the commercial justification for each.
Signal: In-plant installation converts a supply contract into a physical position that no competitor can bid against
MAY 2025

Food Grade Recyclate Pricing Holds Above Virgin Resin

Food-grade recycled polyethylene terephthalate continued trading above virgin resin across both European and North American markets, as mandated content requirements consistently outpaced collection and sorting capacity. Brand owners holding long-term offtake agreements secured their supply, while others faced compliance shortfalls against fast approaching regulatory deadlines.
Signal: Collection capacity rather than any recycling technology is what really constrains recycled content compliance right now
AUGUST 2025

Additional European Countries Launch Deposit Return Schemes

Further European countries brought deposit return systems into operation for beverage containers, lifting national collection yields toward the levels that established schemes already achieve. The schemes are government-mandated infrastructure rather than industry initiatives, though producer responsibility organisations operate the collection and sorting on their behalf.
Signal: Deposit infrastructure is the strategic asset in recycled content supply, rather than any recycling processing technology

Resin, Electricity And Freight

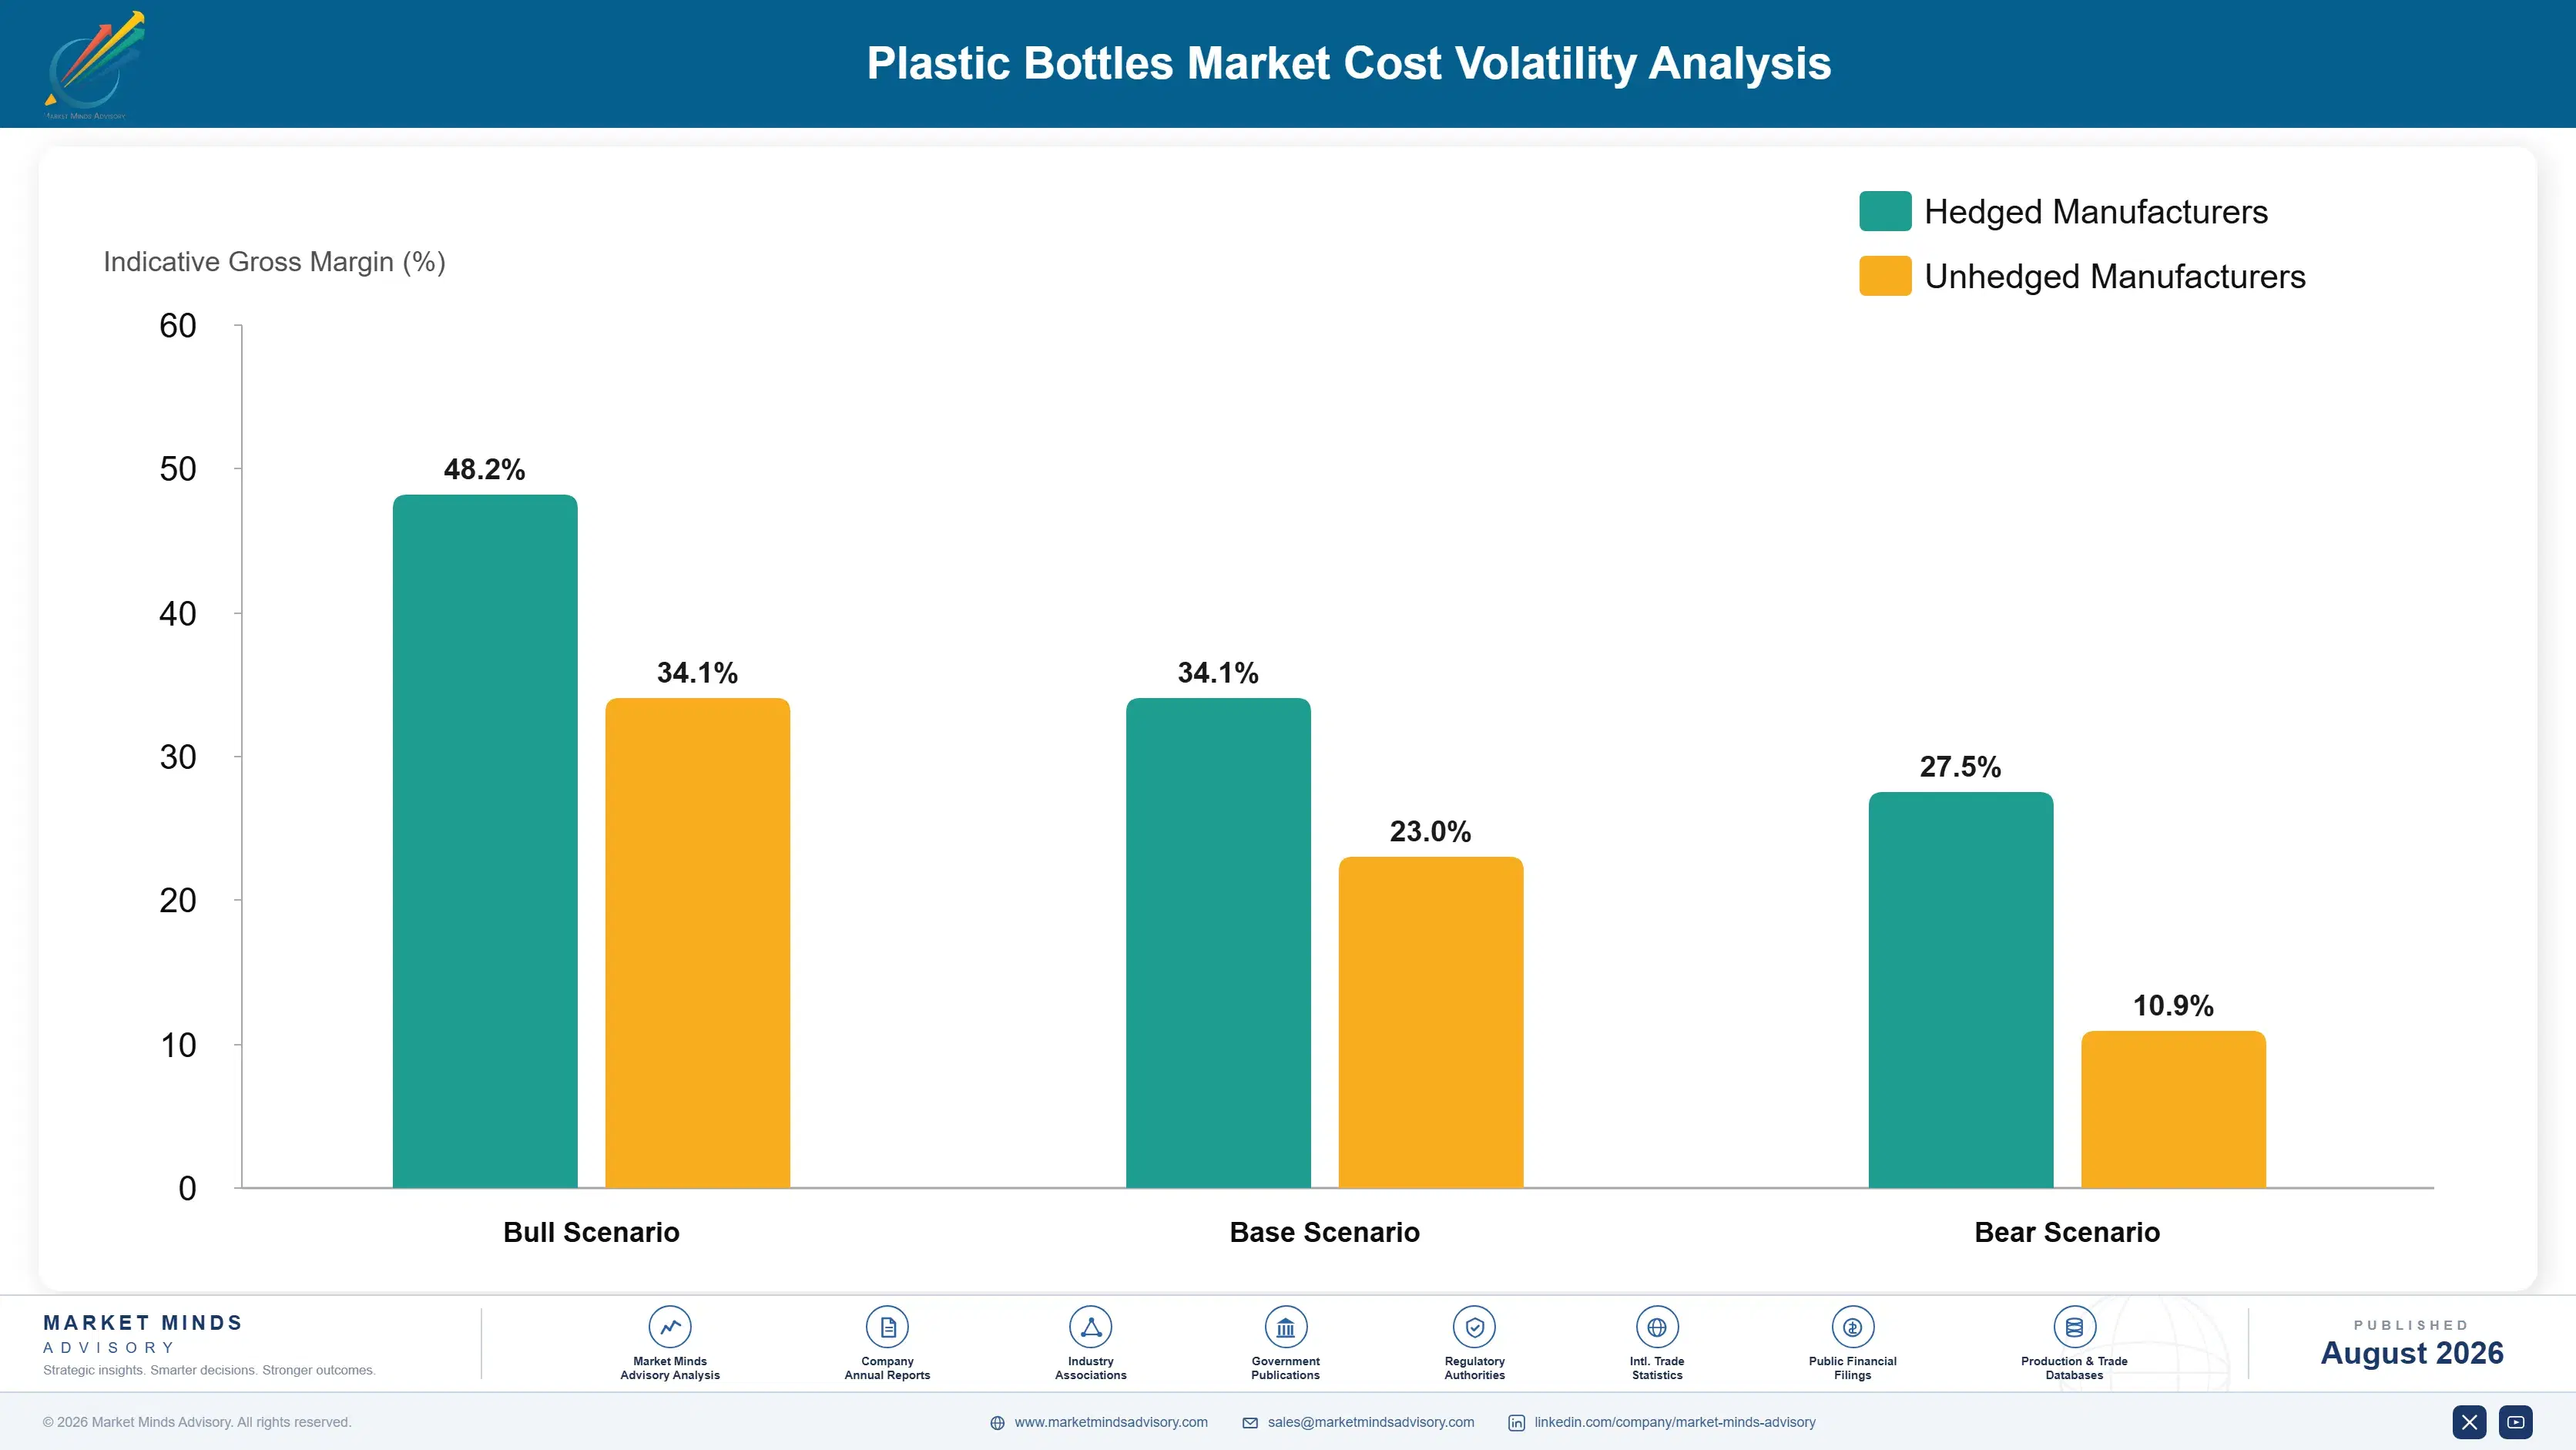
Polymer resin accounts for roughly 58% to 70% of finished bottle cost, dominated by polyethylene terephthalate and high-density polyethylene, both tracking naphtha and therefore crude oil pricing. Electricity for heating preforms and running compressors adds 8% to 14%, which rises sharply for lightweighted formats requiring tighter process control. Freight is 4% to 9% for shipped bottles and effectively zero for on-site production.
European resin and electricity costs both rose sharply through 2022 with the gas price shock the IEA documented that year, and blow moulding is electricity intensive enough that the second effect mattered nearly as much as the first. Amcor's 2022 annual report described substantial raw material and energy cost inflation with a lag before pass-through took hold. Several smaller regional blow moulders exited rather than trade through the period.

Exposure separates by production model more than by scale. An on-site producer carries no freight exposure at all and usually operates under contracts with resin indexation written in from the start. A shipping blow moulder carries both, and freight is the harder one because it cannot be indexed to anything a customer accepts. Integrated producers holding their own recycling operations partly hedge the recyclate premium as well.
plastic-bottles-market-cost-volatility-analysis-1787298222329

Write Resin Indexation Into Every Long-Term Agreement

Resin is close to two thirds of finished bottle cost and moves faster than any annual contract can reprice, so a fixed-price agreement puts a blow moulder into a petrochemical position it cannot manage. Indexation to a published polymer benchmark removes that exposure, and long-term on-site agreements are the natural place to establish it.

Secure Long-Term Food-Grade Recyclate Offtake Contracts

Mandated recycled content outruns collected food-approved supply, and the resulting premium above virgin resin is unlikely to close until deposit infrastructure catches up. Multi-year offtake agreements with sorting and recycling operators secure both volume and price, and they convert a compliance risk into a commercial advantage over competitors who left the arrangement to spot purchasing.

Contract Electricity Supply And Improve Compressor Efficiency

Blow moulding is electricity intensive, particularly on lightweighted formats where preform heating and blowing pressure both require unusually tight process control. Multi-year power supply contracts and investment in high-efficiency compressors and heat recovery each reduce exposure to a cost line that has moved considerably more violently than resin across several regions over recent years.

Portfolio Architecture for Margin Defence

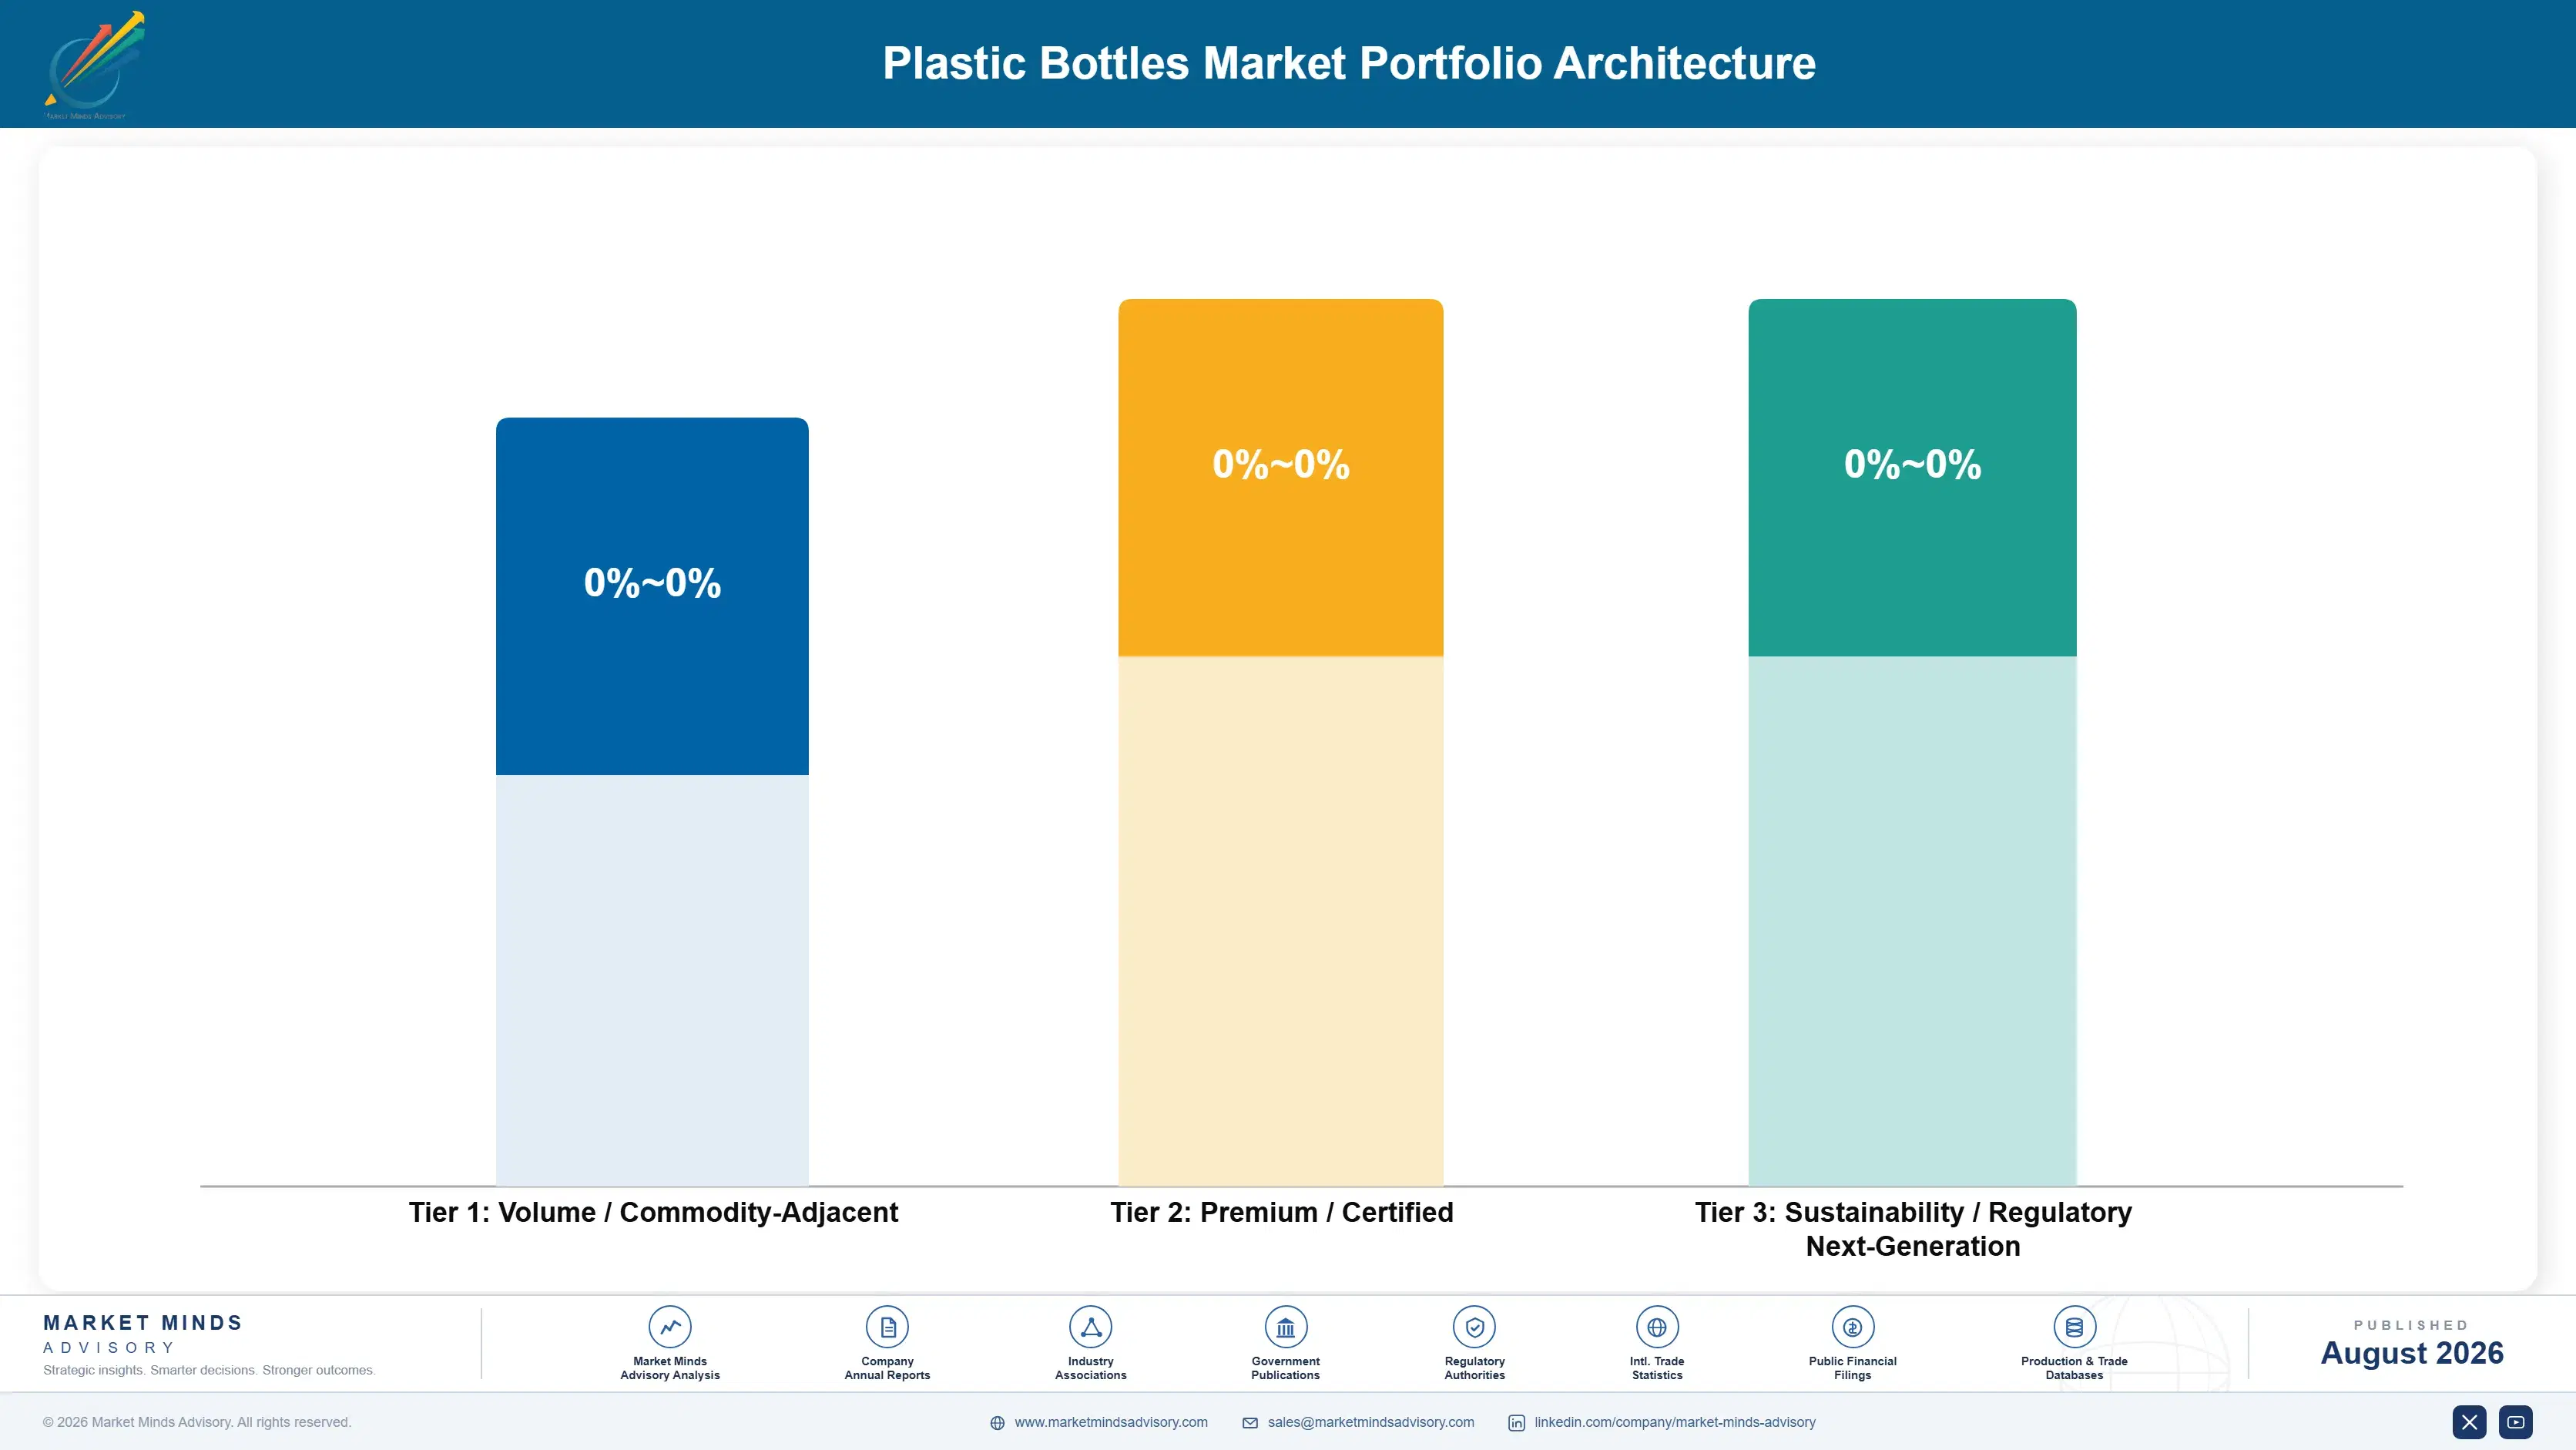
Margin architecture separates by whether the customer can change supplier without moving equipment. Shipped commodity bottles earn 8% to 16%, tendered against every blow moulder within freight range and repriced with resin every quarter. On-site installed positions and technically decorated premium containers earn 19% to 28%, because the first requires removing machinery from a working line and the second requires requalifying tooling and colour.
The tension is that on-site installation earns better and consumes capital that a shipping model does not. Four to twelve million dollars per line committed to one customer at one location for a decade is a genuine constraint on how fast the model can grow, and a plant closure strands the asset entirely. Producers weigh a defensible position against capital efficiency, and both answers are defensible.

High-value pools concentrate in on-site installations, recyclate offtake positions, and decorated multi-layer premium containers. All three raise switching cost rather than lowering price, which is the only durable approach in a product this standardised. Bio-based and refill-adjacent formats carry the widest margin range, because durable reusable containers and commodity bio-resin bottles share a category and nothing else.

Volume / Commodity-Adjacent

Standard shipped bottles in polyethylene terephthalate and high-density polyethylene, tendered against every blow moulder within freight range. The eight-point range separates producers with resin indexation and efficient plants from those absorbing volatility on fixed-price agreements.
Gross Margin: 8% to 16%

Premium / Certified

On-site installed production, multi-layer barrier containers, and decorated premium bottles for household and personal care. The nine-point range separates in-plant beverage installations from decorated personal care work, where tooling and colour qualification support higher pricing.
Gross Margin: 19% to 28%

Sustainability / Regulatory / Next-Generation

Recycled content compliant containers, bio-based resin bottles, durable refillable primary containers, and integrated recyclate supply positions. The twenty-two point range reflects real divergence: bio-resin bottles compete on price while durable refill containers carry entirely different economics.
Gross Margin: 12% to 34%
plastic-bottles-market-portfolio-architecture-1787298222829

High-value Sub-segments and Strategic Watch-out

On-Site Installed Production

The strongest defensible position available in this market, converting supply into a physical installation running ten to fifteen years that no competitor can bid against. Capital of four to twelve million dollars per line is the constraint, and a customer plant closure strands it entirely.
Gross Margin: 22% to 28%

Recyclate Supply Positions

High value and growing fast, because food-grade recycled resin trades above virgin material and brands facing compliance deadlines will pay for guaranteed supply. Producers holding offtake contracts win contracts outright rather than on price. Collection infrastructure rather than processing capacity is the binding constraint everywhere.
Gross Margin: 20% to 30%

Shipped Commodity Bottles

The volume core of this market, tendered relentlessly against every blow moulder within trucking distance and repriced with resin each quarter. Lightweighting has almost run out of road as a cost lever. Nothing in this tier is defensible against a competitor with a closer plant.
Gross Margin: 8% to 16%

Household Care Single-Use Bottles

Strategic watch-out here. Refill pouches and concentrate formats remove these units permanently rather than substituting material, and household and personal care is exactly where the shift runs fastest. Producers standing outside the refill formats lose that volume with no realistic prospect of recovering it later.
Gross Margin: 10% to 18%

Why Volume Stays Where It Is

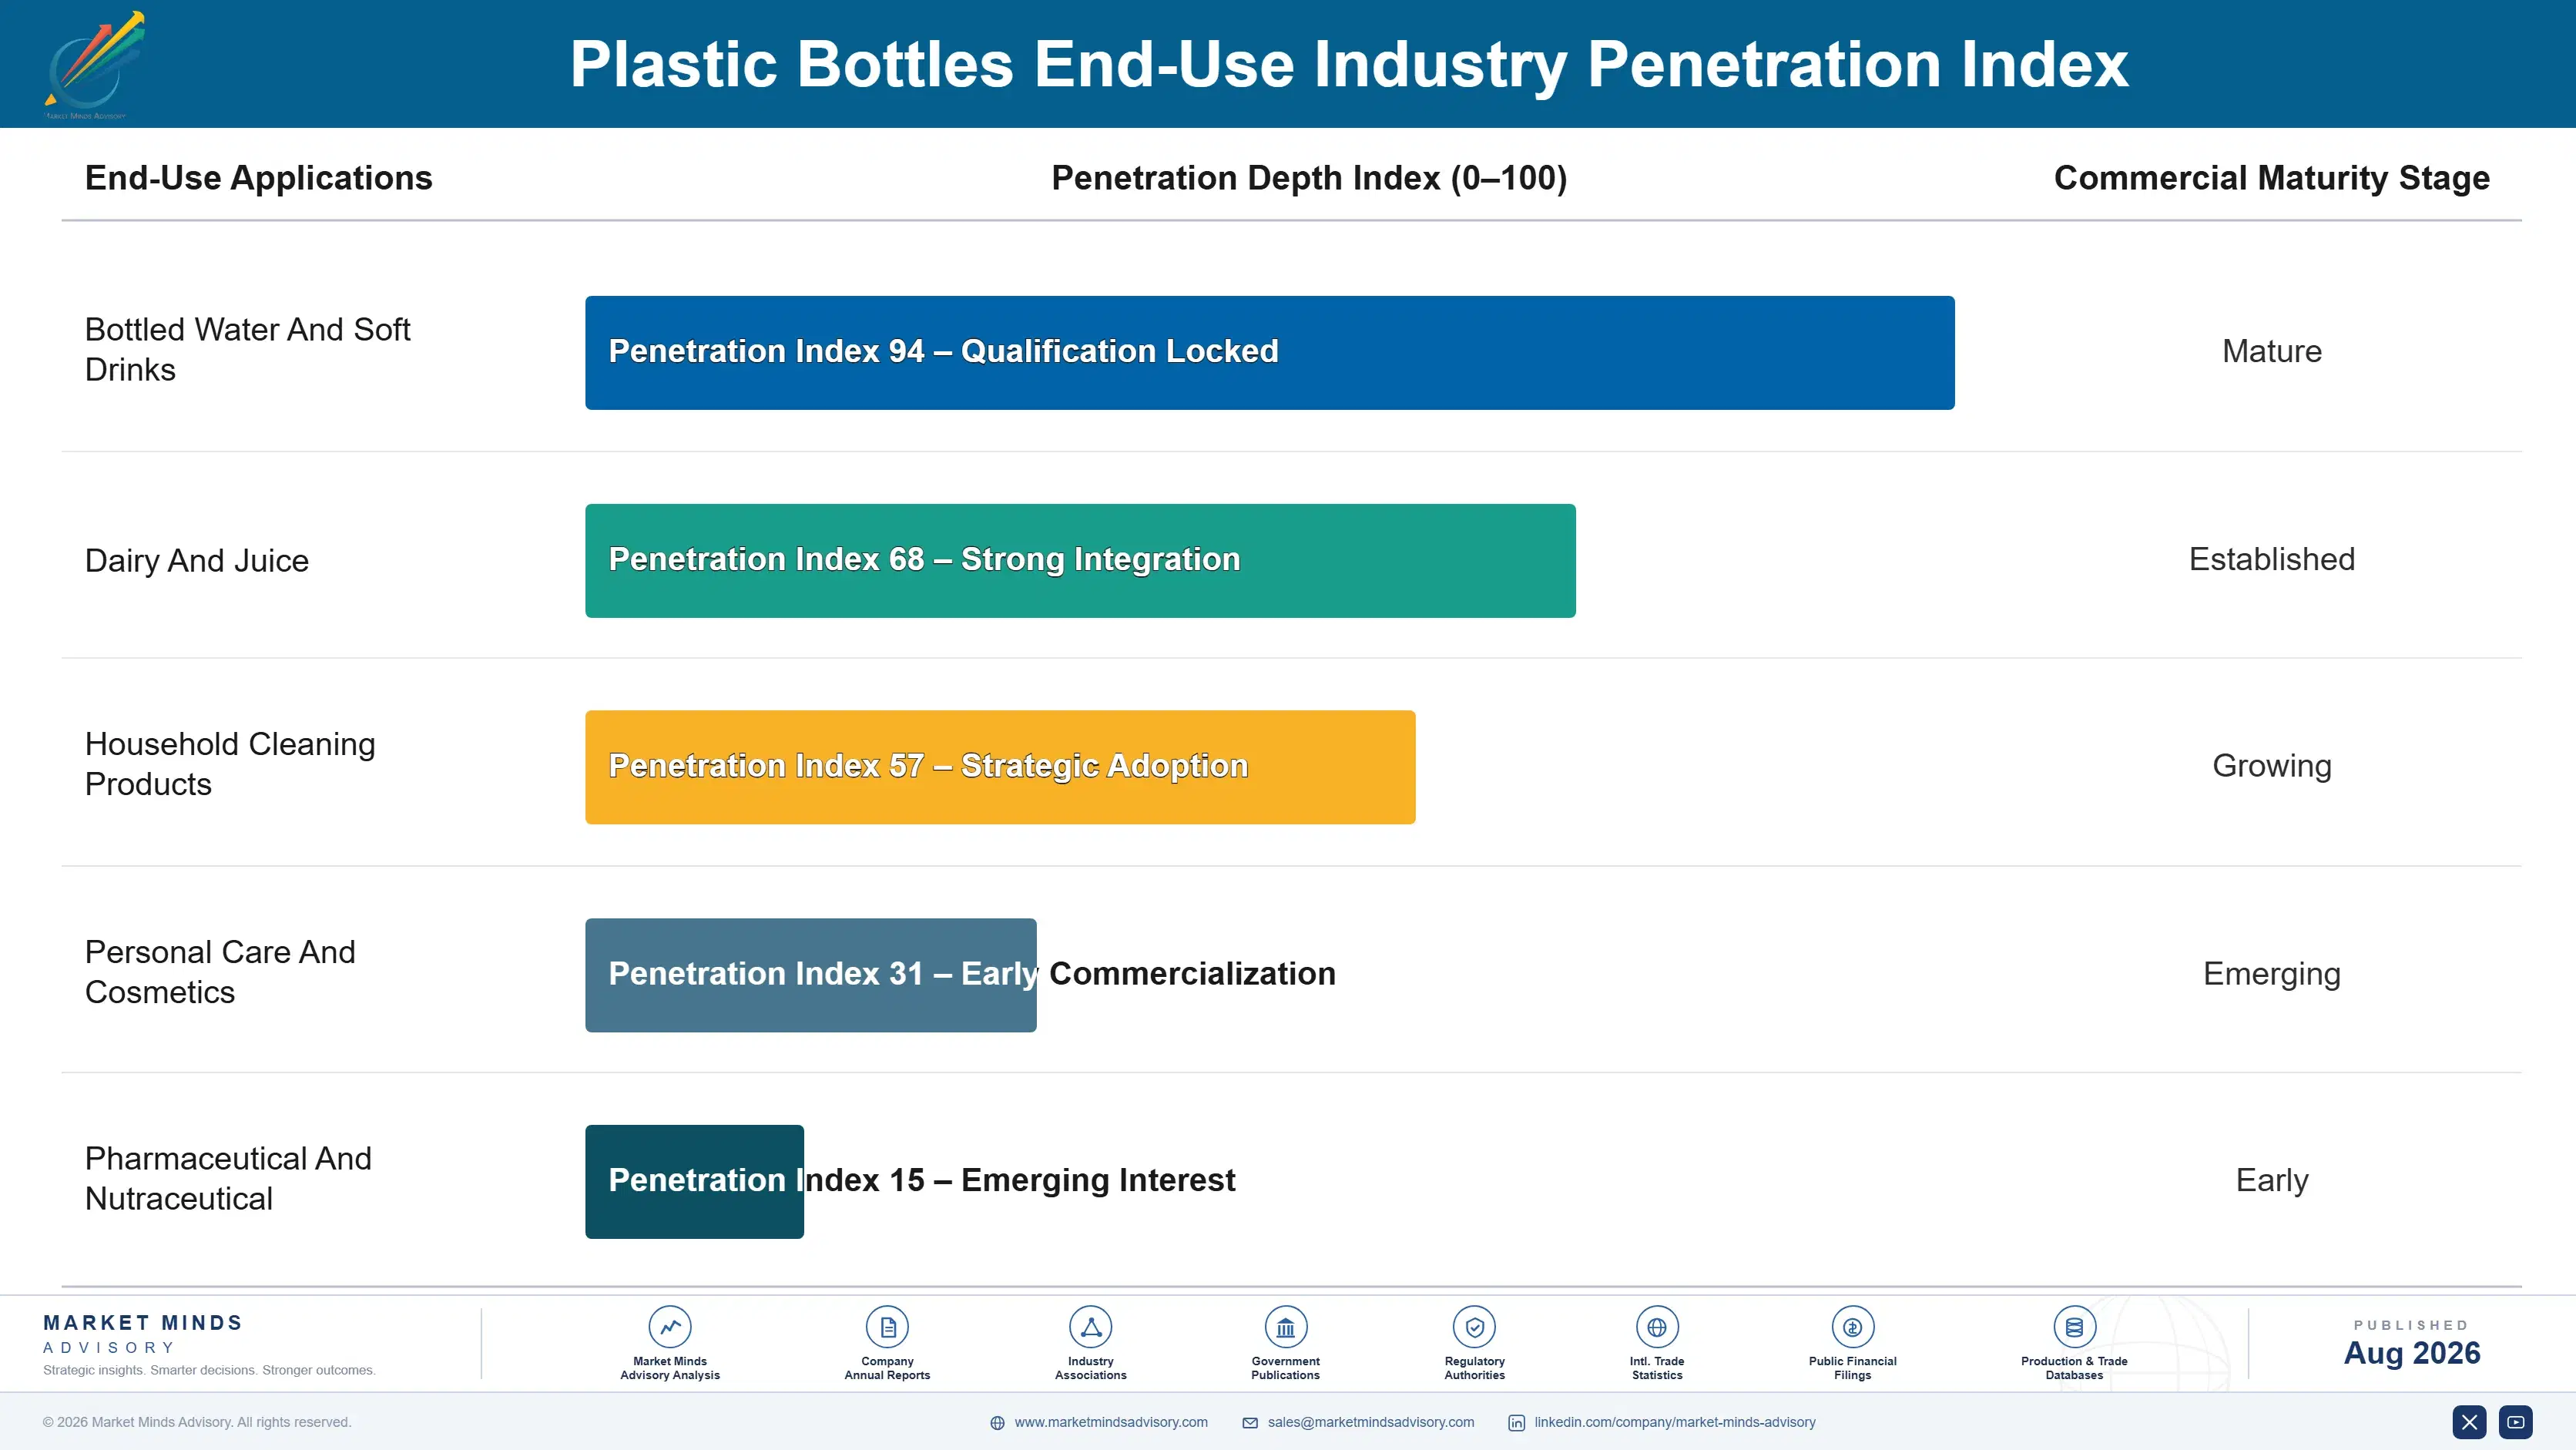
The annuity here is physical rather than contractual, which is unusual in packaging. A blow moulding line installed inside a filling plant delivers bottles directly onto the line for ten to fifteen years, and switching supplier means removing machinery from working production. Roughly 34% of global volume works this way. Purchase orders recur weekly while the actual decision was made once, at the point the equipment went in.
Depth varies sharply by production model and category. On-site beverage installations are the deepest by a wide margin. Decorated personal care containers are next, since tooling, colour matching, and line qualification all take months to replicate at another supplier. Shipped commodity beverage bottles are shallowest, retendered annually on delivered cost. Private label household supply sits at the same shallow end and moves on very small differences.

Buyer profiles have shifted meaningfully. Bottle sourcing moved from plant purchasing toward central procurement running multi-site agreements, while sustainability functions gained effective veto over material and recycled content decisions. Brand teams now specify decoration and format years ahead of any tender. All of that rewards producers who can guarantee recyclate compliance and hold an installed position, and it steadily erodes anybody quoting on price per thousand.
plastic-bottles-market-end-use-penetration-index-1787298223312

Where We Come Out

These are among the four positions where our research anticipates prominent divergence between winners and laggards over the coming forecast period. Each is grounded in the demand model, the regulatory perimeter, and the announced capacity pipeline.
01 / INSTALLED POSITION PRIORITY

Get the equipment inside the building or stay commoditised

A blow moulding line installed in the customer's filling plant eliminates freight on a product that is ninety-six percent air, removes their inbound inventory, and turns a supply agreement into a physical installation running ten to fifteen years. Switching then requires removing machinery from working production, which no operations director does over a price difference. Four to twelve million dollars per line is real capital, and it buys the only position anywhere in this market that a procurement function genuinely cannot retender.
02 / RECYCLATE SUPPLY SECURITY

Guaranteed compliance wins contracts that price never will

Food-grade recycled polyethylene terephthalate trades roughly twenty-eight percent above virgin resin because mandated content requirements arrived years ahead of the collection infrastructure needed to supply them. Producers holding multi-year offtake agreements can guarantee their brand customers a level of compliance that competitors simply cannot promise at any price at all. That guarantee decides contract awards outright rather than on price, and the premium will persist until deposit return systems reach the eighty-eight percent collection yields they already achieve wherever they operate today.
03 / LIGHTWEIGHTING EXHAUSTION RESPONSE

The cost lever that worked for a generation is finished

A standard water bottle already weighs about forty percent less than its equivalent did in 2000, and what remains available is fractions of a gram against genuine physical limits on top load, drop resistance, and line handling. Producers still presenting lightweighting roadmaps to their customers are promising something they cannot actually deliver in any meaningful quantity. Attention and engineering budget belong instead on recycled content qualification and on decoration capability, both of which still have considerable room left to move commercially.
04 / REFILL FORMAT PARTICIPATION

Refill deletes your units, so supply the format instead

A refill pouch or concentrate tablet removes every bottle it replaces across the original container's service life, and household and personal care is precisely where that shift is moving fastest. Producers watching from outside will lose those units permanently rather than see them substituted into another material. Supplying the durable primary container, the refill format, and the dispensing hardware captures the category, and durable containers carry three to five times the unit value of a disposable bottle before any refill volume is counted at all.

Engagement Snapshot From the Field

A live engagement with an industry participant carrying material or product regulatory and market exposure ahead of a defining policy shift, showing how our research translates into a defensible multi-year portfolio strategy.
MARKET MINDS ADVISORY · CLIENT ENGAGEMENT SUMMARY
Plastic Bottles Producer Strategic Portfolio Review and Transition Roadmap 2026·Investment Scenario on Plastic Bottles Exposure Evaluation 2025-26
CLIENT PROFILE
A European rigid plastic packaging producer operating seven blow moulding plants and supplying beverage, household, and personal care fillers across six countries, with roughly EUR 280 million in annual revenue (client-reported, unverified by MMA). All volume was shipped from its own plants, with no on-site installations at any customer, and the business bought recycled resin on the spot market as required.
STRATEGIC CHALLENGE
Two large beverage customers had begun evaluating on-site installation proposals from competitors, which would remove roughly a fifth of group volume permanently, and recycled content deadlines were approaching with no secured recyclate supply. The board had to decide whether to commit capital to in-plant installation, to recyclate offtake, or to defend the shipped model on cost.
MMA APPROACH
MMA modelled delivered cost and margin under shipped versus on-site production at each major customer site, assessed food-grade recyclate availability and pricing against the client's compliance obligations by country, and interviewed nineteen filler operations and procurement leads on installation decision criteria. Capital requirements and stranding risk on in-plant lines were modelled against customer plant closure probability.
KEY FINDINGS
  1. On-site production removed 7.4 percentage points of delivered cost per bottle at the two largest customer sites, which no shipped model could match at any negotiated price.
  2. Seventeen of nineteen fillers said an installed supplier had never been displaced at their sites, and none could recall a competitive retender once equipment was in place.
  3. Spot recyclate purchasing left the client short of mandated content in three of six countries by the compliance date, with no realistic route to closing the gap.
  4. Decorated personal care containers carried gross margin 11 points above beverage shipped volume, and the client held only 8% of its revenue in that category.
CLIENT PROFILE
A European rigid plastic packaging producer operating seven blow moulding plants and supplying beverage, household, and personal care fillers across six countries, with roughly EUR 280 million in annual revenue (client-reported, unverified by MMA). All volume was shipped from its own plants, with no on-site installations at any customer, and the business bought recycled resin on the spot market as required.
STRATEGIC CHALLENGE
Two large beverage customers had begun evaluating on-site installation proposals from competitors, which would remove roughly a fifth of group volume permanently, and recycled content deadlines were approaching with no secured recyclate supply. The board had to decide whether to commit capital to in-plant installation, to recyclate offtake, or to defend the shipped model on cost.
MMA APPROACH
MMA modelled delivered cost and margin under shipped versus on-site production at each major customer site, assessed food-grade recyclate availability and pricing against the client's compliance obligations by country, and interviewed nineteen filler operations and procurement leads on installation decision criteria. Capital requirements and stranding risk on in-plant lines were modelled against customer plant closure probability.
KEY FINDINGS
  1. On-site production removed 7.4 percentage points of delivered cost per bottle at the two largest customer sites, which no shipped model could match at any negotiated price.
  2. Seventeen of nineteen fillers said an installed supplier had never been displaced at their sites, and none could recall a competitive retender once equipment was in place.
  3. Spot recyclate purchasing left the client short of mandated content in three of six countries by the compliance date, with no realistic route to closing the gap.
  4. Decorated personal care containers carried gross margin 11 points above beverage shipped volume, and the client held only 8% of its revenue in that category.
RECOMMENDED STRATEGY
Phase 1: Phase one: commit capital to on-site installation at the two beverage customers under evaluation, ahead of competitor proposals rather than in response to them. Phase 2: Phase two: contract multi-year food-grade recyclate offtake covering full mandated content across all six countries, accepting pricing above virgin resin. Phase 3: Phase three: invest in decoration and multi-layer capability, and redirect commercial effort toward personal care and household premium categories instead.
OUTCOME
The client secured both on-site installations within three quarters, retaining volume that would otherwise have transferred. Recyclate offtake was contracted across five of six countries, and group gross margin rose from 14% to 19% over the following year as decorated volume grew (client-reported, unverified by MMA).

Frequently Asked Questions

Foundational context covering the market sizes, CAGR, scope, country, region and competition that inform every finding below. This section is provided to cover basics and most often pre-purchase conversations, answered from the MMA Primary Research Dataset.

What is the current size of the Plastic Bottles Market?

The global plastic bottles market reached USD 128.0 billion in 2025, covering rigid blow-moulded containers with a neck finish for liquid and flowable products. That spans PET, HDPE, PP, polyolefins, bio-based polymers, and multi-layer barrier constructions.

How large will the Plastic Bottles Market be by 2036?

MMA forecasts USD 205.55 billion by 2036, up from USD 133.63 billion in 2026, an increase of USD 71.92 billion. That represents an expansion multiple of 1.54 times across the forecast period.

What is the CAGR for the Plastic Bottles Market 2026 to 2036?

The base case CAGR is 4.4%, with a bull case of 5.6% and a bear case of 3.2%. Historical growth between 2020 and 2025 ran at 3.3%, averaging a channel shock against a genuine cost inflation cycle.

Which segment is growing fastest?

Bio-based and compostable polymers grow fastest at 6.6%, exactly 1.50 times the market rate, from a small base carried by brand commitments. Polyethylene terephthalate follows at 5.1% and remains the volume engine.

Who are the major companies in the Plastic Bottles Market?

ALPLA, Amcor, Berry Global, Plastipak Holdings, and Graham Packaging lead, together holding 22% of the market. That figure averages a concentrated on-site market against a fragmented shipped one.

Which country is growing fastest?

India grows fastest at 7.6%, as bottled water and packaged beverages displace untreated municipal supply across urbanising households. Small single-serve formats carry most of that volume.

Report Segmentation Architecture

The full report scope spans multiple orthogonal segmentation dimensions, with cross-tabulated demand data provided for each dimension pair. Coverage extends further to regional breakdowns, trend trajectories, and the competitive detail needed to support segment-level decision-making.

By Resin Type

  • Polyethylene Terephthalate
  • High-Density Polyethylene
  • Polypropylene
  • Low-Density Polyethylene And Other Polyolefins
  • Bio-Based And Compostable Polymers
  • Multi-Layer And Barrier Resins

By End-Use Industry

  • Bottled Water And Soft Drinks
  • Dairy And Juice
  • Household Cleaning Products
  • Personal Care And Cosmetics
  • Pharmaceutical And Nutraceutical

By Commercial Dimension

  • On-Site In-Plant Production
  • Shipped Contract Supply
  • Spot And Tender Purchasing
  • Recyclate Offtake Programmes
  • Refill And Durable Container Systems

By Region

  • East Asia
  • South Asia and Pacific
  • North America
  • Western Europe
  • Latin America
  • Middle East and Africa
  • Eastern Europe

Scope, Methodology, and Coverage

Every figure in this report is reproducible from documented input assumptions. The scope below maps the historical period, the forecast horizon, the segmentation dimensions, and the countries covered, alongside the underlying primary and qualitative methodology.
Historical Period
2020 to 2025
Forecast Period
2026 to 2036
Base Year
2025 (USD billions; MMA Primary Research Dataset, August 2026)
Market Definition
The plastic bottles market covers rigid blow-moulded plastic containers with a defined neck finish designed to hold liquid or flowable products, across beverage, household, personal care, and pharmaceutical applications. Scope spans polyethylene terephthalate, high-density polyethylene, polypropylene, low-density polyethylene and other polyolefins, bio-based and compostable polymers, and multi-layer barrier resin constructions, together with durable refillable primary containers. Closures sold separately, preforms traded as intermediates, wide-mouth jars, flexible pouches, aerosol containers, glass and metal bottles, and blow moulding machinery are excluded.
Quantitative Units
USD billions at producer revenue level; billions of units shipped annually; tonnes of resin consumed.
Segmentation Dimensions
By resin type; by end-use industry; by commercial dimension; by region.
Regions Covered
East Asia, South Asia and Pacific, North America, Western Europe, Latin America, Middle East and Africa, Eastern Europe
Countries Covered
United States, Canada, Mexico, Germany, France, United Kingdom, Italy, Spain, Netherlands, Poland, China, Japan, South Korea, India, Indonesia, Vietnam, Brazil, Argentina, Saudi Arabia, South Africa.
Key Companies Profiled
ALPLA, Amcor, Berry Global, Plastipak Holdings, Graham Packaging, Gerresheimer, Alpha Packaging, Resilux, Retal Industries, Zhuhai Zhongfu, Indorama Ventures, CKS Packaging, Comar, Silgan Holdings, Logoplaste, Pretium Packaging, Serioplast, Taiwan Hon Chuan, Nampak, Greif.
Quantitative Methodology
Primary survey, n=3,800 respondents, Q4 2025, six countries; demand-side model with trade association cross-validation
Qualitative Methodology
47 expert interviews, Q4 2025; applied to validate demand model assumptions, identify emerging dynamics, and assess competitive positioning
Report Format
PDF and XLSX data workbook (Word format preview document)
Publisher
Market Minds Advisory
Report Code
MMA-2026-PAC-827
Published
August 2026
Contact
sales@marketmindsadvisory.com | www.marketmindsadvisory.com

Purchase the full Plastic Bottles Market Report (2026 to 2036).

The full MMA report on plastic bottles covers resin, regional, and competitive analysis in detail, with separate treatment of the freight economics that produced on-site production and the recyclate supply gap that now decides contract awards. It includes delivered cost modelling for shipped against in-plant production, food-grade recyclate availability and pricing by region, deposit return scheme collection yield tracking, and refill format substitution risk by product category. Regional chapters cover twenty countries with filling capacity and collection infrastructure assessed individually. Competitive profiling spans twenty producers on a consistent revenue basis.
Twenty country filling capacity and demand chapters
Delivered cost modelling for shipped against in-plant
Food-grade recyclate availability and pricing by region
Deposit return scheme collection yield tracking tables
Twenty producer competitive profiles compared consistently
Refill substitution risk assessed by product category

Built For The People Who Decide

From boardroom strategy to bench-side execution, this report is read cover-to-cover by leaders shaping the next decade of their industry, turning demand scenarios, market dynamics and valuation benchmarks into decisions.
CXOs/ Presidents/ VPs/ Managers
M&A and Corporate Development
Strategy Teams and R&D Heads
Procurement and Product Directors
Regulatory and Compliance Leaders
Investor Relations and Equity Analysts