Market Minds Advisory
Plant Phenotyping Market

Plant Phenotyping Market: Plant Phenotyping Market. High-Throughput Trait Measurement Systems for Crop Breeding and Agronomic Research

A crop breeding programme that once relied on manual field scoring for every trial now deploys UAV imaging across entire breeding nurseries, and that shift is redrawing phenotyping capital budgets across research programmes.

Lead Analyst

Published

September 2026

Make Smarter Decisions with Customized Research Insights

Request a free sample report and evaluate market opportunities, growth trends, and competitive dynamics relevant to your business needs.

2025 MARKET VALUE$0.4BMarket Size 2025
2036 FORECAST VALUE$1.2BBase Case , 2026 to 2036
CAGR 2026 TO 203610.2 %Bull 11.5% / Bear 8.9%
INCREMENTAL OPPORTUNITY$0.8BNet 10- year value creation
EXPANSION MULTIPLE2.64x2036 value over 2026 base
Strategic Levers
M&A Pipeline
Regional Outlook
Country Rankings
Competitive Intelligence
Segmental Deep-dive
Call-Us : 91 93563 13602

Executive Snapshot and Market Trajectory.

A crop breeding programme that once relied on manual field scoring for every trial now deploys UAV imaging across entire breeding nurseries, and that shift is redrawing phenotyping capital budgets across research programmes this year, according to breeding scientists surveyed across major crop research producing regions too.
UAV and drone-based phenotyping systems grow fastest as breeding programmes pursue aerial high-throughput measurement standard manual scoring cannot match. Data analytics software follows closely as breeders demand AI-driven trait extraction from imaging datasets. North American and South Asian crop research hubs record the fastest phenotyping conversion growth given expanding seed company breeding investment and rising precision agriculture adoption across nearly every producing segment reviewed this year.
Five suppliers hold roughly 36% of category value, led by LemnaTec GmbH and Phenospex B.V., both drawing on established phenotyping platform manufacturing scale and deep breeding programme relationships built across multiple product generations worldwide. Photon Systems Instruments' steadily expanding imaging engineering reach adds a further meaningful competitive dimension worth watching, as documented measurement-throughput proof increasingly matters as much to breeders as trait accuracy alone today. Few vendors can match this consistently today.
Market Definition
The market covers high-throughput plant trait measurement systems used in crop breeding and agronomic research, including field-based phenotyping platforms, greenhouse and controlled-environment phenotyping systems, UAV and drone-based phenotyping systems, laboratory and benchtop phenotyping systems, and imaging sensors and cameras, plus phenotyping data analytics software. It excludes general-purpose agricultural drones sold without phenotyping-specific imaging payloads, soil testing equipment, and standard weather monitoring stations, which fall under separate dedicated reports.
Base Year Value
$0.4B in 2025 (MMA Primary Research Dataset, September 2026)
Forecast Period
2026 to 2036, eleven discrete annual values
CAGR
10.2% base case. Bull 11.5%. Bear 8.9%.
Fastest Growth Segment
UAV/Drone-Based Phenotyping Systems: 14.3% CAGR
Fastest Growth Country
South Asia and Pacific composite: 12.2% CAGR
Fastest Growth Region
South Asia and Pacific: 12.2% CAGR
Largest Region
North America: 34% of 2025 global value
Market Leaders
LemnaTec GmbH, Phenospex B.V., Photon Systems Instruments, Keygene N.V., Bayer AG. Source: MMA Analysis, company annual reports.
Primary Survey
n=3,800 procurement and R&D decision-makers, Q4 2025, six countries
Methodology
Demand-side build-up, cross-validated against public data, 47 expert interviews

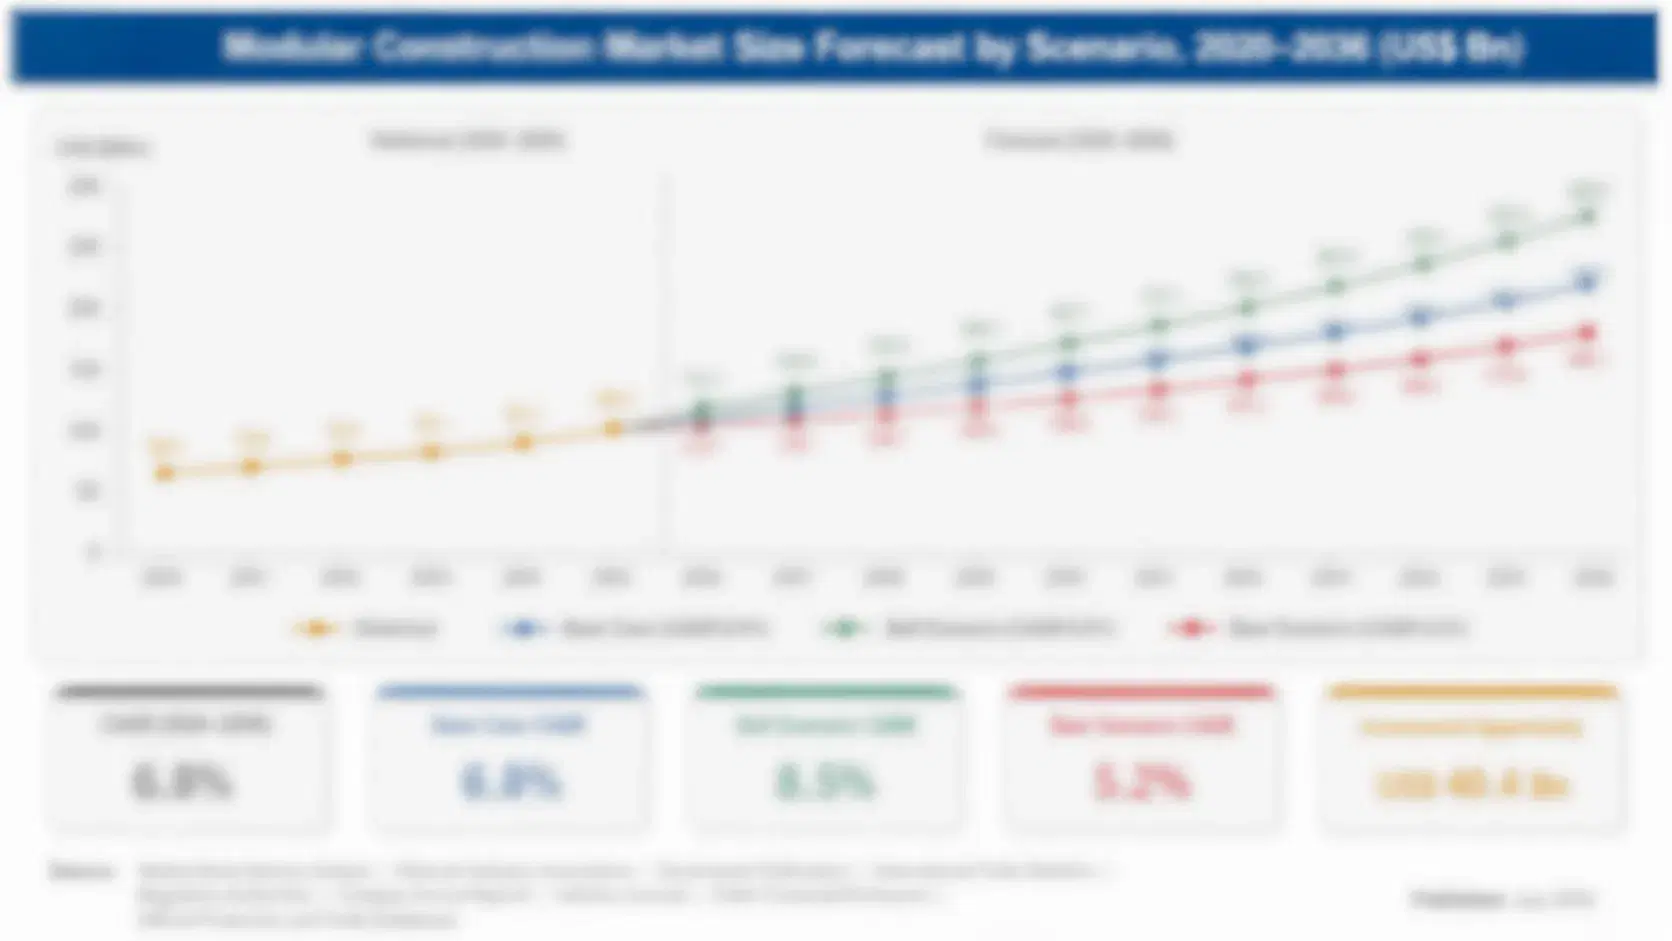
Plant Phenotyping Market Forecast Scenarios

plant-phenotyping-market-size-forecast-scenario-1790780551479
From 2020 to 2025 demand grew at about 9.2% a year as breeding programmes steadily expanded UAV and analytics software adoption across widening trait-measurement programmes, while manufacturers extended greenhouse system coverage across growing controlled-environment catalogues. Rising seed company breeding investment drove much of the recent volume increase, and expanding precision agriculture adoption accelerated conversion through the period, according to industry association data reviewed across major crop research producing regions.
The base case of 10.2% rests on three mechanisms working together. Aerial high-throughput demand keeps pushing UAV phenotyping economics further ahead of standard manual scoring alternatives across breeding and agronomy applications. AI-driven trait extraction demand keeps growing as breeders pursue measurable selection-efficiency economics across widening imaging programmes. Sensor engineering quality keeps improving steadily as manufacturers extend measurement-accuracy and throughput performance without raising unit cost meaningfully. Buyers increasingly treat this as a standard.
The bull case reaches 11.5% if seed company breeding investment accelerates faster than expected across additional North American and Asian research capacity, particularly across US and Indian expansion programmes. The bear case falls to 8.9% if standard manual scoring retention persists longer than forecast against currently ambitious breeding programme investment timelines, particularly amid softer agricultural research capital budgets.

Precision Breeding Drives UAV Phenotyping Conversion

Seed companies, breeding programmes and agricultural research institutions specify plant phenotyping systems that reliably deliver measurement-throughput performance, trait-accuracy consistency and durability under sustained field and greenhouse conditions across a wide range of crop types and breeding scales while integrating cleanly into existing research infrastructure, then validate performance through extensive trait-correlation testing and throughput testing before certifying a system for continuous deployment. Rising precision agriculture adoption increasingly pushes conversion demand, since breeders now treat documented measurement throughput as a measurable selection-efficiency factor.
MARKET CONCENTRATION36% CR5Top five suppliers hold roughly a third of value
UAV SEGMENT SHARE20%Portion of category revenue from drone-based system sales
TOP PRODUCING COUNTRY SHARE30%Portion of global output supplied through the leading manufacturing base
IMAGING SENSOR COST SHARE38% of COGSMultispectral imaging sensor and camera cost portion overall
AVERAGE UNIT PRICEUSD 4,500-620,000 per systemTypical price per system depending on platform type and throughput
SYSTEM REPLACEMENT CYCLE LENGTH5 to 8 yearsTypical duration between initial installation and confirmed replacement
Value concentrates around UAV and data analytics segments, the two fastest-growing categories in the segmentation. Field-based, greenhouse, laboratory and imaging sensor equipment round out the remaining segments through steady, if comparatively slower, demand volume. UAV designs lead this mix, with basic manual field platforms trailing behind on renewal cycles.
Supply combines established phenotyping platform primes and diversified regional specialists competing on throughput-reliability proof and delivery scale. LemnaTec GmbH and Phenospex B.V. lead through proprietary manufacturing scale and deep breeding programme relationships that smaller regional specialists cannot easily replicate. Smaller manufacturers compete mainly on niche application engineering and delivery responsiveness instead. Pricing power still concentrates among manufacturers with proven throughput and accuracy records.
"A phenotyping platform that measures a trait accurately on a demonstration plot tells a breeding programme little about how it holds calibration after months of continuous field deployment across variable lighting conditions."
Senior Analyst, AgTech and Crop Research Instrumentation Practice · MMA Field-Based Practice · September 2026

Market Trends

UAV Phenotyping Extends Much Broader Coverage

Seed companies and breeding programmes increasingly specify UAV and drone-based phenotyping systems that deliver aerial high-throughput measurement standard manual scoring alone cannot support reliably across expanding breeding applications, where sustained throughput reliability matters more than the added unit cost engineered UAV architecture introduces, with manufacturers such as LemnaTec GmbH expanding UAV production capacity to meet rising specification demand across their growing breeding customer base worldwide. UAV segment demand grows to about 20% of category revenue, and gross margins run 27% to 34% across the category. This trend continues accelerating through coming years across the global breeding programme buyer base in.
Market Impact: seed company breeding priorities add 1-3%.
Analytics Software Adoption Sustains Much Broader Demand

Manufacturers keep extending data analytics specification to mainstream mid-size breeding programmes beyond flagship large-scale seed companies alone, sustaining strong unit demand across new research capacity entering service each year as AI-driven trait extraction becomes a broader breeder priority. Industry global agtech instrumentation data show sustained adoption across the market each year as programmes standardize analytics architecture across their research fleets. This trend is expected to continue through the next several years as remaining manual-scoring-only programmes reach expanded upgrade cycles across the mid-tier research base. Buyers increasingly treat this as a standard requirement, not an option.
Market Impact: precision agriculture priorities add 1-2% volume

Market Opportunities and Growth Drivers

Seed Company Breeding Priorities Sustain Demand

Seed company breeding demand and aerial-throughput priorities keep growing across the global plant phenotyping market as breeding programmes and research institutions pursue every available system-conversion opportunity, requiring platforms engineered for materially better throughput than earlier generation manual scoring programs ever delivered. Industry global crop breeding investment data show sustained pressure across research budgets each year. The driver rewards manufacturers with proven throughput and accuracy engineering capability, and it supports continued demand growth, though the pace still varies by programme budget timing. Few competing manufacturers currently match this pace consistently today.
Market Impact: manual scoring retention limits volume 1-2%

Precision Agriculture Priorities Sustain Volume Demand

Precision agriculture demand and selection-efficiency priorities keep growing across the global plant phenotyping market as agronomic research programmes pursue every available system-conversion opportunity, sustaining strong unit demand across new research capacity entering service. Industry precision agriculture infrastructure data show sustained demand across the global research base each year. The driver rewards manufacturers with proven accuracy and throughput engineering capability, and it supports steady demand growth, though the pace still varies by product mix and programme trust. Industry surveys over the past two cycles show this preference strengthening steadily among larger breeding operators.
Market Impact: imaging sensor volatility compresses margin 2-4%

Market Restraints and Challenges

Much Broader Manual Scoring Retention Limits Volume

Standard manual field scoring retention relative to UAV adoption continues limiting near-term demand across several budget-constrained programme segments where existing capital budgets run ahead of forecast, since throughput priority varies meaningfully across global crop research producing jurisdictions and even within individual programme upgrade cycles, according to industry global phenotyping procurement survey data. The root cause is the genuine capital cost advantage manual scoring retains relative to well-established UAV infrastructure on smaller regional breeding programmes, which leaves programmes weighing near-term budget constraints against longer-term throughput economics. Manufacturers respond by developing lower-cost UAV entry lines.
Market Impact: UAV segment reaches 20% revenue

Rising Imaging Sensor Cost Volatility Pressures Margins

Multispectral imaging sensor and camera component cost makes up about 38% of manufacturing cost, and price volatility continues pressuring unit margins across manufacturers without diversified sourcing or long-term supply contracts, according to industry commodity pricing data tracked across major producing regions. The root cause is the genuine cost structure dependence phenotyping manufacturing holds on specialty imaging sensor pricing, which leaves smaller manufacturers exposed when component costs spike suddenly across a production cycle without warning. Manufacturers respond with hedging programmes and diversified sensor sourcing agreements to manage exposure. Few vendors can match this consistently today.
Market Impact: analytics software adoption adds 1-2% yearly
3 additional market trends, 4 additional growth drivers, and 2 additional restraints and challenges are covered in the full report. Contact sales@marketmindsadvisory.com to access the complete intelligence.

Segment CAGR and Growth Architecture

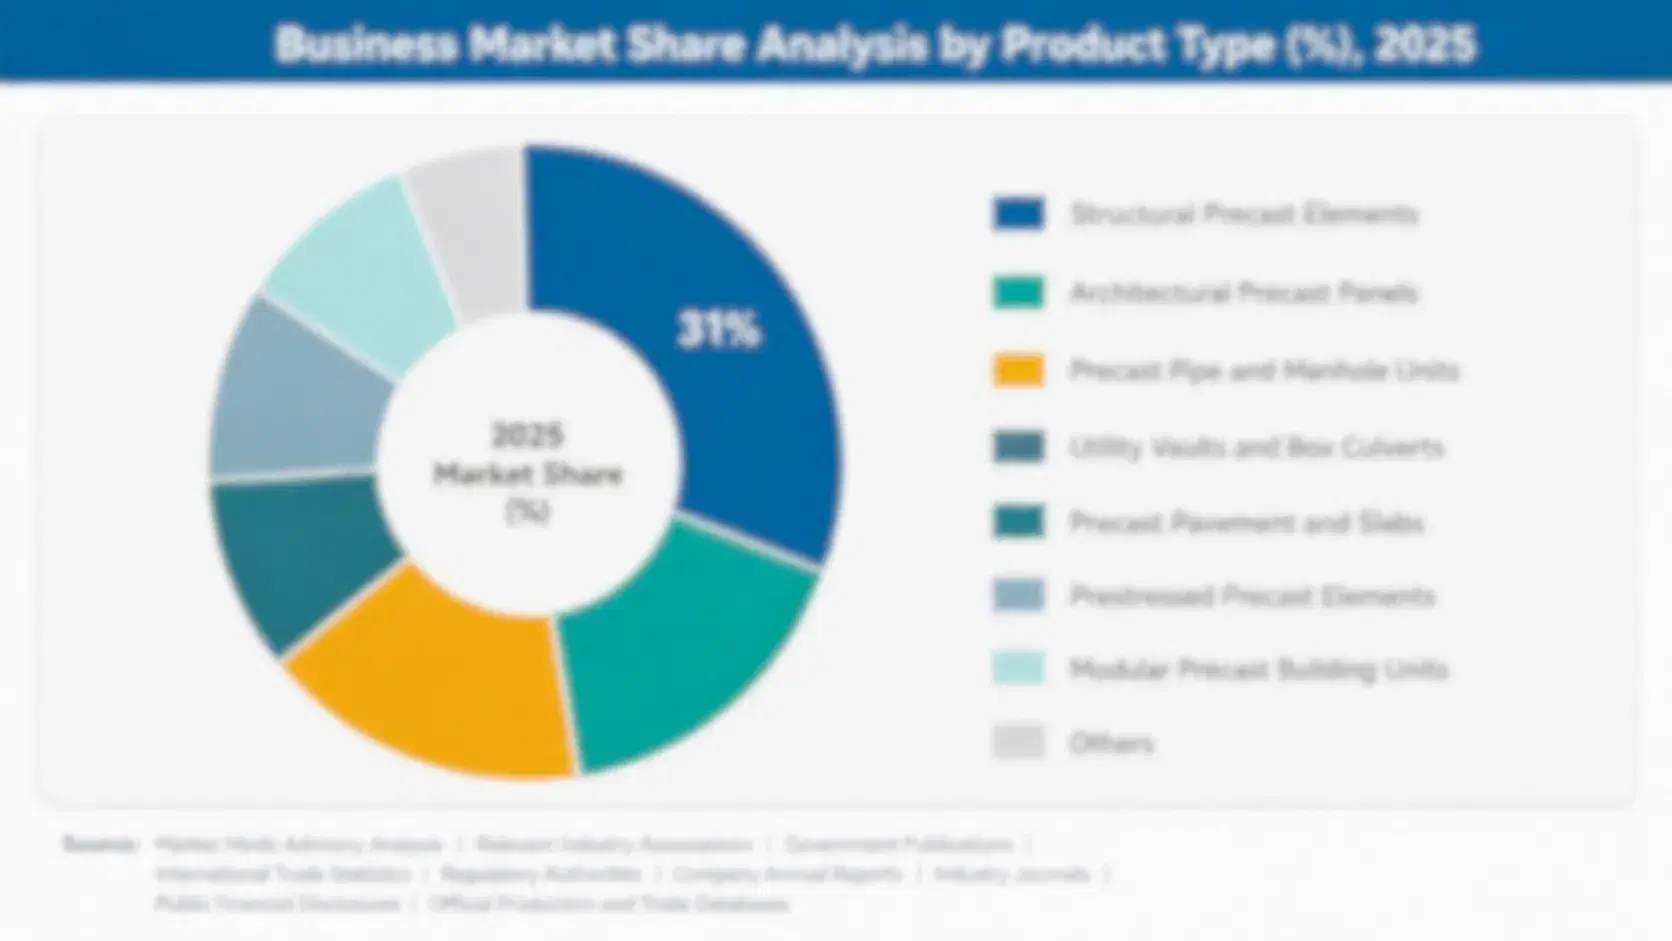
The market is segmented by measurement platform and imaging technology, which shows where engineering depth, margins and application requirements differ most across categories. UAV and data analytics systems grow fastest globally, while field-based, greenhouse, laboratory and imaging sensor equipment round out the remaining segments through steadier renewal demand. Smaller vendors have struggled to keep pace with this shift.
plant-phenotyping-market-market-share-analysis-1790780551652

UAV/Drone-Based Phenotyping Systems

UAV and Drone-Based Phenotyping Systems is the fastest-growing segment at 14.28% a year, about 1.40 times the overall market rate. Seed companies and breeding programmes increasingly specify UAV phenotyping systems that deliver aerial high-throughput measurement standard manual scoring alone cannot support reliably across expanding breeding applications, since sustained throughput reliability matters more than the added unit cost engineered UAV architecture introduces, and prices run 40% to 90% above standard field-based platforms given added flight control and multispectral imaging engineering requirements. Gross margins of 27% to 34% reward manufacturers with proven throughput and imaging engineering capability. Growth depends on throughput reliability, buyer breadth and breeder trust, while production capacity still limits how fast supply can scale up worldwide.
CAGR 14.3%

Phenotyping Data Analytics Software

Phenotyping Data Analytics Software grows at 12.24% a year, about 1.20 times the overall market rate, because manufacturers continue extending AI-driven analytics specification to mainstream mid-size breeding programmes beyond flagship large-scale seed companies alone. Breeders use trait-extraction accuracy and reliability to differentiate offerings across product generations, particularly where sustained large-dataset exposure leaves little room for standard tolerances. Gross margins of 24% to 31% support manufacturers with reliable analytics infrastructure and documented accuracy data, and buyers increasingly demand analytics software that still match UAV throughput performance despite their extraction premium. Growth depends on extraction reliability, buyer breadth and programme trust, and manufacturers with consistent reliability records hold the strongest positions across the category today.
CAGR 12.2%
Full segment breakdown across 6 segments available in the complete report.

Regional Architecture and Country Demand Map

North America leads on concentrated seed company breeding demand, with two regions sitting outside their standard bands given the category's strong tie to crop research investment geography, justified below. This has become one of the clearer dividing lines between established suppliers and newer entrants still building out testing capability.

North America

North America holds 34% share, above the standard 22% to 32% band because the region's seed company breeding concentration, spanning major agribusiness research programmes and land-grant university breeding centers, sustains the largest phenotyping investment of any region, a concentration this report flags explicitly rather than smoothing toward the band midpoint. Domestic phenotyping primes anchor supply and calibration capacity that smaller international competitors cannot easily replicate. US breeding programmes continue installing UAV systems rapidly to meet expanding throughput targets. Canadian research institutions concentrate on the analytics segment, reflecting cold-climate breeding trait extraction demand. This has become one of the clearer dividing lines between established suppliers and newer entrants still building out testing capability.
Share: 34% | CAGR: 11.4% (2026 to 2036)

Western Europe

Western Europe carries 25% share, at the top of the standard 18% to 26% band, anchored by LemnaTec GmbH's German engineering base and Phenospex B.V.'s Dutch precision manufacturing tradition, which sustain the region's deep phenotyping heritage. German and Dutch breeding companies continue investing in UAV fleets tied to precision engineering standards. European crop research directives continue driving analytics retrofit demand across existing breeding fleets. Regional programmes increasingly favor certified throughput bundles given the category's compliance verification requirements. This has become one of the clearer dividing lines between established suppliers and newer entrants still building out testing capability. This has become one of the clearer dividing lines between established suppliers and newer entrants still building out testing capability.
Share: 25% | CAGR: 8.7% (2026 to 2036)
Regional intelligence for 5 additional markets available in the complete report: East Asia, South Asia and Pacific, Latin America, Middle East and Africa, Eastern Europe. Contact sales@marketmindsadvisory.com.
plant-phenotyping-market-country-cagr-analysis-1790780551831

Four Margin Routes for Phenotyping Platform Manufacturers

Margin in the plant phenotyping market comes from imaging engineering depth, throughput proof, distribution support and sensor sourcing efficiency rather than volume alone. Manufacturers that combine two or more of these routes tend to hold pricing power longest across renewal cycles worldwide, particularly as buyers increasingly demand documented proof before committing to multi-year breeding programme contracts.

Investing in Deep UAV Multispectral Imaging Engineering

Seed companies and breeding programmes want documented sustained throughput performance across every breeding-scale variant, so manufacturers that invest in flight control and multispectral imaging engineering and testing capacity win contracts worth 17% to 22% of revenue at gross margins of 27% to 34%. Programmes cost $610,000 to $1.8 million and typically take twelve to eighteen months to reach full validation. Manufacturers should invest in imaging and flight tooling, validate throughput and accuracy data and secure breeding programme certification alignment early, since undocumented manufacturers lose contracts to manufacturers offering proven certification-backed throughput performance across every application class served today.
Market Impact: UAV multispectral imaging engineering wins contracts worth 17-22% of revenue

Building Much Wider Trait Correlation and Throughput Testing

Breeding engineers want documented performance repeatability across every contested breeding-scale scenario, so manufacturers that build trait-correlation and throughput-testing capability spanning multiple system generations win contracts worth 8% to 11% of revenue at gross margins of 24% to 31%. Programmes cost $370, 000 to $1.1 million and require sustained investment in trait-correlation and throughput cycling testing across representative field conditions. Manufacturers should document application-specific throughput performance, publish validation success rates and secure breeding programme testimonials, since unproven manufacturers lose contracts to manufacturers with documented performance history worldwide. Few competing manufacturers match this testing depth consistently today.
Market Impact: trait correlation and throughput testing wins contracts worth 8-11% revenue

Expanding Much Wider Imaging Sensor Sourcing Diversification

Multispectral imaging sensor and camera component cost makes up about 38% of cost, so manufacturers that expand diversified sensor sourcing capacity across multiple producing regions cut cost and supply swings by 4% to 7% and protect margins worth 2% to 5% of profit against sudden price spikes. Programmes cost $190, 000 to $560,000 and typically pay back within six to nine months once fully implemented. Manufacturers should qualify multiple sensor and camera supply pools, test alternative sourcing configurations and monitor specialty commodity markets closely, since single-source dependence raises production risk substantially across the category.
Market Impact: diversified sensor sourcing cuts total cost by 4-7% yearly

Expanding Much Wider Breeding Programme Distribution Reach

Seed companies, breeding programmes and procurement departments want reliable phenotyping supply, so manufacturers that expand application engineering and demonstration support across the global crop research base win contracts worth 4% to 8% of revenue at gross margins of 21% to 27%. Programmes cost $140,000 to $430,000 and typically require dedicated field representatives working directly with breeding engineering and procurement staff. Manufacturers should validate application and throughput data, test reliability extensively and secure breeding programme agreements, since less-advanced manufacturers lose volume to more-advanced competitors across the phenotyping channel over successive product generations. Few manufacturers match this reach today.
Market Impact: distribution support reach wins contracts worth 4-8% revenue

Who Controls the Margin Pool

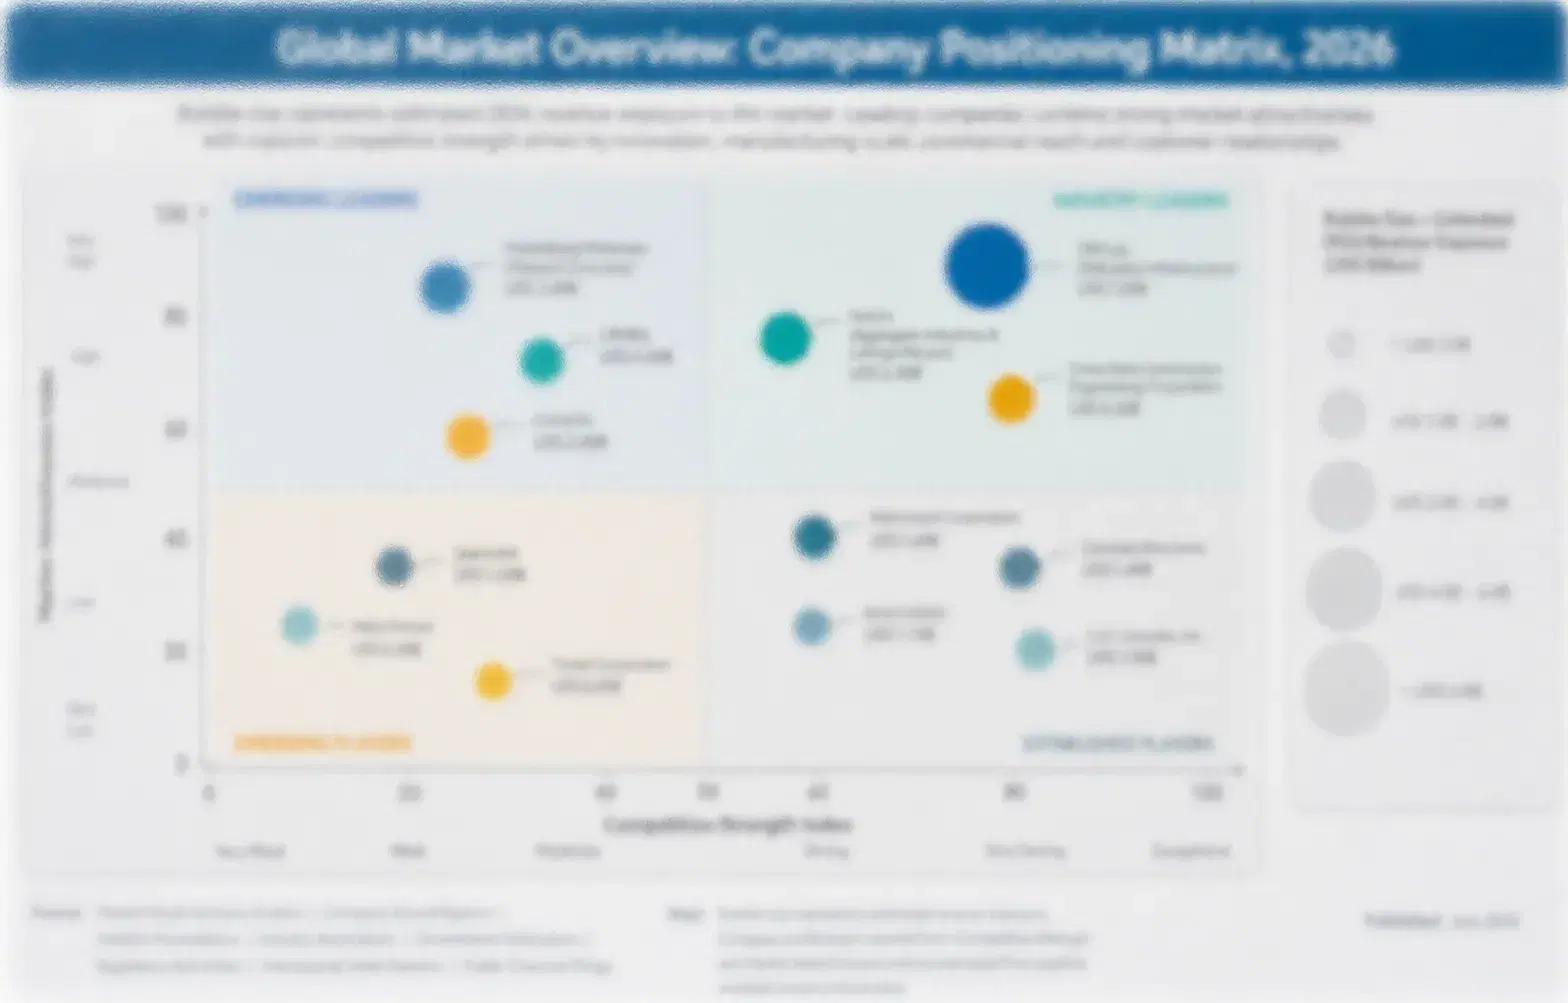
The global plant phenotyping market is fragmented, with a CR5 of 36%, because established phenotyping platform primes compete alongside diversified regional specialists across a broad worldwide breeding customer base. This assessment measures participants on estimated annual phenotyping system manufacturing and distribution revenue. LemnaTec GmbH and Phenospex B.V. lead through manufacturing scale and breeding programme relationships, and the gap to the sixth player remains meaningful across the category.
Competition runs on four dimensions today: imaging engineering depth, trait-correlation-testing breadth, sensor sourcing scale, and breeding programme distribution support breadth. Established phenotyping platform primes win on manufacturing scale and breeding programme relationships, diversified regional specialists win on niche application engineering and delivery responsiveness, and smaller manufacturers win on regional price competitiveness. Pricing power still concentrates among manufacturers holding the deepest testing and certification track records worldwide today.

Emerging pressure comes from UAV specification spreading further into mainstream breeding investment, from analytics software continuing to gain share in expanding research operations, and from manual scoring retention that pressures well-capitalised, certification-scaled manufacturers to keep investing in UAV product portfolios. Rankings shift where a manufacturer proves imaging engineering progress or wins faster analytics adoption.
plant-phenotyping-market-company-positioning-matrix-1790780552012

Competitive Moat and Risk Dimensions

LEMNATEC GMBH

Moat: National Phenotyping Manufacturing Scale

LemnaTec GmbH operates extensive phenotyping platform manufacturing infrastructure spanning multiple product categories, giving it throughput and reliability advantages that narrower regional specialists cannot match independently. Its engineering depth and breeding programme relationships give it strong access to global seed producers seeking reliable certification-backed support across diverse application configurations worldwide.
LEMNATEC GMBH

Risk: Manual Scoring Cost Risk

LemnaTec GmbH depends on continued UAV adoption to sustain its category growth, which creates execution risk as standard manual scoring retention persists longer than expected across several breeding programme budget markets. Imaging sensor costs squeeze margins across the category. Regional specialists keep narrowing this gap through targeted investment in their own dealer networks.
PHENOSPEX B.V.

Moat: Deep Breeding Programme Relationships

Phenospex B.V. operates established phenotyping technology backed by broad breeding programme relationships across multiple product categories, giving it market access that narrower specialists lack entirely. Its throughput depth and testing expertise give it strong access to global seed producers, particularly in the UAV and analytics extension channels.
PHENOSPEX B.V.

Risk: Concentration and Cost Pressure

Phenospex B.V.'s phenotyping system revenue still carries meaningful concentration relative to more diversified agtech competitors, creating pricing pressure as regional specialists expand their own low-cost sourcing capability. Imaging sensor costs squeeze margins and cost-competitive rivals compete on price aggressively across emerging breeding segments worldwide, particularly in price-sensitive South Asian and Latin American markets.

Players Tracked

Prominent Players

LemnaTec GmbH
Phenospex B.V.
Photon Systems Instruments
Keygene N.V.
Bayer AG

Other Key Players

Corteva Agriscience
BASF SE
Syngenta Group
Heliospectra AB
Phenome Networks Ltd
Delta-T Devices Ltd
Felix Instruments
CID Bio-Science Inc
Vivent SA
Carbon Bee AgTech
senseFly
AgEagle Aerial Systems Inc
Trimble Inc
Climate Corporation
Taranis Visual Ltd

Recent Developments

JANUARY 2026

Phenotyping Manufacturing Prime Expands UAV Production Capacity

A plant phenotyping prime manufacturer expanded its UAV production capacity to serve new breeding programme certification programmes across several upcoming research deployments, according to company communications reviewed by MMA analysts. It is an organic capacity expansion, not an acquisition or joint venture. Terms were not disclosed.
Signal: Confirms manufacturers are scaling UAV production because breeding demand keeps outpacing supply across renewal cycles. Few vendors can match this.
FEBRUARY 2026

Major Seed Company Signs Multi-Year Phenotyping Agreement

A major North American seed company signed a multi-year plant phenotyping supply agreement with a manufacturer covering multiple regional research facilities spanning several deployment phases over the coming procurement cycle, according to company communications reviewed by MMA analysts. It is a supply agreement covering multiple facilities.
Signal: Shows seed companies are locking in system supply because certified throughput reliability increasingly sustains sourcing decisions today.
MARCH 2026

Regional Distributor Announces New Imaging Sensor Partnership

A global agtech distributor announced a new specialty multispectral imaging sensor sourcing partnership intended to diversify component supply away from single-region dependence ahead of upcoming distribution cycles affecting several product lines, according to public filings reviewed by MMA analysts. It is a supply partnership, not an acquisition.
Signal: Indicates distributors are prioritizing sensor resilience because component availability increasingly determines production continuity. Few vendors can match this consistently today.

Multispectral Imaging Sensor Price Exposure

Multispectral imaging sensor and camera component cost accounts for roughly 38% of delivered cost, housing and assembly about 26%, labor and quality testing about 27%, packaging and logistics cost about 5%, with the remainder split across administrative overhead. Specialty imaging sensor supply concentrates among a handful of major producing regions worldwide. Buyers increasingly treat this as a standard requirement, not an option.
The clearest recent shock came in 2021 and 2022. IEA and industry commodity pricing data show semiconductor sensor and specialty optical component prices extending sharply amid supply chain pressure across major producing regions, which lifted delivered costs across the category given the industry's reliance on imported precision sensors. Manufacturers absorbed part of the increase, raised prices and diversified sourcing. Prices stabilised through 2024 and 2025 gradually.

The disadvantage falls on smaller manufacturers without material purchasing scale, hedging capital or diversified sourcing, because they pay more per unit and cannot spread fixed testing cost across large production volumes. Exposure varies by player type: established phenotyping platform primes hold purchasing scale and testing breadth, mid-tier regional specialists depend on regional import relationships, and smaller manufacturers depend on limited hedging capacity and narrower testing capability overall.
plant-phenotyping-market-cost-volatility-analysis-1790780552198

Multi-Year Imaging Sensor Supply Contracts

Manufacturers sign multi-year imaging sensor supply contracts and diversify sourcing across multiple producing regions to cut cost and capacity swings of 4% to 7% per year. The main challenge is refining availability commitment and quality consistency across regions, so teams test alternatives early each quarter. Manufacturers that skip this step face higher volatility exposure.

Shared Trait Correlation and Throughput Test Infrastructure

Manufacturers share trait-correlation and throughput validation testing infrastructure across multiple product categories and certification programmes to reduce fixed testing capital risk considerably across the broader business, planning capital allocation carefully each cycle so seasonal demand spikes do not strain shared facilities unexpectedly. Buyers increasingly expect this shared infrastructure as standard practice today across the category.

Price Architecture and Long-Term Breeding Supply Contracts

Manufacturers use price architecture and long-term supply contracts with major global seed company and breeding groups to recover 9% to 16% of cost increases without sudden price shocks disrupting customer relationships across renewal cycles each year. Manufacturers that secure these terms early hold steadier margins than rivals negotiating one cycle at a time, particularly during volatile pricing periods.

Portfolio Architecture for Margin Defence

Margins run from moderate returns on standard field-based and laboratory platforms to strong returns on UAV and data analytics systems sold with documented certification depth. Three tiers separate volume products, premium certified products and next-generation solutions, and each draws on different testing capability and breeding programme trust in a fragmented market. Margin gaps between tiers run to 13 points, with certified UAV systems sitting at the top of that range.
The tension between volume and premium is sharp. Standard field-based and laboratory platforms fill fleet volume at moderate prices and face sensor cost swings, while UAV and data analytics systems earn higher margins on smaller volumes and depend on certification proof, testing investment and breeding programme trust. Manufacturers running only standard system volume suffer when sensor costs rise together and cannot easily pass through increases.

High-value pools concentrate in UAV systems and in data analytics software sold through documented certification and testing programmes to breeders chasing throughput performance beyond baseline standard capability. They gather where buyers pay for verified testing depth and certification status, not volume alone. Greenhouse systems add a further specialty pool worth watching closely.

Volume / Commodity-Adjacent

Standard field-based platforms and basic laboratory units sold on cost per unit through established distributor and direct manufacturer contracts. Buyers focus on cost and proven reliability, and differentiation is limited by shared manufacturing processes across suppliers today.
Gross Margin: 16%-20%

Premium / Certified

Greenhouse and controlled-environment systems with documented trait-correlation data sold through distributor tier-one relationships. Buyers value proof of quality consistency and reliable supply, and contracts run for multi-year breeding programme terms. Manufacturers compete mainly on proven testing depth.
Gross Margin: 20%-26%

Sustainability / Regulatory / Next-Generation

UAV and drone-based phenotyping systems and phenotyping data analytics software sold to breeders demanding documented throughput performance and certification testing depth. Sales depend on trial proof and certification depth, and manufacturers must show reliable production consistency.
Gross Margin: 27%-34%
plant-phenotyping-market-portfolio-architecture-1790780552392

High-value Sub-segments and Strategic Watch-out

UAV/Drone-Based Phenotyping Systems

UAV systems combine the fastest growth with the strongest pricing, since breeding programmes accept gross margins of 27% to 34% for documented aerial throughput with proven certification consistency. Imaging engineering depth forms the entry barrier for entrants, and flight-control cost keeps most smaller manufacturers out entirely.

Phenotyping Data Analytics Software

Analytics software delivers solid growth with premium pricing, since breeders support gross margins of 24% to 31% for documented extraction and reliability data. Testing scale and distributor access limit competition, though adoption varies by programme tier across served markets overall today. Few vendors can match this consistently today.

Field-Based Phenotyping Platforms

Field-based platforms form the volume core, with value growing at a modest pace as the category matures gradually across the global breeding buyer base. Manufacturing cost, consistency and price competition decide profit across the mainstream segment overall, leaving thin margins for undifferentiated producers. Few vendors can match this consistently today.

Greenhouse/Controlled-Environment Systems

Greenhouse systems form the strategic watch-out, since growth trails the leaders, UAV segment consolidation pressure increasingly compresses baseline volume and generic manufacturer entry adds persistent margin risk over time. Manufacturers must differentiate on niche precision or accept shrinking share as buyers migrate to UAV alternatives.

Why Throughput Trust Locks Renewal

System demand behaves like an annuity attached to every breeding programme's full research certification cycle, reinforced by the certification ceiling that throughput testing imposes on switching manufacturers mid-programme regardless of cost pressure. Once a breeding programme certifies a manufacturer's throughput reliability, purchases repeat across the entire research fleet lifecycle.
Adoption stickiness differs by end-use vertical. Large-scale seed company and public breeding programmes running documented certified UAV or analytics systems are the deepest, since the purchase is grounded in both certification depth and selection-efficiency economics. Mid-market agronomic research and university upgrades are moderately sticky, driven by cost competitiveness and periodic budget review. Legacy or manual-scoring-only research programmes without long-term commitment are more fluid, adopting the cheapest available option only as budgets allow. That pattern holds across most comparable breeding programmes reviewed this year.

Buyer profiles are shifting across generations of global breeding decision-makers. Older breeding scientists relied on proven manual scoring exclusively and simple cost comparison, while younger scientists increasingly research throughput data, demand certification transparency and adopt UAV-grade design preferences. Manufacturers that publish clear testing data win these newer buyers consistently across the phenotyping procurement channel. Manufacturers that document this consistently win renewal decisions over less-prepared rivals.
plant-phenotyping-market-end-use-penetration-index-1790780552576

MMA Verdict: Phenotyping Strategy

These are among the four positions where our research anticipates prominent divergence between winners and laggards over the coming forecast period. Each is grounded in the demand model, the regulatory perimeter, and the announced capacity pipeline.
01 / IMAGING ENGINEERING STRATEGY

Invest in UAV Before Rivals Capture Demand

Seed companies and breeding programmes want documented sustained throughput performance across every breeding-scale variant, and manufacturers that invest in flight control and multispectral imaging engineering and testing capacity win contracts worth 17% to 22% of revenue at gross margins of 27% to 34%. Manufacturers should invest $610,000 to $1.8 million, validate throughput and accuracy data and secure breeding programme certification alignment across every application class served. Those that delay will lose category momentum over the next two years, while early movers hold higher prices and durably stronger margins across every.
02 / TRAIT TESTING STRATEGY

Build Testing Before Rivals Own Breeding Trust

Breeding engineers want documented performance repeatability across every contested breeding-scale scenario, and manufacturers that build trait-correlation and throughput-testing capability spanning multiple system generations win contracts worth 8% to 11% of revenue at gross margins of 24% to 31%. Manufacturers should invest $370,000 to $1.1 million, document application-specific throughput performance and publish validation success rates thoroughly across every cycle. Those that delay will lose contracts and breeding trust over the next two years, while early movers hold much stronger relationships and durably better margins.
03 / SENSOR SOURCING STRATEGY

Diversify Sourcing Before Supply Swings Erode Margins

Multispectral imaging sensor and camera component cost makes up about 38% of cost, and manufacturers that expand diversified sensor sourcing capacity across multiple producing regions cut cost and supply swings by 4% to 7% and protect margins worth 2% to 5% of profit. Manufacturers should invest $190,000 to $560,000, qualify sensor supply pools and test alternative sourcing configurations across import lines. Those that delay will pay rising input bills and lose pricing power over the next two years, while early movers hold durably lower costs.
04 / DISTRIBUTION SUPPORT STRATEGY

Expand Reach Before Rivals Capture Breeding Volume

Seed companies, breeding programmes and procurement departments want reliable phenotyping supply, and manufacturers that expand application engineering and demonstration support across the global crop research base win contracts worth 4% to 8% of revenue at gross margins of 21% to 27%. Manufacturers should invest $140,000 to $430,000, validate application and throughput data and test reliability extensively across every project. Those that delay will lose contracts and breeding trust steadily over the next two years, while early movers hold stronger relationships and better margins across every renewal.

Engagement Snapshot From the Field

A live engagement with an industry participant carrying material or product regulatory and market exposure ahead of a defining policy shift, showing how our research translates into a defensible multi-year portfolio strategy.
MARKET MINDS ADVISORY · CLIENT ENGAGEMENT SUMMARY
Plant Phenotyping Producer Strategic Portfolio Review and Transition Roadmap 2026·Investment Scenario on Plant Phenotyping Exposure Evaluation 2025-26
CLIENT PROFILE
The client is a regional seed company breeding programme operating roughly seven trial locations within North America (client-reported, unverified by MMA), migrating its full manual scoring fleet to certified UAV standard ahead of a major selection-efficiency target planned for the next operating year and beyond, as trial volume keeps expanding across its portfolio today steadily.
STRATEGIC CHALLENGE
The programme needed certified UAV deployment across five trial locations within a ten-month window (client-reported, unverified by MMA), existing manufacturer capacity remained limited to pilot volume only, and programme leadership had to decide whether to qualify a second manufacturer or delay conversion until additional units became widely and reliably available across every location.
MMA APPROACH
MMA analysed phenotyping economics and manufacturer qualification trade-offs across three distinct scenarios, interviewed five breeding scientists and competing phenotyping manufacturers, and modelled cost and timeline trade-offs between dual-sourcing and single-manufacturer scaling over a ten-month planning horizon. Findings were benchmarked against two comparable conversion programmes completed within the prior two years.
KEY FINDINGS
  1. Dual-sourcing certified UAV systems from two qualified manufacturers would reach full project readiness within the stated ten-month timeline, per the detailed assessment conducted this quarter.
  2. Two competing manufacturers offered dedicated conversion support matched closely to the programme's location mix and deployment timeline, per the detailed engagement review.
  3. Achieving full deployment before the selection-efficiency target would require a phased approach spanning five separate trial locations simultaneously (client-reported, unverified by MMA).
  4. The incumbent manufacturer expressed clear willingness to accelerate its own conversion capacity once dual-sourcing formally began, per the detailed documented engagement finding.
CLIENT PROFILE
The client is a regional seed company breeding programme operating roughly seven trial locations within North America (client-reported, unverified by MMA), migrating its full manual scoring fleet to certified UAV standard ahead of a major selection-efficiency target planned for the next operating year and beyond, as trial volume keeps expanding across its portfolio today steadily.
STRATEGIC CHALLENGE
The programme needed certified UAV deployment across five trial locations within a ten-month window (client-reported, unverified by MMA), existing manufacturer capacity remained limited to pilot volume only, and programme leadership had to decide whether to qualify a second manufacturer or delay conversion until additional units became widely and reliably available across every location.
MMA APPROACH
MMA analysed phenotyping economics and manufacturer qualification trade-offs across three distinct scenarios, interviewed five breeding scientists and competing phenotyping manufacturers, and modelled cost and timeline trade-offs between dual-sourcing and single-manufacturer scaling over a ten-month planning horizon. Findings were benchmarked against two comparable conversion programmes completed within the prior two years.
KEY FINDINGS
  1. Dual-sourcing certified UAV systems from two qualified manufacturers would reach full project readiness within the stated ten-month timeline, per the detailed assessment conducted this quarter.
  2. Two competing manufacturers offered dedicated conversion support matched closely to the programme's location mix and deployment timeline, per the detailed engagement review.
  3. Achieving full deployment before the selection-efficiency target would require a phased approach spanning five separate trial locations simultaneously (client-reported, unverified by MMA).
  4. The incumbent manufacturer expressed clear willingness to accelerate its own conversion capacity once dual-sourcing formally began, per the detailed documented engagement finding.
RECOMMENDED STRATEGY
Phase 1: Phase 1 (Months 1-3): Secure second manufacturer commitment through a documented conversion investment plan and formal contract review, agreed within the first quarter. Phase 2: Phase 2 (Months 4-8): Complete parallel certified system deployment testing across all five trial locations, tracking performance metrics against baseline targets. Phase 3: Phase 3 (Months 9-10): Ramp location coverage fully and document conversion performance results against original targets, finalizing a formal report for programme sign-off.
OUTCOME
Within ten months, the programme secured full deployment and hit its selection-efficiency target without delay (client-reported, unverified by MMA). Leadership credited the dual-sourcing approach with managing supply risk while meeting the programme's aggressive conversion timeline and budget, and plans to apply the same model to its next fleet renewal cycle.

Frequently Asked Questions

Foundational context covering the market sizes, CAGR, scope, country, region and competition that inform every finding below. This section is provided to cover basics and most often pre-purchase conversations, answered from the MMA Primary Research Dataset.

What is the current size of the plant phenotyping market?

The plant phenotyping market was valued at $0.42 billion in 2025 on a manufacturer and distribution revenue basis. Growth comes from seed company breeding investment, precision agriculture adoption and imaging engineering sophistication.

How large will the market be by 2036?

The market is projected to reach $1.222 billion by 2036, up from $0.463 billion in 2026. The increase of $0.760 billion reflects UAV and analytics software adoption.

What is the CAGR for the market 2026 to 2036?

The market is forecast to grow at a 10.2% CAGR from 2026 to 2036. The bull case reaches 11.5% and the bear case 8.9%, depending on seed company breeding investment pace and manual scoring retention trends.

Which segment is growing fastest?

UAV and Drone-Based Phenotyping Systems is the fastest-growing segment at 14.28% CAGR, roughly 1.40 times the overall market rate. Phenotyping Data Analytics Software follows at 12.24% CAGR, about 1.20 times the overall rate.

Who are the major companies in the market?

Major companies include LemnaTec GmbH, Phenospex B.V., Photon Systems Instruments, Keygene N.V. and Bayer AG. Corteva Agriscience, BASF SE and Syngenta Group round out the manufacturer group.

Which country is growing fastest?

Within the broader supplier base, South Asia and Pacific composite growth reaches about 12.2% CAGR, because expanding Indian breeding programme and Australian grain research investment keeps driving demand higher.

Report Segmentation Architecture

The full report scope spans multiple orthogonal segmentation dimensions, with cross-tabulated demand data provided for each dimension pair. Coverage extends further to regional breakdowns, trend trajectories, and the competitive detail needed to support segment-level decision-making.

By Primary Market Dimension

  • Field-Based Phenotyping Platforms
  • Greenhouse/Controlled-Environment Systems
  • UAV/Drone-Based Phenotyping Systems
  • Laboratory/Benchtop Systems
  • Imaging Sensors/Cameras
  • Data Analytics Software

By End-Use Industry

  • Commercial Seed Company Breeding
  • Public University and Government Breeding
  • Agronomic Field Research
  • Controlled-Environment Crop Research

By Commercial Dimension

  • Direct Breeding Programme Procurement
  • Distributor Channel Sales
  • OEM Integration Contracts
  • Long-Term Data Service Contracts

By Region

  • North America
  • Western Europe
  • East Asia
  • South Asia and Pacific
  • Latin America
  • Middle East and Africa
  • Eastern Europe

Scope, Methodology, and Coverage

Every figure in this report is reproducible from documented input assumptions. The scope below maps the historical period, the forecast horizon, the segmentation dimensions, and the countries covered, alongside the underlying primary and qualitative methodology.
Historical Period
2020 to 2025
Forecast Period
2026 to 2036
Base Year
2025 (USD billions; MMA Primary Research Dataset, September 2026)
Market Definition
The market covers high-throughput plant trait measurement systems used in crop breeding and agronomic research, including field-based phenotyping platforms, greenhouse and controlled-environment phenotyping systems, UAV and drone-based phenotyping systems, laboratory and benchtop phenotyping systems, and imaging sensors and cameras, plus phenotyping data analytics software. It excludes general-purpose agricultural drones sold without phenotyping-specific imaging payloads, soil testing equipment, and standard weather monitoring stations, which fall under separate dedicated reports.
Quantitative Units
USD billions (manufacturer and distribution revenue); unit shipment counts for volume references
Segmentation Dimensions
By Measurement Platform and Imaging Technology; By End-Use Industry; By Commercial Dimension; By Region
Regions Covered
North America, Western Europe, East Asia, South Asia and Pacific, Latin America, Middle East and Africa, Eastern Europe
Countries Covered
Global, with detailed coverage of United States, Germany, Netherlands, India, and 15 additional markets
Key Companies Profiled
LemnaTec GmbH, Phenospex B.V., Photon Systems Instruments, Keygene N.V., Bayer AG, Corteva Agriscience, BASF SE, Syngenta Group, Heliospectra AB, Phenome Networks Ltd, Delta-T Devices Ltd, Felix Instruments, CID Bio-Science Inc, Vivent SA, Carbon Bee AgTech, senseFly, AgEagle Aerial Systems Inc, Trimble Inc, Climate Corporation, Taranis Visual Ltd
Quantitative Methodology
Primary survey, n=3,800 respondents, Q4 2025, six countries; demand-side model with trade association cross-validation
Qualitative Methodology
47 expert interviews, Q4 2025; applied to validate demand model assumptions, identify emerging dynamics, and assess competitive positioning
Report Format
PDF and XLSX data workbook (Word format preview document)
Publisher
Market Minds Advisory
Report Code
MMA-2026-AGR-302
Published
September 2026
Contact
sales@marketmindsadvisory.com | www.marketmindsadvisory.com

Purchase the full Plant Phenotyping Market Report (2026 to 2036).

The full report delivers a detailed assessment of the global plant phenotyping market through 2036, covering measurement platform, end-use industry, and research-level forecasts, competitive benchmarking of leading phenotyping platform primes and diversified regional specialists, and detailed input cost analysis. It combines MMA primary research, including a six-country survey of 3,800 respondents and 47 expert interviews, with public statistical and company data. A dedicated chapter benchmarks imaging engineering investment against realistic payback timelines for both diversified and specialist manufacturers. Regional appendices detail programme-specific certification requirements for buyers.
Ten-year product and research-level demand forecasts
Imaging Sensor Sourcing Cost Tracker. Few vendors can match this.
Competitive benchmarking of leading manufacturers today
System certification and throughput testing tracker
Global regional comparative analysis across major breeding hubs
Quarterly primary survey data update access

Built For The People Who Decide

From boardroom strategy to bench-side execution, this report is read cover-to-cover by leaders shaping the next decade of their industry, turning demand scenarios, market dynamics and valuation benchmarks into decisions.
CXOs/ Presidents/ VPs/ Managers
M&A and Corporate Development
Strategy Teams and R&D Heads
Procurement and Product Directors
Regulatory and Compliance Leaders
Investor Relations and Equity Analysts