Market Minds Advisory
Pipeline Safety Market

Pipeline Safety Market: Pipeline Safety Market: System Functions, Regulatory Spending Floors and Detection Thresholds 2026 to 2036

A pipeline leak small enough to escape the control room can run for six weeks before a farmer notices the smell. Everything in this market exists to shorten that interval, and regulation decides how much.

Lead Analyst

Published

September 2026

Make Smarter Decisions with Customized Research Insights

Request a free sample report and evaluate market opportunities, growth trends, and competitive dynamics relevant to your business needs.

2025 MARKET VALUE$7.4BMarket Size 2025
2036 FORECAST VALUE$15.2BBase Case , 2026 to 2036
CAGR 2026 TO 20366.8 %Bull 8.0% / Bear 5.6%
INCREMENTAL OPPORTUNITY$7.3BNet 10- year value creation
EXPANSION MULTIPLE1.93x2036 value over 2026 base
Strategic Levers
M&A Pipeline
Regional Outlook
Country Rankings
Competitive Intelligence
Segmental Deep-dive
Call-Us : 91 93563 13602

Executive Snapshot and Market Trajectory.

Conventional leak detection watches what goes in against what comes out and cannot see anything under about 1% of flow. On a large transmission line that threshold is thousands of barrels a day. Everything expensive in this market exists because of that gap and what it costs to close it.
The market reaches USD 7.90 billion in 2026 and USD 15.25 billion by 2036, a 1.93 times expansion at 6.8%. Leak detection and distributed fibre sensing grow at 10.2%, half again the market rate of 6.8%, because fibre along the right of way hears a leak that mass balance never will. North America holds 30% of spending on the largest regulated network anywhere and the enforcement to match. India grows fastest at 10.6%.
Five suppliers hold 28% of integrity and safety contract revenue, the most fragmented concentration in energy infrastructure services. Baker Hughes, NOV and ROSEN dominate inline inspection, which is a specialist tooling business. Emerson and Honeywell come at it from control systems. Neither group competes with the other, and a great many regional service firms hold the corrosion and cathodic protection work nobody else wants.
Market Definition
This report covers systems, tools and services that detect, prevent and manage pipeline integrity failures on hydrocarbon and hazardous liquid transmission and gathering lines: inline inspection tools and services, leak detection and distributed sensing, cathodic protection and corrosion control, supervisory control and emergency shutdown systems, right of way monitoring, and integrity management software. It excludes pipeline construction and pipe manufacture, compression and pumping equipment, midstream terminal and storage safety, and water and sewer network monitoring.
Base Year Value
$7.4B in 2025 (MMA Primary Research Dataset, September 2026)
Forecast Period
2026 to 2036, eleven discrete annual values
CAGR
6.8% base case. Bull 8.0%. Bear 5.6%.
Fastest Growth Segment
Leak Detection and Distributed Fibre Sensing: 10.2% CAGR
Fastest Growth Country
India: 10.6% CAGR
Fastest Growth Region
South Asia and Pacific: 9.0% CAGR
Largest Region
North America: 30% of 2025 global value
Market Leaders
Baker Hughes, NOV, ROSEN Group, T.D. Williamson and Emerson Electric lead on pipeline integrity and safety contract revenue. Source: MMA Analysis.
Primary Survey
n=3,800 procurement and R&D decision-makers, Q4 2025, six countries
Methodology
Demand-side build-up, cross-validated against public data, 47 expert interviews

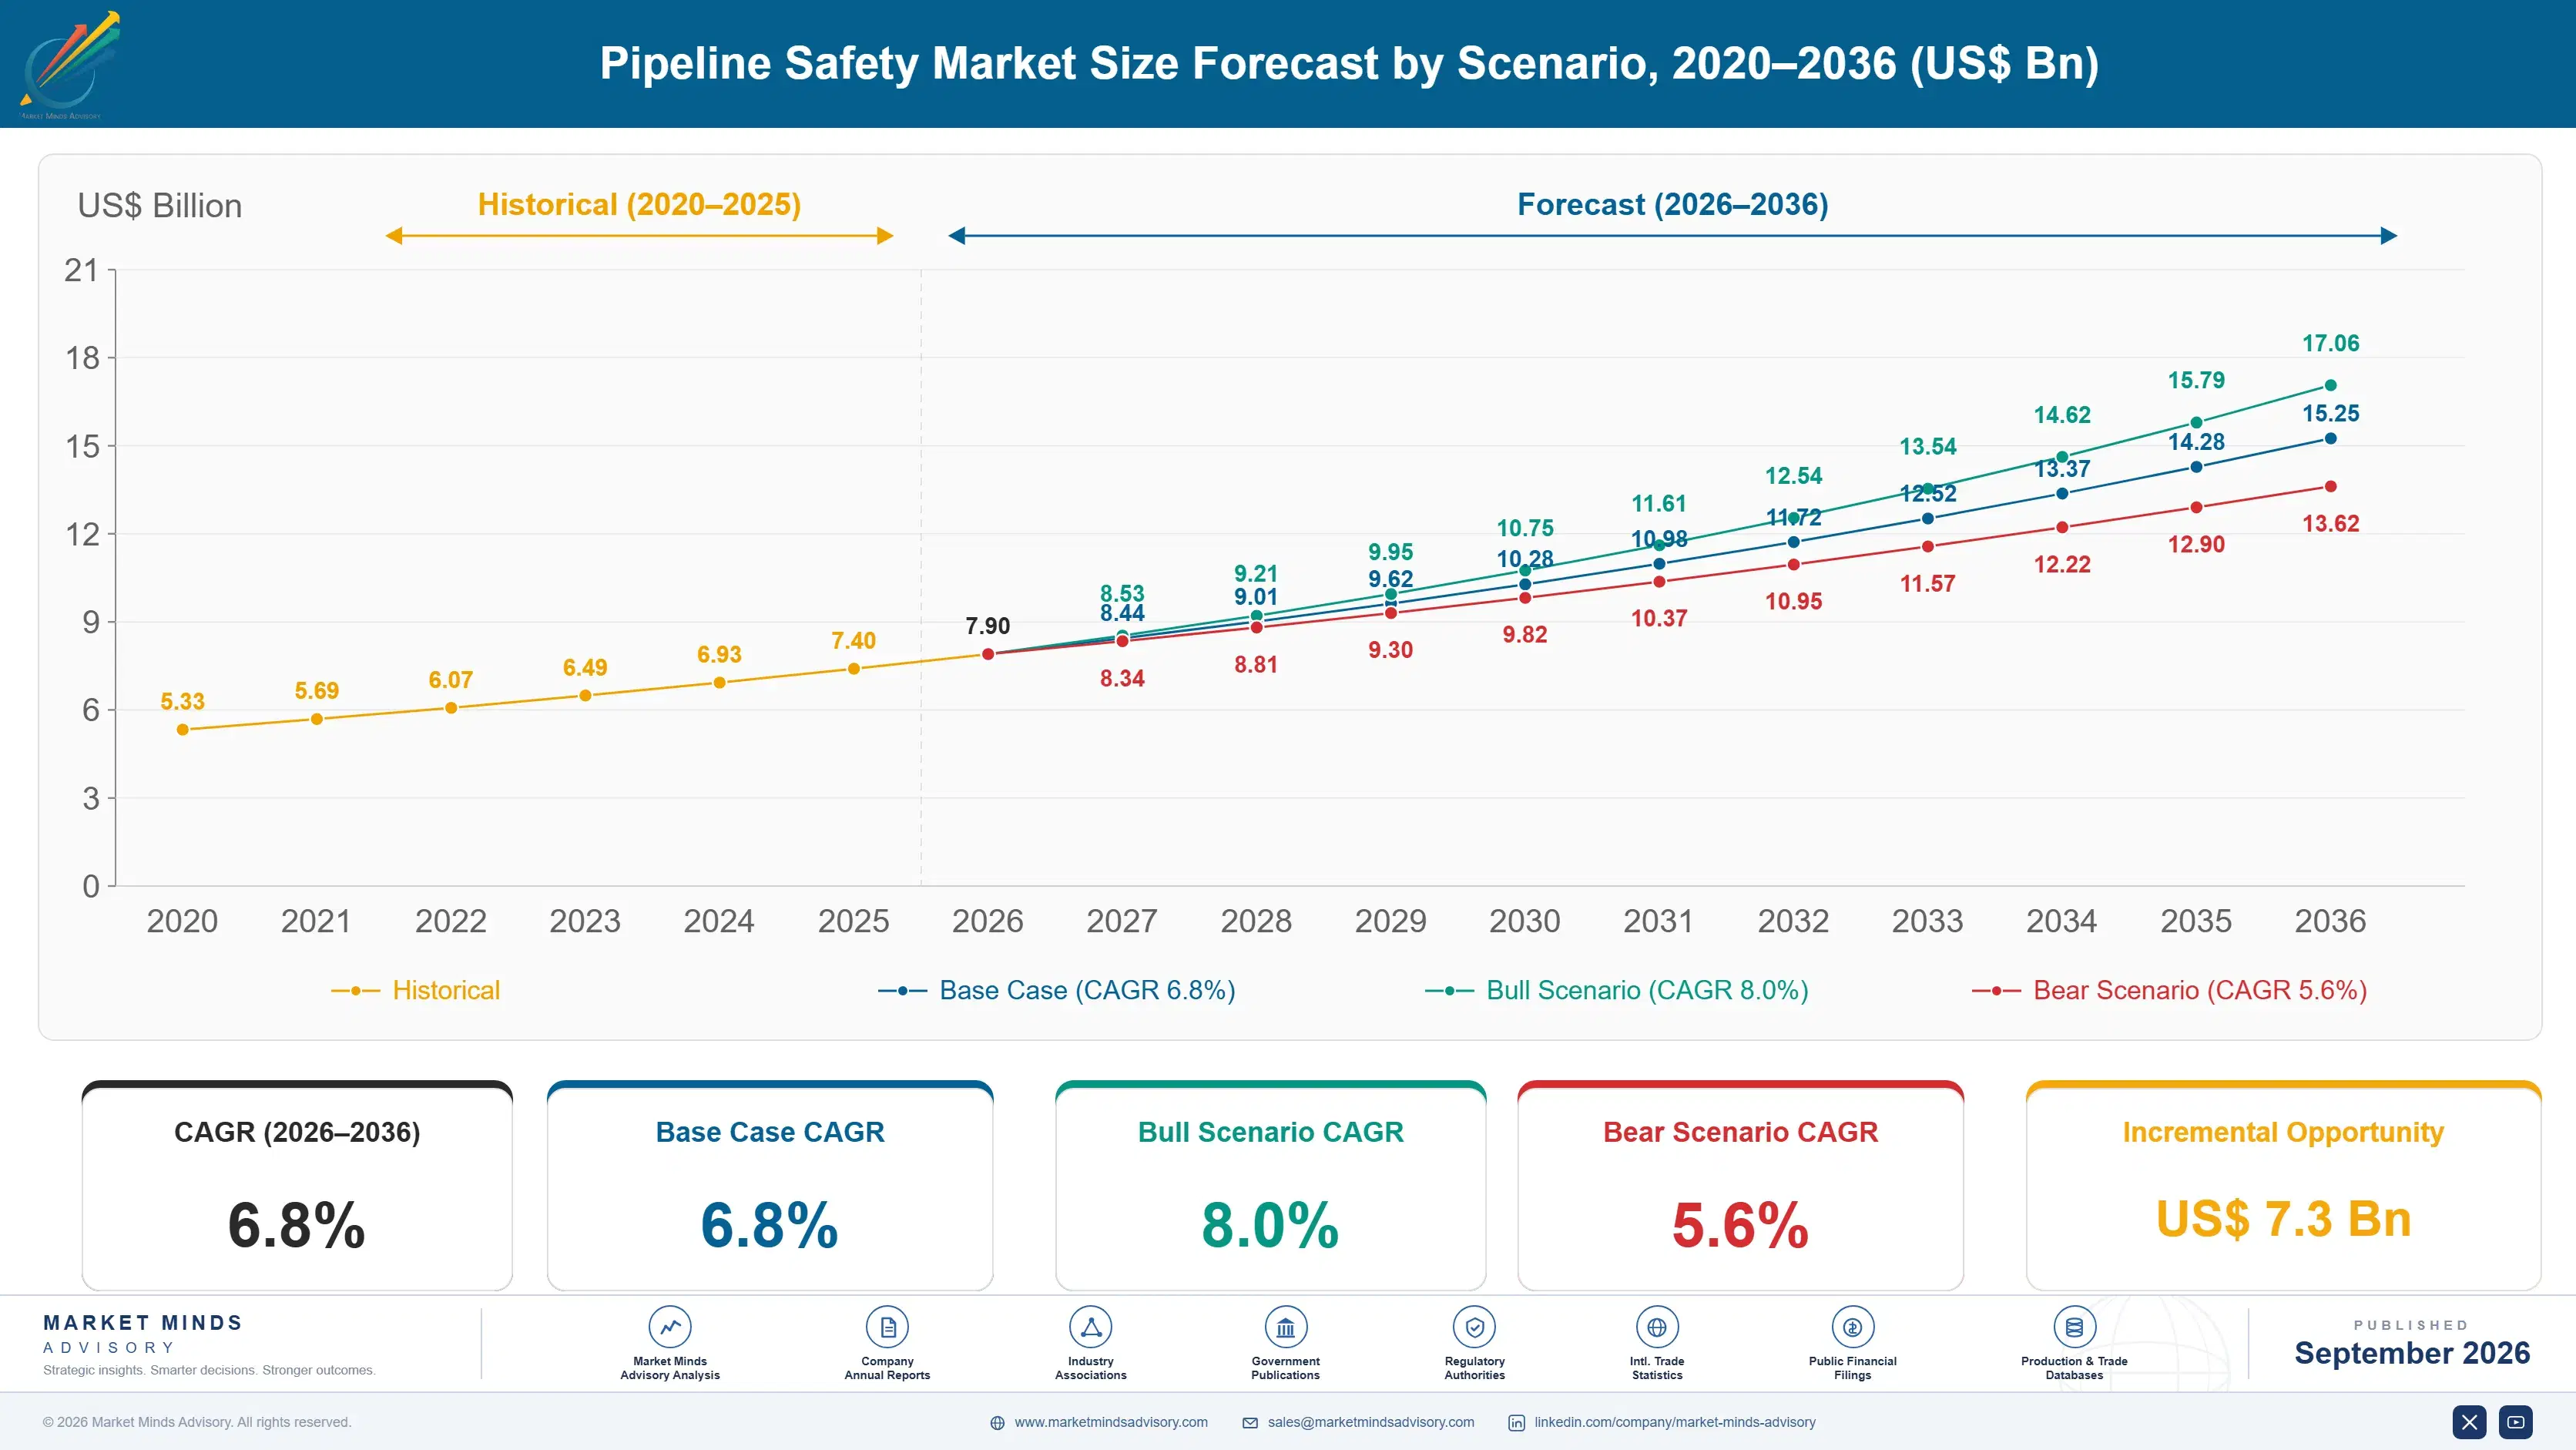
Pipeline Safety Market Forecast Scenarios

pipeline-safety-market-size-forecast-scenario-1789985129250
Between 2020 and 2025 the category compounded at 5.8% and regulation set the pace, as always. American reassessment rules pushed inline inspection volume up steadily. The 2020 downturn deferred discretionary integrity work by a year in several regions, and the deferral moved the spend rather than removing it, because the reassessment clock does not pause for a commodity cycle.
The base case holds 6.8% on three mechanisms. Network age is the largest: much American and European transmission line was laid before 1970 and corrosion causes roughly a quarter of reported incidents, forcing reassessment spend regardless of throughput. Methane regulation has turned leak detection from a safety obligation into an emissions one, with different thresholds and far more frequent measurement. And Indian and Chinese gas grid construction adds kilometres carrying monitoring specified at design rather than retrofitted.
The bull case at 8.0% assumes methane rules tighten to continuous monitoring requirements, which would put fibre or equivalent sensing on line that currently gets a periodic survey. The bear case at 5.6% is regulatory rollback: American enforcement intensity has varied with administration for two decades, and operators spend to the requirement rather than beyond it, so a relaxed rule reduces the market immediately.

What The Control Room Cannot See

Mass balance leak detection compares what enters a pipeline with what leaves it, corrected for temperature, pressure and inventory. It is reliable, it has been standard for forty years, and its practical resolution is around 1% of flow. A pinhole corrosion leak on a large transmission line falls well under that, which means it releases product for as long as it takes somebody outside to notice.
TOP FIVE CONCENTRATION28%Fragmented across inspection specialists and industrial automation suppliers
GLOBAL PIPELINE NETWORK3.5 million kmTransmission and gathering length subject to integrity regulation
INLINE INSPECTION INTERVAL7 yearsMaximum reassessment period under most transmission integrity rules
LEAK DETECTION THRESHOLD1% flowSmallest release reliably identified by conventional mass balance
CORROSION INCIDENT SHARE26%Portion of reported incidents attributed to material degradation
INTEGRITY SPEND PER KILOMETREUSD 2400Annual operator outlay across inspection, monitoring and protection
Fibre optic sensing along the right of way changes the physics of the problem. A leak makes noise and a temperature change, and a fibre buried alongside the line detects both, localising to within a few metres over tens of kilometres. It also hears an excavator, which addresses third-party strike, the other large cause of incidents. That is why this segment compounds at 10.2%.
The commercial pattern is unusual and worth stating plainly. Operators spend on integrity up to the regulatory requirement and to whatever their insurers demand, and very rarely beyond it. Nobody has ever been promoted for over-inspecting a pipeline that did not leak. The market therefore tracks rulemaking and enforcement rather than pipeline throughput, which makes it unusually predictable and unusually vulnerable to political change.
"Every operator in this industry can tell you the cost of an inline inspection run and none of them can tell you the cost of the leak it prevented. That asymmetry is why the regulator writes the budget, not the engineer."
Director, Energy Infrastructure Integrity Practice · MMA Energy Practice · September 2026

Market Trends

Methane Rules Turn Leak Detection Into Emissions Compliance

Leak detection used to be a safety function measured against release volume and public risk. Methane regulation in the United States and the European Union has made it an emissions obligation instead, with detection thresholds set far lower and measurement required far more often than any safety rule demanded. An operator who satisfied a safety regulator with quarterly aerial survey now faces a requirement that periodic inspection cannot meet at all. That single reframing is doing more for continuous monitoring adoption than four decades of incident statistics managed. Nobody in the industry saw it coming.
Market Impact: Procurement waves follow within 2 years
Ageing Networks Force Reassessment Regardless Of Throughput

Much of the American and Western European transmission network was laid before 1970, on coating systems and steel grades that were adequate then and are approaching the end of any reasonable design life now. Corrosion accounts for roughly 26% of reported incidents, and the proportion rises with line age in a way nobody disputes. Reassessment intervals of up to 7 years apply regardless of how much product moves through, which means integrity spend continues through downturns that halt everything else in the sector. Operators describe it as the only line item they cannot defer.
Market Impact: India compounds at 10.6% annually

Market Opportunities and Growth Drivers

Single Incident Costs Exceed Decades Of Prevention

A significant rupture on a hazardous liquid line produces cleanup cost, civil penalties, litigation and a consent decree that dictates integrity spending for years afterwards, and the total routinely exceeds what continuous monitoring across the whole system would have cost. Operators know this and still underspend, because the cost is a low-probability event and the budget is annual. What changes behaviour is an incident at a peer company, which reliably produces a wave of integrity procurement across the industry within about 2 years. The regulator and the insurer do the rest.
Market Impact: Spending stops at 100% compliance

Gas Grid Construction Across India And China

India is building a national gas grid on a scale that has no recent parallel, and Chinese pipeline construction under a consolidated national operator continues at volume. New line is fitted with monitoring at design rather than retrofitted at reassessment, which is both cheaper and more capable, and fibre laid in the same trench as the pipe costs a fraction of what retrofitting later would. India grows at 10.6%, faster than any other country here. Suppliers positioned only for retrofit work on mature networks are missing the segment that is actually expanding.
Market Impact: Affects 40% of gathering line

Market Restraints and Challenges

Operators Spend To The Rule And No Further

Integrity budgets are set against regulatory requirement and insurer demand rather than against engineering judgement, and almost nobody spends beyond either. The root cause is incentive: the cost of inspection is visible and annual, while the benefit is a leak that did not happen and cannot be measured or credited to anyone. Commercially this caps the market at whatever the rulebook requires and makes every supplier's forecast a bet on rulemaking. Mitigation runs through insurance-linked arguments and through emissions accounting, both of which put a number on prevention that a safety case never could.
Market Impact: Thresholds fall below 1%

Unpiggable Line Remains Beyond Conventional Inspection Tools

A meaningful share of gathering and distribution line cannot accept an inline inspection tool, because of diameter changes, tight bends, valve restrictions or the absence of launch and receive facilities. The root cause is that these lines were built before inspection was a design consideration and retrofitting the fittings costs more than the line is worth. Commercially this leaves a substantial part of the network inspectable only by indirect methods that regulators accept reluctantly. Mitigation runs through robotic crawlers, tethered tools and external sensing, all of which cost several times a conventional run.
Market Impact: Reassessment runs every 7 years
3 additional market trends, 4 additional growth drivers, and 2 additional restraints and challenges are covered in the full report. Contact sales@marketmindsadvisory.com to access the complete intelligence.

Segment CAGR and Growth Architecture

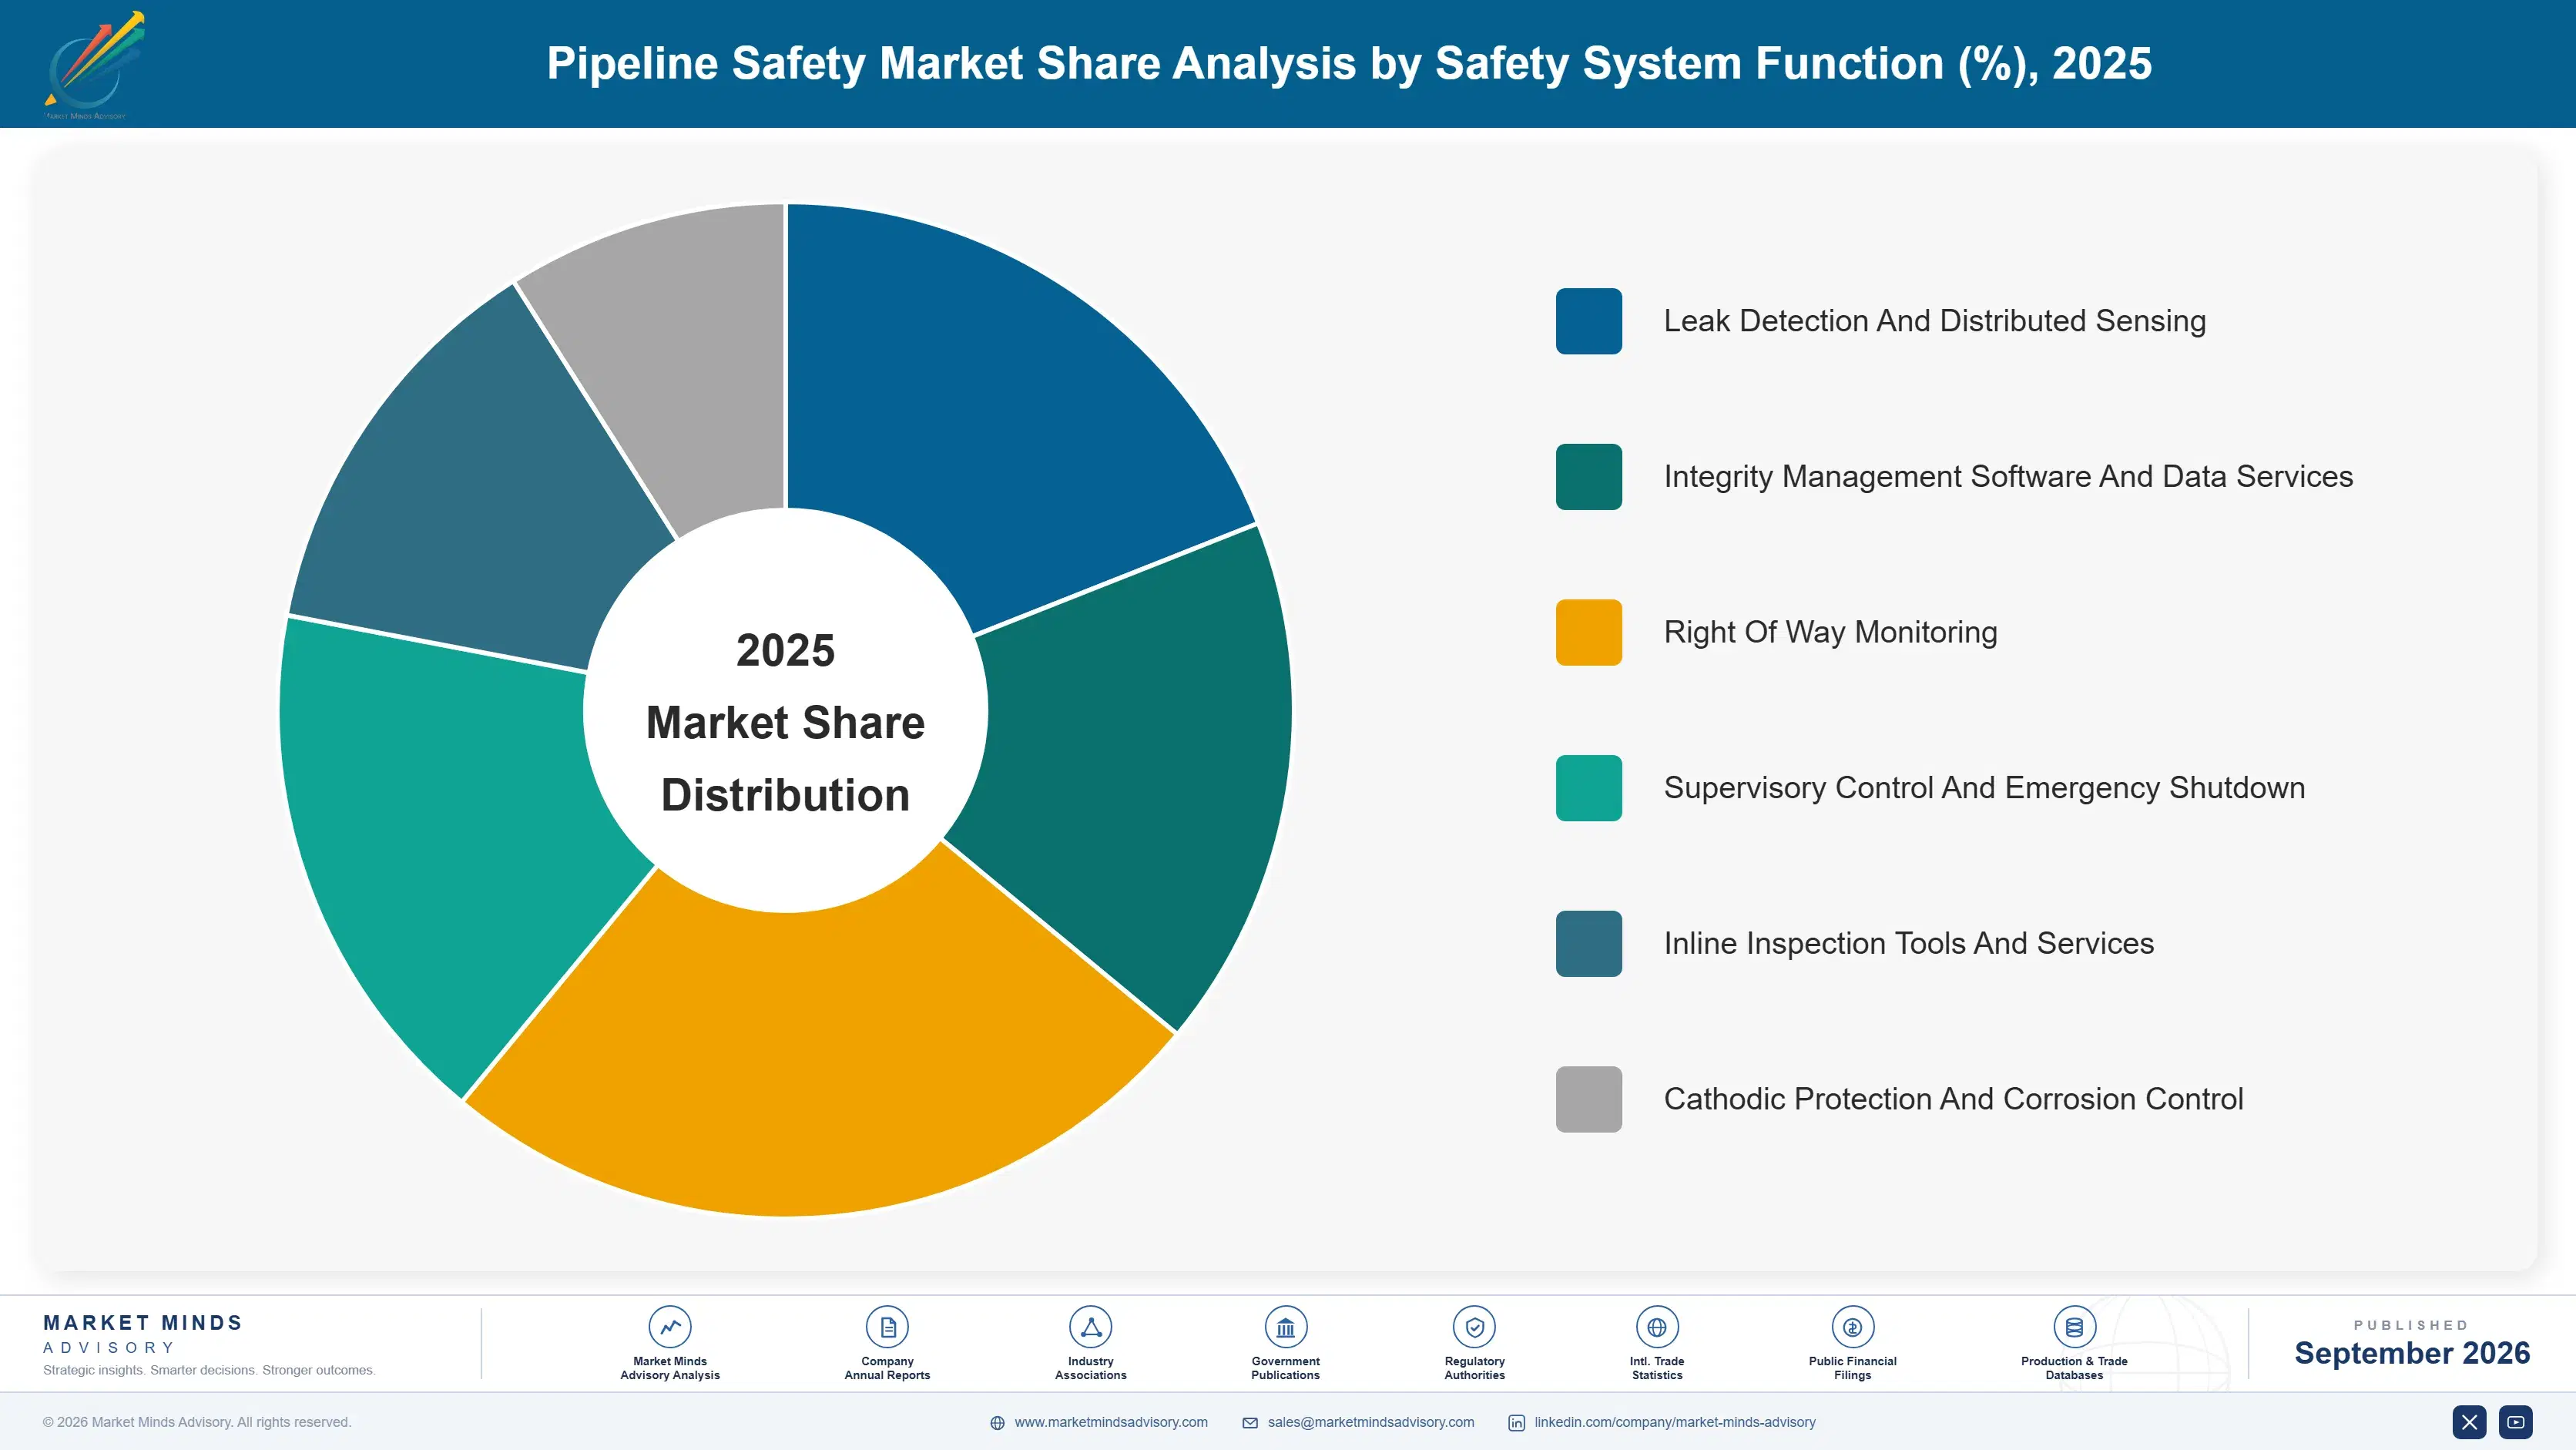
Segmentation follows safety system function, since detection method, deployment model and regulatory standing decide what an operator buys. Six functions cover the market: leak detection and distributed sensing, integrity management software and data services, right of way monitoring, supervisory control and emergency shutdown, inline inspection tools and services, and cathodic protection and corrosion control. Commodity type is a separate dimension.
pipeline-safety-market-market-share-analysis-1789985129816

Leak Detection and Distributed Fibre Sensing

Leak detection and distributed sensing grow at 10.2%, half again the market rate of 6.8%, and fibre optics are why. Mass balance detection resolves to about 1% of flow, which on a large transmission line means thousands of barrels a day pass unnoticed. A fibre buried alongside the pipe hears the acoustic signature of a leak and registers the temperature change, localising to within a few metres over tens of kilometres, and it hears an excavator before the excavator reaches the pipe. Methane emissions rules rather than safety rules are pulling this segment now, since periodic survey cannot satisfy a continuous measurement requirement. The retrofit cost on existing line remains the obstacle.
CAGR 10.2%

Integrity Management Software and Data Services

Integrity management software and data services grow at 9.0% and sell on a problem operators created themselves. Decades of inline inspection runs, cathodic protection surveys, coating records and incident reports sit in incompatible systems across an organisation, and nobody can answer which kilometre of line carries the most risk without a project to find out. Software that aligns those datasets against a single pipeline reference produces a risk-ranked list a regulator will accept and an engineer will act on. The commercial appeal is that it costs a fraction of any physical intervention and satisfies the same rule. Selling it requires access to data operators guard closely, and that access is the real barrier here.
CAGR 9.0%
Full segment breakdown across 6 segments available in the complete report.

Regional Architecture and Country Demand Map

North America leads at 30% on the largest regulated network anywhere and the enforcement regime that goes with it. Middle East and Africa sits above its band on Gulf export network intensity. Western Europe falls below on shorter systems and declining North Sea throughput as well.

North America

North America holds 30% of spending, and the reason is that the United States operates the longest regulated pipeline network anywhere alongside the most active enforcement regime. PHMSA reassessment intervals, consent decrees following incidents and state-level rules together produce a spending floor that has nothing to do with commodity prices. Canadian regulation runs on comparable principles across a network serving oil sands and export corridors. Much of the transmission line here predates 1970, which makes corrosion the dominant threat and keeps inline inspection volume high. Growth at 6.4% sits below the global rate on a mature and already well-instrumented base. Enforcement intensity here decides what suppliers earn, and it changes with each administration.
Share: 30% | CAGR: 6.4% (2026 to 2036)

East Asia

Chinese network construction and consolidation account for almost all of East Asia's 22%. PipeChina brought transmission assets from three national oil companies under one operator, which created a single buyer with the scale to standardise integrity practice across a network that had been managed inconsistently. New line is being built with monitoring specified at design rather than retrofitted, which is both cheaper and more capable than anything a mature network can achieve. Japanese and Korean demand runs through dense urban gas distribution with different failure modes and much shorter distances. Growth at 7.8% sits above the global rate on construction volume. Domestic suppliers take most of the Chinese work now.
Share: 22% | CAGR: 7.8% (2026 to 2036)
Regional intelligence for 5 additional markets available in the complete report: Western Europe, South Asia and Pacific, Latin America, Middle East and Africa, Eastern Europe. Contact sales@marketmindsadvisory.com.
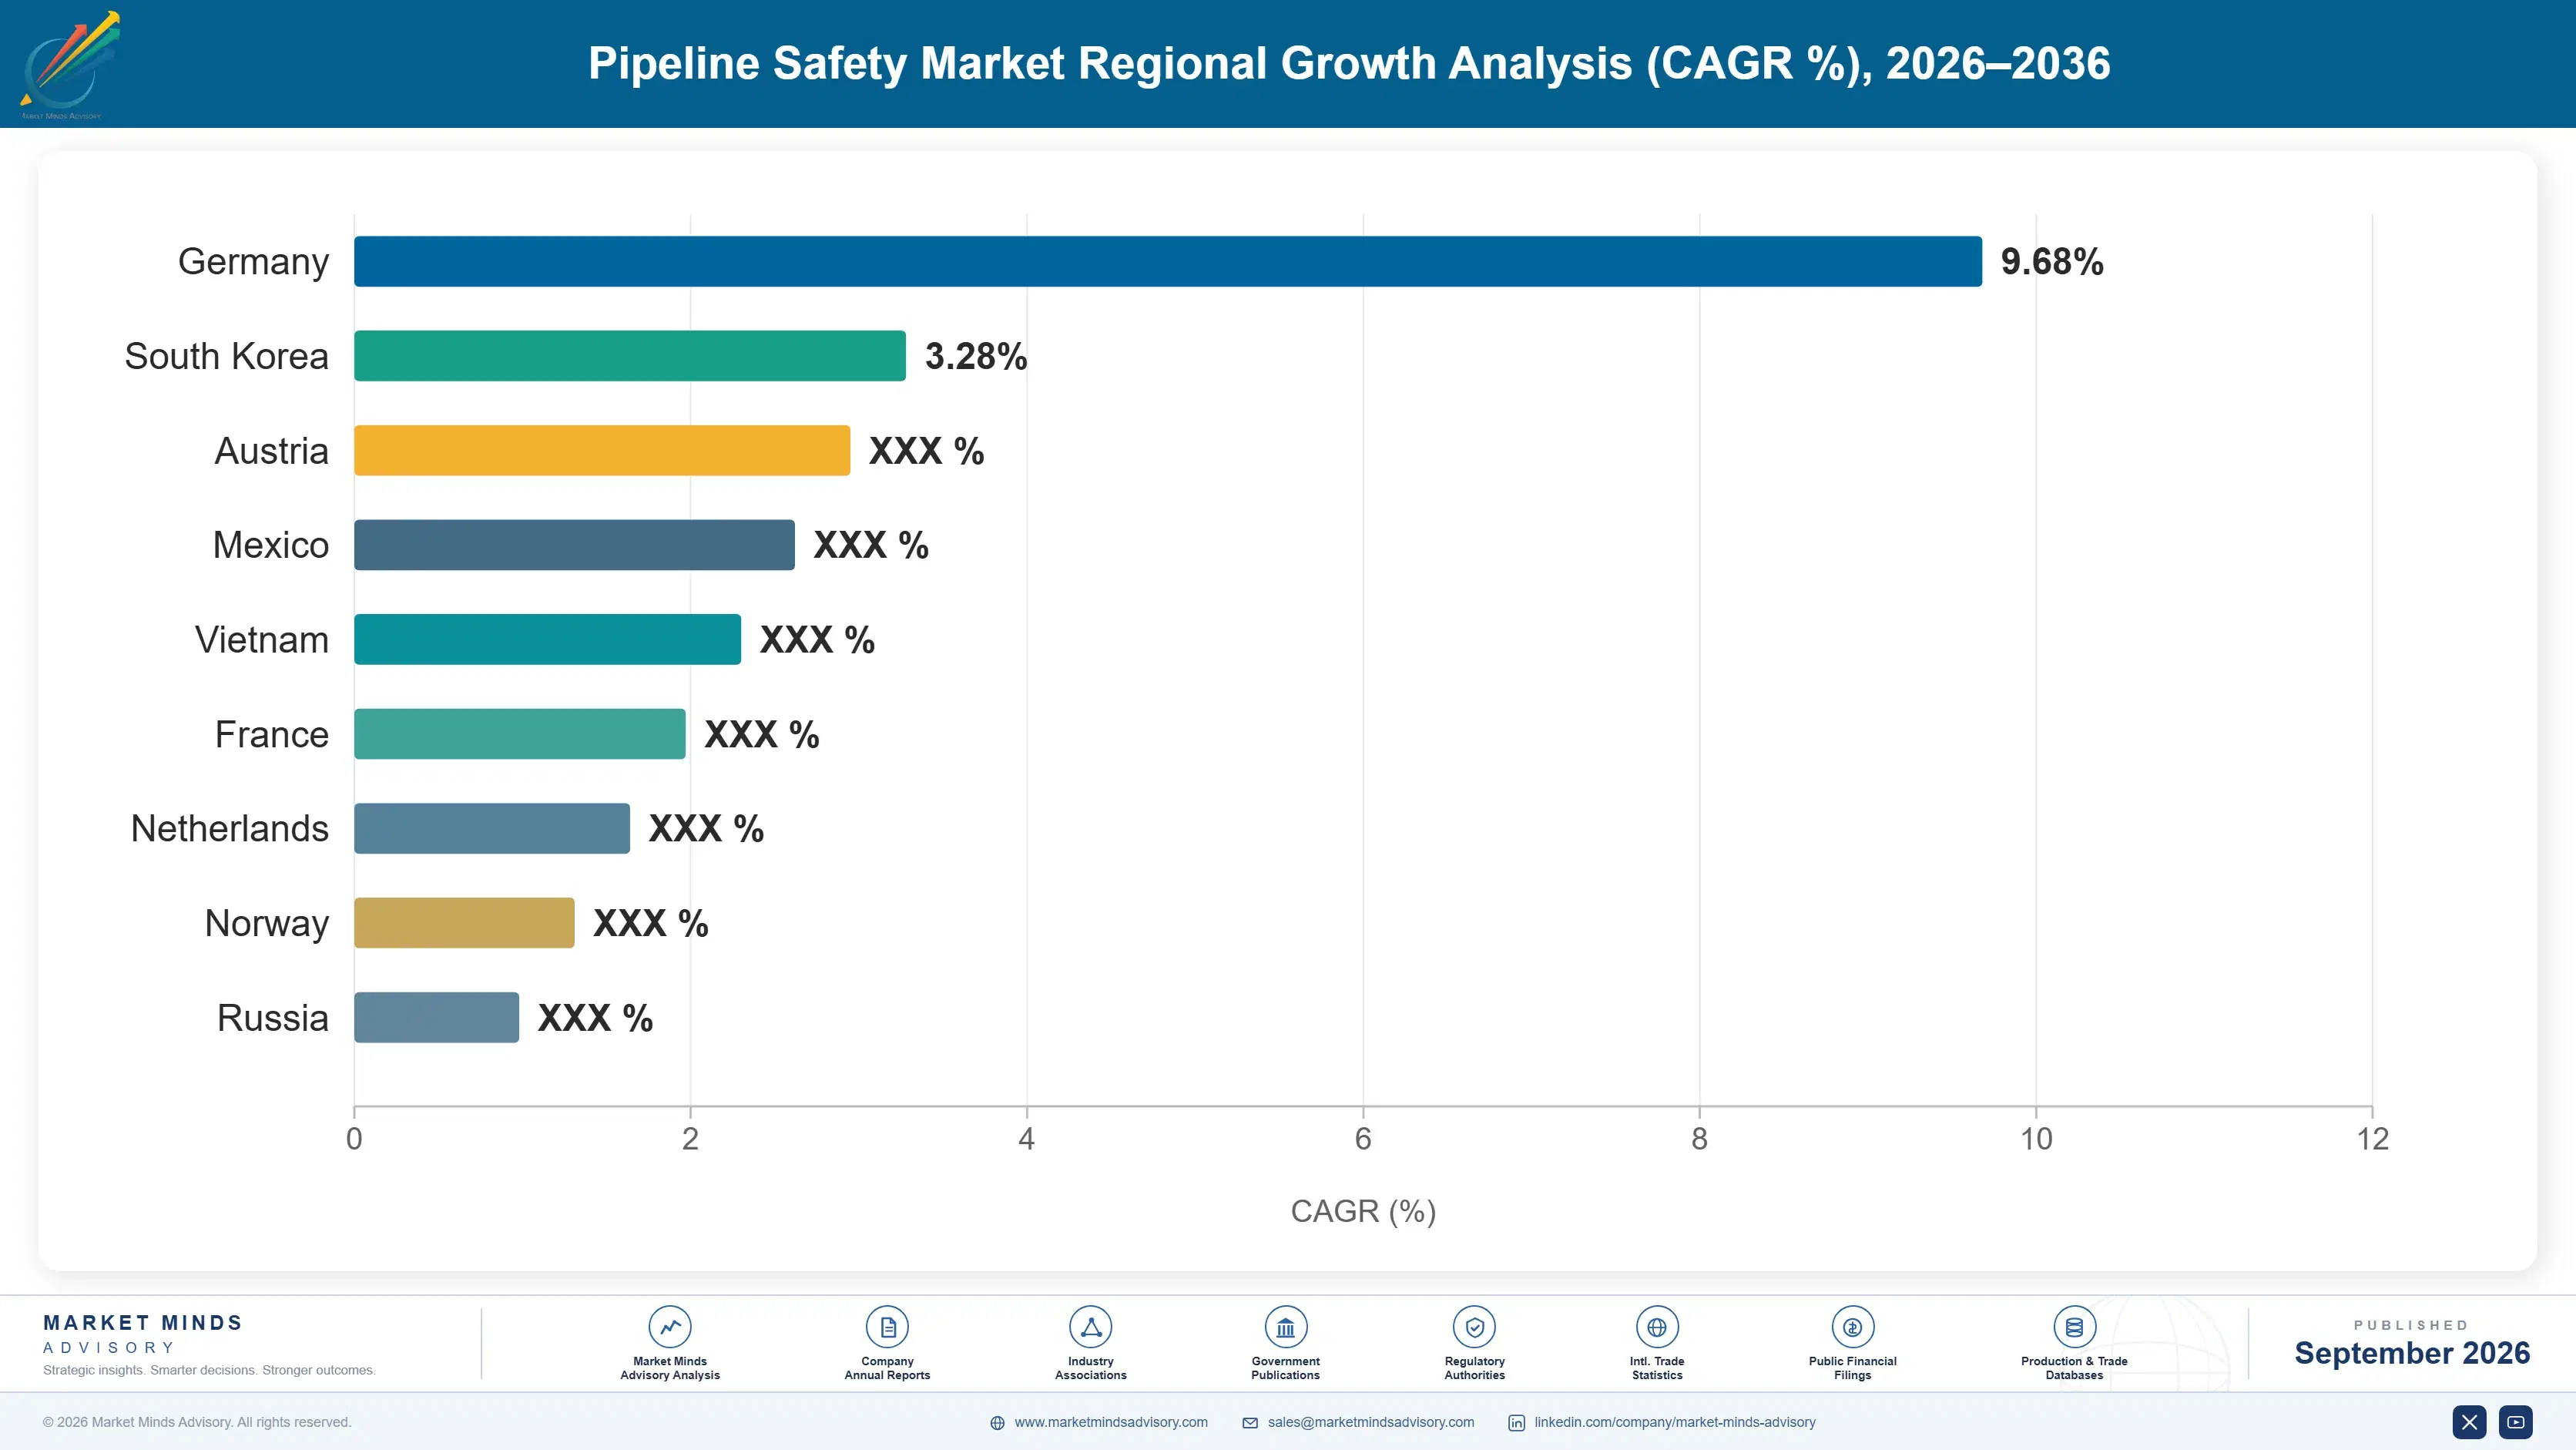
pipeline-safety-market-country-cagr-analysis-1789985130340

How To Grow A Regulated Budget

Operators buy integrity to satisfy a rule and an insurer, and almost never beyond that. A supplier who accepts that constraint competes on price inside a fixed budget. One who changes what the rule or the insurer requires, or finds a budget outside integrity altogether, is in a different business. The levers below do the second thing.

Sell Into The Emissions Budget Instead

Integrity budgets are capped by what a safety regulator requires and nobody spends beyond it. Methane emissions budgets are separate, larger in several organisations, and answerable to a different set of rules with detection thresholds far below the 1% of flow that mass balance resolves. A supplier selling continuous monitoring as an emissions measurement system reaches money that the integrity manager never controlled. The technical product is identical and the buyer, the budget and the justification are entirely different. Leak detection compounds at 10.2% against 6.8% for the market largely because of this reframing.
Market Impact: Reaches a budget outside the 1% detection rule

Put Fibre In New Trenches, Not Old Ones

Retrofitting distributed sensing along an existing right of way means opening ground beside a live pipeline, which is the expensive part and has nothing to do with the fibre. Laying it in the same trench as a new pipe costs a fraction of that, and India and China are building transmission kilometres at a rate nothing in mature markets approaches. India compounds at 10.6% against 6.8% globally. A supplier organised for retrofit sales into North American operators is fishing in the smallest pool available, and the construction pipeline requires an entirely different commercial approach.
Market Impact: India adds kilometres at 10.6% against 6.8% globally

Own The Operator's Integrity Data Layer

Decades of inspection runs, coating surveys and incident records sit in incompatible systems across most operators, so nobody can rank risk by kilometre without commissioning a project. Software that aligns those datasets against one pipeline reference produces a list a regulator accepts, at a fraction of any physical intervention cost, and integrity software compounds at 9.0% on exactly that argument. The commercial value is positional rather than technical: whoever holds the data layer influences every subsequent procurement decision the operator makes. Getting access to that data is the hard part and nobody gives it up easily.
Market Impact: Integrity software compounds at 9.0% every single year

Solve The Line Nobody Can Inspect

Roughly 40% of gathering line cannot accept a conventional inline tool, because of diameter changes, tight bends or missing launch facilities, and retrofitting the fittings costs more than the line is worth. Regulators accept indirect assessment on that line reluctantly and keep tightening what they will take. Robotic crawlers, tethered tools and external sensing all cost several times a conventional run, which is precisely why margins there are better than anywhere else in inspection. The addressable length is large, the competition is thin, and the engineering is genuinely difficult. Very few suppliers have committed to it.
Market Impact: Covers the 40% of gathering line unpiggable today

Who Controls the Margin Pool

Five suppliers hold 28% of integrity and safety contract revenue, the most fragmented concentration anywhere in energy infrastructure services. Baker Hughes, NOV and ROSEN dominate inline inspection, a specialist tooling business with real barriers. Emerson approaches the same customers from control systems. Below them sit hundreds of regional corrosion and cathodic protection contractors with genuine local positions. All participants are assessed on pipeline integrity and safety contract revenue.
Competition runs on regulatory acceptance rather than on detection performance. An operator selects the tool and the vendor whose output a regulator has approved before, because a rejected assessment means running the whole programme again at full cost. That preference protects incumbents heavily and makes new detection technology unusually slow to adopt, however good it is on the physics.

Rankings shift where the budget comes from. Suppliers selling continuous monitoring into methane emissions budgets are reaching buyers the inline inspection firms never called on, and the fibre optic specialists positioned for that are not the ones holding inspection share today. The second pressure is Chinese and Indian domestic suppliers taking construction-stage work in the fastest growing networks anywhere.
pipeline-safety-market-company-positioning-matrix-1789985130872

Competitive Moat and Risk Dimensions

BAKER HUGHES

Moat: Regulatory Acceptance History

Baker Hughes inline inspection output has been accepted by regulators across dozens of jurisdictions for decades, and an operator choosing a vendor is choosing whose assessment will survive review. A rejected assessment means repeating an entire programme at full cost, so nobody experiments to save money on the tooling. That track record cannot be assembled quickly by anyone.
BAKER HUGHES

Risk: Periodic Inspection Model

The business rests on periodic assessment runs at intervals set by rule, and methane regulation is pushing toward continuous measurement that a scheduled tool cannot satisfy. Fibre optic specialists selling into emissions budgets reach buyers who never appeared in an inspection sales call. A strong position in scheduled work is worth less as the requirement becomes continuous.
ROSEN GROUP

Moat: Unpiggable Line Capability

ROSEN built tooling for line that conventional inspection cannot reach, meaning tight bends, diameter changes and systems without launch facilities, which is where roughly 40% of gathering length sits. Very few competitors have committed the engineering to that problem because the volumes look small and the development cost does not. Margins there are considerably better than in conventional running.
ROSEN GROUP

Risk: Private Capital Constraint

Privately held ownership allows patient engineering investment and limits the capital available when a competitor with a listed balance sheet decides to buy market position outright. Baker Hughes and NOV can both fund acquisitions or price aggressively for several years in a way a family-owned firm cannot answer. Scale in this business is increasingly bought rather than built.

Players Tracked

Prominent Players

Baker Hughes
NOV
ROSEN Group
T.D. Williamson
Emerson Electric

Other Key Players

Enduro Pipeline Services
LIN SCAN
Dacon Inspection Technologies
Intero Integrity Services
Applus RTD
SGS
Bureau Veritas
Honeywell
Schneider Electric
Siemens Energy
Atmos International
Hifi Engineering
Luna Innovations
MISTRAS Group
Corrpro Companies

Recent Developments

JANUARY 2025

Baker Hughes Expands Methane Detection Portfolio For Operators

Baker Hughes expanded its methane detection and emissions monitoring portfolio for pipeline operators, an organic product development rather than an acquisition. The move targets emissions compliance budgets rather than the integrity budgets the company has historically sold into, which are controlled by different people inside the same customer organisations.
Signal: The money for continuous monitoring sits in an emissions budget rather than in an integrity one.
AUGUST 2024

ROSEN Extends Robotic Inspection Range For Unpiggable Line

ROSEN Group extended its robotic and tethered inspection range for pipeline sections that conventional tools cannot traverse, an organic engineering development rather than a partnership. The products address gathering and distribution line built before inspection was a design consideration, which regulators increasingly refuse to accept indirect assessment on.
Signal: Regulators are closing the gap that let operators leave unpiggable line effectively uninspected for decades on end.
MAY 2025

Emerson Adds Distributed Sensing To Pipeline Control Platform

Emerson Electric integrated distributed fibre sensing inputs into its pipeline supervisory control platform, an organic software and hardware development rather than any transaction. The work targets operators who want acoustic and thermal leak signatures presented alongside conventional mass balance alarms in a single control room view.
Signal: Control system suppliers are moving into detection, which the inspection specialists had considered their own territory.

What Integrity Work Costs Operators

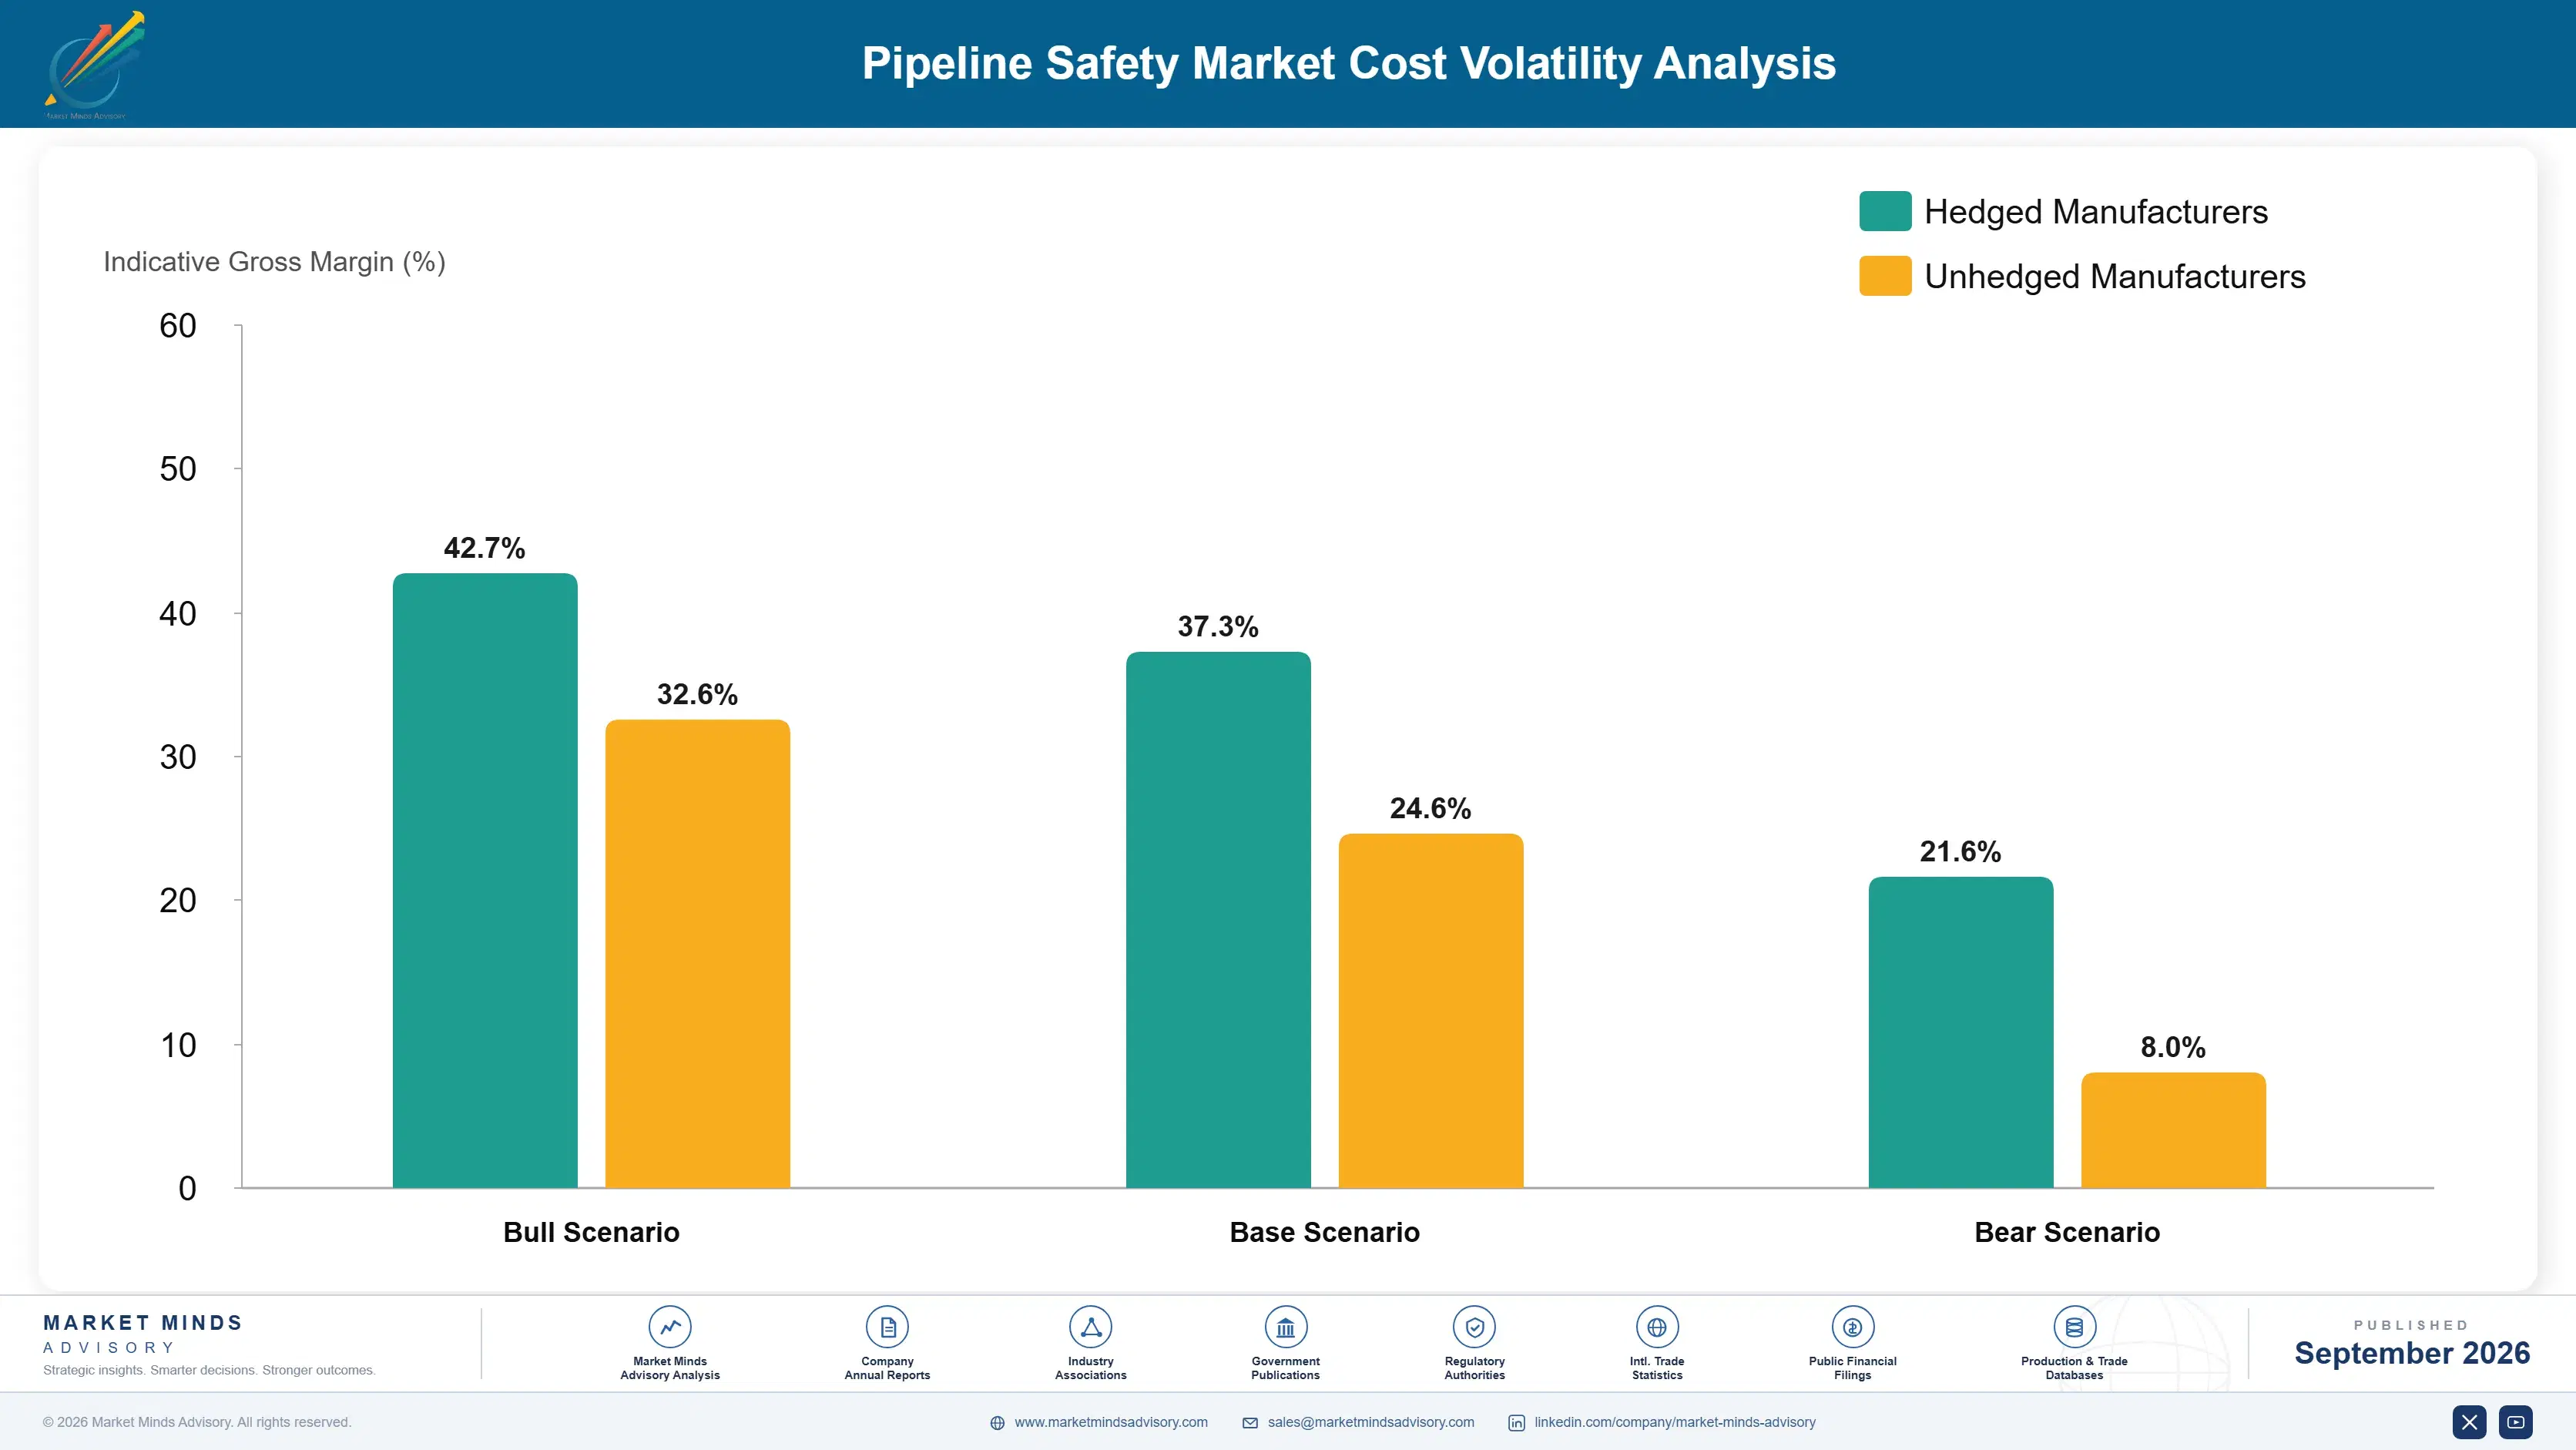
Field labour and mobilisation account for roughly 38% of integrity service cost, drawn from a specialist workforce concentrated in North America, Europe and the Gulf. Inspection tool fleet capital and refurbishment add about 21%, since a magnetic flux tool is an expensive asset that mostly travels. Sensing hardware and fibre contribute around 17%, with data processing and reporting carrying the balance.
Baker Hughes Annual Report 2024 records field labour availability and mobilisation cost as the dominant variables across its industrial and energy technology services. NOV Annual Report 2024 notes comparable pressure alongside tool fleet utilisation. Specialist technicians became scarce through 2022 and 2023 as energy hiring recovered faster than training could refill, and operators in remote regions paid mobilisation premiums that had nothing to do with the inspection itself.

The competitive disadvantage mechanism is tool fleet utilisation rather than any input price. A magnetic flux inspection tool sits idle between runs and costs the same whether it works or not, so a supplier with dense regional coverage runs each asset many more times a year than one mobilising across continents. Regional service firms beat global ones on that arithmetic repeatedly. Geography rather than technology decides the cost base here.
pipeline-safety-market-cost-volatility-analysis-1789985131074

Build Regional Tool Fleets Rather Than Mobilising Globally

An inspection tool costs the same idle as working, so utilisation decides the cost base more than any purchase price does. Positioning fleet regionally against a dense enough customer base raises annual runs per asset substantially and removes the mobilisation premiums remote work carries. The capital is duplicated tooling, and the return is a utilisation rate global competitors cannot match.

Train Inspection Technicians Rather Than Bidding For Them

Field labour and mobilisation run about 38% of service cost and the specialist workforce became genuinely scarce as energy hiring recovered through 2022. Bidding for experienced technicians raises everybody's cost without adding anyone to the industry. Training from adjacent trades takes longer and produces people who stay, which matters on a cost line this large.

Sell Data Analysis Separately From Field Work

Data processing and reporting carry a meaningful share of cost and none of the mobilisation exposure, since the analysis happens anywhere. Separating that work commercially lets a supplier earn on interpretation for runs somebody else performed, which fills capacity that field scheduling leaves idle. The constraint is persuading operators to share data with a firm that did not collect it.

Portfolio Architecture for Margin Defence

Margin architecture separates on how contestable the work is. Cathodic protection and corrosion field services earn least, competed by hundreds of regional contractors on labour rates with no technical differentiation available. Inline inspection and supervisory control sit in the middle, protected by regulatory acceptance and integration difficulty. Distributed sensing, integrity software and unpiggable line inspection earn most, because each solves something conventional methods cannot and the credible supplier list is short.
The volume versus premium tension is a scheduling problem. Field crews and inspection tools are the same resource whether they run a routine reassessment or a difficult unpiggable job, and the difficult work pays several times better while tying up the same people for longer. A supplier chasing utilisation fills the calendar with routine runs and never builds the capability that earns. That decision is made quarterly.

High-value pools sit in distributed sensing and in integrity software, and neither rewards field service scale. Sensing rewards a position inside emissions budgets and the ability to sell into new construction. Software rewards access to operator data that took years of relationship to obtain. The large inspection firms hold neither convincingly, which is the awkward fact underneath their market positions.

Volume / Commodity-Adjacent

Cathodic protection and corrosion field services competed by hundreds of regional contractors on labour rates alone. The eight point spread separates suppliers with dense regional crew coverage from those mobilising teams across long distances.
Gross Margin: 16% to 24%

Premium / Certified

Inline inspection services and supervisory control systems protected by regulatory acceptance history and integration difficulty rather than by any patent. The ten point spread tracks tool fleet utilisation, which decides this cost base more than pricing does.
Gross Margin: 30% to 40%

Sustainability / Regulatory / Next-Generation

Distributed fibre sensing, integrity management software and unpiggable line inspection, where each solves something conventional methods cannot address at all. The twelve point spread reflects how differently suppliers amortised the development cost behind each capability.
Gross Margin: 46% to 58%
pipeline-safety-market-portfolio-architecture-1789985131605

High-value Sub-segments and Strategic Watch-out

Leak Detection And Distributed Sensing

Grows at 10.2% because fibre hears what mass balance cannot see below 1% of flow, and methane rules made that a compliance requirement. The twelve point spread reflects new build versus retrofit exposure. The buyer sits in an emissions budget rather than an integrity one.
Gross Margin: 46% to 58%

Integrity Management Software And Data

Grows at 9.0% by solving a data problem operators created themselves across decades of incompatible record systems. The twelve point spread reflects how much operator data access each supplier has earned. Holding the data layer influences every procurement decision that follows it for years afterwards.
Gross Margin: 46% to 58%

Inline Inspection Tools And Services

Grows at 5.6% and carries most of the contract revenue in this market, on reassessment intervals of up to 7 years that apply regardless of throughput. The ten point spread reflects tool fleet utilisation. Regulatory acceptance history rather than detection performance decides who wins here.
Gross Margin: 30% to 40%

Cathodic Protection And Corrosion Control

Grows at 4.4%, slowest of the six functions, and competes on labour rates against hundreds of regional contractors with nothing to differentiate. The eight point spread reflects crew density rather than capability. Operators buy it because a rule requires it and price is the only variable.
Gross Margin: 16% to 24%

How Integrity Budgets Get Set

The annuity is the reassessment interval. A regulator requiring inspection every 7 years creates a recurring purchase that continues through commodity downturns, ownership changes and management turnover, because the clock does not pause. An operator who used a supplier for the last cycle uses the same one for the next, since the comparison against previous runs is cleaner and the regulator has already accepted that vendor's output.
Adoption depth varies by operator type rather than by geography. Large listed operators adopt broadly because a public incident is an existential reputational event. National oil companies in the Gulf adopt deeply on sovereign revenue grounds, at specifications that exceed most Western practice. Gathering and midstream operators adopt to the regulatory minimum on thin margins. Municipal gas distributors adopt slowest on the oldest infrastructure anywhere.

The deciding buyer is moving from an integrity engineer to a sustainability officer in a growing number of organisations, and the two want different things. An integrity engineer asked whether the tool would satisfy the regulator. A sustainability officer asks what the measured emissions number will be and whether an auditor will accept it. Suppliers still selling to the first person are calling on a shrinking budget.
pipeline-safety-market-end-use-penetration-index-1789985132101

Where We Would Put Effort

These are among the four positions where our research anticipates prominent divergence between winners and laggards over the coming forecast period. Each is grounded in the demand model, the regulatory perimeter, and the announced capacity pipeline.
01 / EMISSIONS BUDGET ACCESS

Sell Monitoring To The Sustainability Officer

Integrity budgets are capped by what a safety regulator requires and almost nobody in this industry spends beyond that ceiling. Methane emissions budgets are separate, frequently larger, and answerable to rules with detection thresholds far below the 1% of flow that conventional mass balance can resolve, which makes continuous monitoring a compliance necessity rather than a discretionary upgrade. The technical product is identical and the buyer, the budget and the justification are entirely different, which is most of the reason leak detection compounds at 10.2% against 6.8% for the market.
02 / NEW BUILD POSITIONING

Chase Trenches In India, Not Retrofits

Retrofitting distributed sensing along an existing right of way means opening ground beside a live pipeline, which is the expensive part and has nothing whatever to do with the fibre itself. Laying the same fibre in the trench alongside a new pipe costs a small fraction of that, and India and China are adding transmission kilometres at a rate no mature network approaches. India compounds at 10.6% against 6.8% globally, so a supplier organised only for retrofit sales into North American operators is fishing in the smallest pool available.
03 / DATA LAYER OWNERSHIP

Hold The Operator's Integrity Records

Decades of inspection runs, coating surveys and incident records sit in incompatible systems across most operators, so nobody can rank risk by kilometre without commissioning a fresh project every time. Software aligning those datasets against one pipeline reference produces a list a regulator accepts, at a fraction of any physical intervention cost, which is why integrity software compounds at 9.0%. The value is positional rather than technical, since whoever holds the data layer influences every procurement decision that follows, and getting access to that data is the genuinely hard part.
04 / UNPIGGABLE LINE ENGINEERING

Build Tools For What Nobody Can Inspect

Roughly 40% of gathering line cannot accept a conventional inline tool because of diameter changes, tight bends or missing launch facilities, and retrofitting those fittings costs more than the line is worth. Regulators accept indirect assessment on that length reluctantly and keep tightening what they will take, which converts a long-standing gap into a procurement requirement. Robotic crawlers, tethered tools and external sensing all cost several times a conventional run, which is precisely why margins there beat anything else in inspection and why so few suppliers have committed.

Engagement Snapshot From the Field

A live engagement with an industry participant carrying material or product regulatory and market exposure ahead of a defining policy shift, showing how our research translates into a defensible multi-year portfolio strategy.
MARKET MINDS ADVISORY · CLIENT ENGAGEMENT SUMMARY
Pipeline Safety Producer Strategic Portfolio Review and Transition Roadmap 2026·Investment Scenario on Pipeline Safety Exposure Evaluation 2025-26
CLIENT PROFILE
A North American midstream operator running roughly nine thousand kilometres of hazardous liquid and gas transmission line across five states, much of it acquired through consolidation over the previous decade. Integrity records sat in four incompatible systems inherited from the acquired companies. A consent decree at a peer operator had made the board ask questions nobody could answer quickly.
STRATEGIC CHALLENGE
The board wanted to know which kilometres carried the most risk and whether the integrity budget was being spent on them. Engineering could produce compliance evidence for every line and could not rank them against each other, because the underlying records had never been reconciled. Doubling the budget was on the table and nobody could say where the money should go.
MMA APPROACH
MMA reconciled the four record systems against a single pipeline reference, then ranked segments on age, coating type, soil corrosivity, inspection history and consequence area. We modelled what the existing budget bought against what a risk-weighted allocation would buy, and drew on 47 expert interviews conducted in Q4 2025 across inspection vendors, regulators, insurers and integrity managers at comparable operators.
KEY FINDINGS
  1. Roughly 7% of network length carried close to half the modelled consequence exposure, and that segment was receiving proportionally less inspection attention (client-reported, unverified by MMA).
  2. About 4 in 10 kilometres of gathering line could not accept a conventional inline tool, and indirect assessment had been used without the board being told.
  3. Reconciling the 4 record systems changed the risk ranking substantially, which meant previous budget allocation decisions had been made on an incomplete picture.
  4. A risk-weighted reallocation of the existing budget reduced modelled exposure more than doubling the budget on the current allocation would have (client-reported, unverified by MMA).
CLIENT PROFILE
A North American midstream operator running roughly nine thousand kilometres of hazardous liquid and gas transmission line across five states, much of it acquired through consolidation over the previous decade. Integrity records sat in four incompatible systems inherited from the acquired companies. A consent decree at a peer operator had made the board ask questions nobody could answer quickly.
STRATEGIC CHALLENGE
The board wanted to know which kilometres carried the most risk and whether the integrity budget was being spent on them. Engineering could produce compliance evidence for every line and could not rank them against each other, because the underlying records had never been reconciled. Doubling the budget was on the table and nobody could say where the money should go.
MMA APPROACH
MMA reconciled the four record systems against a single pipeline reference, then ranked segments on age, coating type, soil corrosivity, inspection history and consequence area. We modelled what the existing budget bought against what a risk-weighted allocation would buy, and drew on 47 expert interviews conducted in Q4 2025 across inspection vendors, regulators, insurers and integrity managers at comparable operators.
KEY FINDINGS
  1. Roughly 7% of network length carried close to half the modelled consequence exposure, and that segment was receiving proportionally less inspection attention (client-reported, unverified by MMA).
  2. About 4 in 10 kilometres of gathering line could not accept a conventional inline tool, and indirect assessment had been used without the board being told.
  3. Reconciling the 4 record systems changed the risk ranking substantially, which meant previous budget allocation decisions had been made on an incomplete picture.
  4. A risk-weighted reallocation of the existing budget reduced modelled exposure more than doubling the budget on the current allocation would have (client-reported, unverified by MMA).
RECOMMENDED STRATEGY
Phase 1: Phase one: hold the budget flat and reallocate against the reconciled risk ranking, since allocation matters more here than total spending does. Phase 2: Phase two: fund robotic and tethered inspection on the highest consequence unpiggable segments, rather than continuing to rely on indirect assessment there. Phase 3: Phase three: report risk-weighted exposure alongside compliance status in every board pack, so the question asked this year can be answered next year.
OUTCOME
The operator held its integrity budget flat and reallocated against the reconciled ranking (client-reported, unverified by MMA). Robotic inspection was funded on the highest consequence unpiggable segments within two quarters. Risk-weighted exposure now appears alongside compliance status in the standard board pack, which is what the original question actually needed.

Frequently Asked Questions

Foundational context covering the market sizes, CAGR, scope, country, region and competition that inform every finding below. This section is provided to cover basics and most often pre-purchase conversations, answered from the MMA Primary Research Dataset.

What is the current size of the Pipeline Safety Market?

Global value reaches USD 7.90 billion in 2026, measured as pipeline integrity and safety contract revenue across all system classes. The 2025 base is USD 7.4 billion.

How large will the Pipeline Safety Market be by 2036?

Contract revenue reaches USD 15.25 billion by 2036, an increase of USD 7.35 billion over the forecast period. That represents 1.93 times expansion from the 2026 base.

What is the CAGR for the Pipeline Safety Market 2026 to 2036?

The base case runs at 6.8% annually, with a bull case at 8.0% if methane rules tighten to continuous monitoring and a bear case at 5.6% if enforcement intensity relaxes.

Which segment is growing fastest?

Leak detection and distributed fibre sensing grow at 10.2%, half again the market rate of 6.8%. Fibre along the right of way hears leaks that mass balance never detects below 1% of flow.

Who are the major companies in the Pipeline Safety Market?

Baker Hughes, NOV, ROSEN Group, T.D. Williamson and Emerson Electric lead on pipeline integrity and safety contract revenue, together holding 28%, with hundreds of regional contractors holding the remainder.

Which country is growing fastest?

India leads at 10.6%, on a national gas grid construction programme adding transmission kilometres at a rate with no recent parallel. China and Saudi Arabia follow behind.

Report Segmentation Architecture

The full report scope spans multiple orthogonal segmentation dimensions, with cross-tabulated demand data provided for each dimension pair. Coverage extends further to regional breakdowns, trend trajectories, and the competitive detail needed to support segment-level decision-making.

By Safety System Function

  • Leak Detection And Distributed Sensing
  • Integrity Management Software And Data Services
  • Right Of Way Monitoring
  • Supervisory Control And Emergency Shutdown
  • Inline Inspection Tools And Services
  • Cathodic Protection And Corrosion Control

By End-Use Industry

  • Crude Oil Transmission
  • Natural Gas Transmission
  • Gas Distribution Networks
  • Refined Product Pipelines
  • Gathering And Midstream Systems
  • Offshore And Subsea Pipelines

By Commercial Dimension

  • Direct Operator Service Contracts
  • Engineering Consultancy Channel
  • Original Equipment Manufacturer Supply
  • Framework Inspection Agreements
  • Software Subscription Licensing
  • National Oil Company Procurement

By Region

  • North America
  • Western Europe
  • East Asia
  • South Asia and Pacific
  • Latin America
  • Middle East and Africa
  • Eastern Europe

Scope, Methodology, and Coverage

Every figure in this report is reproducible from documented input assumptions. The scope below maps the historical period, the forecast horizon, the segmentation dimensions, and the countries covered, alongside the underlying primary and qualitative methodology.
Historical Period
2020 to 2025
Forecast Period
2026 to 2036
Base Year
2025 (USD billions; MMA Primary Research Dataset, September 2026)
Market Definition
This report covers systems, tools and services that detect, prevent and manage pipeline integrity failures on hydrocarbon and hazardous liquid transmission and gathering lines: inline inspection tools and services, leak detection and distributed sensing, cathodic protection and corrosion control, supervisory control and emergency shutdown systems, right of way monitoring, and integrity management software. It excludes pipeline construction and pipe manufacture, compression and pumping equipment, midstream terminal and storage safety, and water and sewer network monitoring.
Quantitative Units
USD millions, contract revenue basis; pipeline kilometres under integrity management; reassessment interval in years; leak detection threshold as a percentage of flow; integrity spend per kilometre in USD.
Segmentation Dimensions
Safety system function; end-use industry; commercial contracting model; geography across seven regions.
Regions Covered
North America, Western Europe, East Asia, South Asia and Pacific, Latin America, Middle East and Africa, Eastern Europe
Countries Covered
United States, Canada, Mexico, Brazil, Argentina, Colombia, United Kingdom, Germany, Netherlands, Italy, Poland, Romania, China, Japan, South Korea, India, Australia, Saudi Arabia, United Arab Emirates, Nigeria.
Key Companies Profiled
Baker Hughes, NOV, ROSEN Group, T.D. Williamson, Emerson Electric, Enduro Pipeline Services, LIN SCAN, Intero Integrity Services, Applus RTD, Honeywell, Schneider Electric, Siemens Energy, Atmos International, Luna Innovations, MISTRAS Group.
Quantitative Methodology
Primary survey, n=3,800 respondents, Q4 2025, six countries; demand-side model with trade association cross-validation
Qualitative Methodology
47 expert interviews, Q4 2025; applied to validate demand model assumptions, identify emerging dynamics, and assess competitive positioning
Report Format
PDF and XLSX data workbook (Word format preview document)
Publisher
Market Minds Advisory
Report Code
MMA-2026-ENE-661
Published
September 2026
Contact
sales@marketmindsadvisory.com | www.marketmindsadvisory.com

Purchase the full Pipeline Safety Market Report (2026 to 2036).

This report sizes the global pipeline safety and integrity market from 2026 to 2036 across six system functions, six end-use industries and seven regions. It explains why operators spend to the regulatory requirement and no further, and how methane rules moved detection into a different budget entirely. Cost composition is sourced to company annual reports, with field labour and mobilisation at 38% of service cost. Regional analysis covers all seven territories, including why Middle East and Africa sits above its usual share on Gulf export network intensity. Competitive assessment covers 20 named suppliers with four revenue lever analyses and an anonymised midstream prioritisation engagement.
Regulatory spending floor modelled by jurisdiction and function
Six safety system functions sized through to 2036
Field labour and tooling cost composition from filings
Twenty named suppliers assessed on contract revenue
Four revenue levers with quantified commercial impact
Anonymised midstream integrity prioritisation engagement included in full

Built For The People Who Decide

From boardroom strategy to bench-side execution, this report is read cover-to-cover by leaders shaping the next decade of their industry, turning demand scenarios, market dynamics and valuation benchmarks into decisions.
CXOs/ Presidents/ VPs/ Managers
M&A and Corporate Development
Strategy Teams and R&D Heads
Procurement and Product Directors
Regulatory and Compliance Leaders
Investor Relations and Equity Analysts