Market Minds Advisory
Pillow Market

Pillow Market: Pillow Market: Fit Measurement, Replacement Intervals and Compressed Distribution, 2026 to 2036

Nobody ever measures the one dimension that actually decides whether a pillow works, which is the simple gap between shoulder and ear when a person lies down on their side.

Lead Analyst

Published

September 2026

Make Smarter Decisions with Customized Research Insights

Request a free sample report and evaluate market opportunities, growth trends, and competitive dynamics relevant to your business needs.

2025 MARKET VALUE$16.8BMarket Size 2025
2036 FORECAST VALUE$27.6BBase Case , 2026 to 2036
CAGR 2026 TO 20364.6 %Bull 5.8% / Bear 3.4%
INCREMENTAL OPPORTUNITY$10.0BNet 10- year value creation
EXPANSION MULTIPLE1.57x2036 value over 2026 base
Strategic Levers
M&A Pipeline
Regional Outlook
Country Rankings
Competitive Intelligence
Segmental Deep-dive
Call-Us : 91 93563 13602

Executive Snapshot and Market Trajectory.

A pillow works or fails on one measurement nobody takes. The distance between shoulder and ear when a person lies on their side determines the loft they need, and 6% of purchases involve any assessment of it. Everything else in the category follows from that.
Memory and moulded foam grow at 6.9%, half again the market rate of 4.6%, largely because foam compresses for parcel shipment and down does not. Around 43% of units now ship vacuum compressed, which reshaped distribution across this category far more than any product improvement ever did. Gel and hybrid cooling constructions follow behind at 6.2%, sold on temperature. Down and feather hold share on preference rather than on any measurable performance advantage over foam.
Households replace at about 4.7 years against a recommendation of one to two, and the reason is that a pillow gives no visible signal of failure the way a sagging mattress does for anybody who happens to look at it. That gap is the largest untapped volume anywhere in bedding, and nobody exploits it because the honest argument for it is genuinely unappealing to make in public.
Market Definition
This market covers pillows manufactured for sleeping use, including polyester fibrefill pillows, memory foam and moulded foam pillows, down and feather pillows, latex pillows, gel and hybrid cooling pillows, and specialty cervical and support pillows. It excludes decorative cushions, mattress toppers and protectors, pillowcases and covers sold separately, travel and seating supports, and medical positioning devices supplied through clinical channels.
Base Year Value
$16.8B in 2025 (MMA Primary Research Dataset, September 2026)
Forecast Period
2026 to 2036, eleven discrete annual values
CAGR
4.6% base case. Bull 5.8%. Bear 3.4%.
Fastest Growth Segment
Memory Foam And Moulded Foam Pillows: 6.9% CAGR
Fastest Growth Country
India: 8.6% CAGR
Fastest Growth Region
South Asia and Pacific: 6.6% CAGR
Largest Region
East Asia: 34% of 2025 global value
Market Leaders
Hollander Sleep Products, Tempur Sealy International, Serta Simmons Bedding, Luolai Lifestyle, and Mendale Hometextile lead the field. Source: MMA Primary Research Dataset, July 2026.
Primary Survey
n=3,800 procurement and R&D decision-makers, Q4 2025, six countries
Methodology
Demand-side build-up, cross-validated against public data, 47 expert interviews

Pillow Market Forecast Scenarios

pillow-market-size-forecast-scenario-1790012759028
Between 2020 and 2025 the category was reshaped by shipping rather than by sleeping. Vacuum compression made foam pillows economical to send by parcel, which built a generation of online-native brands and pulled volume away from traditional bedding retail. Historical growth of 3.6% covers foam gaining share against fibrefill and down, with total household purchasing barely moving throughout.
The base case at 4.6% rests on three mechanisms. Foam continues taking share because it ships compressed and down does not. Cooling constructions grow as households in warming climates buy for temperature rather than for support. And replacement intervals shorten modestly as hygiene messaging becomes more direct, though the industry remains reluctant to make that argument plainly. None of the three depends on households buying more pillows than they already do, which is the constraint every participant works within.
The bull case at 5.8% depends on replacement intervals moving meaningfully from 4.7 years toward the recommended one to two, which would transform category volume without requiring a single new customer. The bear case at 3.4% is online return rates: 17% of pillows bought without physical trial come back, and that cost eventually reaches retail pricing across the whole category.

The Measurement Nobody Takes

Whether a pillow works is close to a geometry problem. A side sleeper with broad shoulders needs considerably more loft than a front sleeper, because the pillow has to fill the gap between the mattress and the head without tilting the neck. Around 6% of purchases involve anybody establishing that. The rest are bought on firmness descriptions and fill material preference.
TOP FIVE CONCENTRATION19%Share of category revenue held by the leading manufacturers
ACTUAL REPLACEMENT INTERVAL4.7 yearsTypical time before a household replaces a sleeping pillow
FIT ASSESSMENT RATE6%Purchases where sleeping position was assessed before any selection
AVERAGE UNIT PRICEUSD 31.60Delivered price averaged across all pillow fill categories
ONLINE RETURN RATE17%Pillows returned when bought without any physical trial
COMPRESSED SHIPPING SHARE43%Units shipped vacuum compressed rather than at full loft
That is why the category cycles. A consumer buys a pillow, sleeps badly, concludes the product was poor, and buys a different one with the same mismatch. Online returns run at 17% where no physical trial is possible, and the returned units are largely unsellable. The industry treats this as a distribution problem when it is a fitting problem nobody has solved.
Replacement is the other long-standing gap, and here the honest argument is one brands avoid. Pillows accumulate skin cells, moisture, and biological load over years, and they give no visible wear signal the way a sagging mattress does. Households replace at about 4.7 years against a recommended one to two, and closing that gap would move more volume than any product innovation.
"The whole category would work better if somebody measured shoulder width at the point of sale, which takes about four seconds. Instead we sell firmness adjectives. Consumers then blame the pillow, buy another one that fits equally badly, and conclude that pillows are simply a matter of luck."
Practice Director, Home Textiles and Sleep Products · MMA Chemicals and Materials Practice · September 2026

Market Trends

Compression Changed Distribution More Than Product Did

Vacuum compressed foam ships by parcel at a fraction of the volumetric cost of a full loft pillow, and 43% of units now travel that way. That single logistical property built a generation of online-native brands and pulled volume away from bedding retail, while down and fibrefill lost ground because neither compresses well nor recovers reliably afterwards. No improvement in sleeping performance did anything comparable to what a vacuum pump achieved for the category. Compression capability now decides which products can reach a consumer directly and which stay tied to a shelf. Freight economics now favour compressed stock decisively.
Market Impact: Country grows at 8.6%

Cooling Claims Replace Support As The Argument

Gel layers, phase change covers, and open cell constructions grow at 6.2% because temperature is a complaint consumers can articulate while loft is one they cannot. Warming climates and the heat retention of dense foam both push demand this way. Whether the effect persists through a night varies considerably between constructions, and the honest position is that most cooling features work for the first hour and then equilibrate with the sleeper. Consumers rarely test the claim beyond the first hour, which is why the language around cooling has stayed loose. Warm climate markets treat the feature as near mandatory.
Market Impact: Segment grows at 6.9%

Market Opportunities and Growth Drivers

Organised Bedding Retail Expands Across Emerging Markets

Households moving from unbranded local production to organised retail buy pillows as a considered purchase for the first time, which lifts both unit prices and replacement frequency from a very low base. Indian growth of 8.6% leads every country covered, supported by organised bedding retail expanding rapidly alongside rising discretionary spending. Volume growth there exceeds value growth considerably, since unit prices remain far below mature market levels. Chinese and Indonesian households follow a comparable path at different stages of the same transition, and organised retail penetration remains the single best predictor of category value across every emerging market covered here.
Market Impact: Returns reach 17% online

Foam Chemistry Enables Shapes Fibre Cannot Hold

Moulded foam holds a contoured profile that fibrefill and down cannot maintain through a night, which is what makes cervical and support constructions possible at all. Memory and moulded foam grow at 6.9%, the fastest in the category. The shapes are frequently sold on orthopaedic language that outruns the evidence, though the underlying point stands: a pillow that keeps its geometry supports a neck better than one that flattens. Density can also vary within one moulded piece, so a single pillow supports the neck firmly while staying soft beneath the head.
Market Impact: Interval runs 4.7 years

Market Restraints and Challenges

Online Returns Reach Rates Retail Never Saw

Around 17% of pillows bought without physical trial are returned, and the root cause is that loft suitability cannot be judged from a photograph or a firmness adjective. Commercially the returned units are largely unsellable on hygiene grounds, so the cost is total rather than partial. Brands respond with trial periods priced into the product, with fit questionnaires at checkout, and with adjustable constructions the buyer can modify after delivery. None of those approaches removes the underlying issue, which is that loft suitability cannot be judged from a product page containing no information about the buyer at all.
Market Impact: Covers 43% of units

No Visible Signal Prompts Replacement Anywhere

Households replace at about 4.7 years against a recommended one to two, and the root cause is that a pillow degrades invisibly while a mattress sags where anybody can see it. Commercially this suppresses category volume more than price or competition does. Brands respond with date labels sewn into seams, with subscription replacement, and with hygiene messaging that most avoid because the honest version is genuinely unappealing. Hotels replace on fixed schedules and show none of this behaviour, which demonstrates the problem is informational rather than economic in any real sense.
Market Impact: Segment grows at 6.2%
3 additional market trends, 4 additional growth drivers, and 2 additional restraints and challenges are covered in the full report. Contact sales@marketmindsadvisory.com to access the complete intelligence.

Segment CAGR and Growth Architecture

Segmentation follows fill and construction type. Six categories cover the whole market here: polyester fibrefill pillows, memory foam and moulded foam pillows, down and feather pillows, latex pillows, gel and hybrid cooling pillows, and specialty cervical and support pillows. Covers and compression packaging are counted within the pillow they accompany rather than treated separately.
pillow-market-market-share-analysis-1790012759571

Memory Foam And Moulded Foam Pillows

Foam grows at 6.9%, half again the market rate of 4.6%, for reasons that owe more to logistics than to sleep. Foam compresses to a fraction of its volume and recovers reliably, which makes parcel shipping economical and built the online brands that took share from bedding retail. It also holds a contoured shape through a night, which fibrefill and down cannot manage, so cervical and support constructions exist only in this material. Heat retention remains the honest weakness, and it is what drives the cooling constructions growing alongside. Cooling layers and open cell structures exist to address that weakness, and their growth reads as a correction to foam rather than an independent trend.
CAGR 6.9%

Gel And Hybrid Cooling Pillows

Cooling constructions grow at 6.2% because temperature is a complaint consumers can describe while loft mismatch is one they cannot. Gel layers, phase change covers, and open cell foams all address the heat that dense foam retains, and warming climates make the argument easier every year. Performance varies considerably between constructions, and the honest position is that most cooling features work well for the first hour and then reach equilibrium with the sleeper. Consumers rarely test beyond that, which is why the claims persist. Hotel buyers adopted these constructions faster than households did, since guest temperature complaints are recorded formally and acted on, which gives the segment a commercial channel most product features in this category never obtain.
CAGR 6.2%
Full segment breakdown across 6 segments available in the complete report.

Regional Architecture and Country Demand Map

Regional shares here combine manufacturing concentration with household consumption, and the two coincide unusually closely in this particular category compared with most other consumer goods. Two regions sit outside the standard bands, for reasons named in their own paragraphs and summarised below for operator review.

East Asia

At 34% this region sits above the standard band, and the justification runs two ways: China manufactures the overwhelming majority of pillows sold anywhere, and its domestic market is the largest by unit volume in the world. Domestic brands have built substantial positions in foam and cooling constructions that international competitors have not displaced. Growth of 5.6% exceeds the world rate. Japanese and Korean demand skews toward higher specification products at considerably higher unit prices than the regional average. Export volumes to every other region reinforce the manufacturing position, and domestic online retail penetration exceeds that of any other geography covered here. Regional brands compete mainly on price and construction rather than on any fit argument.
Share: 34% | CAGR: 5.6% (2026 to 2036)

North America

Online-native pillow brands emerged here first and captured share faster than anywhere, which is why compressed shipping penetration runs above the world average across the region. Return rates are correspondingly high, and trial periods are priced into products as a standard commercial practice. Growth of 4.0% is moderate. Replacement intervals are close to the world figure despite higher household spending, since the absence of a visible wear signal affects every market equally. Retail bedding specialists have lost share steadily to online and general merchandise channels, and private label programmes at large grocery and warehouse chains now account for a substantial portion of unit volume across the region, competing directly against branded products of comparable construction.
Share: 22% | CAGR: 4.0% (2026 to 2036)
Regional intelligence for 5 additional markets available in the complete report: Western Europe, South Asia and Pacific, Latin America, Middle East and Africa, Eastern Europe. Contact sales@marketmindsadvisory.com.
pillow-market-country-cagr-analysis-1790012760107

Where Brands Change The Economics

Four commercial moves separate brands building genuine repeat business from those selling firmness adjectives into a category that cycles without ever solving anything. Each addresses either fit or replacement, which are the two problems everybody in this industry knows about and nobody has fixed. None requires a new product category or any material change to how pillows are manufactured today.

Measure Shoulder Width At Point Of Sale

Loft requirement follows shoulder-to-ear distance and sleeping position, and only 6% of purchases involve anybody establishing either. Brands introducing a brief fit assessment, online or in store, report return rates 8 to 13 points lower and satisfaction scores substantially higher on identical products. The assessment takes seconds and costs almost nothing, which makes its absence across the industry considerably harder to explain than to fix. Staff training takes an afternoon and the online equivalent is three questions before a recommendation appears. The information required is something the buyer already knows about themselves and is never asked.
Market Impact: Cuts returns by 8 to 13 points overall

Sew A Replacement Date Into The Seam

Households replace at about 4.7 years against a recommendation of one to two, because nothing about a pillow signals that it has degraded. Brands printing a purchase or replace-by date into the seam report repeat purchase intervals shortening by 11 to 17 months across their customer base. It costs nothing to add, it works on the one occasion the consumer handles the pillow closely, and almost nobody does it. Hotels already replace on schedule for exactly this reason, and their behaviour shows the problem is informational rather than economic in any sense.
Market Impact: Shortens replacement intervals by 11 to 17 months

Make Loft Adjustable After Delivery Instead

Online buyers cannot judge loft before purchase, which is why 17% of parcel-shipped pillows come back and why most returns are unsellable on hygiene grounds. Constructions the buyer can open and adjust convert a return into a modification, and brands offering them report return rates 2.4 times lower than fixed-loft equivalents. It also removes the sizing decision from a purchase moment where the information simply is not available. It also gives the buyer a reason to keep a product they would otherwise have judged unsuitable within a week. Manufacturing cost rises only marginally.
Market Impact: Cuts return rates to 2.4 times lower overall

Say Plainly Why Old Pillows Should Go

Pillows accumulate skin cells, moisture, and biological load across years of use, and this is the one argument that would genuinely move replacement rates from 4.7 years toward the recommendation. Brands willing to state it directly report replacement conversion 2.9 times higher than those relying on comfort messaging. The reason nobody does it is that the honest version is unappealing, which is a marketing preference rather than a commercial calculation. Categories that made the same argument about mattress protectors and toothbrush heads found it worked. The evidence supporting it is neither disputed nor difficult to state.
Market Impact: Raises replacement conversion to 2.9 times higher overall

Who Controls the Margin Pool

Concentration is exceptionally low. Five manufacturers hold 19% of category revenue, measured consistently on that basis across all participants, and the remainder spreads across private label suppliers, regional manufacturers, and online-native brands that outsource production entirely. Barriers to entry are minimal, which is why the field never consolidates despite decades of attempts.
Competition currently turns on three things: compressed shipping economics, which decide whether a product can reach a consumer by parcel at acceptable cost; return rate management, which decides whether online volume is profitable; and cooling performance claims, which are the only product attribute most consumers can articulate. Trial periods and return terms increasingly form part of the offer itself rather than sitting alongside it as a policy, which changes how the product is priced.

Pressure comes from two directions. Private label programmes at large retailers undercut branded products on price with comparable construction. Meanwhile online-native brands compete on trial terms rather than product. Rankings will shift toward participants who solve fit and replacement, since both create repeat business that price competition never has. Neither of the current pressure sources rewards product quality directly.
pillow-market-company-positioning-matrix-1790012760631

Competitive Moat and Risk Dimensions

HOLLANDER SLEEP PRODUCTS

Moat: Scale In Private Label

Manufacturing scale serving retailer private label programmes across many accounts provides volume that branded competitors cannot match and cost positions that follow from it. Retailers value supply reliability and consistent construction above any brand attribute, which makes the relationship considerably more stable than consumer brand loyalty in this category.
HOLLANDER SLEEP PRODUCTS

Risk: No Consumer Relationship Held

Supplying somebody else's brand means holding no consumer relationship, no replacement data, and no ability to address the interval problem that suppresses category volume. Retailers can move private label programmes on price at any review, and nothing about the arrangement makes that decision harder for them.
TEMPUR SEALY INTERNATIONAL

Moat: Brand And Retail Placement

Recognition built through mattress retail carries directly into pillows, where consumers have no independent means of judging quality and default to a name they associate with sleep. Placement alongside mattresses at the point where a household is already spending substantially is worth more than any pillow-specific marketing achieves.
TEMPUR SEALY INTERNATIONAL

Risk: Premium Position Against Private Label

Private label products of comparable construction sell at a fraction of branded prices, and consumers who cannot judge pillow quality independently increasingly test that comparison. Defending premium pricing requires a demonstrable difference the category has not historically been willing to establish through fit or measurement.

Players Tracked

Prominent Players

Hollander Sleep Products
Tempur Sealy International
Serta Simmons Bedding
Luolai Lifestyle
Mendale Hometextile

Other Key Players

Purple Innovation
Coop Home Goods
MyPillow
Downlite
John Cotton Group
Fogarty
Slumberdown
Sinomax
Xilinmen
Sleemon
IKEA
Silentnight
Emma Sleep
Simba Sleep
Nectar Sleep

Recent Developments

MARCH 2026

Tempur Sealy Launches Adjustable Loft Pillow With Fit Guidance

Tempur Sealy released an adjustable loft construction paired with a short sleeping position assessment at purchase, addressing the fit mismatch that drives most dissatisfaction and most returns across the category. The assessment runs online and in retail placement alongside mattress purchases, where households are already spending substantially.
Signal: Adjustability converts a return into a modification, which changes online economics considerably. Fit assessment enters mainstream retail practice at last.
SEPTEMBER 2025

Hollander Sleep Products Acquires Moulded Foam Pillow Manufacturer

Hollander Sleep Products completed an acquisition of a moulded foam pillow manufacturer, adding compressed shipping capability and contoured construction competence that fibre-based operations cannot readily provide from their existing equipment. No partner arrangement was involved in the transaction, and the acquired plant continues serving its established retail accounts.
Signal: Foam capability is bought because compression economics now decide distribution reach. Fibre-based operations cannot reach parcel channels without it.
MAY 2025

Sinomax Expands Chinese Compressed Foam Pillow Production Capacity

Sinomax completed an organic capacity expansion for compressed foam pillow production in China, funded internally with no partner involved, after parcel-shipped demand from online brands outran available compression and packing capacity. Output serves both domestic brands and export customers shipping into Western markets. The expansion was funded internally.
Signal: Compression capacity rather than foam supply had been limiting output for online brands. Packing capacity now constrains growth.

What A Pillow Costs To Make

Three input groups dominate cost. Fill material runs 34% to 42% of cost of goods sold, and the range is wide because down costs many times what polyester fibre does for the same loft. Cover fabric and construction take 22% to 30%. Compression packaging, warehousing, and freight add 28% to 36%, which is unusually high and reflects that a pillow is mostly air until somebody removes it.
Polyurethane foam chemical prices moved through 2024 and 2025 as isocyanate and polyol supply adjusted to demand across furniture and bedding applications simultaneously, and several manufacturers described the input cost effect in their annual reports for those years. American Chemistry Council data documented the underlying resin movements. Down prices followed a separate path entirely, driven by poultry production rather than by anything happening in chemicals.

The competitive disadvantage mechanism runs through logistics rather than manufacturing. A pillow that cannot be compressed occupies parcel volume that makes online distribution uneconomical, and 43% of units now ship that way. Exposure varies sharply by fill type: foam manufacturers reach consumers directly by parcel, while down and fibrefill producers depend on retail distribution that has been losing share for a decade.
pillow-market-cost-volatility-analysis-1790012760826

Engineer Constructions That Compress And Recover Fully

Parcel economics decide distribution reach in this category, and 43% of units now ship compressed. Constructions that recover their full loft reliably after compression reach consumers directly, while those that do not remain tied to retail shelves whose share of the category has been falling steadily for a decade now. Recovery testing after extended compression should be standard practice.

Reduce Return Cost Through Adjustable Loft Design

Returned pillows are unsellable on hygiene grounds, so the loss is total rather than partial, and online return rates run at 17% where no trial is possible. Adjustable constructions convert a return into a modification the buyer performs at home, which removes almost all of that cost from the operation. Adjustability removes the sizing decision entirely.

Hedge Fill Inputs Separately By Material Type

Foam chemical prices follow petrochemical and furniture demand while down follows poultry production, and the two behave independently of one another across any given year. Manufacturers running both fill types gain a natural hedge that single-material producers cannot access, provided purchasing is managed as two distinct exposures. Contract terms should be negotiated on separate cycles to reflect that independence properly.

Portfolio Architecture for Margin Defence

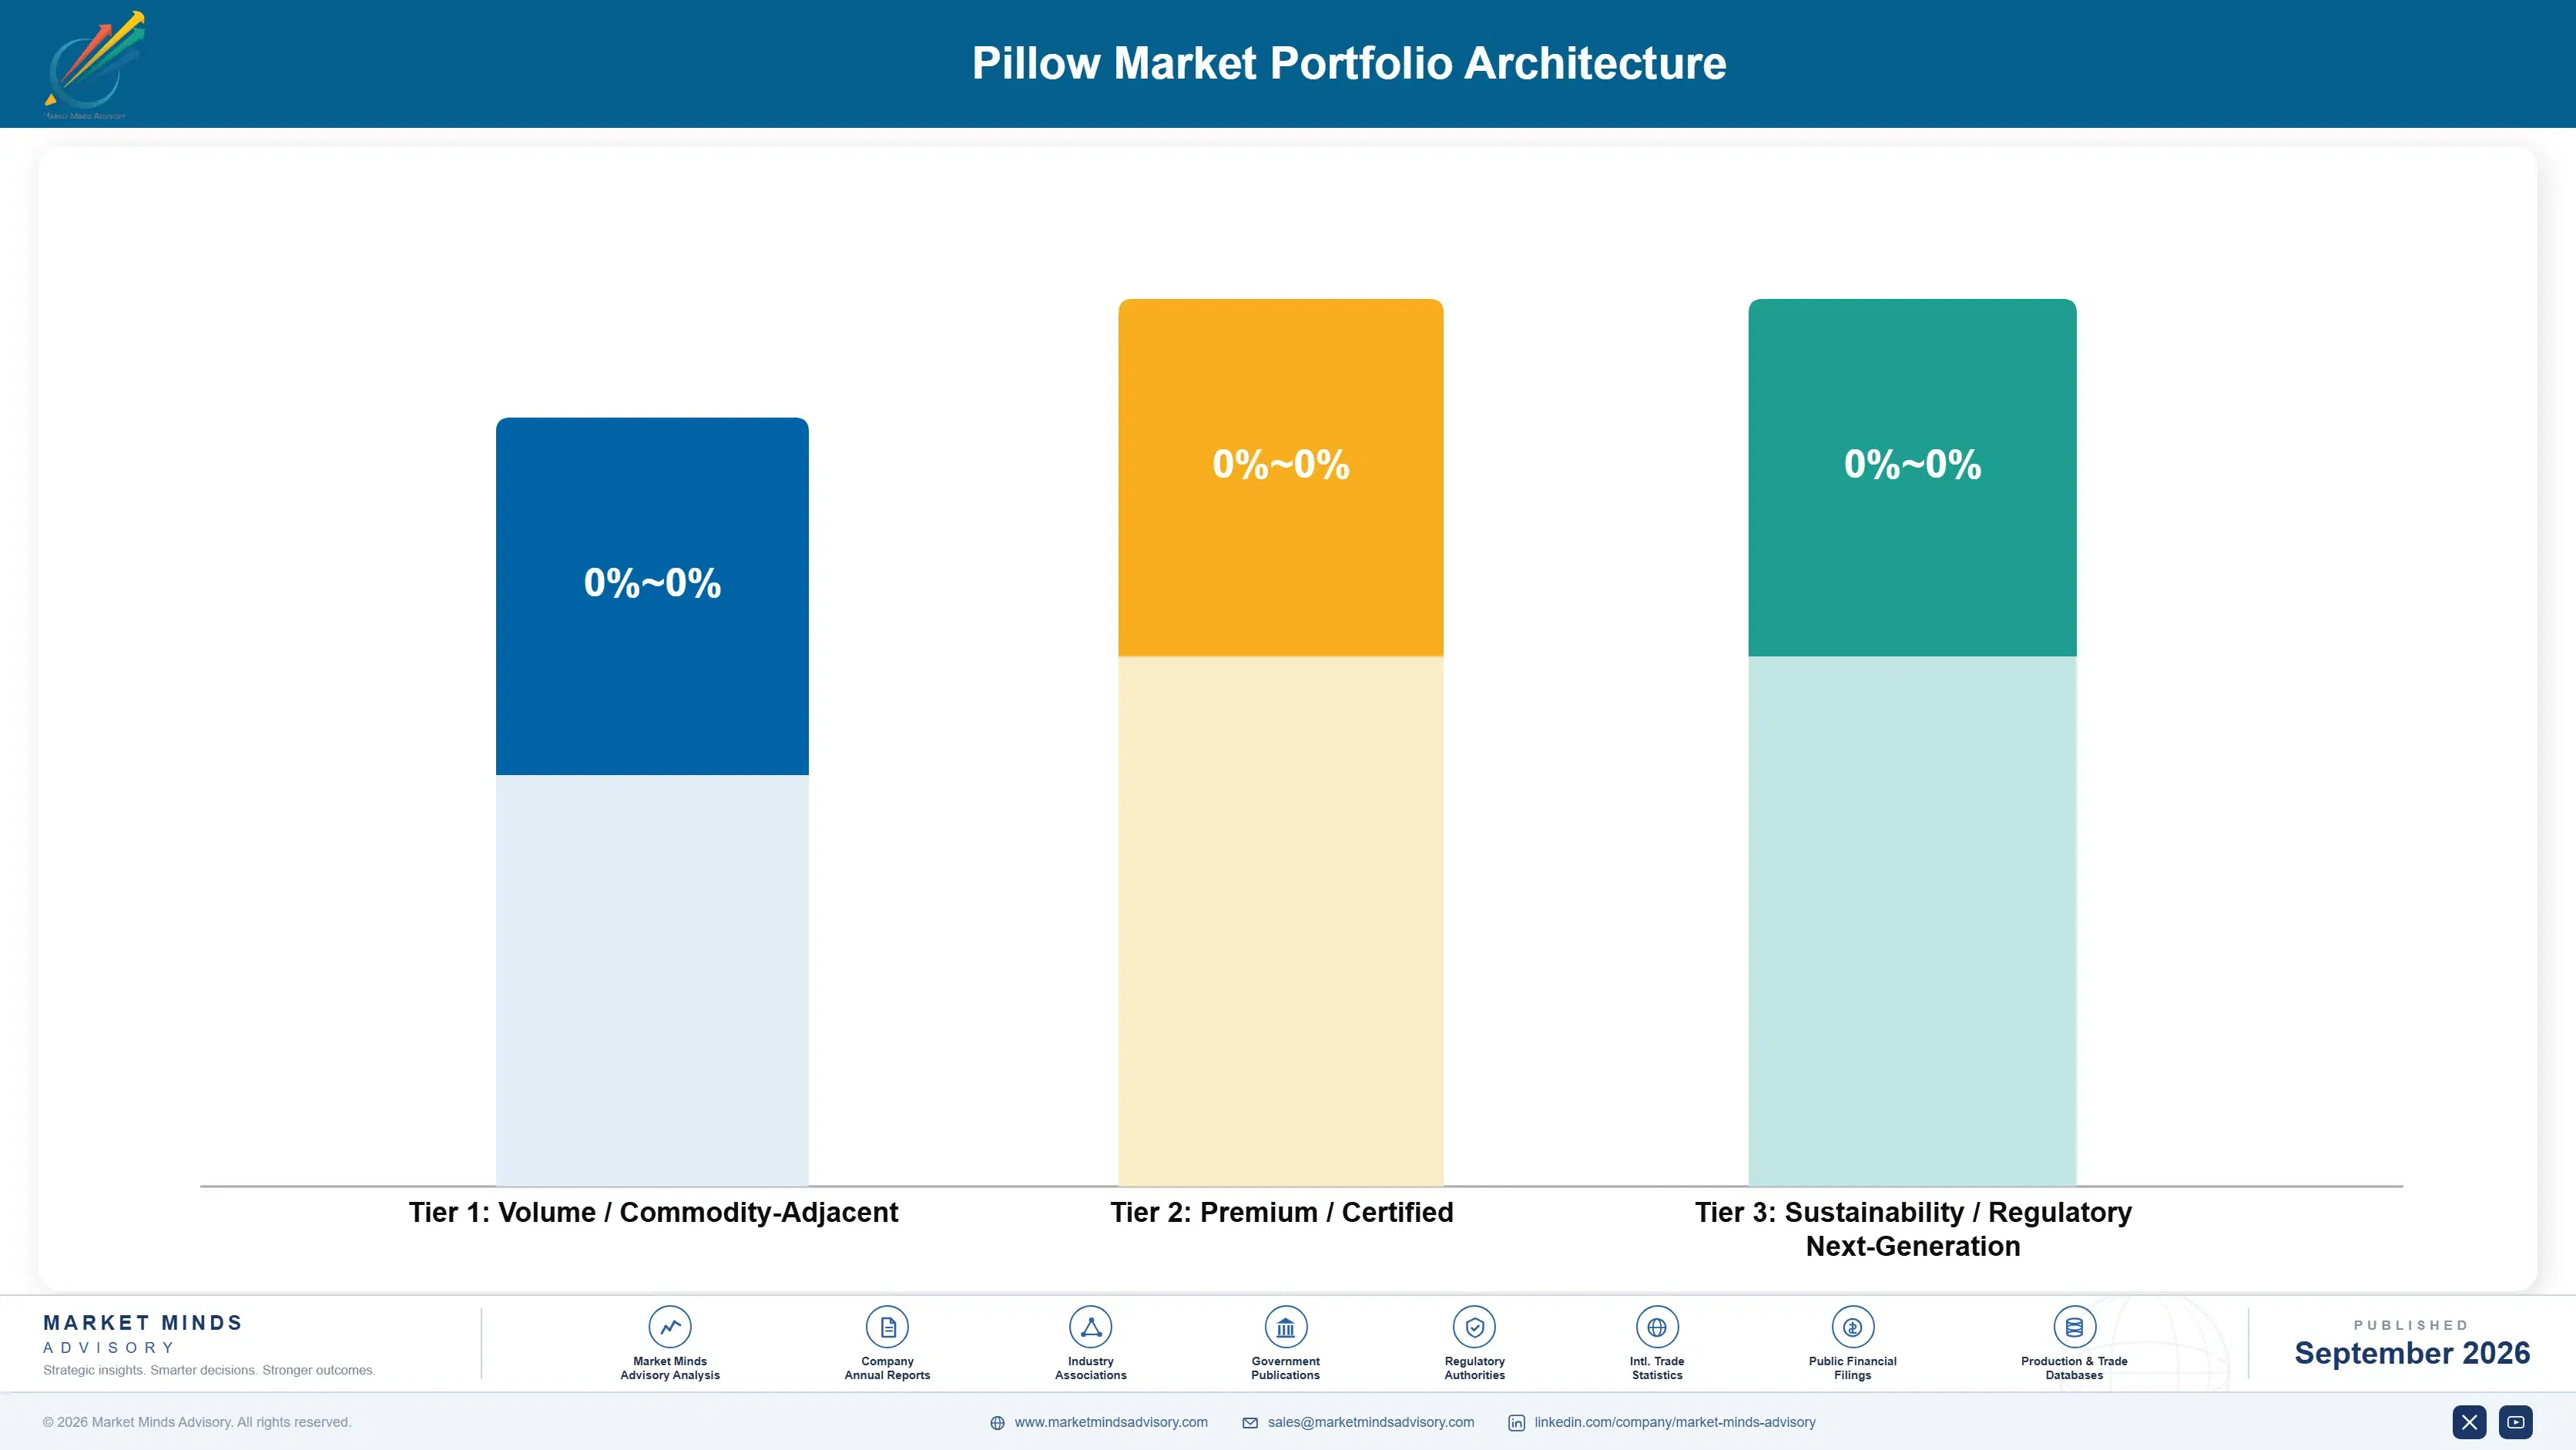
Margin follows whether the product solves something. Basic fibrefill is close to commodity, competing against private label of identical construction at a fraction of branded prices. Down retains margin on preference rather than performance. Foam and cooling constructions earn better, and adjustable or fitted products earn most, because they address the mismatch that makes the whole category cycle without resolution. Private label sits almost entirely in the first of those groups.
The tension between volume and premium runs through whether the consumer can judge quality. A shopper comparing pillows on a shelf has no way to assess loft suitability, so price and firmness label decide, which favours private label heavily. A consumer given a fit assessment has a reason to prefer one product, and that reason survives the price comparison in a way adjectives never do.

High-value pools concentrate where the purchase addresses a stated problem: neck pain, heat, allergy, and adjustable fit for people who have already bought badly several times. None of those buyers is shopping on price alone. Where the purchase is routine replacement of a household item, price decides everything and private label wins most of it. That split has held for a decade.

Volume / Commodity-Adjacent

Basic fibrefill and entry foam pillows competing against private label products of comparable construction at considerably lower prices. The ten-point range reflects fill purchasing scale and manufacturing location rather than any difference consumers can detect.
Gross Margin: 18% to 28%

Premium / Certified

Down, latex, and cooling constructions bought on material preference or a stated temperature complaint the consumer can articulate clearly. The twelve-point range separates products with verifiable cooling performance from those relying on material description alone.
Gross Margin: 32% to 44%

Sustainability / Regulatory / Next-Generation

Adjustable loft and fitted constructions sold with a sleeping position assessment, addressing the mismatch that drives dissatisfaction and returns. The fourteen-point range reflects how genuinely adjustable each construction is rather than how it is described.
Gross Margin: 46% to 60%
pillow-market-portfolio-architecture-1790012761334

High-value Sub-segments and Strategic Watch-out

Fitted And Adjustable Constructions

Highest value in the category, addressing the loft mismatch that only 6% of purchases currently assess for at all. The fourteen-point range reflects genuine adjustability against products described as adjustable but offering very little practical range. Repeat purchase behaviour is stronger here than anywhere else in the category.
Gross Margin: 48% to 62%

Cooling And Hybrid Constructions

High value growing at 6.2% on a complaint consumers can articulate, unlike loft which they cannot describe at all. The twelve-point range separates constructions with sustained cooling effect from those equilibrating within the first hour. Hospitality contract demand supports the segment independently of household buying.
Gross Margin: 34% to 46%

Compressed Foam Direct Supply

Volume core reaching consumers by parcel, which is how 43% of units now travel and how online brands took share. The ten-point range reflects compression and recovery quality, which decides whether direct distribution works at all. Compression capability now decides distribution reach across the whole category.
Gross Margin: 28% to 38%

Basic Fibrefill Supply

The strategic watch-out. Private label of identical construction sells far cheaper, consumers cannot detect any difference, and the fill does not compress well for parcel shipment. The ten-point range reflects purchasing scale and nothing defensible. Margin defence rests on manufacturing location and purchasing scale alone.
Gross Margin: 16% to 26%

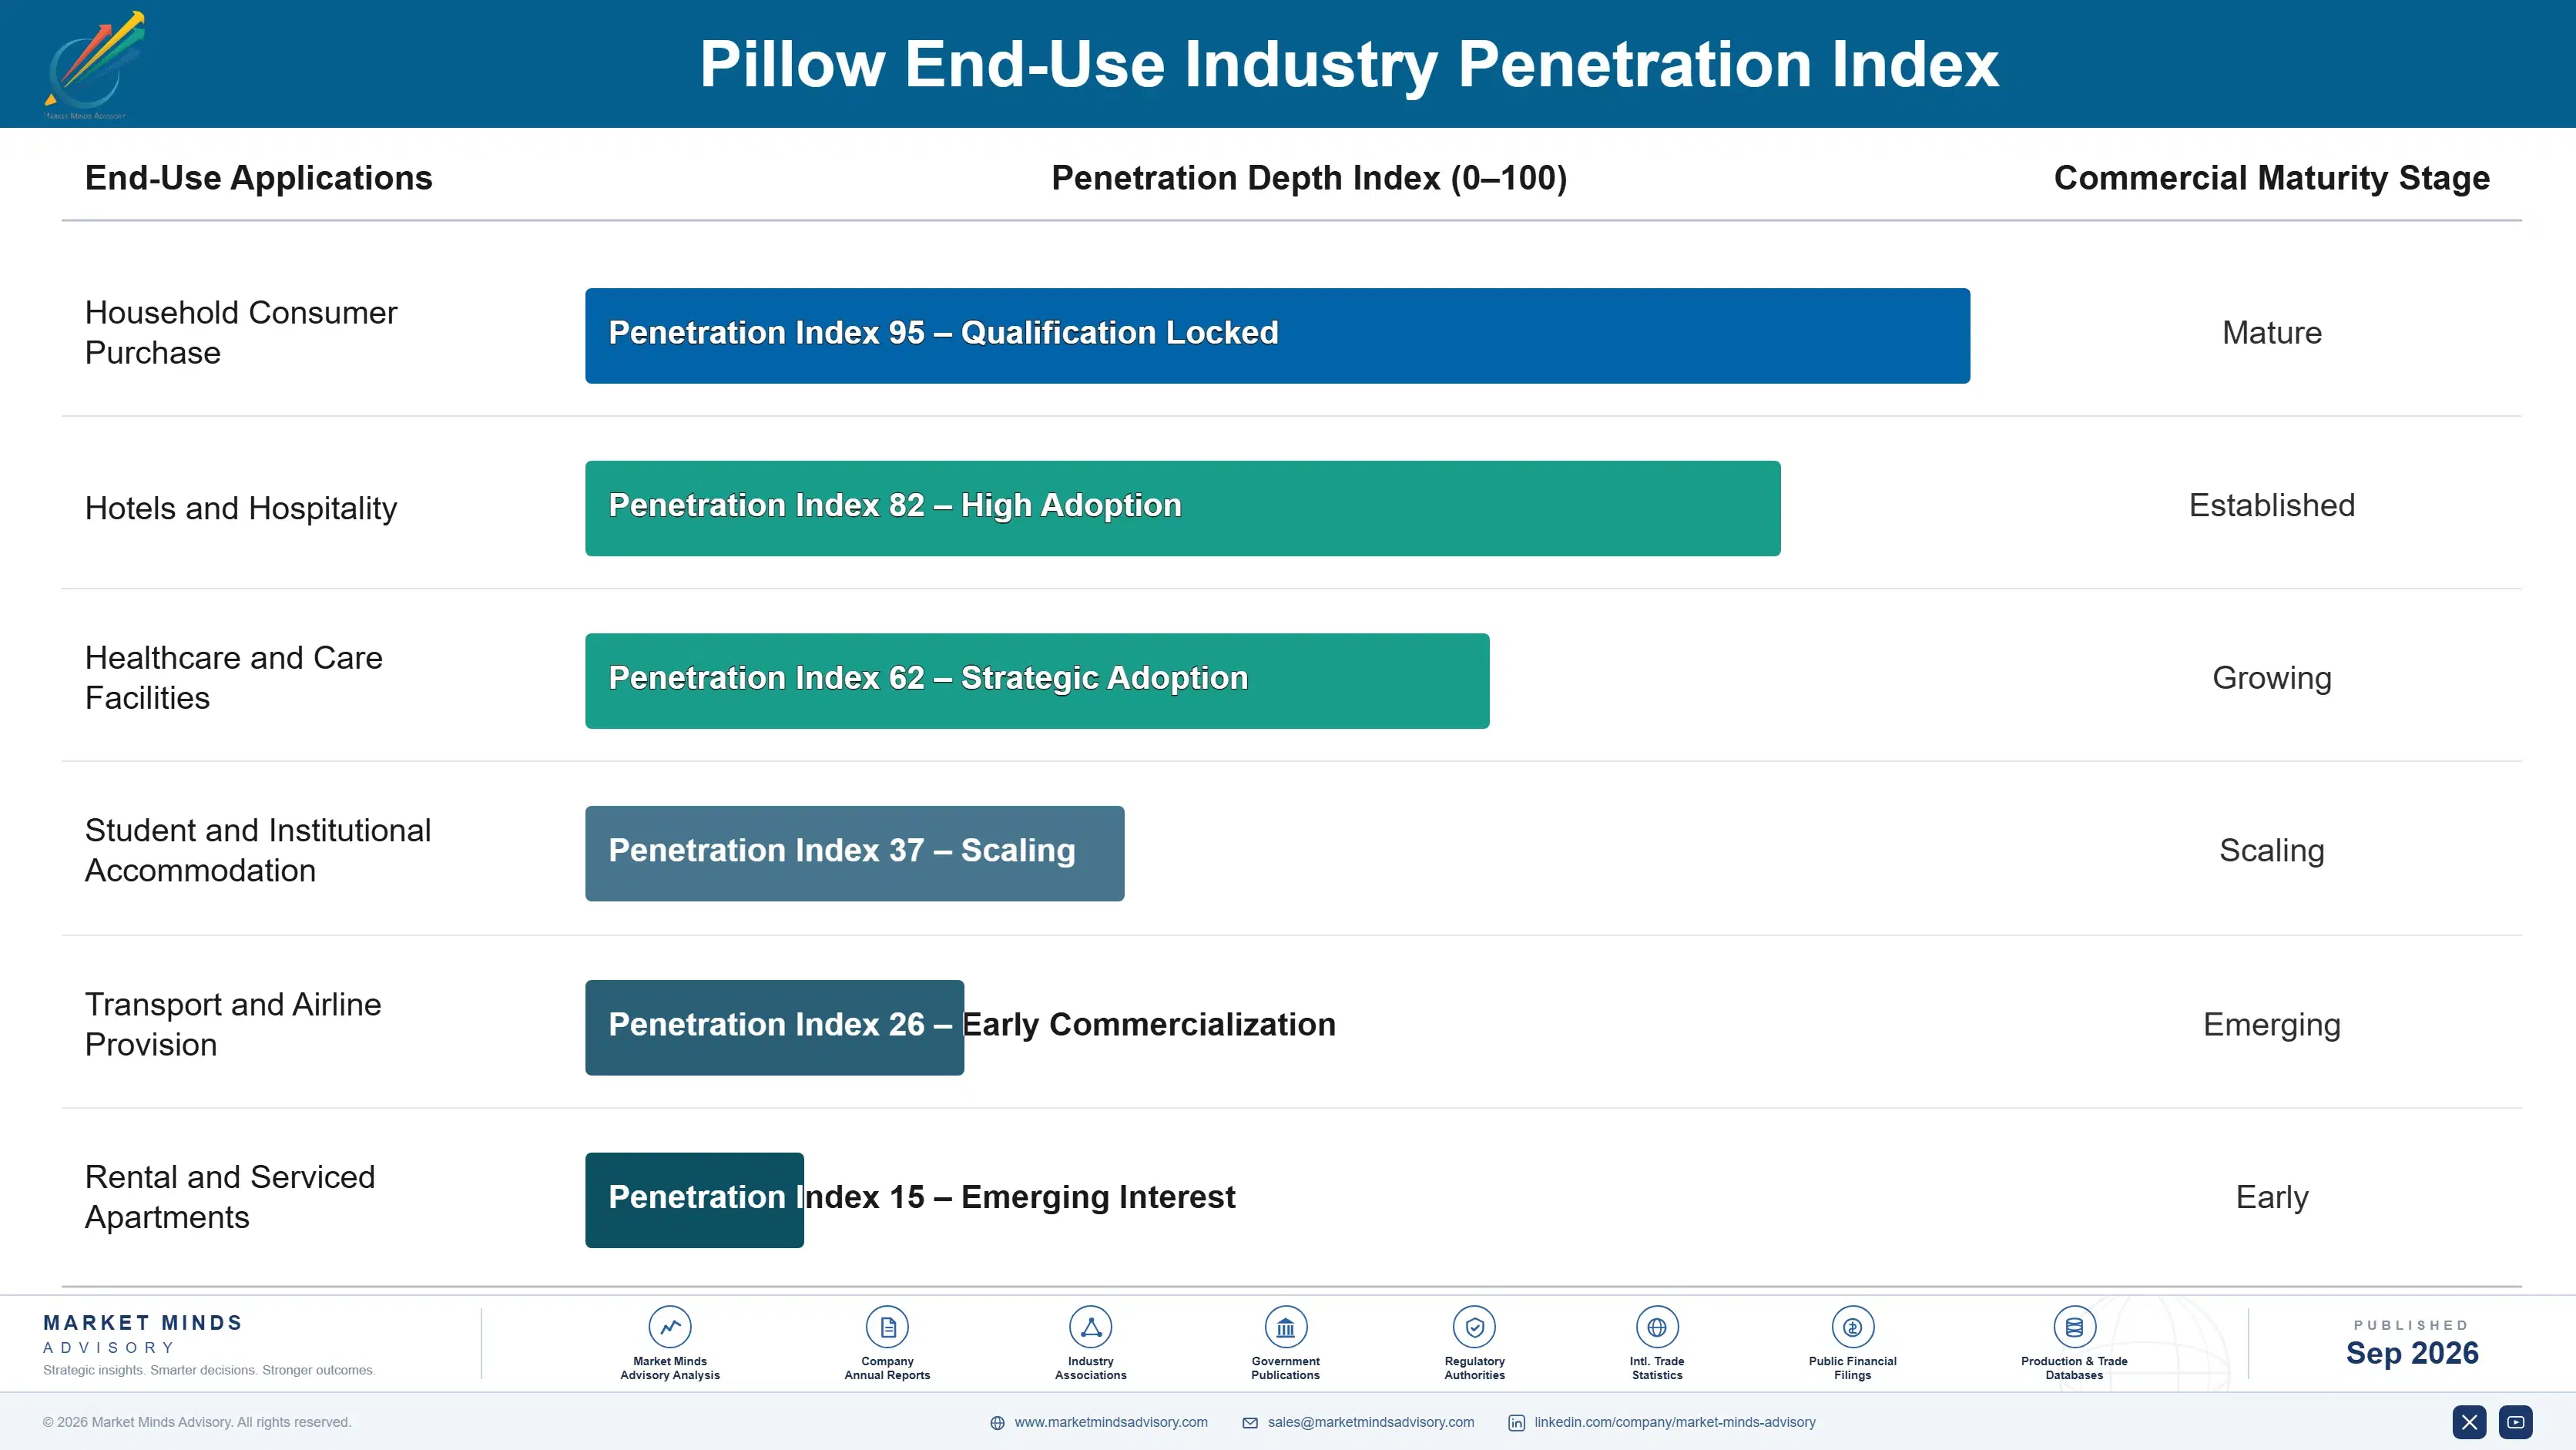
How This Demand Repeats

Replacement drives essentially all volume in mature markets, since households already own pillows and the number of beds does not change quickly. At an interval of about 4.7 years the category turns over slowly, and every month added to that interval removes volume nobody replaces from another direction. The industry's largest growth lever is therefore behavioural rather than commercial, which is an uncomfortable thing to build a plan around.
Attachment depth is close to absent. A consumer who slept well attributes it to the pillow and might repurchase the same one years later if they remember what it was, which most do not. Nothing about the product creates a relationship, no consumable attaches to it, and brand recall across the category is among the weakest in home textiles by any measure.

The buyer has shifted only slightly, and mostly in channel rather than in character. Pillows were bought in bedding retail alongside a considered decision and are now frequently bought online alongside a mattress or on the basis of a review. The consumer is no better informed about what they need, which is why returns rose when the trial opportunity disappeared.
pillow-market-end-use-penetration-index-1790012761835

Where This Market Rewards

These are among the four positions where our research anticipates prominent divergence between winners and laggards over the coming forecast period. Each is grounded in the demand model, the regulatory perimeter, and the announced capacity pipeline.
01 / FIT MEASUREMENT INTRODUCTION

Four seconds would fix most dissatisfaction

Loft requirement follows shoulder-to-ear distance and sleeping position, and only 6% of purchases involve anybody establishing either of those before a product is chosen. Brands introducing even a brief fit assessment at the point of sale report return rates 8 to 13 points lower and materially higher satisfaction on identical products. The assessment costs almost nothing, which makes its absence across this industry harder to explain than it would be to correct, given that the four seconds it takes sits well inside any existing sales conversation.
02 / REPLACEMENT SIGNAL CREATION

A pillow never looks worn out

Households replace at about 4.7 years against a recommendation of one to two, because a pillow degrades invisibly while a mattress sags where anybody can see it happening. Brands printing a replace-by date into the seam report repeat purchase intervals shortening by 11 to 17 months across their customer base. It costs nothing, it appears at the moment the consumer handles the product closely, and almost nobody does it, which leaves the largest volume lever in bedding sitting untouched year after year.
03 / ADJUSTABILITY OVER SIZING

Let the buyer fix it afterwards

Online buyers cannot judge loft before purchase, which is why 17% of parcel-shipped pillows return and why almost all of them are unsellable on hygiene grounds afterwards. Constructions the buyer can open and adjust convert a return into a modification, and brands offering them report return rates 2.4 times lower than fixed-loft equivalents sold alongside them. It removes a sizing decision from a moment when the necessary information simply is not available, and it gives the buyer a reason to keep something they would otherwise judge unsuitable.
04 / HYGIENE ARGUMENT WILLINGNESS

The unappealing truth moves the volume

Pillows accumulate skin cells, moisture, and biological load across years, and this is the single argument that would move replacement rates toward the recommended interval rather than leaving them near five years. Brands stating it directly report replacement conversion 2.9 times higher than those relying on comfort messaging alone. Nobody does it because the honest version is unappealing, which is a marketing preference rather than a commercial calculation, and one that leaves several years of avoidable volume on the table every single cycle.

Engagement Snapshot From the Field

A live engagement with an industry participant carrying material or product regulatory and market exposure ahead of a defining policy shift, showing how our research translates into a defensible multi-year portfolio strategy.
MARKET MINDS ADVISORY · CLIENT ENGAGEMENT SUMMARY
Pillow Producer Strategic Portfolio Review and Transition Roadmap 2026·Investment Scenario on Pillow Exposure Evaluation 2025-26
CLIENT PROFILE
A bedding retailer operating 210 stores and an online channel across three countries, carrying roughly 90 pillow lines with annual category revenue near USD 118 million (client-reported, unverified by MMA). Online pillow returns had risen for three consecutive years and category margin had fallen alongside them. Management wanted the cause identified before committing to any range restriction.
STRATEGIC CHALLENGE
The buying team attributed rising returns to online growth and had proposed restricting the range sold through that channel. Nobody had examined why individual customers were returning, or whether the same dissatisfaction was occurring in stores where returns were simply less visible to anybody. The proposal risked removing growth without touching the cause.
MMA APPROACH
MMA analysed two years of return reasons by product and channel, surveyed customers who kept their purchase alongside those who returned it, and tested a brief sleeping position assessment at point of sale across twelve stores and one online checkout flow. Return disposal costs were quantified separately, since resale had been assumed rather than verified anywhere in the existing category reporting.
KEY FINDINGS
  1. Loft mismatch accounted for 71% of stated return reasons, and in-store customers reported the same dissatisfaction at similar rates without returning the product at all.
  2. Only 4% of customers had considered sleeping position when choosing, and none had been asked about it by staff or by any online product page.
  3. Stores running the trial fit assessment saw pillow returns fall 41% and average selling price rise 19%, since fitted recommendations moved buyers toward better constructions.
  4. Returned pillows were disposed of rather than resold in all cases, so each return represented a complete loss of unit cost plus handling.
CLIENT PROFILE
A bedding retailer operating 210 stores and an online channel across three countries, carrying roughly 90 pillow lines with annual category revenue near USD 118 million (client-reported, unverified by MMA). Online pillow returns had risen for three consecutive years and category margin had fallen alongside them. Management wanted the cause identified before committing to any range restriction.
STRATEGIC CHALLENGE
The buying team attributed rising returns to online growth and had proposed restricting the range sold through that channel. Nobody had examined why individual customers were returning, or whether the same dissatisfaction was occurring in stores where returns were simply less visible to anybody. The proposal risked removing growth without touching the cause.
MMA APPROACH
MMA analysed two years of return reasons by product and channel, surveyed customers who kept their purchase alongside those who returned it, and tested a brief sleeping position assessment at point of sale across twelve stores and one online checkout flow. Return disposal costs were quantified separately, since resale had been assumed rather than verified anywhere in the existing category reporting.
KEY FINDINGS
  1. Loft mismatch accounted for 71% of stated return reasons, and in-store customers reported the same dissatisfaction at similar rates without returning the product at all.
  2. Only 4% of customers had considered sleeping position when choosing, and none had been asked about it by staff or by any online product page.
  3. Stores running the trial fit assessment saw pillow returns fall 41% and average selling price rise 19%, since fitted recommendations moved buyers toward better constructions.
  4. Returned pillows were disposed of rather than resold in all cases, so each return represented a complete loss of unit cost plus handling.
RECOMMENDED STRATEGY
Phase 1: Phase one: roll out the sleeping position assessment across all stores and add an equivalent short questionnaire to the online checkout flow. Phase 2: Phase two: prioritise adjustable loft constructions in the online range, since they convert a potential return into a modification the customer performs. Phase 3: Phase three: add replace-by dating to own brand products, which addresses the interval problem the entire category shares. Own brand carries the highest margin exposure to returns.
OUTCOME
Online returns fell 34% across the category within three quarters of the assessment rollout (client-reported, unverified by MMA). Category gross margin recovered above its level two years earlier. Average selling price rose 14% as fitted recommendations moved customers upward. Staff reported the assessment took under a minute in practice.

Frequently Asked Questions

Foundational context covering the market sizes, CAGR, scope, country, region and competition that inform every finding below. This section is provided to cover basics and most often pre-purchase conversations, answered from the MMA Primary Research Dataset.

What is the current size of the Pillow Market?

The market was worth USD 16.8 billion in 2025 and reaches USD 17.6 billion in 2026. Value covers pillows manufactured for sleeping use across all fill types.

How large will the Pillow Market be by 2036?

MMA forecasts USD 27.6 billion by 2036, an increase of USD 10.0 billion across the forecast period. That represents 1.57 times the 2026 base of USD 17.6 billion.

What is the CAGR for the Pillow Market 2026 to 2036?

The base case compound annual growth rate is 4.6%, with a bull case at 5.8% and a bear case at 3.4%. Historical growth from 2020 to 2025 ran at 3.6%.

Which segment is growing fastest?

Memory and moulded foam pillows grow at 6.9%, half again the market rate of 4.6%. Foam compresses for parcel shipment while down and fibrefill do not.

Who are the major companies in the Pillow Market?

Hollander Sleep Products, Tempur Sealy International, Serta Simmons Bedding, Luolai Lifestyle, and Mendale Hometextile lead the category. Together they hold only 19% of revenue, which makes this one of the least concentrated markets in home textiles.

Which country is growing fastest?

India grows at 8.6%, the fastest of any country covered in this report. Organised bedding retail is replacing unbranded local production across major cities alongside rising discretionary household spending.

Report Segmentation Architecture

The full report scope spans multiple orthogonal segmentation dimensions, with cross-tabulated demand data provided for each dimension pair. Coverage extends further to regional breakdowns, trend trajectories, and the competitive detail needed to support segment-level decision-making.

By Fill And Construction

  • Polyester Fibrefill Pillows
  • Memory Foam and Moulded Foam Pillows
  • Down and Feather Pillows
  • Latex Pillows
  • Gel and Hybrid Cooling Pillows
  • Specialty Cervical and Support Pillows

By End-Use Industry

  • Household Consumer Purchase
  • Hotels and Hospitality
  • Healthcare and Care Facilities
  • Student and Institutional Accommodation
  • Transport and Airline Provision
  • Rental and Serviced Apartments

By Commercial Dimension

  • Bedding Specialist Retail
  • Online Direct to Consumer
  • General Merchandise and Grocery
  • Retailer Private Label Supply
  • Hospitality Contract Supply
  • Marketplace and Third Party Selling

By Region

  • East Asia
  • North America
  • Western Europe
  • South Asia and Pacific
  • Latin America
  • Middle East and Africa
  • Eastern Europe

Scope, Methodology, and Coverage

Every figure in this report is reproducible from documented input assumptions. The scope below maps the historical period, the forecast horizon, the segmentation dimensions, and the countries covered, alongside the underlying primary and qualitative methodology.
Historical Period
2020 to 2025
Forecast Period
2026 to 2036
Base Year
2025 (USD billions; MMA Primary Research Dataset, September 2026)
Market Definition
This market covers pillows manufactured for sleeping use, including polyester fibrefill pillows, memory foam and moulded foam pillows, down and feather pillows, latex pillows, gel and hybrid cooling pillows, and specialty cervical and support pillows. It excludes decorative cushions, mattress toppers and protectors, pillowcases sold separately, travel and seating supports, and medical positioning devices supplied through clinical channels.
Quantitative Units
USD billions, retail value at manufacturer selling price
Segmentation Dimensions
Fill and construction, end-use industry, commercial dimension, region
Regions Covered
East Asia, North America, Western Europe, South Asia and Pacific, Latin America, Middle East and Africa, Eastern Europe
Countries Covered
China, Japan, South Korea, Taiwan, United States, Canada, Mexico, Germany, United Kingdom, France, Italy, Spain, Netherlands, Poland, Czechia, India, Indonesia, Vietnam, Thailand, Australia, Brazil, Mexico, Colombia, Chile, Saudi Arabia, United Arab Emirates, Egypt, Nigeria, Kenya, South Africa
Key Companies Profiled
Hollander Sleep Products, Tempur Sealy International, Serta Simmons Bedding, Luolai Lifestyle, Mendale Hometextile, Purple Innovation, Coop Home Goods, MyPillow, Downlite, John Cotton Group, Fogarty, Slumberdown, Sinomax, Xilinmen, Sleemon, IKEA, Silentnight, Emma Sleep, Simba Sleep, Nectar Sleep
Quantitative Methodology
Primary survey, n=3,800 respondents, Q4 2025, six countries; demand-side model with trade association cross-validation
Qualitative Methodology
47 expert interviews, Q4 2025; applied to validate demand model assumptions, identify emerging dynamics, and assess competitive positioning
Report Format
PDF and XLSX data workbook (Word format preview document)
Publisher
Market Minds Advisory
Report Code
MMA-2026-CHM-961
Published
September 2026
Contact
sales@marketmindsadvisory.com | www.marketmindsadvisory.com

Purchase the full Pillow Market Report (2026 to 2036).

The full report sizes the pillow market across six fill and construction types, seven regions, and thirty countries, with forecasts to 2036 under base, bull, and bear cases. It examines why the one measurement determining fit is almost never taken, how vacuum compression reshaped distribution more than any product change did, and why replacement intervals sit years beyond the recommendation. Competitive analysis covers twenty participants evaluated consistently on category revenue, with detailed treatment of return economics and compression capability. Cost structure, margin architecture, and regional consumption patterns are analysed throughout. Primary research includes 3,800 survey responses and 47 expert interviews.
Six fill and construction types sized and forecast separately
Twenty participants evaluated on category revenue consistently
Regional consumption and manufacturing mapped across seven geographies
Margin architecture by construction and problem addressed
Return reason analysis compared across online and physical retail channels
Replacement interval benchmarked against recommended practice by market

Built For The People Who Decide

From boardroom strategy to bench-side execution, this report is read cover-to-cover by leaders shaping the next decade of their industry, turning demand scenarios, market dynamics and valuation benchmarks into decisions.
CXOs/ Presidents/ VPs/ Managers
M&A and Corporate Development
Strategy Teams and R&D Heads
Procurement and Product Directors
Regulatory and Compliance Leaders
Investor Relations and Equity Analysts