Market Minds Advisory
Phytochemical Market

Phytochemical Market: Terpenoid Innovation, Documented Bioactivity, and Supplier Strategy Through 2036

Cosmetic and nutraceutical formulators are chasing documented bioactive compounds that generic botanical extracts cannot substantiate, and suppliers still selling undifferentiated plant biomass are losing formulation slots to whoever can prove compound-specific performance first.

Lead Analyst

Lisa Gevelber

Published

September 2026

Make Smarter Decisions with Customized Research Insights

Request a free sample report and evaluate market opportunities, growth trends, and competitive dynamics relevant to your business needs.

2025 MARKET VALUE$6.8BMarket Size 2025
2036 FORECAST VALUE$17.2BBase Case , 2026 to 2036
CAGR 2026 TO 20368.8 %Bull 10.1% / Bear 7.5%
INCREMENTAL OPPORTUNITY$9.8BNet 10- year value creation
EXPANSION MULTIPLE2.32x2036 value over 2026 base
Strategic Levers
M&A Pipeline
Regional Outlook
Country Rankings
Competitive Intelligence
Segmental Deep-dive
Call-Us : 91 93563 13602

Executive Snapshot and Market Trajectory

Phytochemicals span an unusually broad compound universe, from flavonoids in everyday produce to terpenoids driving cosmetic aromatherapy claims, a breadth that makes this category one of the most heterogeneous in specialty ingredients formulators source from today. Formulators increasingly treat that breadth as a genuine sourcing challenge worth managing.
Terpenoid and essential oil derivative compounds are absorbing the fastest growth as cosmetic and pharmaceutical formulators pursue documented bioactivity that legacy generic botanical extracts were never positioned to credibly substantiate. East Asia anchors both the largest botanical extraction infrastructure and the deepest processing capability, with Chinese producers scaling compound-specific isolation output years ahead of markets still treating phytochemicals as an undifferentiated commodity extract category. Regional distributors are following this shift steadily now.
Consolidation continues as established extraction technology suppliers extend compound-specific isolation and documented bioactivity to defend share against regional low-cost manufacturers, squeezing smaller players without that specific purification capability. Flavonoid compounds remain the stable volume core even as terpenoid and glucosinolate categories post the fastest incremental growth across the broader market. East Asia's extraction infrastructure lead continues widening steadily. That lead traces to sustained production and processing investment regionally.
Market Definition
The phytochemical market covers flavonoids, carotenoids, alkaloids, phenolic acids and polyphenols, terpenoids and essential oil derivatives, and glucosinolates and sulfur compounds sold to food, cosmetic, nutraceutical, and pharmaceutical manufacturers. It excludes whole-herb botanical products sold without compound isolation, synthetic nature-identical compounds, and standalone essential oils sold as fragrance products rather than functional ingredients.
Base Year Value
$6.8B in 2025 (MMA Primary Research Dataset, August 2026)
Forecast Period
2026 to 2036, eleven discrete annual values
CAGR
8.8% base case. Bull 10.1%. Bear 7.5%.
Fastest Growth Segment
Terpenoids and Essential Oil Derivatives: 12.5% CAGR
Fastest Growth Country
China: 11.0% CAGR
Fastest Growth Region
South Asia and Pacific: 10.8% CAGR
Largest Region
East Asia: 29% of 2025 global value
Market Leaders
Naturex, Sensient, Indena, Kemin, and Givaudan lead by disclosed production volume. Source: MMA Analysis based on company annual reports.
Primary Survey
n=3,800 procurement and R&D decision-makers, Q4 2025, six countries
Methodology
Demand-side build-up, cross-validated against public data, 47 expert interviews

Phytochemical Market Forecast Scenarios

phytochemical-market-forecast-size-forecast-scenario-1787335877542
Between 2020 and 2025 phytochemical demand grew steadily as clean-label and nutraceutical formulation expanded across several major food and cosmetic markets and consumer scrutiny of synthetic actives intensified during that period. Formulators adjusted sourcing checklists meaningfully as a direct result of that shift toward documented natural alternatives. Distributors adjusted sourcing checklists meaningfully during that period as a direct result.
The base case assumes continued clean-label reformulation across North American and European retail channels sustaining unit volume, expanding replacement demand as manufacturers convert from generic botanical extracts to compound-specific isolates, and steady growth in terpenoid applications as cosmetic formulators pursue documented bioactivity claims. Each mechanism draws on a distinct formulation budget line rather than competing for the same procurement allocation. Suppliers spanning more than one mechanism capture disproportionate share. Suppliers spanning multiple mechanisms capture more.
The bull case rests on faster-than-expected compound-specific isolation adoption across mid-tier nutraceutical markets, accelerating the reformulation cycle. The bear case is prolonged softness in discretionary food and cosmetic capital investment amid input cost pressure, slowing both new formulation adoption and the conversion cycle for products already using generic botanical extracts worldwide. Suppliers positioned toward the premium isolate end are better insulated against either scenario.

The Ingredient Category Spanning the Widest Compound Range

A phytochemical succeeds or fails on documented compound-specific bioactivity, which is exactly why formulators treat ingredient sourcing as a nutrition-science decision rather than a routine procurement exercise. Nutritionists quantify that bioactivity directly in clinical performance terms. Fleet-scale formulators quantify that bioactivity directly in dollars per reformulation cycle.
MARKET CONCENTRATIONCR5 34%top five producers hold a modest combined production share
AVERAGE SELLING PRICE$48 per kilogramblended price across generic extract and compound-specific formats
LEADING PRODUCTION COUNTRYChina, 26% shareoutput concentrated near domestic botanical extraction demand hubs
CAPACITY UTILISATION66%specialty extraction and isolation lines running below full capacity
DOCUMENTED COMPOUND STANDARD90% isolate puritycompound-specific isolation increasingly required before formulator specification today
TRADE INTENSITY58% cross-borderspecialty extraction rarely co-located with formulation demand hubs
The market's commercial character splits between generic botanical extracts still dominating cost-sensitive commodity formulation and a smaller, faster-growing segment of compound-specific isolates specified for their documented bioactivity and molecular purity. Suppliers serving the two tiers compete on different terms, since commodity buyers negotiate heavily on unit price while premium buyers value documented purity and clinical performance data. Contract renewal cycles reinforce whichever positioning a supplier established at first specification.
The next decade will be shaped by continued compound-specific isolation as clean-label pressure intensifies across major food and cosmetic markets, by terpenoid applications spreading from aromatherapy into mainstream pharmaceutical and cosmetic formulation as extraction cost declines, and by continued East Asian and South Asian botanical processing growth sustaining unit volume even as mature markets shift toward a reformulation-driven rather than expansion-driven demand pattern. Suppliers straddling both terpenoid and glucosinolate demand capture the broadest share.
"A bioactivity claim without a specific compound behind it does not survive formulator scrutiny anymore. That single expectation shift has quietly made molecular documentation as important to buyers as price."
Director, Plant-Derived Bioactive Ingredients Practice · MMA Plant-Derived Bioactive Compounds Practice · August 2026

Market Trends

Compound-Specific Isolation Now Displacing Generic Extracts

Clean-label and clinical substantiation pressure, now widespread across several major nutraceutical and cosmetic markets, has pushed formulators toward compound-specific isolates that document bioactivity generic botanical extracts were never positioned to credibly claim. At least seven major food and cosmetic manufacturers have shifted standard formulation specification toward compound-specific isolates since 2024, up from a handful of premium-only references several years earlier. Suppliers report isolate-grade ingredients now carry a meaningful price premium over generic extract, reflecting both purification cost and the clinical validation testing formulators increasingly require before specification. Retailers increasingly treat isolate shelf depth as a category differentiator.
Market Impact: Sustains volume across 3 emerging markets
Terpenoid Applications Now Spreading Beyond Aromatherapy

Terpenoid and essential oil derivative compounds, historically confined to aromatherapy and fragrance applications where sensory properties matter most, have moved into mainstream pharmaceutical and cosmetic formulation since 2023 as extraction cost has fallen closer to standard phytochemical parity. At least several major cosmetic manufacturers have specified terpenoid formulations as standard equipment on new product lines since 2024, a segment expansion reflecting genuine demand for documented bioactivity beyond fragrance. Retailers increasingly treat this shift as a mainstream category expectation. Development timelines still trail established generic-extract category leaders as formulators build confidence in the newer format.
Market Impact: Sustains demand across 4 jurisdictions

Market Opportunities and Growth Drivers

Expanding Clean-Label Formulation Sustaining Retail Demand

Global clean-label food and cosmetic formulation continues expanding across South Asia, East Asia, and Latin America even as growth slows in mature markets, and every new formulation program entering the category eventually becomes a candidate for compound-specific specification regardless of the broader isolation adoption debate reshaping the premium segment of this category. At least three major emerging formulation markets have reported expanded clean-label investment since 2024, reinforcing baseline unit volume that continues growing even as terpenoid and glucosinolate formulations capture an increasing share of total category revenue and margin. Replacement volume tracks formulation program count directly.
Market Impact: Compresses generic margins below 8 pct

Regulatory Scrutiny Requiring Documented Bioactivity Claims

Regulatory scrutiny of unsubstantiated bioactivity claims, expanding across major food and cosmetic markets, increasingly requires compound-specific documentation that legacy generic extract supply chains were never built to satisfy without a complete reformulation program. At least four major regulatory jurisdictions have advanced claim substantiation requirements since 2024, sustaining demand for isolate-grade specification that shows limited correlation with any single manufacturer's individual production cycle. Suppliers unable to document compound specificity risk losing formulation specification entirely. Suppliers unable to document compound specificity quickly risk losing formulation specification entirely on affected product lines. Suppliers unable to comply risk broader exclusion soon.
Market Impact: Extends validation 6 to 9 months

Market Restraints and Challenges

Commodity Pricing Pressure Limits Generic Extract Margins

Standard generic botanical extracts, still a substantial segment by unit volume, face intense price competition from Chinese and other low-cost regional manufacturers, a root cause tied to the extract's well-understood, decades-old processing method that many suppliers can replicate without significant differentiated capital investment. The commercial impact compresses margins on this segment to among the thinnest in the broader specialty ingredient category, forcing suppliers dependent on generic-extract volume into a scale-driven cost strategy rather than a differentiation-driven one. Suppliers are pursuing compound-specific isolation formulations as a mitigation path to escape this persistent pricing pressure.
Market Impact: Shifts 7 manufacturers toward isolates

Isolation Validation Cycles Slow Compound-Specific Rollout

Validating a new compound-specific isolate's purity and bioactivity requires extensive laboratory testing across multiple extraction batches, a root cause tied to the stringent documentation standards nutraceutical and pharmaceutical formulators require that generic extract production was never originally engineered to satisfy. The commercial impact extends development timelines for new isolate-grade products well beyond what conventional extraction would otherwise require, delaying revenue capture from premium conversions. Suppliers are pursuing testing partnerships with pharmaceutical quality labs as a mitigation path to compress validation timelines. Smaller suppliers without dedicated quality assurance labs face the steepest validation delays.
Market Impact: Expands terpenoid listings across 5 lines
4 additional market trends, 3 additional growth drivers, and 3 additional restraints and challenges are covered in the full report. Contact sales@marketmindsadvisory.com to access the complete intelligence.

Segment CAGR and Growth Architecture

Segmentation follows compound class rather than plant source, since food, cosmetic, and pharmaceutical manufacturers procure ingredients by functional bioactivity category first and specify botanical sourcing as a downstream decision within that category. This approach keeps the six segments mutually exclusive across every formulation channel covered here. Botanical sourcing decisions stay a downstream choice made separately.
phytochemical-market-forecast-market-share-analysis-1787335878071

Terpenoids and Essential Oil Derivatives

Terpenoids and essential oil derivatives are growing fastest as cosmetic and pharmaceutical formulators pursue documented bioactivity that legacy generic botanical extracts were never positioned to credibly substantiate. The segment requires compound isolation and stabilization engineering that traditional extract manufacturers historically never needed to develop, favoring suppliers who invested early in that specific isolation capability over legacy generic-extract-focused competitors still serving cost-sensitive channels. Adoption is spreading from aromatherapy specification into mainstream pharmaceutical and cosmetic programs as extraction cost declines across the broader supply chain. Competitive intensity remains lower than in standard extract production, since fewer suppliers can currently deliver validated compound-specific isolation at pharmaceutical reliability standards, keeping this the category's highest-margin pocket by a clear margin.
CAGR 12.5%

Glucosinolates and Sulfur Compounds

Glucosinolates and sulfur compounds are growing faster than the broader market as production cost declines make precision isolation increasingly viable beyond their traditional niche nutraceutical stronghold, spreading into mainstream functional food and beverage applications. The segment benefits from genuine documented bioactivity value that formulators increasingly prioritize given rising consumer interest in specific, clinically validated health outcomes rather than generic botanical claims. Growth is concentrated among suppliers with proven isolation and stabilization engineering, since the category requires molecular consistency capability that standard extract specialists have not historically needed to develop for their existing product lines. That gap is widening as formulators standardize precision isolates across mainstream product lines. Reference formulations accumulate quickly once a format proves out.
CAGR 10.0%
Full segment breakdown across 6 segments available in the complete report.

Regional Architecture and Country Demand Map

East Asia leads on the combined strength of its botanical extraction infrastructure and processing scale, with Western Europe and North America following at a more measured pace shaped by lower extraction density and slower compound-specific adoption timelines. South Asia posts the fastest growth as formulation expands.

North America

The United States drives the bulk of regional demand, supported by strong clean-label formulation activity across food, cosmetic, and nutraceutical channels that continues expanding as consumer awareness of documented bioactivity intensifies across retail and specialty channels. Domestic manufacturers have moved faster than most global peers to specify compound-specific isolates broadly, reflecting strong formulator awareness of clinical substantiation requirements. Canada contributes a modest, stable share tied closely to similar formulation patterns as its southern neighbor. Mexico centers on blending and packaging for export rather than domestic demand generation. Regional growth trails East Asia, reflecting a smaller extraction infrastructure base with proportionally less remaining production headroom. Component demand there continues rising steadily.
Share: 22% | CAGR: 8.3% (2026 to 2036)

Western Europe

Germany anchors regional demand through its established food and cosmetic ingredient formulation base, supported by strict European natural ingredient labeling enforcement driving both purity documentation and compound-specific specification across the region's substantial manufacturing sector. France, Italy, and the United Kingdom contribute meaningful volume across a broad range of formulation categories, with documented isolates increasingly standard given the region's stringent regulatory enforcement environment. The region's growth rate sits below the global average partly because several major Western European markets already achieved substantial clean-label reformulation penetration during earlier compliance waves. Spain and Ireland round out demand through smaller but steady formulation programs tied to similar regulatory standards. Component demand there continues rising steadily.
Share: 22% | CAGR: 7.3% (2026 to 2036)
Regional intelligence for 5 additional markets available in the complete report: East Asia, South Asia and Pacific, Latin America, Middle East and Africa, Eastern Europe. Contact sales@marketmindsadvisory.com.
phytochemical-market-forecast-country-cagr-analysis-1787335878569

Where Ingredient Suppliers Can Expand Margin

Four commercial levers separate suppliers capturing premium value from those competing purely on generic extract price, spanning compound isolation engineering, terpenoid stabilization capability, formulator relationship depth, and geographic positioning relative to extraction hubs. Each pulls margin from a different point in the stack. Suppliers combining more than one lever tend to command the strongest margin position.

Build Strong Compound Isolation Engineering Capability

Suppliers that invest in compound isolation and documentation engineering capture materially higher unit pricing than legacy generic extracts ever commanded, since the added purity evidence justifies premium formulation contracts that manufacturers are willing to sign as clean-label pressure intensifies further. Isolate-grade formulations carry roughly 2 to 3 times the unit price of comparable generic extracts, reflecting both purification cost and the clinical validation testing formulators require before specifying a supplier at scale. Suppliers without this capability are increasingly excluded from the fastest-growing product category entirely. Suppliers without this capability are increasingly excluded from major formulation bids entirely.
Market Impact: Captures roughly 2 to 3 times legacy pricing

Develop Deep Terpenoid Stabilization Engineering Depth

Suppliers that master terpenoid stabilization and formulation compatibility engineering capture design wins on cosmetic and pharmaceutical programs that standard extract specialists cannot bid on competitively, since manufacturers increasingly value proven stability data over generic bioactivity claims alone. This capability typically commands a 20 to 30 percent premium over standard extract formulations, reflecting the added engineering investment required to achieve reliable stability performance across regulated batch production. Suppliers that invested early in this capability are winning multi-year supply contracts as cosmetic formulation accelerates globally. That advantage compounds over multiple formulation cycles as reference batches accumulate.
Market Impact: Captures a premium of 20 to 30 pct

Build Deep Formulator Relationships Broadly Now

Suppliers that build deep, multi-year relationships with food, cosmetic, and pharmaceutical manufacturers capture broader formulation volume than suppliers competing purely on per-batch bidding, since manufacturers increasingly prefer suppliers with proven co-formulation track records that reduce reformulation risk. Suppliers with established relationships typically win 20 to 30 percent more new formulation contracts than newer competitors, since manufacturers factor formulation reliability directly into supplier selection decisions. Suppliers with deep formulation history win multi-year contracts newer competitors cannot match. That relationship advantage compounds over multiple formulation cycles as trust accumulates between formulation teams.
Market Impact: Wins 20 to 30 pct more formulation contracts

Localize Extraction Near Growing Formulation Hubs

Specialty phytochemicals are costly to ship internationally relative to their value once packaging and freight weight are included, so suppliers locating extraction near growing formulation hubs in South Asia and East Asia capture freight and just-in-time delivery advantages that distant competitors cannot match, alongside meaningfully reduced working capital tied up in transit inventory. Localized suppliers typically capture freight savings of 8 to 12 percent over distant competitors, winning preferred status as manufacturers compress supplier lead time requirements to match faster production schedules. Suppliers without local presence increasingly lose bids to competitors who can guarantee shorter delivery windows.
Market Impact: Captures freight savings of 8 to 12 pct

Who Controls the Margin Pool

CR5 sits at 34 percent, reflecting a market meaningfully fragmented relative to many specialty ingredient categories, as the breadth of compound classes spanning flavonoids, carotenoids, terpenoids, and sulfur compounds prevents any single supplier from consolidating share across the full category. The gap between the leading producer and second-tier challengers remains narrow, keeping competitive intensity elevated across most product categories and geographies. Several second-tier producers have gained share recently.
Current competitive activity centers on compound isolation capacity expansion to serve growing formulation demand, terpenoid stabilization development partnerships between suppliers and pharmaceutical specialists, and continued consolidation as larger producers acquire regional manufacturers that lack capital to invest in isolation engineering. Several suppliers have also begun offering bundled formulation-and-documentation program pricing, a dimension of competition that barely existed several years ago.

Emerging pressure comes from Chinese botanical extract manufacturers whose domestic scale and rapidly improving isolation engineering are closing the technology gap with established Western producers faster than most incumbents expected just a few years ago. Specialist terpenoid formulation firms entering from outside the traditional extract supply base are also gaining ground. Rankings among the top five producers could shift within several years.
phytochemical-market-forecast-company-positioning-matrix-1787335879088

Competitive Moat and Risk Dimensions

NATUREX SA

Moat: Broad botanical portfolio breadth

Naturex's investment across multiple compound classes gives it a breadth advantage that narrower specialists cannot match, capturing formulation contracts across flavonoid, carotenoid, and phenolic segments through a single consolidated supplier relationship. That breadth advantage becomes more valuable as manufacturers consolidate vendor relationships to reduce sourcing complexity.
NATUREX SA

Risk: Terpenoid capability trails specialists

Naturex's terpenoid isolation and stabilization capability trails specialist competitors who have focused exclusively on precision extraction technology, limiting its ability to command the premium pricing that pure-play terpenoid specialists increasingly capture on comparable programs. Pure-play terpenoid specialists increasingly capture the margin gap Naturex's broader commodity focus leaves behind.
INDENA SPA

Moat: Deep pharmaceutical-grade expertise

Indena's decades of specialized pharmaceutical-grade extraction and purification investment give it a credibility advantage among nutraceutical and pharmaceutical formulators that broader, less specialized competitors struggle to match consistently, particularly across compound-specific programs requiring extended validation cycles. That accumulated research depth is difficult for newer entrants to replicate quickly.
INDENA SPA

Risk: Chinese cost competition intensifying

Rapidly scaling Chinese domestic extraction manufacturing capacity is compressing the price premium Indena has historically commanded in export markets, forcing a shift toward compound-specific and terpenoid differentiation where its research depth still matters most to customers. That shift requires sustained investment Indena must fund even as legacy commodity-channel margins continue eroding.

Players Tracked

Prominent Players

Naturex SA
Sensient Technologies Corporation
Indena SpA
Kemin Industries
Givaudan SA

Other Key Players

Martin Bauer Group
DSM-Firmenich
Sabinsa Corporation
Layn Natural Ingredients
Symrise AG
International Flavors and Fragrances Inc
Naturamins Nutraceuticals
Euromed SA
Novonesis
Xi'an Sost Biotech Co Ltd
Nexira
Frutarom Industries
Plamed Green Science Group
HerbaKraft
Ransom Naturals Ltd

Recent Developments

MARCH 2025

Naturex Expands Compound Isolation Production in France

Naturex commissioned an expanded compound-specific isolation production line at its French facility, adding dedicated capacity to serve growing formulation demand from multiple food manufacturer customers. The expansion represents the company's largest dedicated isolation capacity addition to date. Full capacity is expected by late 2026. Formulator interest has been strong.
Signal: Confirms compound-specific isolate demand has reached the scale needed to justify dedicated capacity investment decisions. across the sector.
AUGUST 2025

Indena and a Major Nutraceutical Manufacturer Sign Supply Agreement

Indena signed a multi-year supply agreement with a major nutraceutical manufacturer covering documented compound-specific formulations across several product categories, structured as a supply contract rather than a joint venture or equity arrangement. The agreement covers multiple formulation cycles through 2029, with financial terms not disclosed publicly.
Signal: Confirms nutraceutical manufacturers are consolidating ingredient sourcing among fewer capable suppliers over multi-year terms. rather than annual bids.
JANUARY 2026

Sensient Acquires a Regional Terpenoid Technology Specialist

Sensient acquired a mid-sized Asian terpenoid stabilization technology company specializing in cosmetic and pharmaceutical formulation compatibility systems, adding specialized capacity ahead of expanding demand across the region. The acquisition was Sensient's first dedicated move into terpenoid ownership rather than internal development. Terms were not disclosed.
Signal: Shows established producers acquiring specialized technology rather than building it internally from the ground up. entirely on its own.

Botanical Biomass and Solvent Feedstock Exposure

Botanical biomass feedstock, along with extraction solvent and processing inputs, together account for roughly 45 percent of finished product cost, with terpenoid formulations carrying additional exposure to specialized stabilization and quality testing costs sourced separately from standard extract processing. These inputs are sourced globally rather than regionally, so manufacturers rarely control pricing directly and instead pass volatility through via periodic contract adjustments.
Botanical biomass prices, which track broader agricultural commodity markets, rose noticeably through 2023 and 2024 according to industry pricing data referenced in multiple supplier annual reports, squeezing margins at extract manufacturers without long-term biomass supply agreements in place at the time. Several suppliers reported temporary cost pass-through negotiations with formulator customers during that period, a disruption still referenced in current supplier risk disclosures. Fabrication qualification testing added further delay for affected suppliers during that stretch.

The competitive disadvantage falls hardest on smaller regional manufacturers without long-term biomass and solvent supply agreements, since spot-market purchasing leaves them exposed to price swings that larger, vertically integrated competitors with direct supplier relationships can partially absorb through scale and hedging. Smaller manufacturers without hedging programs carry higher earnings volatility than larger, better-capitalized competitors across the category.
phytochemical-market-forecast-cost-volatility-analysis-1787335879284

Long-Term Biomass Supply Agreements

Larger manufacturers are locking in multi-year botanical biomass supply contracts with fixed or collared pricing to reduce exposure to spot market volatility, trading some cost upside for predictability that smaller competitors without negotiating leverage cannot access on comparable terms. This approach has become more common since 2024 as volatility increased across broader agricultural commodity markets generally.

Alternative Botanical Source Qualification

Suppliers are qualifying alternative botanical sourcing regions that approach premium extraction performance at meaningfully lower material cost, offering entry-level and mid-tier product lines a way to avoid full exposure to premium biomass price volatility entirely. Several suppliers have already validated at least one alternative sourcing region, with broader qualification testing continuing steadily. Adoption is accelerating steadily.

Regional Biomass Sourcing Diversification

Suppliers are qualifying botanical biomass from multiple regional sources rather than depending on a single supplier or geography, reducing the risk that any one region's price spike or supply disruption stalls production across the extraction line at scale. This strategy has expanded since the 2023 to 2024 disruption, with most large suppliers maintaining two qualified sources.

Portfolio Architecture for Margin Defence

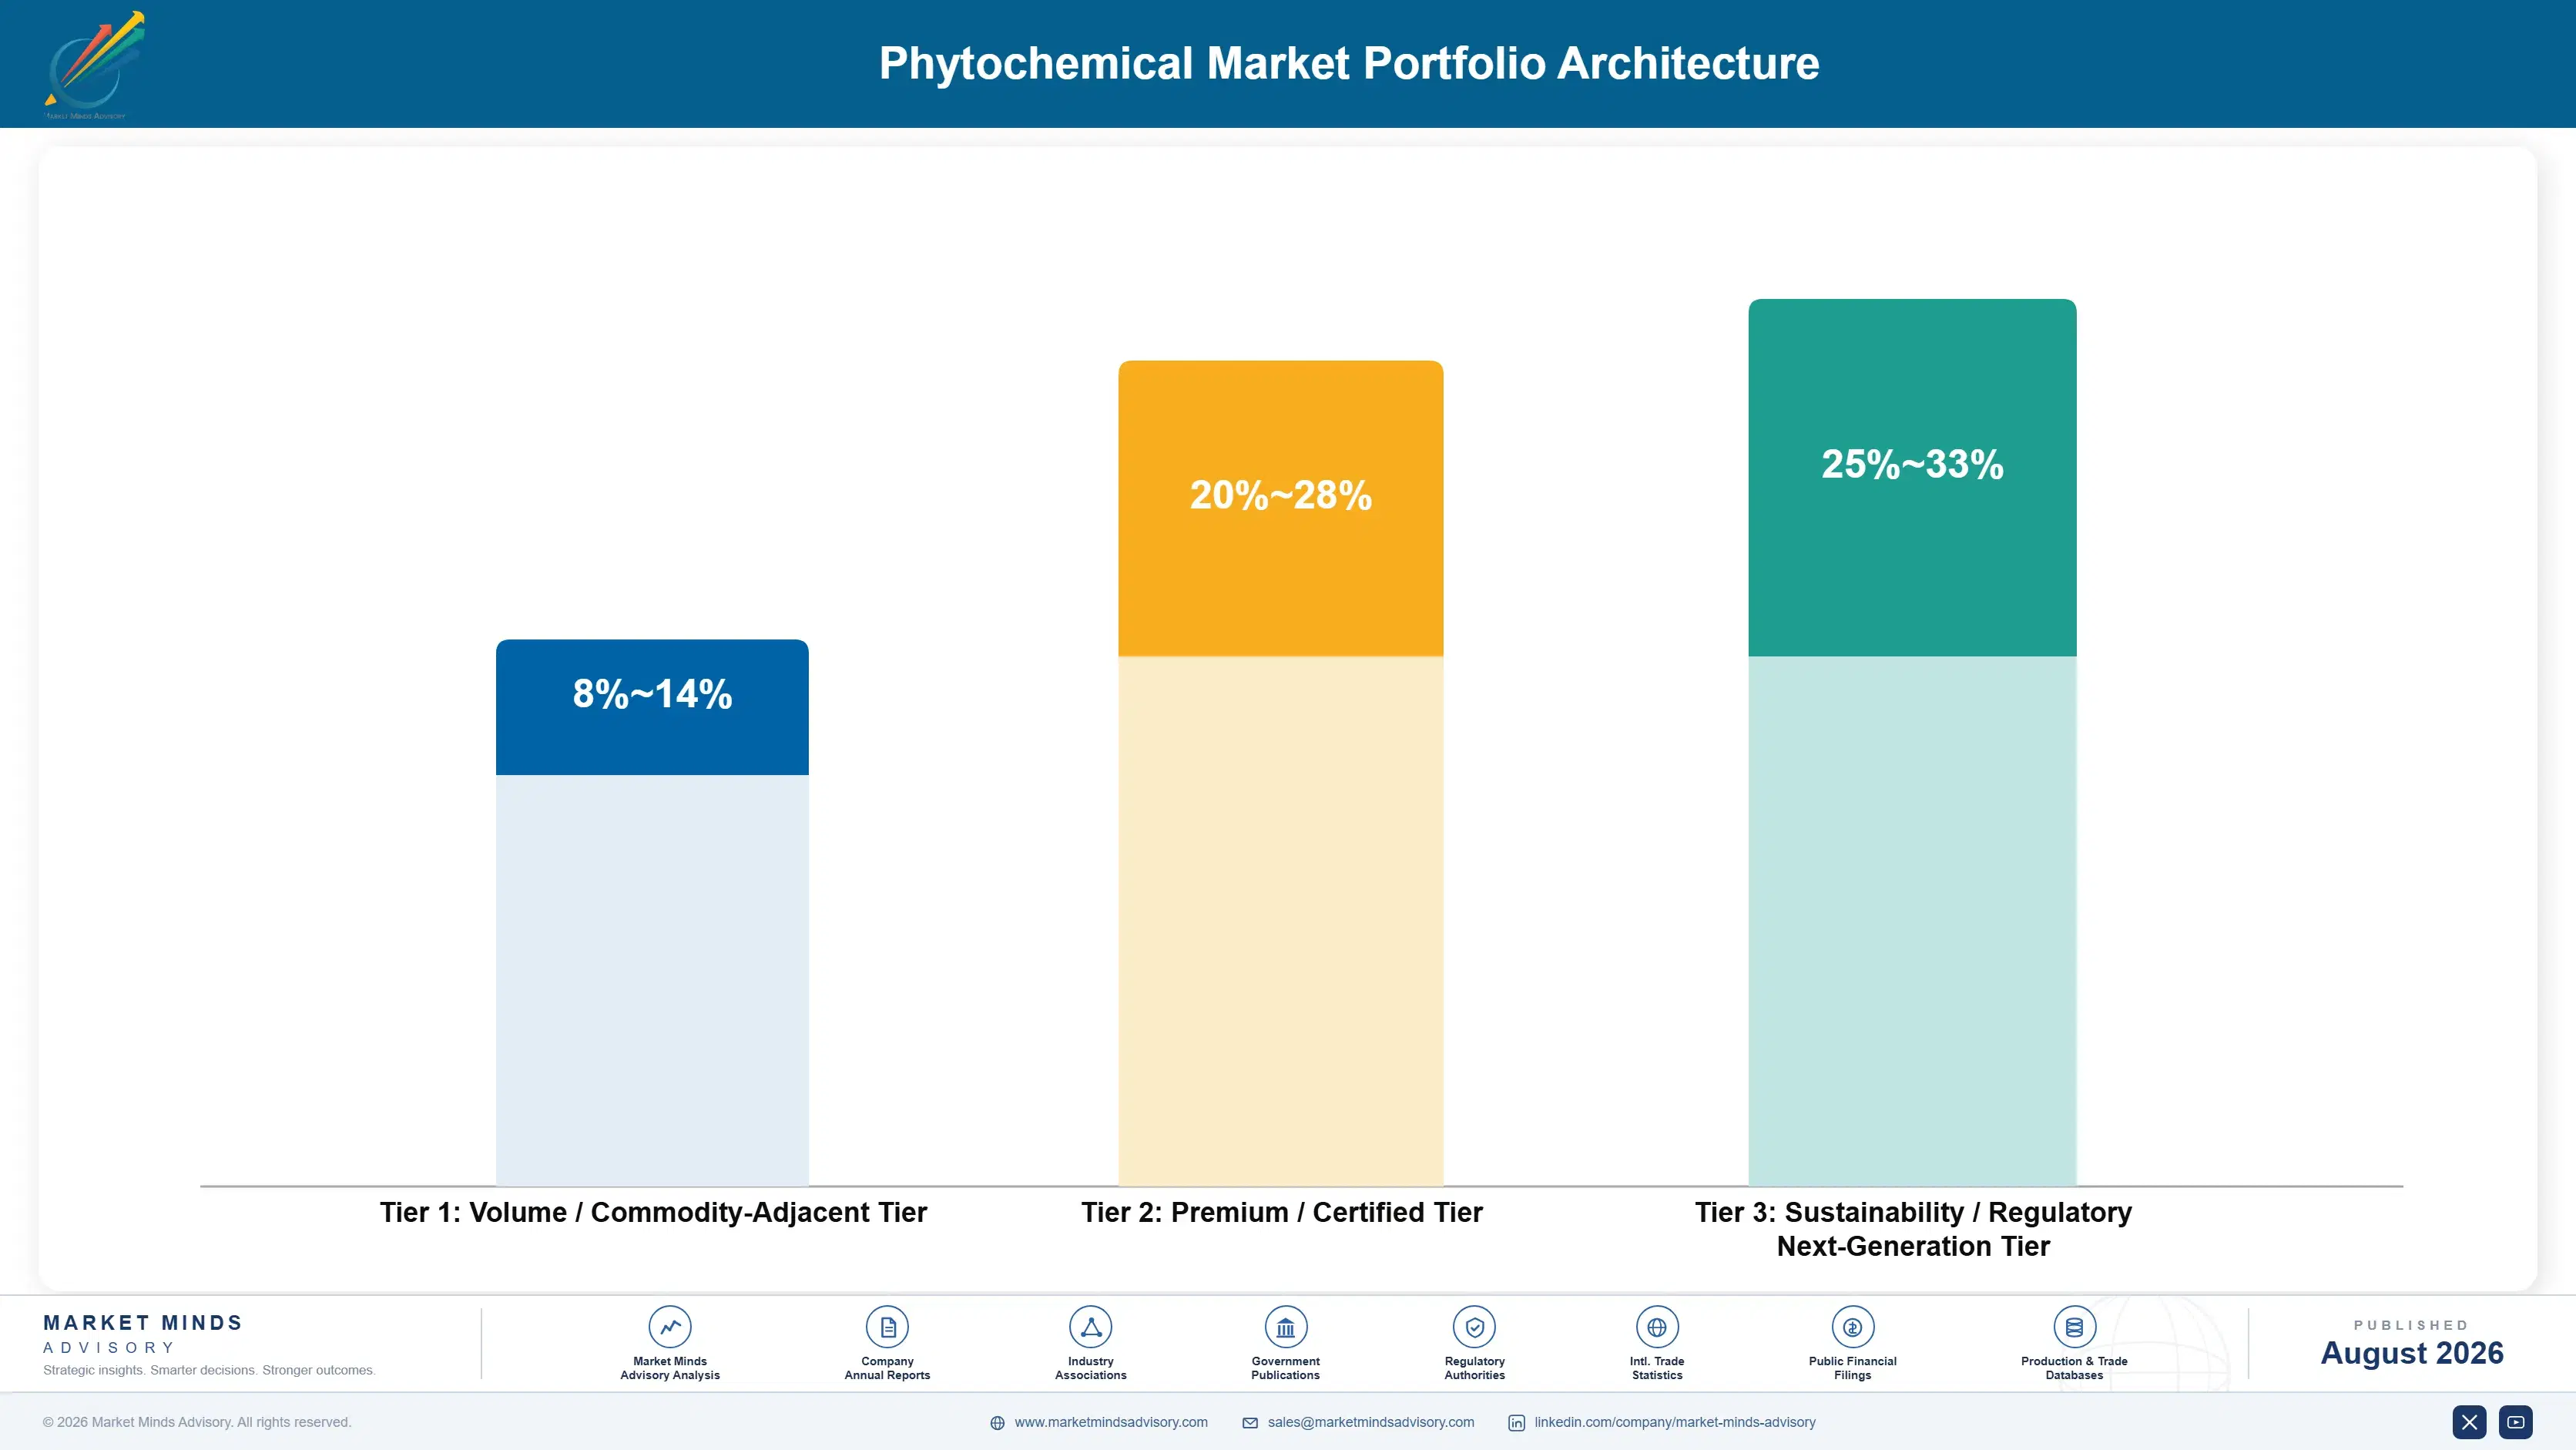
The portfolio splits into three tiers running on distinct economics: a volume tier built on standard generic botanical extracts sold near cost parity across competing manufacturers, a premium tier of documented flavonoid and carotenoid formulations carrying meaningfully higher margin, and an emerging next-generation tier built on terpenoid and glucosinolate formulations that commands a technology premium beyond pure purity differentiation alone. Suppliers rarely operate across all three tiers with equal strength, and portfolio strategy increasingly determines where profitability concentrates.
The tension between volume and premium is not simply about margin, since commodity buyers purchasing generic extract for cost-sensitive channels are extremely price-sensitive and switch suppliers readily at reorder time, while premium and compound-specific buyers are paying for genuine purity and documentation differentiation and tolerate meaningfully less price sensitivity as long as the compliance benefit holds up against realistic alternatives.

High-value margin pools concentrate in terpenoid and glucosinolate formulations, both of which combine technical differentiation with regulatory and functional tailwinds that commodity generic extracts simply cannot generate, giving suppliers positioned in either pool meaningfully more pricing power than the broader market average would otherwise suggest. Portfolio breadth increasingly determines formulation program win rates.

Volume / Commodity-Adjacent Tier

Standard generic botanical extracts for cost-sensitive commodity procurement, priced to compete directly against other volume manufacturers on cost and delivery reliability. This tier remains a substantial share of unit volume even as its category revenue share continues to shrink.
Gross Margin: 8-14%

Premium / Certified Tier

Documented flavonoid and carotenoid formulations meeting formulator purity and performance standards, sold into premium food and cosmetic programs at a meaningful margin premium. Suppliers in this tier increasingly compete on documented clinical performance data.
Gross Margin: 20-28%

Sustainability / Regulatory / Next-Generation Tier

Terpenoid and glucosinolate formulations combining precision isolation and validated bioactivity data, commanding a technology premium as manufacturers prioritize maximum compliance assurance across programs. Adoption remains limited today but is expected to expand.
Gross Margin: 25-33%
phytochemical-market-forecast-portfolio-architecture-1787335879777

High-value Sub-segments and Strategic Watch-out

Terpenoids and Essential Oil Derivatives

Combines the fastest growth rate in the market with premium technology pricing, making it the single most valuable pool for suppliers with isolation engineering capability built up over several years of dedicated investment. Few competitors currently possess this capability at scale, keeping margins durable for early movers.
Gross Margin: 27-33%

Glucosinolates and Sulfur Compounds

Growing steadily as production cost declines expand format viability, offering suppliers with stabilization engineering capability a durable margin premium over standard extract competitors facing steady share erosion. Formulators increasingly view this as a near-term differentiation priority worth pursuing across programs. Reference formulations accumulate quickly once proven.
Gross Margin: 20-28%

Standard Flavonoid and Phenolic Extracts

The steady volume core of the market, growing roughly in line with overall food manufacturing expansion and offering predictable but noticeably thinner margin than either the terpenoid or glucosinolate tiers discussed above. Suppliers compete mainly on cost and delivery reliability. Suppliers compete mainly on cost and delivery reliability.
Gross Margin: 8-14%

Legacy Undocumented Generic Extracts

A strategic watch-out segment facing steady decline as tightening claim substantiation requirements and rising specificity awareness phase out undocumented generic extracts in favor of compound-specific alternatives even in the most cost-sensitive formulation channels globally. Manufacturers dependent on this legacy segment should expect continued margin pressure.
Gross Margin: 4-10%

From First Formulation to Renewal Cycle

Formulation supply contracts behave closer to annuities than one-off transactional sales once a supplier wins a food, cosmetic, or pharmaceutical manufacturer's preferred formulation slot, since requalifying an alternative ingredient source mid-program disrupts recipe consistency and clinical validation work that manufacturers are reluctant to repeat within a single formulation cycle. Renewal cycles for these formulation contracts typically span two to five years, reinforcing the annuity-like revenue pattern suppliers with strong incumbent positions enjoy.
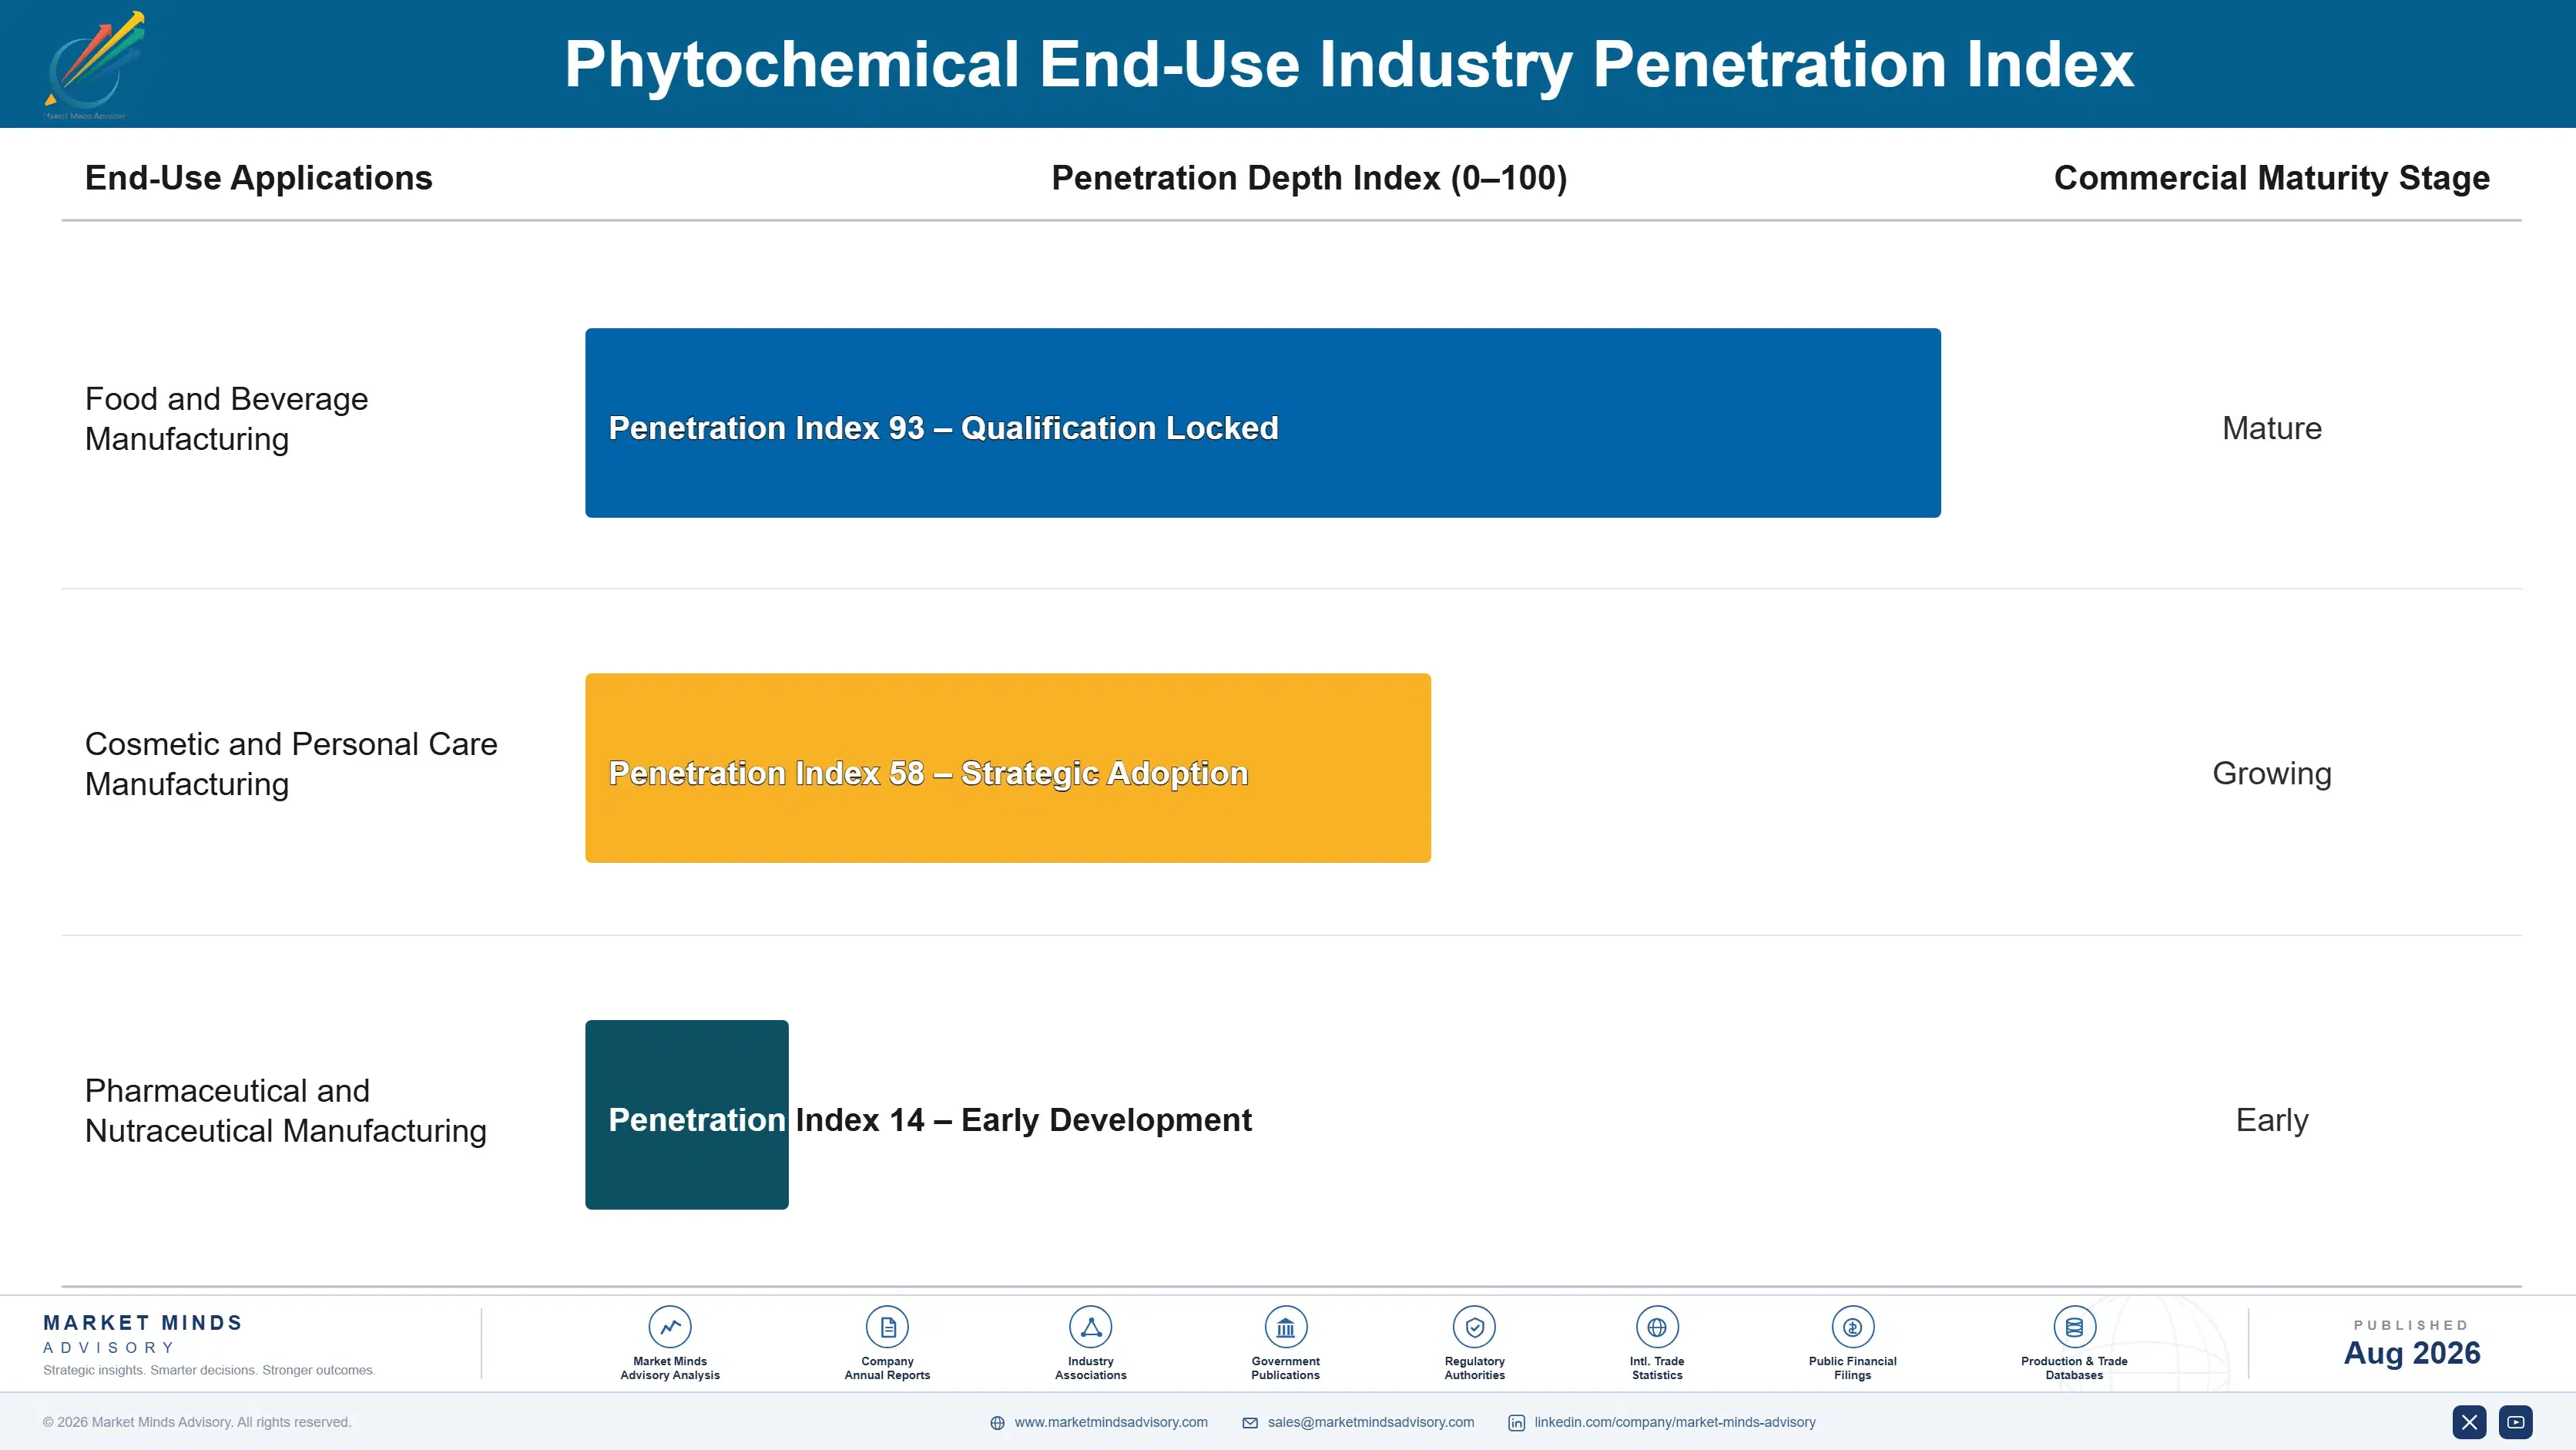
Adoption depth varies sharply by end-use vertical: nutraceutical and pharmaceutical formulators have pushed compound-specific isolates deep into standard specification, while commodity food fortification producers in cost-sensitive markets still rely largely on standard generic extracts with minimal upgrade sophistication. Regional food and cosmetic manufacturers in emerging markets are beginning to close this gap as reformulation accelerates and regulatory pressure spreads.

A generational shift is underway in formulator procurement priorities as younger food scientists increasingly specify ingredients based on documented compound specificity and clinical performance data rather than upfront price alone, a change that favors suppliers who can demonstrate validated performance data over those competing purely on unit cost. Suppliers who invest in transparent documentation reporting are positioned to capture this shift first.
phytochemical-market-forecast-end-use-penetration-index-1787335880265

Compound Isolation Decides the Decade

These are among the four positions where our research anticipates prominent divergence between winners and laggards over the coming forecast period. Each is grounded in the demand model, the regulatory perimeter, and the announced capacity pipeline.
01 / COMPOUND ISOLATION FOCUS

Build isolation documentation capability now

Isolate-grade formulations carry two to three times the pricing of legacy generic extracts and require compound isolation and testing engineering only a subset of suppliers currently possess at pharmaceutical reliability standards. Suppliers without this capability are increasingly excluded from both premium formulation contracts and regulatory-driven conversion programs as clean-label pressure continues intensifying across most major food markets. Suppliers should direct capital toward isolation engineering rather than expanding legacy generic capacity, since that path offers shrinking differentiation against faster-moving competitors already scaling aggressively across most major markets today.
02 / TERPENOID STABILIZATION STRATEGY

Develop terpenoid stabilization now

Terpenoid demand is expanding beyond aromatherapy into mainstream pharmaceutical and cosmetic formulation as extraction cost declines, and suppliers without stabilization and formulation compatibility capability are increasingly excluded from these design wins as manufacturers standardize the format. Early movers building this capability are securing multi-year supply contracts that standard extract competitors cannot bid on. Building or acquiring terpenoid stabilization engineering capability now positions suppliers ahead of a format expansion trend that shows no sign of reversing across major markets through the current decade and the next planning cycle beyond it.
03 / GEOGRAPHIC POSITIONING STRATEGY

Expand extraction capacity in South Asia now

South Asia and Pacific combines the fastest regional growth with substantial remaining formulation expansion headroom, giving suppliers with capacity there durable volume other mature regions increasingly cannot match. This is a materially different calculus than a decade ago when mature-market replacement volume alone justified most capacity investment decisions industry-wide across the category. Suppliers still concentrated in legacy mature-market locations should carefully evaluate South Asian capacity additions as a near-term priority rather than treating it as a longer-term option to revisit later.
04 / MATERIAL COST RISK MANAGEMENT

Secure long-term biomass agreements now

Botanical biomass costs, tied closely to broader agricultural commodity markets, remain the largest source of margin volatility across the standard extraction segment specifically, and suppliers without long-term supply agreements carry a lasting cost disadvantage relative to vertically integrated competitors with direct feedstock access. The 2023 to 2024 biomass price increase demonstrated how quickly this exposure can compress margins for unhedged manufacturers operating on thin working capital. Suppliers should prioritize locking in multi-year agreements before the next material price disruption arrives unexpectedly.

Engagement Snapshot From the Field

A live engagement with an industry participant carrying material or product regulatory and market exposure ahead of a defining policy shift, showing how our research translates into a defensible multi-year portfolio strategy.
MARKET MINDS ADVISORY · CLIENT ENGAGEMENT SUMMARY
Phytochemical Producer Strategic Portfolio Review and Transition Roadmap 2026·Investment Scenario on Phytochemical Exposure Evaluation 2025-26
CLIENT PROFILE
The client was a regional Eastern European specialty ingredient manufacturer with roughly $33 million in annual revenue (client-reported, unverified by MMA), supplying primarily standard generic botanical extracts to established food formulation contracts, seeking to build terpenoid capability ahead of expanding Western European demand. The client had no prior isolation engineering experience internally, and its product line had not changed meaningfully in several years.
STRATEGIC CHALLENGE
The client's standard extract business faced flat growth as Western European cosmetic manufacturers increasingly specified terpenoid capability the client could not deliver, while competitors with proven isolation technology had already begun winning formulation contracts the client lacked engineering capability to bid on. Leadership set a two-year window to build credible capability before losing further market position.
MMA APPROACH
MMA conducted a competitive formulation capability assessment against terpenoid engineering leaders, modeled the capital investment case for stabilization engineering against projected Western European contract volume, and benchmarked formulator relationship strategy to identify a realistic path forward for the client, including interviews with three prospective cosmetic manufacturer customers to validate demand assumptions.
KEY FINDINGS
  1. Terpenoid formulation contracts carried roughly 2.0 times the margin of the client's existing standard extract portfolio, based on comparable disclosed program economics across peers.
  2. Isolation engineering investment payback fell within three formulation program cycles given the client's existing manufacturer relationships and production footprint already established prior to the engagement's start.
  3. The client's existing extraction expertise transferred meaningfully to terpenoid-specific platforms, reducing the engineering investment required relative to starting from scratch entirely on its own.
  4. A technology licensing partnership could accelerate terpenoid capability faster than fully independent in-house engineering development by roughly one full formulation program cycle.
CLIENT PROFILE
The client was a regional Eastern European specialty ingredient manufacturer with roughly $33 million in annual revenue (client-reported, unverified by MMA), supplying primarily standard generic botanical extracts to established food formulation contracts, seeking to build terpenoid capability ahead of expanding Western European demand. The client had no prior isolation engineering experience internally, and its product line had not changed meaningfully in several years.
STRATEGIC CHALLENGE
The client's standard extract business faced flat growth as Western European cosmetic manufacturers increasingly specified terpenoid capability the client could not deliver, while competitors with proven isolation technology had already begun winning formulation contracts the client lacked engineering capability to bid on. Leadership set a two-year window to build credible capability before losing further market position.
MMA APPROACH
MMA conducted a competitive formulation capability assessment against terpenoid engineering leaders, modeled the capital investment case for stabilization engineering against projected Western European contract volume, and benchmarked formulator relationship strategy to identify a realistic path forward for the client, including interviews with three prospective cosmetic manufacturer customers to validate demand assumptions.
KEY FINDINGS
  1. Terpenoid formulation contracts carried roughly 2.0 times the margin of the client's existing standard extract portfolio, based on comparable disclosed program economics across peers.
  2. Isolation engineering investment payback fell within three formulation program cycles given the client's existing manufacturer relationships and production footprint already established prior to the engagement's start.
  3. The client's existing extraction expertise transferred meaningfully to terpenoid-specific platforms, reducing the engineering investment required relative to starting from scratch entirely on its own.
  4. A technology licensing partnership could accelerate terpenoid capability faster than fully independent in-house engineering development by roughly one full formulation program cycle.
RECOMMENDED STRATEGY
Phase 1: Phase 1 (0-9 months): License core terpenoid stabilization technology from an established partner and begin pilot production validation testing across two initial product lines. Phase 2: Phase 2 (9-24 months): Bid competitively for formulation contracts across two upcoming Western European cosmetic manufacturer opportunities identified during Phase 1. Phase 3: Phase 3 (24-42 months): Build independent engineering capability internally to reduce long-term dependence on the original technology licensing partner going forward.
OUTCOME
The client won formulation contracts with one of two targeted Western European manufacturers within eighteen months of the licensing partnership launch, adding an estimated $6 million in annual contracted revenue (client-reported, unverified by MMA) at materially higher margin than its legacy standard extract business had previously generated.

Frequently Asked Questions

Foundational context covering the market sizes, CAGR, scope, country, region and competition that inform every finding below. This section is provided to cover basics and most often pre-purchase conversations, answered from the MMA Primary Research Dataset.

What is the current size of the Phytochemical Market?

The global phytochemical market is valued at approximately $6.8 billion in 2025, spanning flavonoid, carotenoid, alkaloid, phenolic, terpenoid, and glucosinolate configurations sold across major formulation channels worldwide.

How large will the Phytochemical Market be by 2036?

The market is projected to reach approximately $17.2 billion by 2036, driven primarily by compound-specific isolation adoption and expanding clean-label demand across both mainstream and specialty formulation channels.

What is the CAGR for the Phytochemical Market 2026 to 2036?

The market is projected to grow at a compound annual rate of 8.8 percent between 2026 and 2036, with terpenoids and essential oil derivatives growing fastest within that total.

Which segment is growing fastest?

Terpenoids and essential oil derivatives are growing fastest at 12.5 percent annually, roughly 1.42 times the overall market rate, driven by cosmetic and pharmaceutical demand and expanding purity documentation adoption.

Who are the major companies in the Phytochemical Market?

Naturex, Sensient, Indena, Kemin, and Givaudan lead the market by disclosed production volume, alongside fifteen other significant global manufacturers serving major formulation channels. serving both food and cosmetic formulation channels.

Which country is growing fastest?

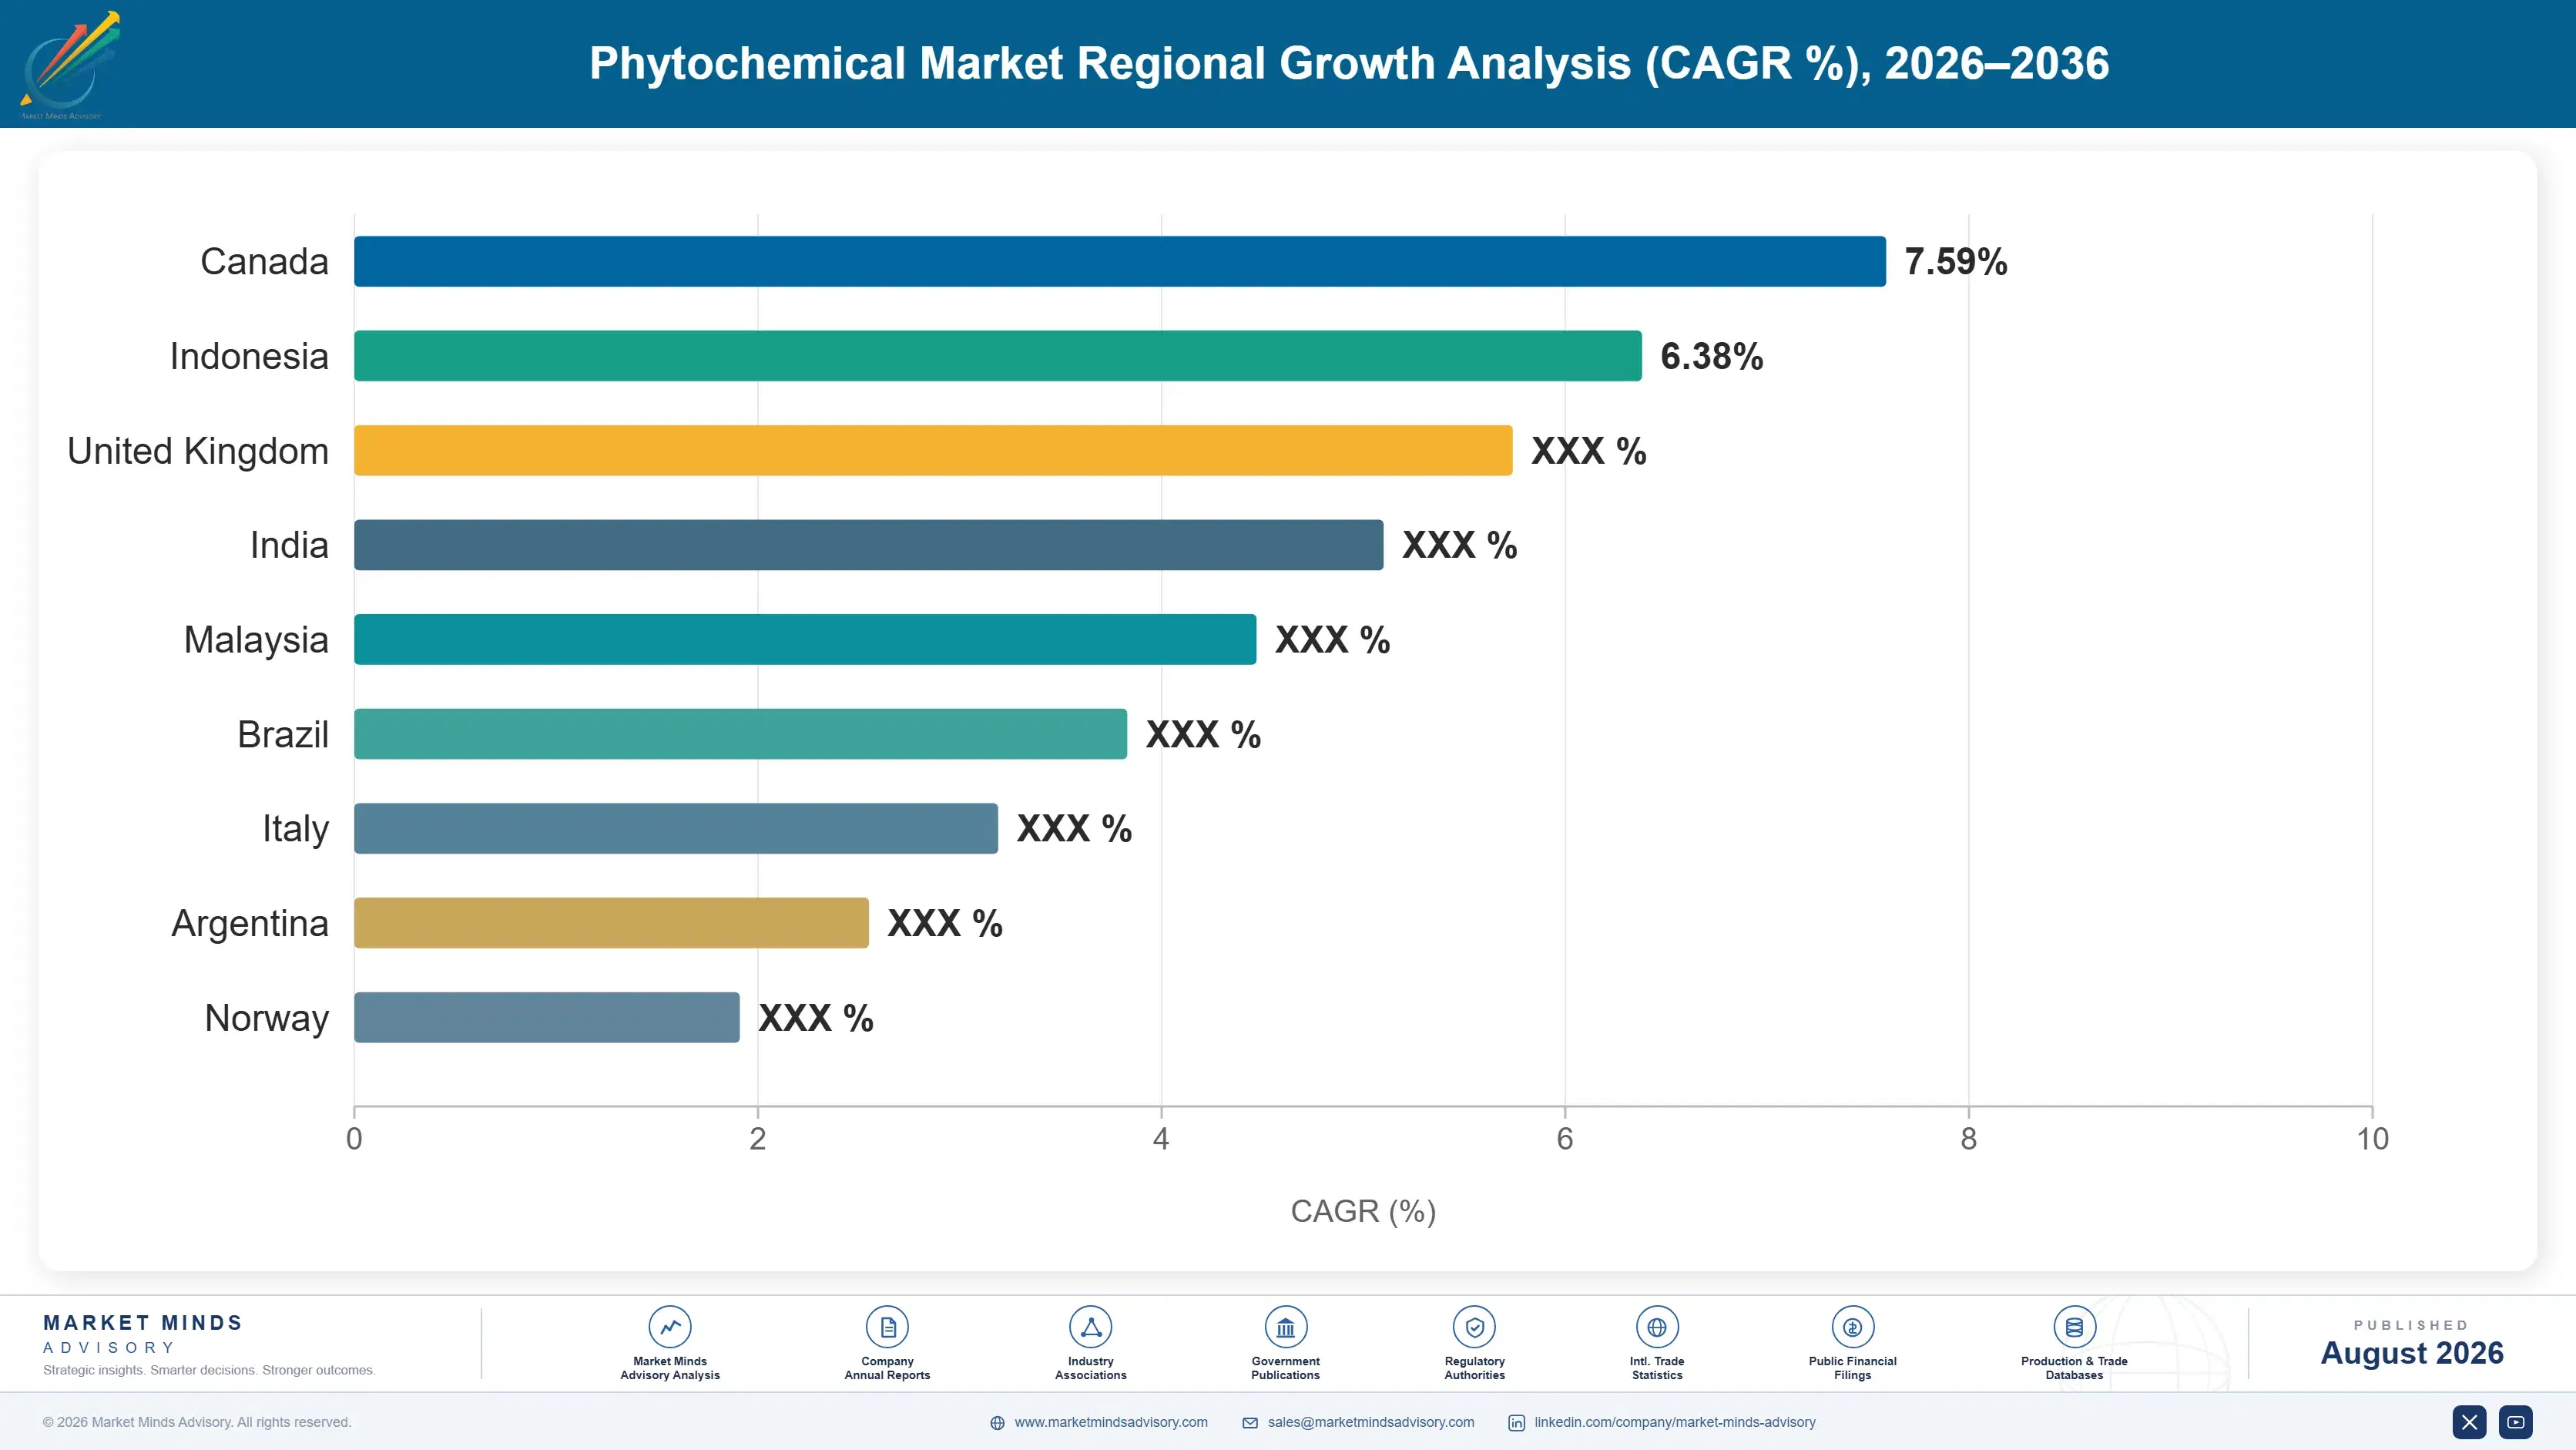
China is growing fastest among major markets at 11.0 percent annually, supported by strong botanical extraction growth and rapidly expanding domestic nutraceutical adoption serving both domestic and export demand.

Report Segmentation Architecture

The full report scope spans multiple orthogonal segmentation dimensions, with cross-tabulated demand data provided for each dimension pair. Coverage extends further to regional breakdowns, trend trajectories, and the competitive detail needed to support segment-level decision-making.

By Compound Class

  • Flavonoids
  • Carotenoids
  • Alkaloids
  • Phenolic Acids and Polyphenols
  • Terpenoids and Essential Oil Derivatives
  • Glucosinolates and Sulfur Compounds

By End-Use Industry

  • Food and Beverage Manufacturing
  • Cosmetic and Personal Care Manufacturing
  • Pharmaceutical and Nutraceutical Manufacturing

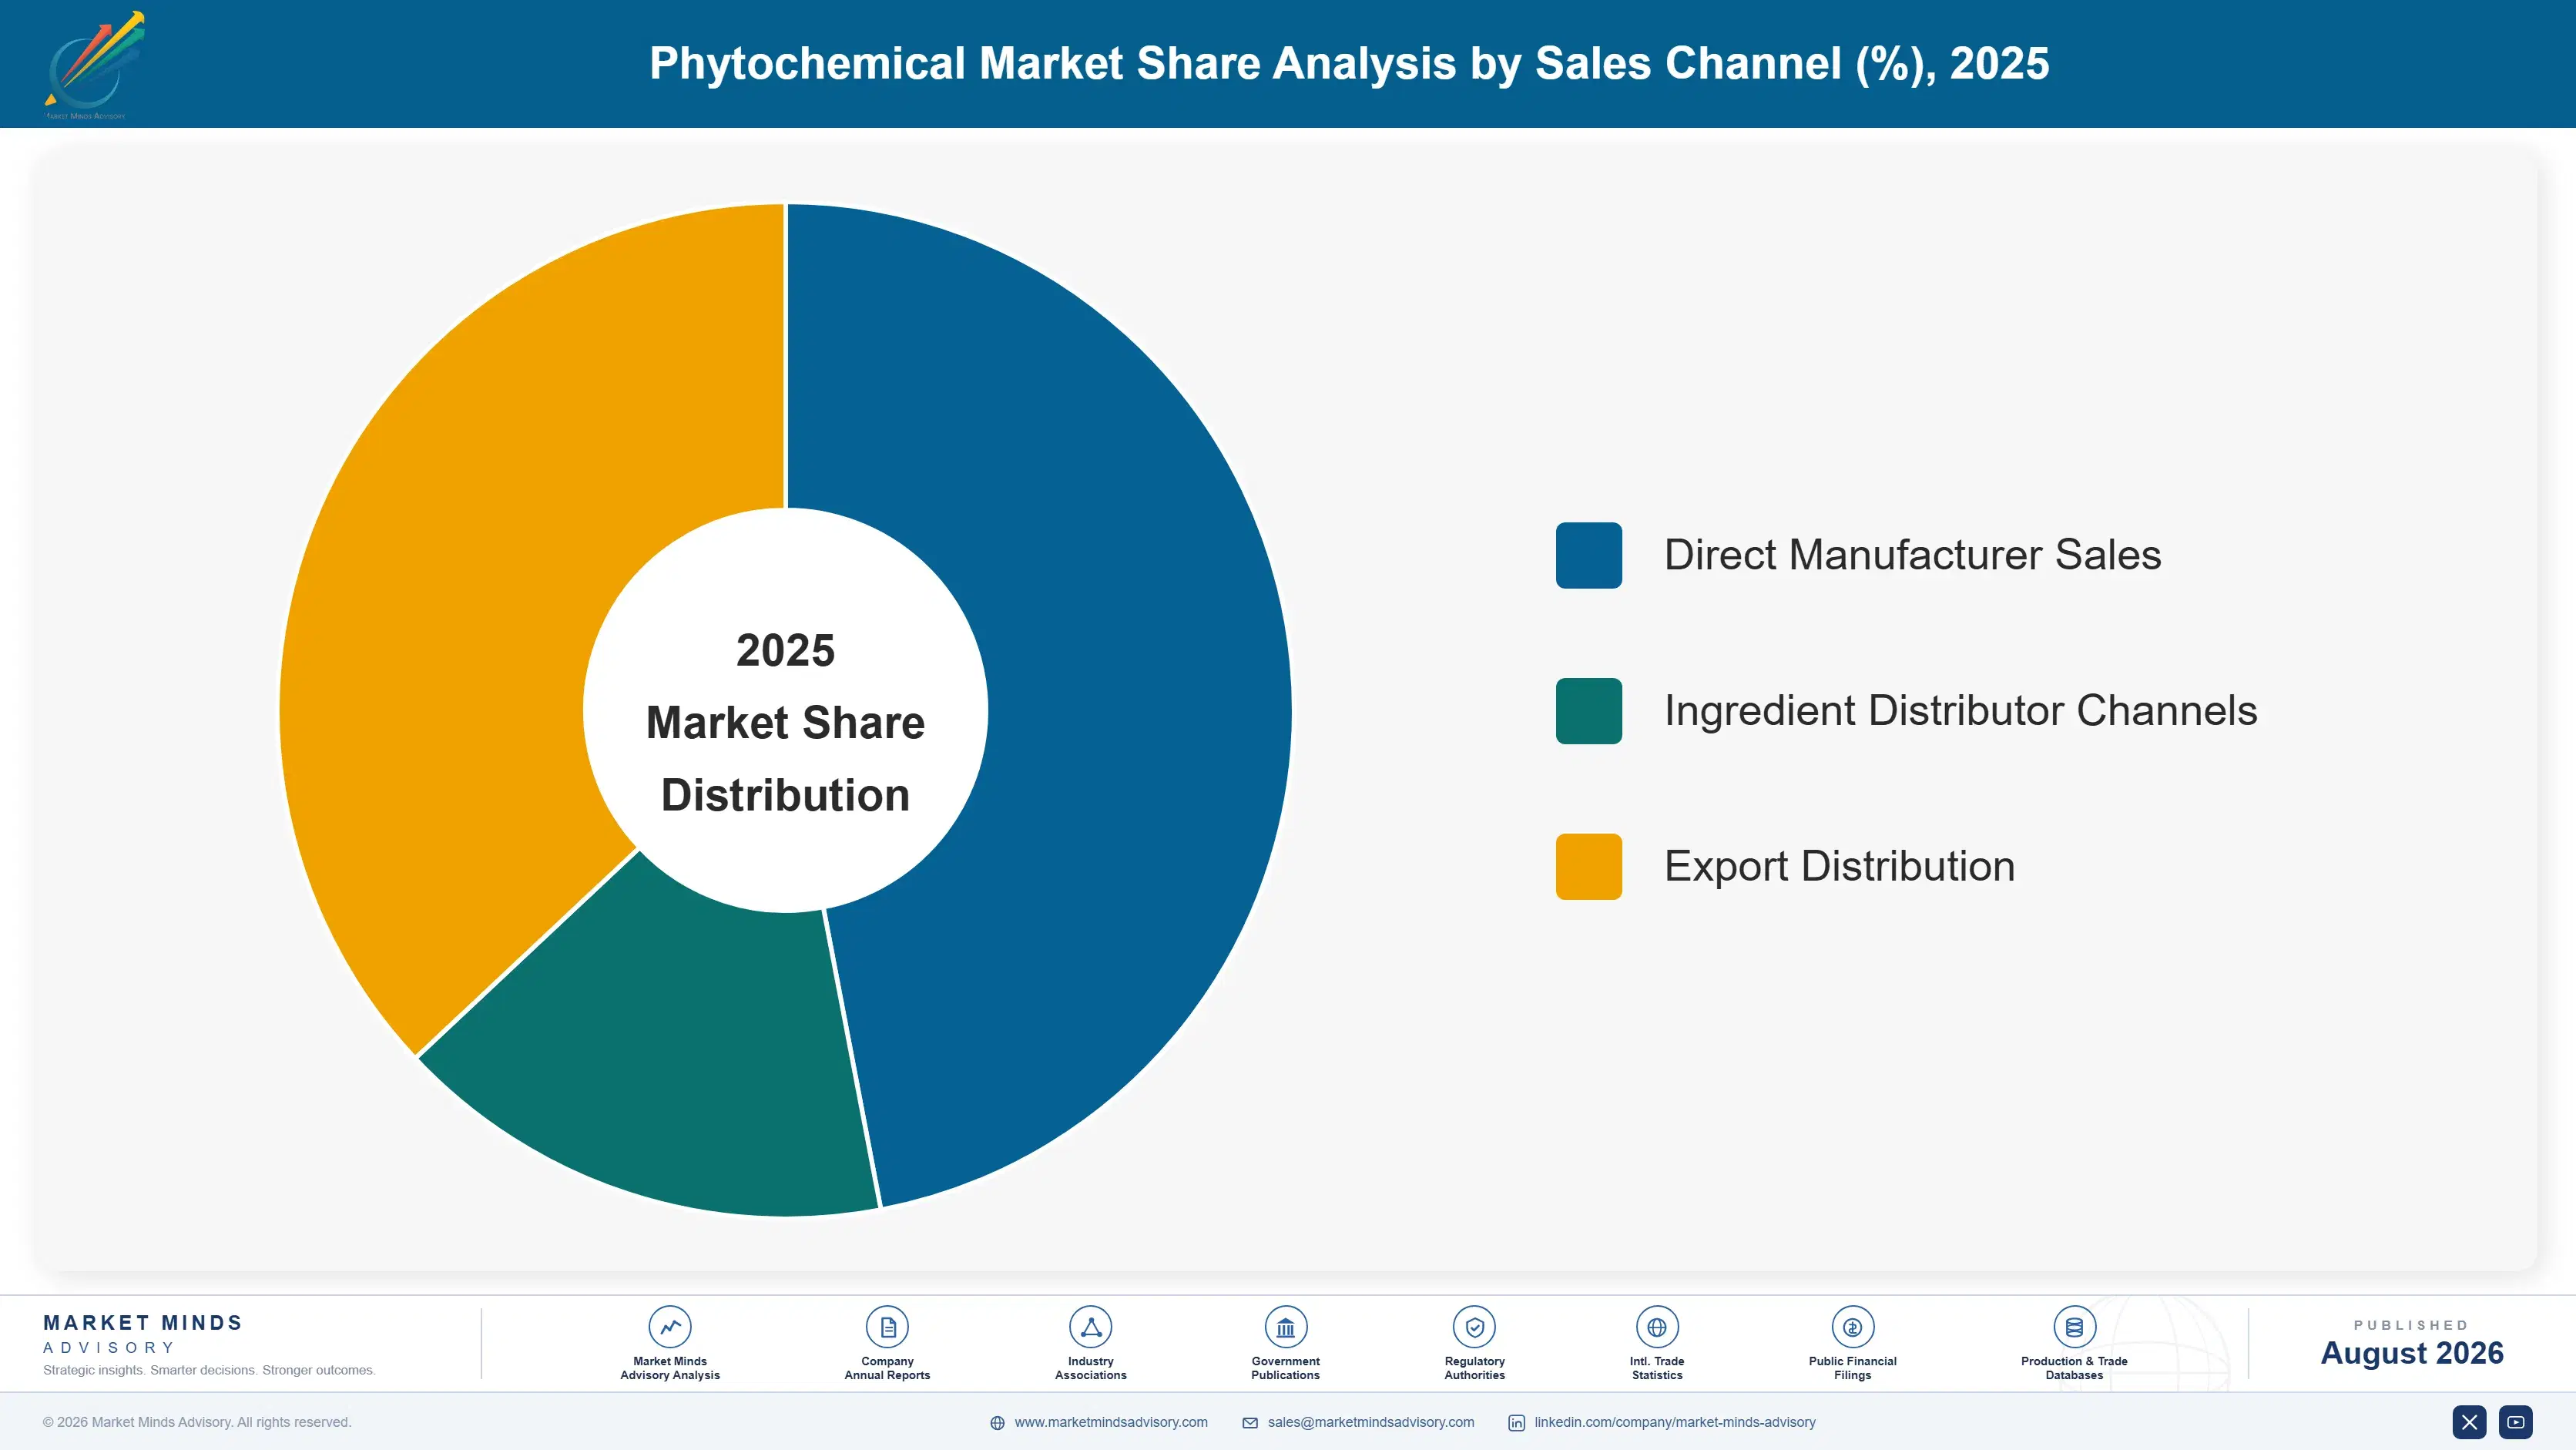
By Sales Channel

  • Direct Manufacturer Sales
  • Ingredient Distributor Channels
  • Export Distribution

By Region

  • North America
  • Western Europe
  • East Asia
  • South Asia and Pacific
  • Latin America
  • Middle East and Africa
  • Eastern Europe

Scope, Methodology, and Coverage

Every figure in this report is reproducible from documented input assumptions. The scope below maps the historical period, the forecast horizon, the segmentation dimensions, and the countries covered, alongside the underlying primary and qualitative methodology.
Historical Period
2020 to 2025
Forecast Period
2026 to 2036
Base Year
2025 (USD billions; MMA Primary Research Dataset, August 2026)
Market Definition
This report covers flavonoids, carotenoids, alkaloids, phenolic acids and polyphenols, terpenoids and essential oil derivatives, and glucosinolates and sulfur compounds sold to food, cosmetic, nutraceutical, and pharmaceutical manufacturers. It excludes whole-herb botanical products sold without compound isolation, synthetic nature-identical compounds, and standalone essential oils sold as fragrance products rather than functional ingredients.
Quantitative Units
USD billions (current prices); metric tons shipped where applicable
Segmentation Dimensions
By Compound Class; By End-Use Industry; By Sales Channel; By Region
Regions Covered
North America, Western Europe, East Asia, South Asia and Pacific, Latin America, Middle East and Africa, Eastern Europe
Countries Covered
USA, China, Germany, France, UK, Japan, South Korea, India, Australia, Canada, Brazil, Mexico, Indonesia, Vietnam, Italy, UAE, Saudi Arabia, South Africa, Nigeria, Turkey, Poland, Hungary, Romania, Bulgaria, Spain, Argentina, Colombia, Singapore, and additional markets relevant to this sector
Key Companies Profiled
Naturex SA, Sensient Technologies Corporation, Indena SpA, Kemin Industries, Givaudan SA, Martin Bauer Group, DSM-Firmenich, Sabinsa Corporation, Layn Natural Ingredients, Symrise AG, International Flavors and Fragrances Inc, Naturamins Nutraceuticals, Euromed SA, Novonesis, Xi'an Sost Biotech Co Ltd, Nexira, Frutarom Industries, Plamed Green Science Group, HerbaKraft, Ransom Naturals Ltd
Quantitative Methodology
Primary survey, n=3,800 respondents, Q4 2025, six countries; demand-side model with trade association cross-validation
Qualitative Methodology
47 expert interviews, Q4 2025; applied to validate demand model assumptions, identify emerging dynamics, and assess competitive positioning
Report Format
PDF and XLSX data workbook (Word format preview document)
Publisher
Market Minds Advisory
Report Code
MMA-2026-AGR-408
Published
August 2026
Contact
sales@marketmindsadvisory.com | www.marketmindsadvisory.com

Purchase the full Phytochemical Market Report (2026 to 2036).

The full Phytochemical Market report delivers a complete quantitative and qualitative assessment across all six compound class segments, seven regions, and twenty profiled companies operating in this space. It includes detailed sizing and forecast models through 2036, competitive benchmarking on production volume, and a full regulatory tracker covering claim substantiation timelines by jurisdiction. Buyers receive segment-level and country-level data tables supporting the full analysis presented throughout this report. Access includes ongoing analyst support for the duration of the license period. Subscribers also receive quarterly briefing calls covering major regulatory developments.
Segment-level sizing across six compound class categories
Country-level forecast data for thirty markets
Competitive benchmarking on production volume basis
Regulatory tracker for claim substantiation timelines
Purity documentation analysis by compound class
Twenty-company competitive profile database, updated quarterly

Built For The People Who Decide

From boardroom strategy to bench-side execution, this report is read cover-to-cover by leaders shaping the next decade of their industry, turning demand scenarios, market dynamics and valuation benchmarks into decisions.
CXOs/ Presidents/ VPs/ Managers
M&A and Corporate Development
Strategy Teams and R&D Heads
Procurement and Product Directors
Regulatory and Compliance Leaders
Investor Relations and Equity Analysts