Market Minds Advisory
Physical Security Information Management (PSIM) Market

Physical Security Information Management (PSIM) Market: Physical Security Information Management Market: Integration Cost, Operator Workload and Procurement Reality 2026 to 2036

This software exists because a large site runs eleven security systems that will not talk to each other. Whether it is worth buying depends on how many a vendor can actually connect.

Lead Analyst

Published

September 2026

Make Smarter Decisions with Customized Research Insights

Request a free sample report and evaluate market opportunities, growth trends, and competitive dynamics relevant to your business needs.

2025 MARKET VALUE$2.2BMarket Size 2025
2036 FORECAST VALUE$5.8BBase Case , 2026 to 2036
CAGR 2026 TO 20369.3 %Bull 10.5% / Bear 8.1%
INCREMENTAL OPPORTUNITY$3.4BNet 10- year value creation
EXPANSION MULTIPLE2.42x2036 value over 2026 base
Strategic Levers
M&A Pipeline
Regional Outlook
Country Rankings
Competitive Intelligence
Segmental Deep-dive
Call-Us : 91 93563 13602

Executive Snapshot and Market Trajectory.

This category exists for one reason: a large site typically runs eleven separate security systems that were never designed to talk to each other. Whether the software is worth buying comes down entirely to how many of those eleven a given vendor can genuinely connect and then keep connected.
The market reaches USD 2.4 billion in 2026 and USD 5.8 billion by 2036, a 2.42 times expansion at 9.3% annually. Critical infrastructure command and control platforms grow at 14.0%, half again the market rate of 9.3%, because regulation now requires documented incident response that manual procedures cannot evidence. Middle East and Africa holds 16% of global spending, far above the usual band ceiling, and Saudi Arabia compounds fastest of any market at 15.2%.
Five vendors hold just 31% of licence and subscription revenue, which is unusually low for enterprise software, because most deployments are delivered by systems integrators who influence the selection very heavily. Genetec, Milestone Systems, Everbridge, Vidsys and Advancis Software lead the field. Integration library depth rather than user interface design is what actually decides the great majority of competitive evaluations in this category.
Market Definition
This report covers physical security information management software by platform class: critical infrastructure command and control platforms, enterprise multi-site security management, integration and middleware layers connecting subsystems, incident workflow and response automation, situational awareness and mapping interfaces, and compliance reporting and audit modules. It excludes video management systems sold standalone, access control hardware and its native software, intrusion detection panels, cybersecurity and information security tooling, and guard force scheduling or workforce management applications.
Base Year Value
$2.2B in 2025 (MMA Primary Research Dataset, September 2026)
Forecast Period
2026 to 2036, eleven discrete annual values
CAGR
9.3% base case. Bull 10.5%. Bear 8.1%.
Fastest Growth Segment
Critical Infrastructure Command And Control Platforms: 14.0% CAGR
Fastest Growth Country
Saudi Arabia: 15.2% CAGR
Fastest Growth Region
South Asia and Pacific: 11.4% CAGR
Largest Region
North America: 29% of 2025 global value
Market Leaders
Genetec, Milestone Systems, Everbridge, Vidsys and Advancis Software lead on physical security information management licence and subscription revenue. Source: MMA Analysis.
Primary Survey
n=3,800 procurement and R&D decision-makers, Q4 2025, six countries
Methodology
Demand-side build-up, cross-validated against public data, 47 expert interviews

Physical Security Information Management (PSIM) Market Forecast Scenarios

physical-security-information-management-psim-mark-size-forecast-scenario-1788644631258
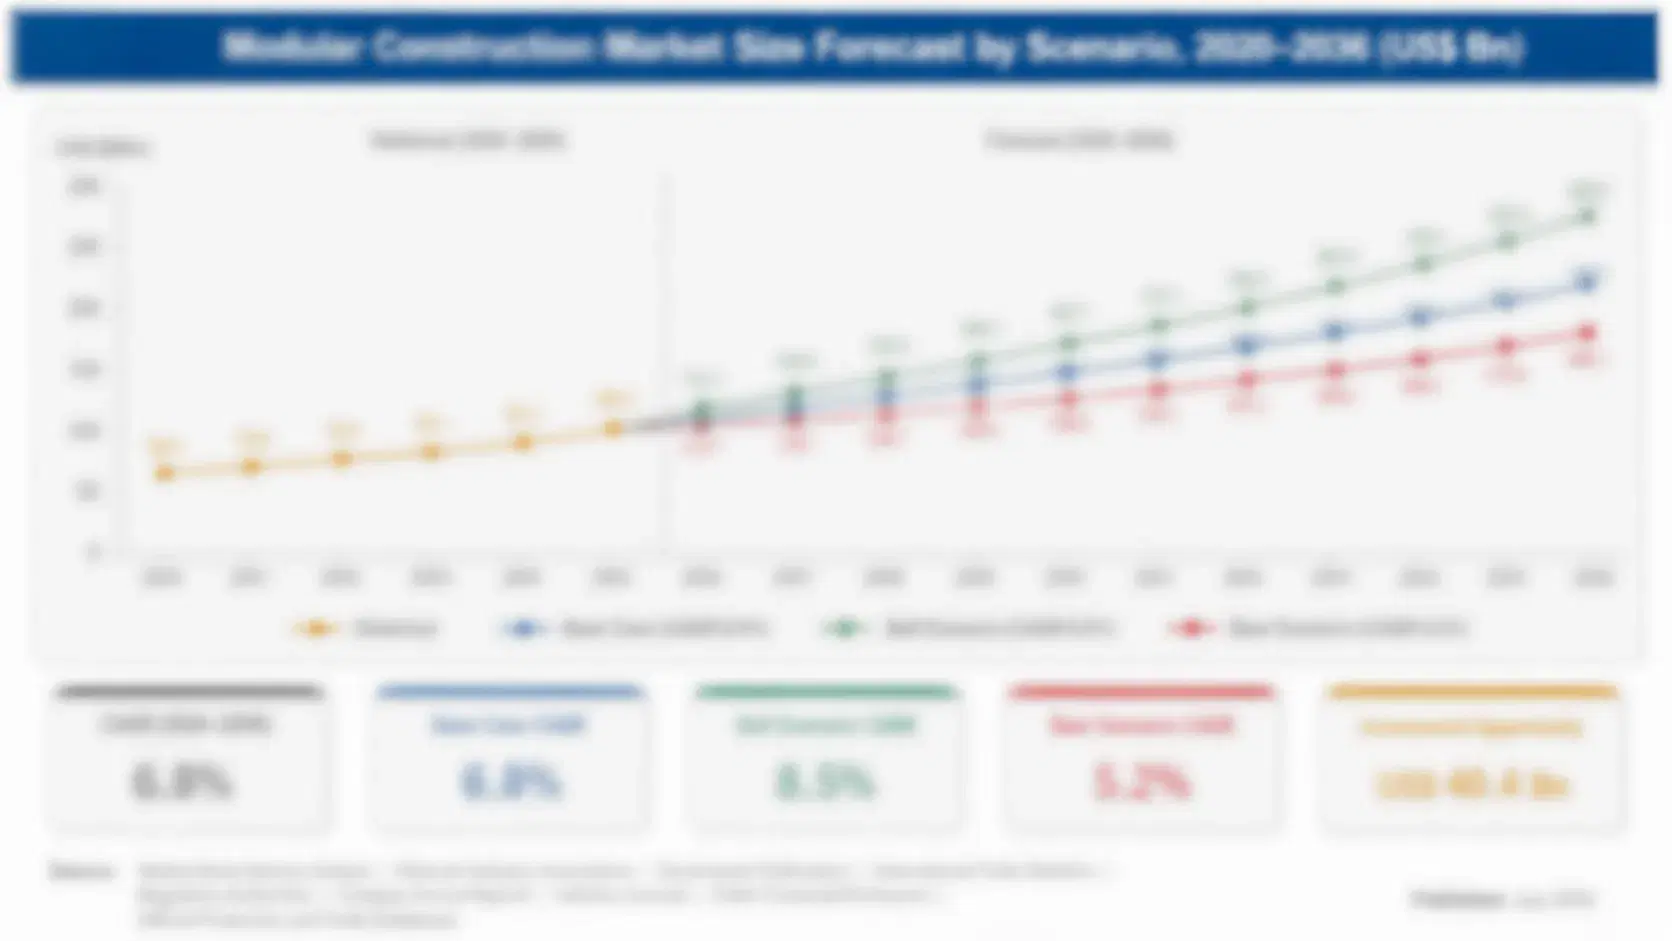
Between 2020 and 2025 the category compounded at 8.1%, which is modest against the ambition vendors carried into the period. The promise was a single pane of glass across every security system on a site, and integration cost kept getting in the way. Deployments that connected four subsystems delivered value; those attempting all eleven frequently stalled halfway through and left the customer with a partial system and a large invoice.
The base case holds 9.3% on three mechanisms. Critical infrastructure regulation now requires documented incident detection and response that manual procedures simply cannot evidence to an auditor. Gulf and Asian construction keeps adding large sites that specify integrated security during design rather than retrofitting it. And ageing deployments installed a decade ago are now reaching the point where their integrations no longer match the subsystems sitting underneath them at all.
The bull case at 10.5% assumes regulatory reporting obligations widen across more infrastructure categories, converting a discretionary purchase into a compliance one. The bear case at 8.1% is subsystem consolidation: as video management and access control vendors extend their own platforms sideways, a site running fewer separate systems has considerably less need for anything sitting above them.

Eleven Systems, One Screen

The problem this software solves is genuine and unglamorous. A large industrial site, airport or campus accumulates security systems over years: video from three vendors, access control from another, intrusion, perimeter detection, radio, fire, and a mass notification platform bought after some incident. None of them talk to each other, and an operator watching eleven screens misses things that correlating across them would catch immediately.
TOP FIVE CONCENTRATION31%Low, because integrators rather than vendors influence most selections
SUBSYSTEMS PER LARGE SITE11 systemsSeparate security platforms typically running without native interconnection
INTEGRATION COST SHARE58%Connection and configuration work within total project spend
DEPLOYMENT DURATION16 monthsFrom contract signature to full operation across a site
ALARM HANDLING REDUCTION41%Fewer operator actions per incident after correlation is configured
INTEGRATION LIBRARY SIZE340 devicesSupported subsystem types across a mature vendor catalogue
The commercial difficulty is that connecting those systems accounts for roughly 58% of what the project costs, and every site's combination is slightly different. A vendor with a deep integration library covering around 340 device types can quote a shorter deployment than one that must write connectors. That library, rather than anything visible on screen, is what actually decides competitive evaluations, though it rarely features in how vendors market themselves.
Concentration sits at only 31% because systems integrators rather than software vendors control most selections. The integrator has already deployed one platform, knows its quirks and prices the project accordingly, so a vendor unfamiliar to that integrator loses before the customer has compared anything. Vendors selling directly to end users frequently find the integrator quietly steering the decision somewhere else entirely.
"Every vendor demonstration in this category shows the same map with the same coloured icons. Nobody buys the map. They buy whether you can connect the twenty year old access control system in building four, and most demonstrations never get anywhere near that question."
Director, Physical Security and Critical Infrastructure Practice · MMA Technology Practice · September 2026

Market Trends

Regulation Converts Discretionary Purchases Into Compliance Ones

Critical infrastructure operators across energy, water, transport and telecommunications now face requirements to detect, respond to and document security incidents in ways that manual procedures simply cannot evidence to an auditor after the fact. That moves the purchase out of operations and into compliance, which changes both the budget available and the urgency behind it. Critical infrastructure command and control platforms grow at 14.0% against 9.3% for the market as a whole. Vendors still selling operational efficiency are addressing a buyer who now holds a legal obligation with a date attached to it.
Market Impact: Saudi Arabia compounds at 15.2%
Integration Library Depth Decides Competitive Evaluations

Connection and configuration work accounts for roughly 58% of total project cost, and a vendor with a mature library covering around 340 device types quotes a considerably shorter deployment than one writing connectors from scratch. That library is built over years of deployments and cannot be assembled quickly by anybody arriving new. It is also almost invisible in how vendors market themselves, which is why demonstrations concentrate on interfaces while the actual decision turns on whether the twenty year old access control system in building four is supported at all.
Market Impact: Operator actions fall 41%

Market Opportunities and Growth Drivers

Gulf Construction Specifies Integration During Design

Large sites being built right across the Gulf and Asia now specify integrated security management during the design phase rather than retrofitting it once eleven separate subsystems are already installed and running. Saudi Arabia compounds at 15.2%, faster than any other market, on giga-project construction and on critical infrastructure programmes funded as national capability rather than commercial return. Designing the integration before the subsystems are chosen removes most of the 58% integration cost, because subsystem selection can then favour whatever connects cleanly rather than accommodating whichever equipment happened to be bought first.
Market Impact: Four systems replace 11 separately

Operator Workload Reduction Produces Measurable Return

Correlating events across connected subsystems cuts operator actions per incident by roughly 41% once the correlation rules have been properly configured for the site, which is one of the very few genuinely measurable returns available anywhere in physical security. A control room running fewer operators, or the same operators handling considerably more sites, converts directly into a staffing number that any finance function will accept. That measurement matters a great deal, because most physical security spending is justified on risk rather than on return, which leaves it perpetually vulnerable during any budget review.
Market Impact: Integration absorbs 58% of cost

Market Restraints and Challenges

Subsystem Vendors Extend Platforms Sideways Into The Category

Video management and access control vendors keep extending their own platforms to cover adjacent functions, and a site running four systems rather than eleven has considerably less need for anything sitting above them. The root cause is that subsystem vendors already hold the customer relationship and can add capability incrementally without a separate purchase. Commercially this steadily erodes the category from below rather than from any direct competitor. Mitigation runs through genuinely heterogeneous sites, where no single subsystem vendor covers nearly enough, and through regulated environments that require vendor-independent evidence of what happened.
Market Impact: Command platforms grow at 14.0%

Integration Cost Makes Partial Deployments Common

Connection work accounts for roughly 58% of project cost, and deployments attempting all eleven subsystems frequently stall part-way through, leaving the customer with partial capability and a full invoice. The root cause is that each site's subsystem combination is genuinely unique, and legacy equipment very rarely documents its own interfaces properly. Commercially this damages reference selling very badly indeed across the following opportunities. Mitigation runs through phased deployment delivering real value at four subsystems before attempting the rest, and through honest scoping of what genuinely cannot be connected at all.
Market Impact: Libraries cover about 340 devices
3 additional market trends, 4 additional growth drivers, and 2 additional restraints and challenges are covered in the full report. Contact sales@marketmindsadvisory.com to access the complete intelligence.

Segment CAGR and Growth Architecture

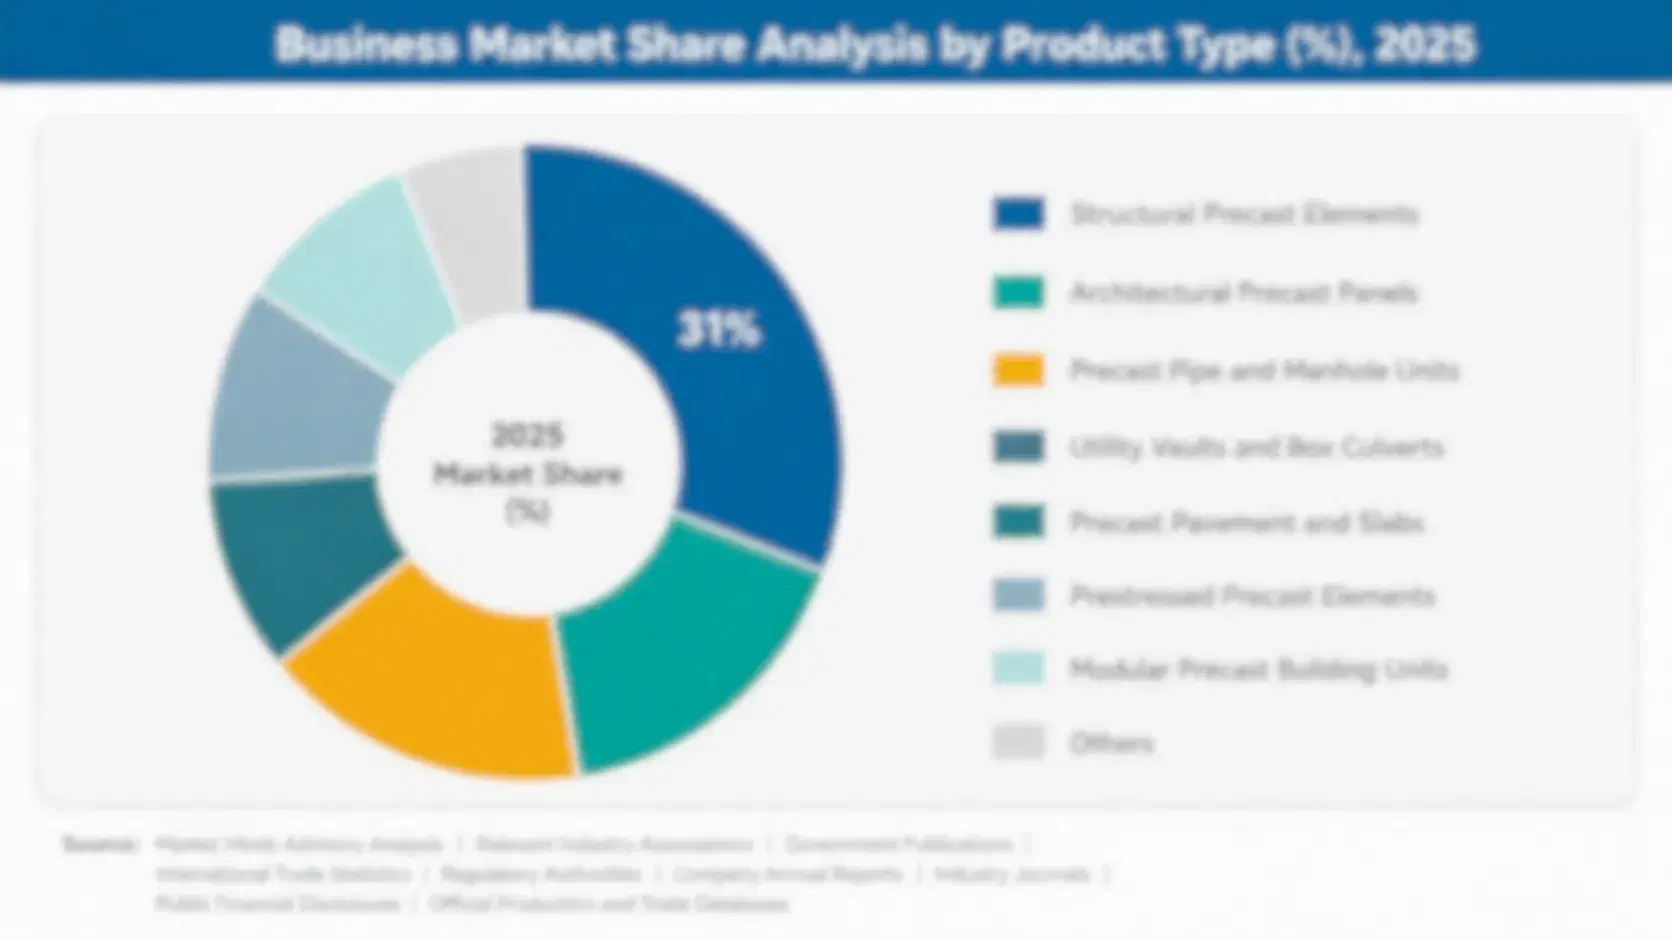
Segmentation follows platform class, since each addresses a different scope of problem and carries different regulatory exposure, integration burden and buyer. Six classes cover the market, spanning critical infrastructure command platforms, enterprise multi-site management, integration middleware, incident workflow, situational awareness interfaces and compliance reporting. End-use sector and procurement route are separate dimensions handled elsewhere.
physical-security-information-management-psim-mark-market-share-analysis-1788644631555

Critical Infrastructure Command And Control Platforms

Critical infrastructure command platforms grow at 14.0%, half again the market rate of 9.3%, because operators across energy, water, transport and telecommunications now all face requirements to detect, respond to and then document security incidents in ways manual procedures cannot evidence to an auditor. That converts a discretionary operations purchase into a compliance one carrying a deadline, which changes both the size of the budget and who actually signs for it. These deployments are also comfortably the largest and most integration-intensive anywhere in the category, frequently spanning dozens of sites and connecting subsystems installed across two decades under different procurement regimes, with no consistent documentation surviving anywhere in the organisation.
CAGR 14.0%

Integration And Middleware Layers

Integration and middleware layers compound at 11.6%, because they address the one part of the project that actually costs real money. Connection and configuration work absorbs roughly 58% of total project spend, and a middleware layer that connects subsystems without requiring the full command platform above it reaches customers who want the plumbing without the presentation. That is a smaller sale carrying better attach rates, and it frequently becomes the route into a considerably larger deployment later. The commercial subtlety is that systems integrators buy this directly rather than the end customer, which makes the commercial channel entirely different from the rest of the category and requires a separate coverage model.
CAGR 11.6%
Full segment breakdown across 6 segments available in the complete report.

Regional Architecture and Country Demand Map

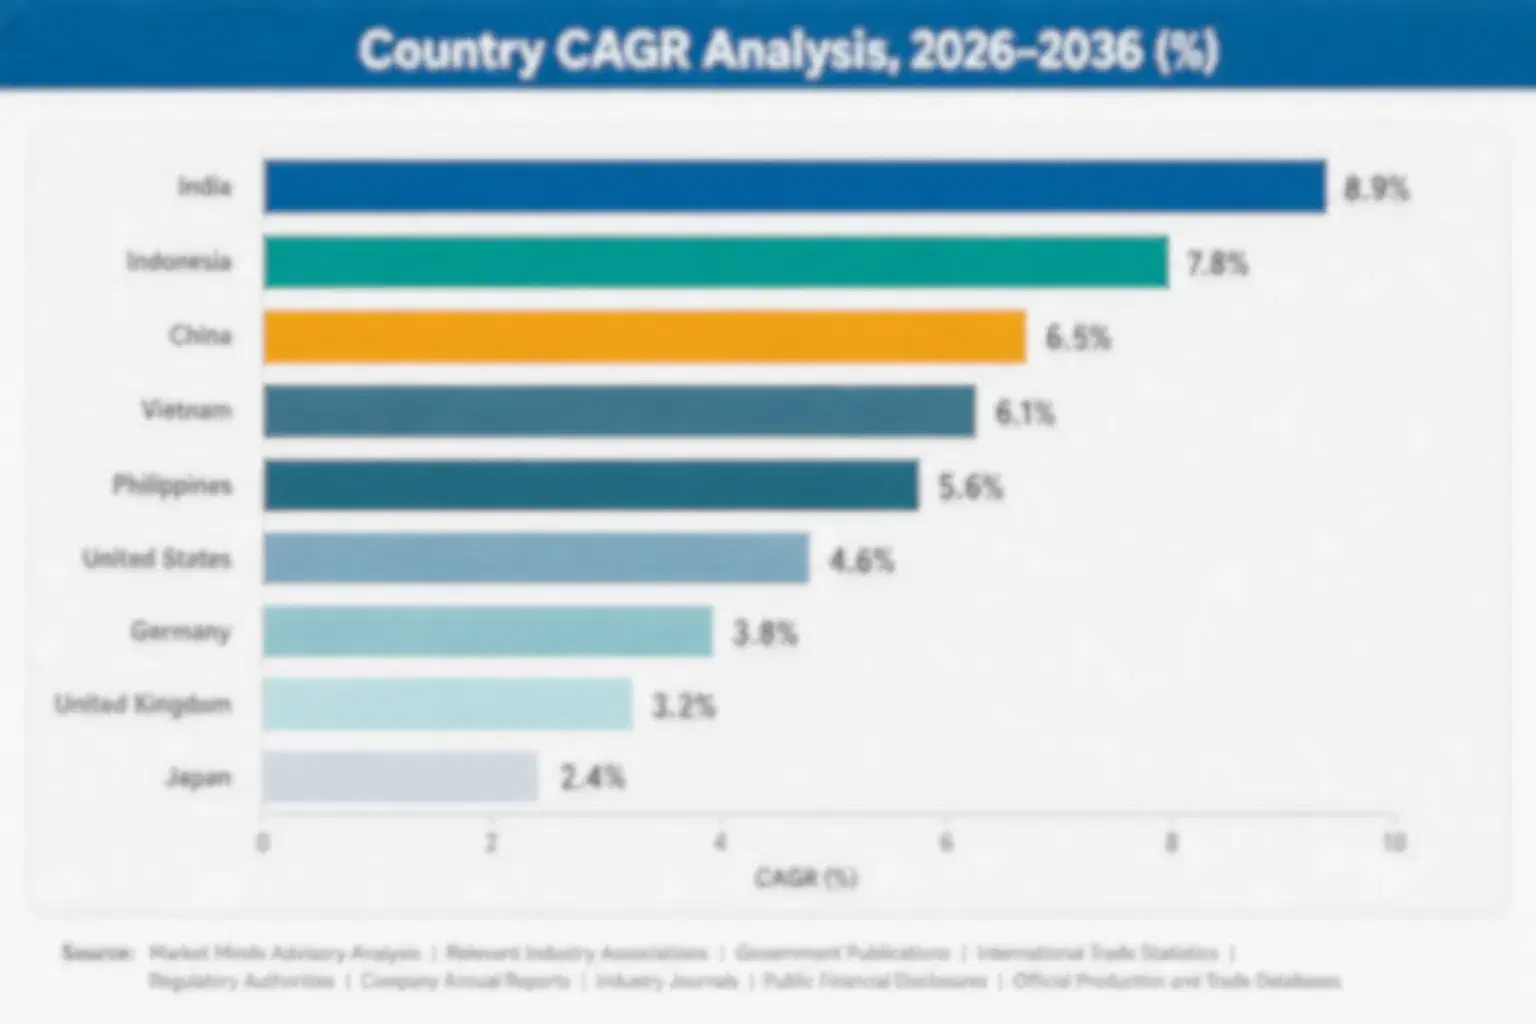
North America holds 29% of category spending, on critical infrastructure regulation and on large corporate campus deployments taken together. Middle East and Africa follows at 16%, far above the usual band ceiling, on Gulf construction that specifies integrated security during design rather than long afterwards.

North America

Twenty-nine percent of category spending reaches North America, where critical infrastructure regulation across energy, water and transport together create the most consistent compliance driver found anywhere in the world. Large corporate campuses and airports account for substantial further demand, typically running exactly the eleven-subsystem accumulation that this software exists to address in the first place. Genetec and Everbridge both hold significant regional positions here, and systems integrators influence the selection heavily across the great majority of deployments. Growth at 9.0% sits marginally below the global rate in a market where penetration among the largest sites is already comparatively high and large-scale new construction remains limited. Replacement cycles dominate demand here.
Share: 29% | CAGR: 9.0% (2026 to 2036)

Middle East and Africa

Middle East and Africa takes 16% of category spending, far above the 6% band ceiling, because Gulf construction now specifies integrated security management during the design phase rather than retrofitting it into sites already running eleven disconnected systems. Saudi Arabia compounds at 15.2% annually, faster than any other market measured anywhere, on giga-project development and critical infrastructure programmes funded as national capability rather than commercial return. Emirati and Qatari airport, stadium and transport projects follow broadly similar procurement patterns throughout. Designing the integration before subsystem selection removes much of the 58% integration cost that burdens retrofit projects everywhere else in the world. African deployments remain concentrated in mining and ports.
Share: 16% | CAGR: 9.7% (2026 to 2036)
Regional intelligence for 5 additional markets available in the complete report: Western Europe, East Asia, South Asia and Pacific, Latin America, Eastern Europe. Contact sales@marketmindsadvisory.com.
physical-security-information-management-psim-mark-country-cagr-analysis-1788644631850

Where PSIM Deals Are Decided

Integration work rather than software licensing carries most of the project cost, systems integrators rather than the end customers control the great majority of the selections, and regulation has now moved the buyer out of operations and across toward compliance. The four levers below follow those conditions rather than any argument about interface design.

Build The Integration Library As Product

Connection and configuration work absorbs roughly 58% of total project cost, and a vendor whose library already covers around 340 device types quotes a materially shorter deployment than one writing connectors from scratch. That integration library is the actual product, regardless of what the marketing material happens to show. It accumulates across years of completed deployments and cannot be assembled quickly by any new entrant at all. Vendors investing heavily in interface design while their integration library lags behind are improving the one part of the offer that nobody evaluates seriously at all.
Market Impact: Libraries covering 340 devices win most of the evaluations

Sell Through Integrators Who Control Selection

Concentration sits at only 31% because systems integrators rather than software vendors decide most deployments, and an integrator who has already deployed one platform then prices every subsequent project around it. A vendor unfamiliar to that particular integrator loses the deal before the customer has compared anything at all. Building integrator familiarity through training, certification and margin is considerably slower than direct selling, and it proves a great deal more durable afterwards. Vendors selling directly to end users frequently find that the integrator has quietly steered the decision somewhere else entirely.
Market Impact: Concentration of just 31% reflects the integrator control

Call On Compliance Rather Than Operations

Critical infrastructure regulation now requires documented incident detection and response that manual procedures cannot evidence to any auditor, which moves the purchase out of an operations budget and into a compliance one carrying a deadline behind it. Critical infrastructure command platforms grow at 14.0% against 9.3% for the market as a direct result of that shift. Vendors still presenting operator efficiency are addressing somebody who has to justify discretionary spending internally, while vendors presenting audit evidence are addressing somebody carrying a legal obligation and considerably less discretion over whether to spend.
Market Impact: Command platforms compound at fully 14.0% every year

Scope Phased Deployments That Actually Complete

Projects attempting all 11 subsystems simultaneously frequently stall part-way through, leaving the customer holding partial capability alongside a full invoice, which damages reference selling far more than the individual project loss ever does. Phasing the work to deliver genuinely working correlation across 4 subsystems first, then extending afterwards, produces a working reference that then goes on to sell the next deal for you. Vendors scoping ambitiously in order to win on capability are quietly setting up the failure that goes on to cost them the following three opportunities in the same sector.
Market Impact: Four subsystems deliver value before all 11 do

Who Controls the Margin Pool

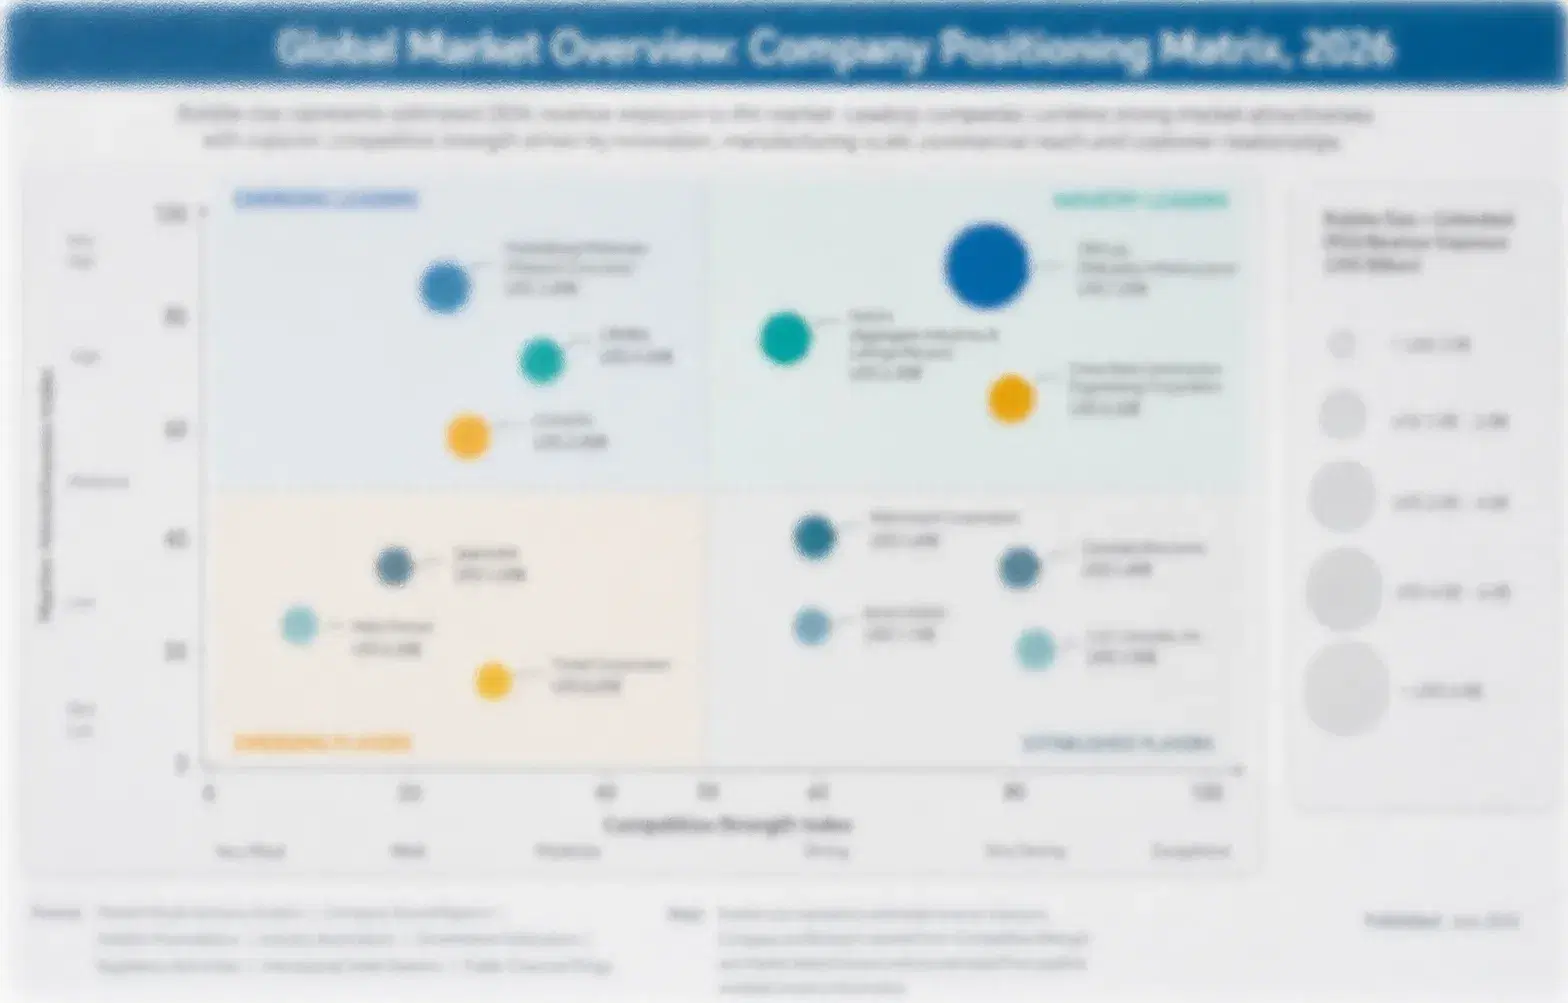
Five vendors hold just 31% of licence and subscription revenue, which is unusually low for enterprise software and reflects that systems integrators rather than software vendors control most selections. Genetec, Milestone Systems, Everbridge, Vidsys and Advancis Software lead. All participants here are assessed consistently on physical security information management licence and subscription revenue rather than on any broader security business they operate.
Competition runs on integration library depth and integrator relationships far more than on anything visible in a product demonstration. A vendor supporting around 340 device types quotes a materially shorter deployment than one writing fresh connectors, and that single difference decides most evaluations. The second dimension is regulatory capability, since compliance-driven buyers need audit evidence and reporting that operations-focused platforms were never designed to produce.

Pressure comes from video management and access control vendors steadily extending their own platforms sideways, which reduces the number of separate subsystems a site runs and therefore the need for anything sitting above them. Rankings shift wherever large new sites are being built rather than where existing ones simply replace software, particularly across the Gulf and India at present.
physical-security-information-management-psim-mark-company-positioning-matrix-1788644632167

Competitive Moat and Risk Dimensions

GENETEC

Moat: Unified Platform Breadth

Genetec covers video management, access control and management functions in one platform, which reduces the number of separate subsystems a customer runs before any integration work begins. That directly attacks the 58% of project cost sitting in connection work. Competitors offering management software above somebody else's subsystems face a harder commercial argument on every deployment where consolidation is genuinely possible.
GENETEC

Risk: Heterogeneous Site Limitation

The unified platform argument works where a customer can consolidate subsystems, and fails at sites carrying twenty years of accumulated equipment from vendors nobody will replace. Those are precisely the deployments this category exists to serve. Competing there means winning on integration library depth rather than on breadth of native capability, which is a different contest entirely.
EVERBRIDGE

Moat: Incident Response Workflow Depth

Everbridge holds strong capability in incident notification and response workflow, which is exactly what compliance-driven buyers must evidence to an auditor after a security event. That places the company on the side of the category where regulation is creating new demand rather than where efficiency arguments must be made. Building comparable workflow depth takes years of deployment experience.
EVERBRIDGE

Risk: Subsystem Integration Dependency

Response workflow depends on receiving accurate events from subsystems the company does not supply, so integration library depth remains the constraint regardless of how good the workflow itself is. Connection work absorbs 58% of project cost either way. Strength in the visible part of the offer does not remove the requirement to solve the expensive and invisible part underneath it.

Players Tracked

Prominent Players

Genetec
Milestone Systems
Everbridge
Vidsys
Advancis Software

Other Key Players

Johnson Controls
Honeywell Building Technologies
Bosch Building Technologies
Siemens Smart Infrastructure
NICE Systems
Verint Systems
CNL Software
Qognify
AxxonSoft
Prysm Software
ISS Intelligent Security Systems
Nedap Security Management
Gallagher Security
Hikvision Digital Technology
Dahua Technology

Recent Developments

FEBRUARY 2025

Critical Infrastructure Directives Extend Incident Documentation Requirements

Regulatory authorities across several jurisdictions extended incident detection and documentation requirements for critical infrastructure operators, a regulatory development rather than any corporate transaction. Manual procedures cannot evidence detection and response to an auditor after the fact, which moves the purchase from operations budgets into compliance ones carrying deadlines.
Signal: A documentation requirement moves this purchase from discretionary operations across into compliance with a fixed deadline.
AUGUST 2024

Gulf Projects Specify Integrated Security During Design Phase

Major Gulf construction programmes specified integrated security management during facility design rather than as later retrofit, a procurement development rather than any merger. Specifying integration before subsystem selection removes much of the roughly 58% of project cost that connection work absorbs when systems are already installed and running.
Signal: Designing the integration first lets subsystem choice favour whatever connects cleanly rather than accommodating past history.
JUNE 2025

Subsystem Vendors Extend Platforms Into Adjacent Security Functions

Video management and access control vendors extended their platforms into adjacent security functions across product ranges, organic development rather than any acquisition. A site running four systems rather than eleven has considerably less need for management software sitting above them, which erodes the category from below.
Signal: Fewer separate subsystems at a site means considerably less need for anything sitting above all of them.

What Delivering PSIM Costs

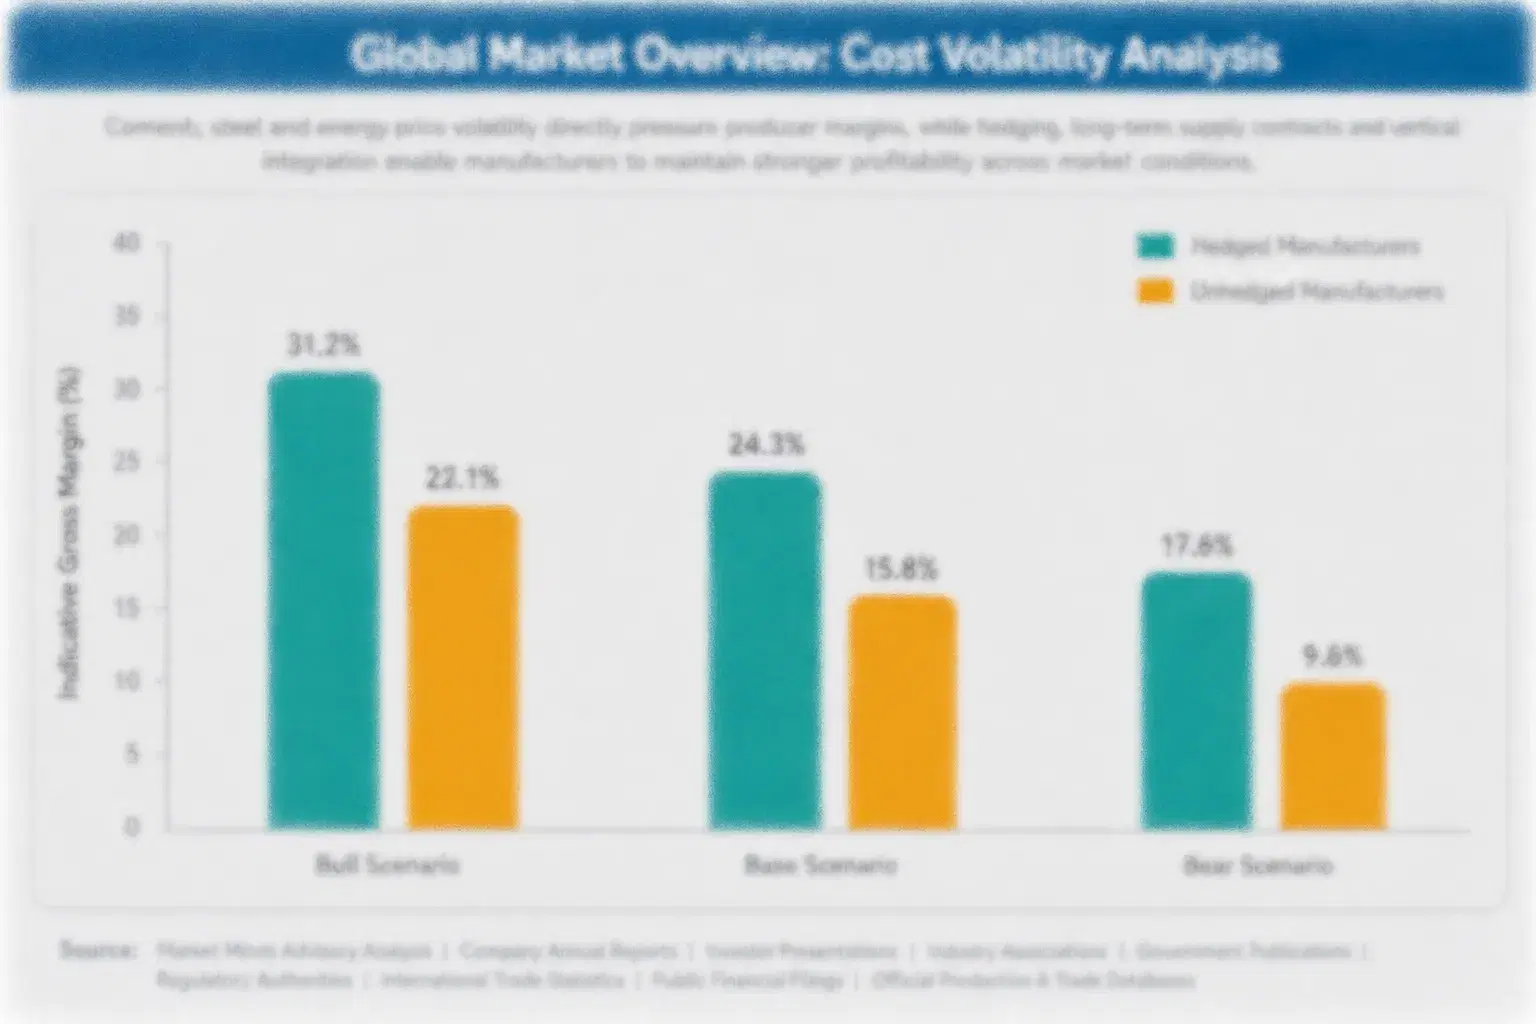
Integration engineering and configuration services absorb roughly 47% of vendor cost of delivery, which is high even by enterprise software standards and reflects that every site's subsystem combination differs. Ongoing integration library development takes around 22%, since supported devices change under vendors who do not coordinate. Product engineering absorbs about 18%, and hosting with support takes most of the remaining balance across long deployment lifetimes.
Skilled integration engineering labour tightened sharply through 2022 and 2023 as physical and cyber security hiring competed for overlapping capability, raising delivery cost against fixed-price project commitments already signed. Johnson Controls Annual Report 2023 and Honeywell Annual Report 2023 both record services labour cost as a principal operating variable across building technology segments. Vendors with reusable integration components absorbed that movement considerably better than those configuring each project individually.

The competitive disadvantage mechanism is library maturity rather than labour rates. A vendor whose library already covers around 340 device types configures where a competitor must engineer, which is the difference between 47% delivery cost and considerably more. Exposure concentrates among newer entrants, whose per-project engineering burden is built into how they deliver rather than temporary, and does not fall with experience on any single deployment.
physical-security-information-management-psim-mark-cost-volatility-analysis-1788644632498

Invest In Library Coverage Ahead Of Demand

Integration engineering absorbs roughly 47% of delivery cost, and a library already covering around 340 device types converts engineering work into configuration. Building coverage before a customer requires it costs money against no immediate return and reduces delivery cost on every subsequent project. Vendors building connectors reactively per deployment carry a cost structure that never improves with volume at all.

Price Fixed-Price Projects Against Labour Movement

Integration engineering labour competes with cybersecurity hiring for overlapping capability and moved sharply when both markets tightened simultaneously. Fixed-price project commitments signed before that movement absorbed the difference entirely. Indexing longer projects or shortening commitment horizons protects margin on the largest line in the delivery cost structure without changing anything the customer actually receives.

Reuse Configuration Patterns Across Sector Deployments

Sites within a sector repeat subsystem combinations more than vendors generally assume, since airports, water utilities and rail operators each procure from similar supplier pools. Building reusable configuration patterns per sector rather than treating every deployment as unique reduces the 47% delivery cost meaningfully. Most vendors discover the repetition eventually and few organise deliberately around it from the start.

Portfolio Architecture for Margin Defence

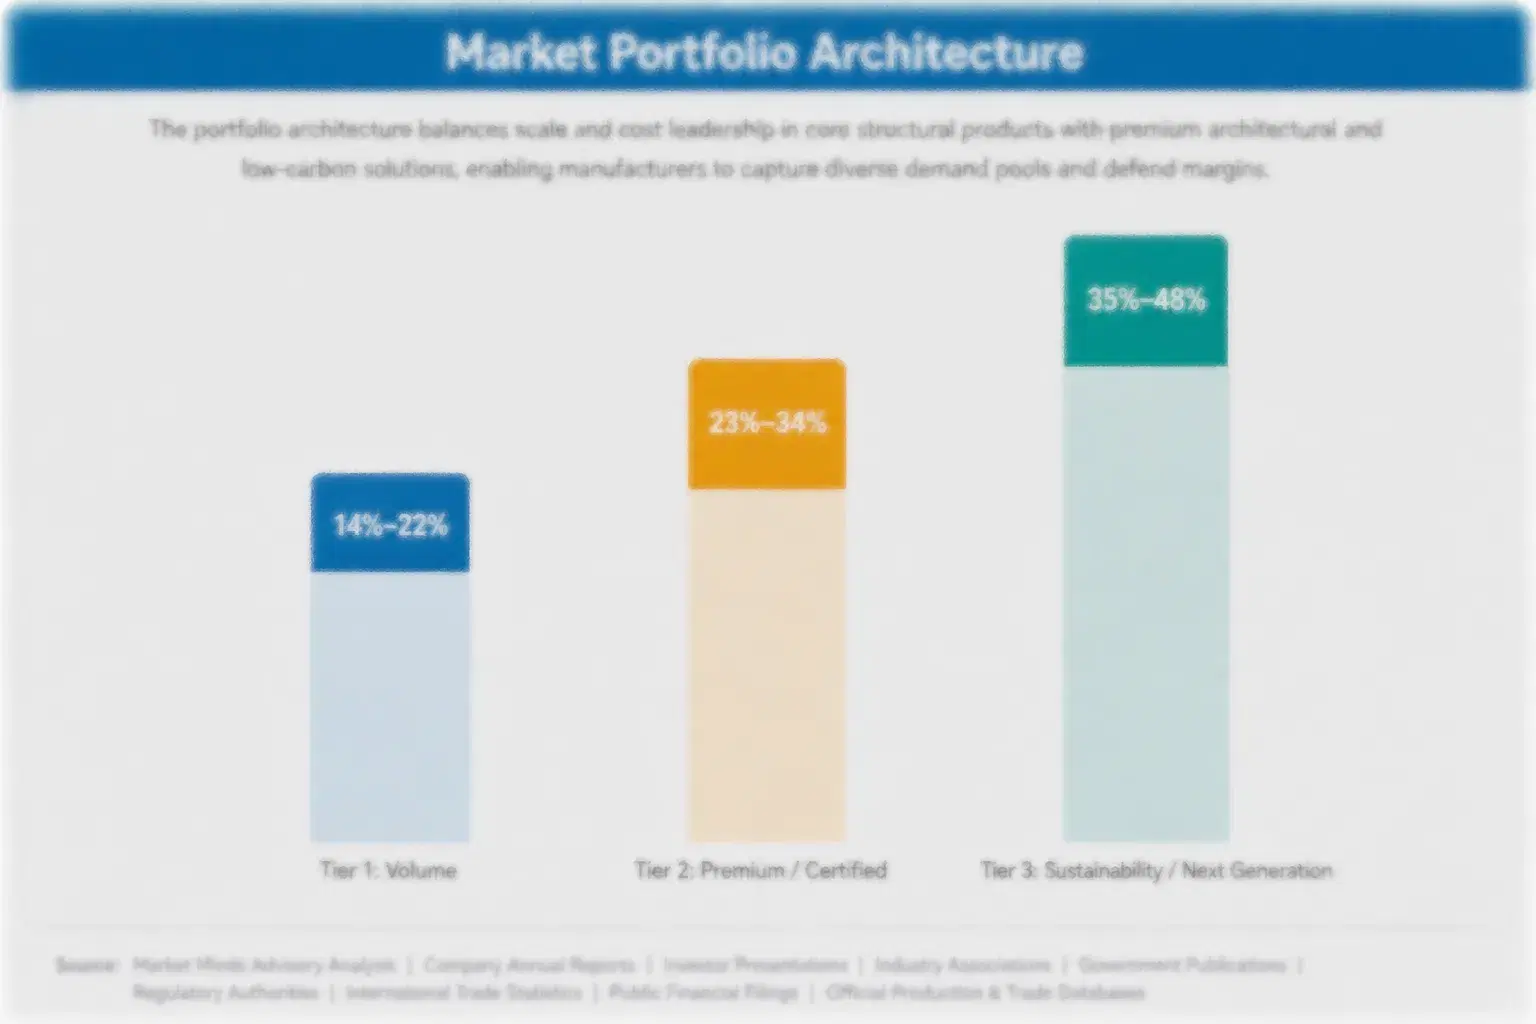
Margin architecture separates on how much per-project engineering each product requires. Situational awareness and mapping interfaces earn least, since the capability is broadly comparable across vendors and buyers evaluate it superficially. Incident workflow modules sit above on configuration depth. Critical infrastructure command platforms, integration middleware and compliance reporting earn most, because each carries either regulatory necessity or the library depth that competitors cannot assemble quickly.
The volume versus premium tension runs between licence and services rather than between products. Integration engineering absorbs roughly 47% of delivery cost, and vendors carrying that as services headcount earn far less per customer than those whose library allows configuration. Treating services as a revenue line works commercially until a competitor arrives whose library removes the work entirely, which is happening steadily across the category.

High-value pools concentrate in compliance reporting and in critical infrastructure command platforms, where the buyer has a legal obligation rather than a discretionary budget. Neither is reached through interface capability. Reaching them requires audit-grade evidence generation and integration depth across subsystems installed over two decades, which is why the same vendors keep winning regulated deployments across successive procurement cycles.

Volume / Commodity-Adjacent

Situational awareness and mapping interfaces and basic alarm presentation, where capability is broadly comparable across vendors and buyers evaluate it fairly superficially. The ten point spread separates cloud subscription delivery from deployments still requiring substantial on-site installation and support.
Gross Margin: 48% to 58%

Premium / Certified

Enterprise multi-site management and incident workflow automation, where configuration depth and multi-site handling determine selection alongside functionality. The ten point spread tracks how much per-project engineering each deployment requires, which varies considerably with integration library maturity.
Gross Margin: 62% to 72%

Sustainability / Regulatory / Next-Generation

Critical infrastructure command platforms, integration middleware and compliance reporting, sold against regulatory obligation or library depth rather than any discretionary operational argument. The twelve point spread reflects how much of the integration work sits in configuration rather than fresh engineering.
Gross Margin: 74% to 86%
physical-security-information-management-psim-mark-portfolio-architecture-1788644632804

High-value Sub-segments and Strategic Watch-out

Critical Infrastructure Command And Control Platforms

Grows at 14.0% because regulation now requires the documented incident detection and response that manual procedures simply cannot evidence to any auditor. The twelve point spread here reflects integration library maturity. Compliance functions buy this readily in places where operations budgets would defer it indefinitely.
Gross Margin: 74% to 86%

Integration And Middleware Layers

Grows at 11.6% by addressing the connection work that absorbs roughly 58% of total project spend on any deployment anywhere. The twelve point spread here reflects integration library depth. Systems integrators rather than end customers buy this one directly, which changes the whole commercial channel.
Gross Margin: 74% to 86%

Compliance Reporting And Audit Modules

Grows at 10.8% as critical infrastructure operators must now evidence their detection and response to auditors rather than merely perform it correctly. The twelve point spread here reflects audit evidence generation depth. Operations-focused platforms were simply never designed to produce this sort of audit output.
Gross Margin: 74% to 86%

Situational Awareness And Mapping Interfaces

Grows at 5.4%, slowest of the six platform classes, on capability broadly comparable between vendors and evaluated fairly superficially by buyers. The ten point spread here reflects the delivery model alone. Every vendor demonstration leads with this, and no evaluation is genuinely decided by it.
Gross Margin: 48% to 58%

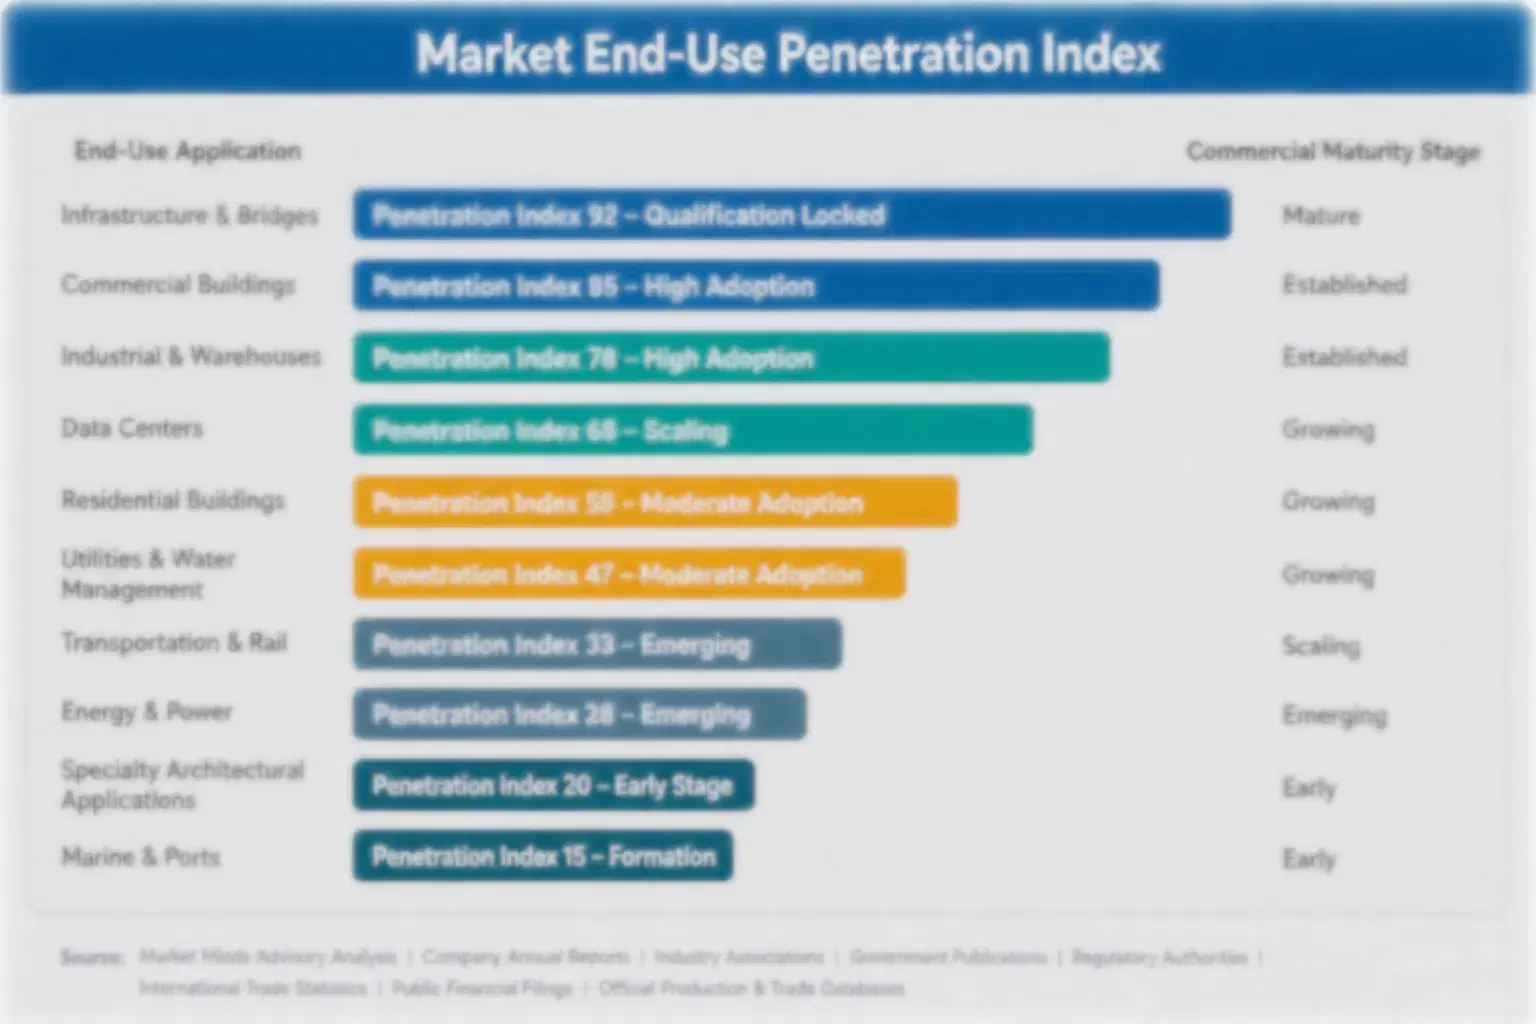
Why Platforms Stay Installed

The annuity here is the integration work rather than any licence term. Connecting eleven subsystems takes around 16 months and absorbs roughly 58% of project cost, and none of that transfers to a replacement platform. Ripping it out means paying for it again with nothing to show for the disruption. Deployments consequently persist for a decade or more, and the vendor selected once keeps collecting subscription revenue.
Depth varies sharply by how much of the site actually runs through the platform. A deployment correlating events across every subsystem and generating audit evidence is deeply fixed, since the compliance record depends on it continuing. A deployment that connected four subsystems and stalled is barely fixed at all, and the customer will happily replace it. Vendors frequently assume the first situation while having actually delivered the second one.

The buyer has moved from security operations toward compliance and, on new construction, toward facility designers. A security manager evaluated operator workload and alarm handling. A compliance function evaluates whether incidents can be evidenced to an auditor. A facility designer decides whether integration is specified at all. Vendors selling only to security operations address the one buyer whose budget is most easily deferred.
physical-security-information-management-psim-mark-end-use-penetration-index-1788644633118

What Wins These Deployments

These are among the four positions where our research anticipates prominent divergence between winners and laggards over the coming forecast period. Each is grounded in the demand model, the regulatory perimeter, and the announced capacity pipeline.
01 / INTEGRATION LIBRARY INVESTMENT

The Library Is The Actual Product

Connection and configuration work absorbs roughly 58% of total project cost, and a vendor whose library already covers around 340 device types quotes a materially shorter deployment than one writing fresh connectors for every subsystem it meets. That integration library is the real product, regardless of what the marketing material chooses to put on screen. It accumulates across years of deployments and cannot be assembled quickly by any new entrant, however good their interface design or situational awareness capability happens to be.
02 / INTEGRATOR CHANNEL DEVELOPMENT

Win The Integrator Before The Customer

Concentration sits at only 31% because systems integrators rather than the software vendors themselves decide most deployments, and an integrator who has already deployed one platform then prices every subsequent project around that existing familiarity. A vendor unknown to that particular integrator loses the deal before the end customer has compared anything at all. Building genuine integrator familiarity through training, certification and margin is considerably slower than direct selling, and it proves a great deal more durable once genuinely established.
03 / COMPLIANCE BUYER COVERAGE

Sell Audit Evidence, Not Operator Efficiency

Critical infrastructure regulation now requires documented incident detection and response that manual procedures cannot evidence to an auditor afterwards, which moves the purchase out of an operations budget and into a compliance one carrying a firm deadline behind it. Critical infrastructure command platforms grow at 14.0% against 9.3% for the market as a direct consequence of that shift. Vendors still presenting operator efficiency are addressing somebody defending discretionary spending rather than somebody carrying a genuine legal obligation with a date attached.
04 / DEPLOYMENT SCOPE DISCIPLINE

Finish Four Before Attempting Eleven

Projects attempting all eleven subsystems simultaneously frequently stall part-way through, leaving the customer holding partial capability alongside a full invoice, which damages reference selling considerably more than the individual project loss ever does. Phasing the work to deliver genuine correlation across four subsystems first, then extending afterwards, produces a reference that goes on to sell the next deal. Vendors scoping ambitiously in order to win on capability are quietly arranging the failure that will cost them the next three opportunities.

Engagement Snapshot From the Field

A live engagement with an industry participant carrying material or product regulatory and market exposure ahead of a defining policy shift, showing how our research translates into a defensible multi-year portfolio strategy.
MARKET MINDS ADVISORY · CLIENT ENGAGEMENT SUMMARY
Physical Security Information Management (PSIM) Producer Strategic Portfolio Review and Transition Roadmap 2026·Investment Scenario on Physical Security Information Management (PSIM) Exposure Evaluation 2025-26
CLIENT PROFILE
A national utility operator running generation, transmission and distribution assets across more than sixty sites, facing new critical infrastructure incident documentation requirements with a fixed deadline attached. Security systems had accumulated over two decades under different procurement regimes, and no consolidated record existed of what was installed where or which interfaces those systems actually supported.
STRATEGIC CHALLENGE
Security operations wanted the platform that had performed best in demonstration, which showed impressive correlation and mapping. Procurement wanted the lowest licence cost. Neither had established how many of the installed subsystems each shortlisted vendor could actually connect, which turned out to vary enormously and to matter far more than either consideration.
MMA APPROACH
MMA inventoried the installed security subsystems across all sites and checked each against the integration libraries of the four shortlisted vendors. We modelled deployment cost and duration on the actual estate rather than on vendor assumptions, and assessed which platforms could generate the audit evidence the new requirements demanded. Work drew on 47 expert interviews conducted in Q4 2025 with operators and integrators.
KEY FINDINGS
  1. The estate carried 14 distinct subsystem types across the sixty sites, considerably more variety than the operator's own internal records had ever suggested existed.
  2. Coverage across shortlisted vendors ranged from 6 to 12 of those subsystem types, which changed projected integration cost by a factor nobody had modelled.
  3. The demonstration favourite covered the fewest subsystems, and would have required custom connector development on more than half the estate (client-reported, unverified by MMA).
  4. Only two of the four shortlisted platforms could generate the audit evidence format that the new documentation requirements actually specified for reportable incidents.
CLIENT PROFILE
A national utility operator running generation, transmission and distribution assets across more than sixty sites, facing new critical infrastructure incident documentation requirements with a fixed deadline attached. Security systems had accumulated over two decades under different procurement regimes, and no consolidated record existed of what was installed where or which interfaces those systems actually supported.
STRATEGIC CHALLENGE
Security operations wanted the platform that had performed best in demonstration, which showed impressive correlation and mapping. Procurement wanted the lowest licence cost. Neither had established how many of the installed subsystems each shortlisted vendor could actually connect, which turned out to vary enormously and to matter far more than either consideration.
MMA APPROACH
MMA inventoried the installed security subsystems across all sites and checked each against the integration libraries of the four shortlisted vendors. We modelled deployment cost and duration on the actual estate rather than on vendor assumptions, and assessed which platforms could generate the audit evidence the new requirements demanded. Work drew on 47 expert interviews conducted in Q4 2025 with operators and integrators.
KEY FINDINGS
  1. The estate carried 14 distinct subsystem types across the sixty sites, considerably more variety than the operator's own internal records had ever suggested existed.
  2. Coverage across shortlisted vendors ranged from 6 to 12 of those subsystem types, which changed projected integration cost by a factor nobody had modelled.
  3. The demonstration favourite covered the fewest subsystems, and would have required custom connector development on more than half the estate (client-reported, unverified by MMA).
  4. Only two of the four shortlisted platforms could generate the audit evidence format that the new documentation requirements actually specified for reportable incidents.
RECOMMENDED STRATEGY
Phase 1: Phase one: reweight the whole evaluation onto verified integration library coverage against the actual installed estate rather than onto demonstration performance. Phase 2: Phase two: eliminate the two platforms that could not generate the required audit evidence format, regardless of any operational capability they offered. Phase 3: Phase three: deploy across the twelve highest-risk sites first in order to meet the deadline, then extend gradually across the remaining estate.
OUTCOME
The operator selected on verified integration coverage rather than demonstration performance and met the documentation deadline across its highest-risk sites (client-reported, unverified by MMA). Projected integration cost fell substantially against the original favourite. Subsystem inventory is now maintained continuously, which is the change that outlasted the selection itself.

Frequently Asked Questions

Foundational context covering the market sizes, CAGR, scope, country, region and competition that inform every finding below. This section is provided to cover basics and most often pre-purchase conversations, answered from the MMA Primary Research Dataset.

What is the current size of the Physical Security Information Management (PSIM) Market?

Global value reaches USD 2.4 billion in 2026, measured as licence and subscription revenue across six platform classes. The 2025 base for the market is USD 2.2 billion.

How large will the Physical Security Information Management (PSIM) Market be by 2036?

The market reaches USD 5.8 billion by 2036, an increase of USD 3.4 billion across the forecast period. That represents 2.42 times expansion from the 2026 base.

What is the CAGR for the Physical Security Information Management (PSIM) Market 2026 to 2036?

The base case runs at 9.3% annually, with a bull case at 10.5% if regulatory reporting obligations widen further and a bear case at 8.1% if subsystem consolidation reduces the number of systems needing integration.

Which segment is growing fastest?

Critical infrastructure command and control platforms grow at 14.0%, half again the market rate of 9.3%. Regulation now requires documented incident response that manual procedures cannot evidence.

Who are the major companies in the Physical Security Information Management (PSIM) Market?

Genetec, Milestone Systems, Everbridge, Vidsys and Advancis Software lead on licence and subscription revenue, together holding 31%. Johnson Controls, Qognify and Verint Systems hold smaller positions.

Which country is growing fastest?

Saudi Arabia leads at 15.2%, on giga-project construction and critical infrastructure programmes that specify integrated security during design. India and the Emirates follow behind it.

Report Segmentation Architecture

The full report scope spans multiple orthogonal segmentation dimensions, with cross-tabulated demand data provided for each dimension pair. Coverage extends further to regional breakdowns, trend trajectories, and the competitive detail needed to support segment-level decision-making.

By Platform Class

  • Critical Infrastructure Command And Control Platforms
  • Integration And Middleware Layers
  • Compliance Reporting And Audit Modules
  • Enterprise Multi-Site Security Management
  • Incident Workflow And Response Automation
  • Situational Awareness And Mapping Interfaces

By End-Use Industry

  • Energy And Utility Infrastructure
  • Transport Hubs And Aviation
  • Industrial And Manufacturing Sites
  • Government And Defence Facilities
  • Corporate Campuses And Data Centres
  • Mining And Remote Resource Operations

By Commercial Dimension

  • Systems Integrator Delivery
  • Direct Vendor Sales
  • Regulatory Compliance Programmes
  • New Construction Design Specification
  • Retrofit And Consolidation Projects
  • Subscription And Managed Service Models

By Region

  • North America
  • Western Europe
  • East Asia
  • South Asia and Pacific
  • Latin America
  • Middle East and Africa
  • Eastern Europe

Scope, Methodology, and Coverage

Every figure in this report is reproducible from documented input assumptions. The scope below maps the historical period, the forecast horizon, the segmentation dimensions, and the countries covered, alongside the underlying primary and qualitative methodology.
Historical Period
2020 to 2025
Forecast Period
2026 to 2036
Base Year
2025 (USD billions; MMA Primary Research Dataset, September 2026)
Market Definition
This report covers physical security information management software by platform class: critical infrastructure command and control platforms, enterprise multi-site security management, integration and middleware layers connecting subsystems, incident workflow and response automation, situational awareness and mapping interfaces, and compliance reporting and audit modules. It excludes video management systems sold standalone, access control hardware and its native software, intrusion detection panels, cybersecurity tooling, and guard force scheduling applications.
Quantitative Units
USD millions, licence and subscription revenue basis; deployed sites; subsystems connected per deployment; integration share of project cost as a percentage; deployment duration in months; supported device types in an integration library.
Segmentation Dimensions
Platform class; end-use sector; commercial procurement and delivery route; geography across seven regions.
Regions Covered
North America, Western Europe, East Asia, South Asia and Pacific, Latin America, Middle East and Africa, Eastern Europe
Countries Covered
United States, Canada, Saudi Arabia, United Arab Emirates, Qatar, South Africa, Germany, Netherlands, Sweden, France, United Kingdom, Poland, Czechia, China, Japan, South Korea, India, Australia, Brazil, Chile.
Key Companies Profiled
Genetec, Milestone Systems, Everbridge, Vidsys, Advancis Software, Johnson Controls, Honeywell Building Technologies, Bosch Building Technologies, Siemens Smart Infrastructure, NICE Systems, Verint Systems, CNL Software, Qognify, AxxonSoft, Nedap Security Management.
Quantitative Methodology
Primary survey, n=3,800 respondents, Q4 2025, six countries; demand-side model with trade association cross-validation
Qualitative Methodology
47 expert interviews, Q4 2025; applied to validate demand model assumptions, identify emerging dynamics, and assess competitive positioning
Report Format
PDF and XLSX data workbook (Word format preview document)
Publisher
Market Minds Advisory
Report Code
MMA-2026-TEC-741
Published
September 2026
Contact
sales@marketmindsadvisory.com | www.marketmindsadvisory.com

Purchase the full Physical Security Information Management (PSIM) Market Report (2026 to 2036).

This report sizes the global physical security information management market from 2026 to 2036 across six platform classes, six end-use sectors and seven regions. It explains why integration work at roughly 58% of project cost makes library depth rather than interface design the decisive competitive variable, and why concentration at 31% reflects systems integrator control over most selections. Critical infrastructure regulation is analysed as the force moving this purchase from discretionary operations budgets into compliance ones carrying deadlines. Delivery cost composition is sourced to company annual reports. Regional analysis explains why Middle East and Africa holds 16% of spending.
Six platform classes sized through to 2036
Integration cost quantified against total project spend
Integrator channel influence assessed across regional markets
Twenty named vendors assessed on subscription revenue
Four revenue levers with quantified commercial impact
Anonymised utility platform selection engagement documented in full

Built For The People Who Decide

From boardroom strategy to bench-side execution, this report is read cover-to-cover by leaders shaping the next decade of their industry, turning demand scenarios, market dynamics and valuation benchmarks into decisions.
CXOs/ Presidents/ VPs/ Managers
M&A and Corporate Development
Strategy Teams and R&D Heads
Procurement and Product Directors
Regulatory and Compliance Leaders
Investor Relations and Equity Analysts