Market Minds Advisory
Physical-Digital Integration Market

Physical-Digital Integration Market: Physical-Digital Integration Market: Carrier Economics, Resolution Ownership and Compliance Deadlines 2026 to 2036

The code printed on the pack costs a fraction of a cent. What it is actually worth depends entirely on whose system the scan resolves to, and most brands have never asked that question.

Lead Analyst

Published

September 2026

Make Smarter Decisions with Customized Research Insights

Request a free sample report and evaluate market opportunities, growth trends, and competitive dynamics relevant to your business needs.

2025 MARKET VALUE$9.4BMarket Size 2025
2036 FORECAST VALUE$32.0BBase Case , 2026 to 2036
CAGR 2026 TO 203611.8 %Bull 13.1% / Bear 10.5%
INCREMENTAL OPPORTUNITY$21.5BNet 10- year value creation
EXPANSION MULTIPLE3.05x2036 value over 2026 base
Strategic Levers
M&A Pipeline
Regional Outlook
Country Rankings
Competitive Intelligence
Segmental Deep-dive
Call-Us : 91 93563 13602

Executive Snapshot and Market Trajectory.

Printing a two-dimensional code on a pack costs a fraction of a cent. What that code is actually worth depends entirely on whose system the scan resolves to, and a surprising number of brand owners have never once established the answer for their own products.
The market reaches USD 10.5 billion in 2026 and USD 32.0 billion by 2036, a 3.05 times expansion at 11.8% annually. Two-dimensional data carriers and resolver services grow at 17.7%, half again the market rate of 11.8%, because European product passport rules now require a conforming data carrier on every good within scope. Western Europe holds 29% of global spending, above the usual band, and India compounds fastest of any market at 16.9%.
Five suppliers hold only 34% of revenue in this category, which is unusually low because it spans label printing, silicon, imaging and platform software rather than any one technology. Avery Dennison, Zebra Technologies, Digimarc, Impinj and Sato Holdings lead the field on that combined basis. The competitive question is shifting away from who prints the carrier and toward who actually operates the resolution service sitting behind it.
Market Definition
This report covers technologies creating a machine-readable link between a physical item and a digital record, by technology class: two-dimensional data carriers and resolver services, connected packaging and smart label electronics, computer vision product recognition, RFID and NFC tagging systems, digital watermarking and covert marking, and linear barcode systems. It excludes point-of-sale terminals and payment infrastructure, general enterprise data management software, industrial sensors not attached to individual items, and logistics execution systems.
Base Year Value
$9.4B in 2025 (MMA Primary Research Dataset, September 2026)
Forecast Period
2026 to 2036, eleven discrete annual values
CAGR
11.8% base case. Bull 13.1%. Bear 10.5%.
Fastest Growth Segment
Two-Dimensional Data Carriers And Resolver Services: 17.7% CAGR
Fastest Growth Country
India: 16.9% CAGR
Fastest Growth Region
South Asia and Pacific: 14.1% CAGR
Largest Region
Western Europe: 29% of 2025 global value
Market Leaders
Avery Dennison, Zebra Technologies, Digimarc, Impinj and Sato Holdings lead on physical-digital linking hardware, media and platform revenue. Source: MMA Analysis.
Primary Survey
n=3,800 procurement and R&D decision-makers, Q4 2025, six countries
Methodology
Demand-side build-up, cross-validated against public data, 47 expert interviews

Physical-Digital Integration Market Forecast Scenarios

physical-digital-integration-market-size-forecast-scenario-1789994995646
Between 2020 and 2025 the category compounded at 10.6%, and one change did most of the work. Phone cameras became universal readers, which moved the addressable use of an item-level code from warehouse scanning toward consumer interaction. Retailers began mandating two-dimensional carriers to replace linear barcodes at checkout, and brand owners started discovering that a scan could carry marketing, authentication and recall information at once.
The base case holds 11.8% on three mechanisms. European product passport requirements bring product categories into scope on a published timetable, which converts a marketing decision into a compliance one. Retail mandates keep pushing two-dimensional carriers onto packaging that carried only a linear barcode. And brand owners are beginning to treat resolution, meaning control of where a scan actually lands, as an asset worth paying to own rather than something a printer supplies incidentally.
The bull case at 13.1% assumes product passport scope widens faster than the published timetable indicates, pulling categories forward. The bear case at 10.5% is compliance minimalism: brands can satisfy a passport requirement with the cheapest conforming carrier and a static page, spending almost nothing beyond the printing, which is precisely what a substantial number of them intend to do.

Who Owns The Scan

The economics of this category are peculiar because the marking is almost free. A printed two-dimensional carrier adds around 0.2 cents to a pack at production volume, which is not a number any procurement function negotiates over. The expensive part sits behind it: the database, the resolution service, the content and the ongoing operation of all three across every product the brand sells.
TOP FIVE CONCENTRATION34%Low, since the category spans printing, silicon and software
TWO-DIMENSIONAL CARRIER COST0.2 centsPrinted marking cost per item at full production volume
PASSIVE TAG COST4 centsPer unit for standard passive radio frequency labels
BRAND RESOLUTION OWNERSHIP61%Consumer scans landing on the brand owner's own system
COMPLIANCE DEADLINE HORIZON30 monthsUntil further product categories fall under passport requirements
ITEM LEVEL DEPLOYMENT RATE13%Retail units carrying an individually resolvable digital identity
That is why the ownership question matters more than the technology one. Around 61% of consumer scans currently resolve to the brand owner's own system, and the rest land somewhere else, on a retailer platform, a marketplace listing or a third-party service that captured the link. Brands that treated the code as a printing decision frequently discover afterwards that somebody else is holding the resulting data and the relationship it creates.
Regulation has changed who is making these decisions. European product passport rules bring categories into scope on a published timetable, with roughly 30 months before the next substantial expansion, and a compliance requirement is signed off by a different function than a marketing pilot. That shift moved budget authority toward regulatory affairs and away from the brand teams who had experimented with connected packaging for years.
"Brands spent a decade running connected packaging pilots and calling them innovation. Then a regulation arrived with a date on it, and suddenly the same work is a compliance project with a budget and an owner. Nothing about the technology changed. Everything about who signs changed."
Director, Product Identity and Connected Packaging Practice · MMA Technology Practice · September 2026

Market Trends

Compliance Timetables Replace Voluntary Marketing Pilots

European product passport requirements bring defined product categories into scope on a published schedule, with roughly 30 months until the next substantial expansion of that scope. A compliance obligation is approved by regulatory affairs rather than by a brand team, which changes both the available budget and the decision criteria completely. Two-dimensional data carriers and resolver services grow at 17.7% against 11.8% for the market as a whole. Textiles, batteries and electronics lead the scope expansion, and suppliers organised around marketing buyers are now calling on entirely the wrong function.
Market Impact: Carriers cost 0.2 cents each
Resolution Control Becomes The Commercial Question

Around 61% of consumer scans resolve to the brand owner's own system and the remainder land somewhere else entirely, on retailer platforms, marketplace listings or third-party services that captured the link at some earlier point in time. Brands that treated the carrier purely as a printing decision routinely discover afterwards that somebody else holds the data and the customer relationship it produced. Resolution services are consequently now being bought quite separately from the printing itself, which splits apart a category that most suppliers had simply assumed would stay bundled together indefinitely.
Market Impact: Item identity covers just 13%

Market Opportunities and Growth Drivers

Retail Mandates Push Two-Dimensional Carriers Onto Packaging

Major grocery and general merchandise retailers have now set firm dates for accepting two-dimensional carriers at checkout in place of linear barcodes, which obliges every supplier packing for those shelves to change artwork whether or not they want the additional digital capability. Once the carrier is printed, the marginal cost of pointing it at something genuinely useful is close to zero against the 0.2 cents per item already spent. That is the reason a straightforward checkout upgrade keeps producing consumer engagement projects that nobody involved had originally planned for at all.
Market Impact: Compliance costs 0.2 cents printed

Item Level Identity Extends Beyond Its Early Categories

Only around 13% of retail units currently carry an individually resolvable digital identity rather than a shared product code, and that share is rising fastest wherever authentication, recall precision or resale value justify the additional cost involved. Apparel, pharmaceuticals and cosmetics lead the way here by some distance, with passive tag pricing near 4 cents making unit-level identity viable in categories that could never previously have justified it. India compounds at 16.9%, ahead of every other market, on pharmaceutical serialisation requirements and rapid retail formalisation working together at the same time.
Market Impact: Reprinting spans 1000s of items

Market Restraints and Challenges

Minimum Compliance Satisfies The Regulation Cheaply

A brand can meet a product passport obligation with the cheapest conforming carrier pointing at a static page containing the mandated fields, and a considerable number intend to do exactly that. The root cause is that the regulation specifies what information must be accessible rather than requiring any particular experience or platform behind it. Commercially this caps spending well below what suppliers have been forecasting. Mitigation runs through authentication, recall precision and resale value, each of which gives a brand an actual commercial reason to spend beyond the regulatory minimum.
Market Impact: Scope expands within 30 months

Fragmented Standards Leave Brands Waiting To Commit

Carrier formats, data models and resolution conventions are still being settled between standards bodies, retailers and regulators, which leaves brand owners reluctant to commit artwork changes across thousands of stock keeping units. The root cause is that several bodies each holding legitimate authority are working toward overlapping specifications at quite different speeds. Commercially this delays deployment even in places where the budget has already been approved. Mitigation runs through carrier formats satisfying several requirements at once, and through resolution layers that can redirect without any artwork being reprinted at all.
Market Impact: Only 61% of scans resolve internally
4 additional market trends, 3 additional growth drivers, and 2 additional restraints and challenges are covered in the full report. Contact sales@marketmindsadvisory.com to access the complete intelligence.

Segment CAGR and Growth Architecture

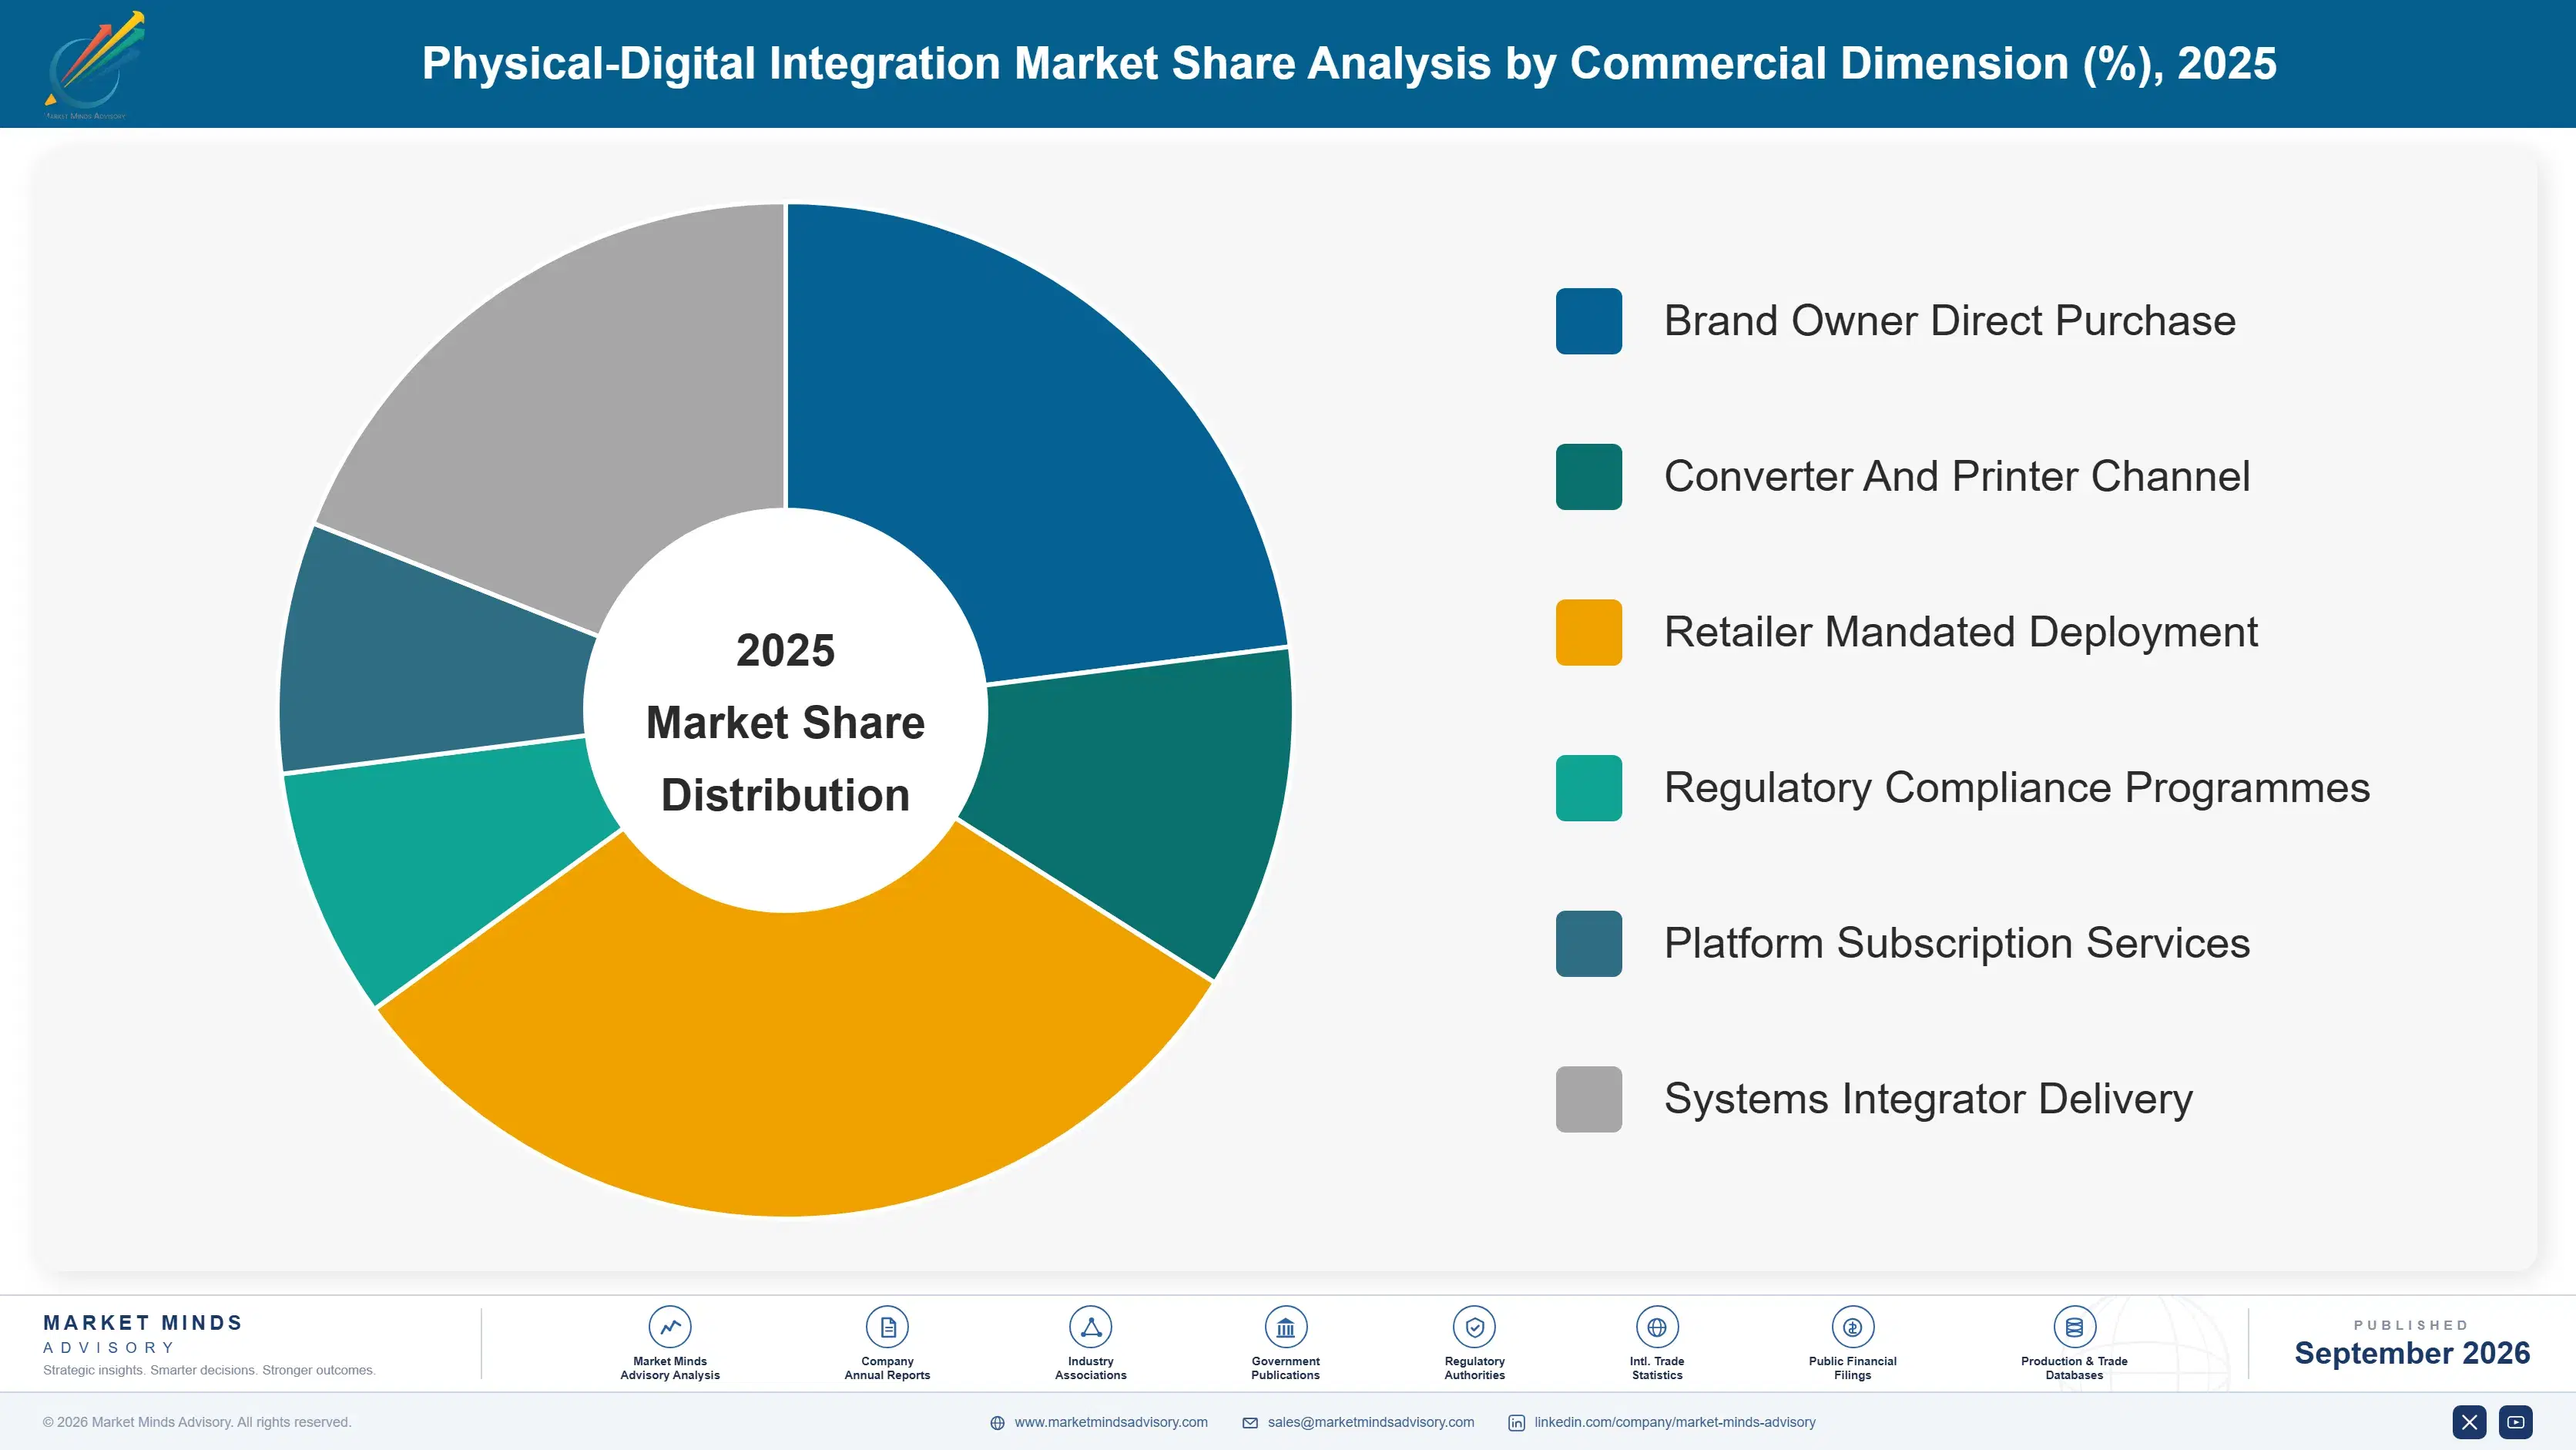
Segmentation follows technology class, since each carries different unit economics, different regulatory exposure and a different answer to who controls the resolution behind it. Six classes cover the market, from two-dimensional carriers and connected packaging electronics through vision recognition, radio tagging, watermarking and linear barcodes. End-use industry and commercial route are separate dimensions handled elsewhere.
physical-digital-integration-market-market-share-analysis-1789994996259

Two-Dimensional Data Carriers And Resolver Services

Two-dimensional carriers and the resolution services behind them grow at 17.7%, half again the market rate of 11.8%, on a combination of regulation and retail mandate that happened to arrive at roughly the same moment. The printed carrier itself costs around 0.2 cents at production volume, so essentially all of the commercial value sits instead in the resolution service, the data record and the content behind the scan. That split is why the segment is growing far faster than the printing volume alone would suggest, and why suppliers whose business is printing find themselves competing for a steadily shrinking share of what the customer actually spends across the whole project.
CAGR 17.7%

Connected Packaging And Smart Label Electronics

Connected packaging and smart label electronics compound at 15.2% on categories where the pack does something beyond identifying itself: tamper evidence, temperature history, opening detection or authentication that a printed code cannot provide. Unit costs remain far above a printed carrier, so deployment concentrates where the product value or the risk justifies it, principally across pharmaceuticals, spirits, cosmetics and higher value consumer electronics. The commercial pattern differs from printed carriers in one important way. These decisions are made by brand protection and quality functions rather than by marketing teams, and those buyers evaluate on measured incident reduction rather than on any engagement figure. Deployment consequently follows product value and risk exposure closely.
CAGR 15.2%
Full segment breakdown across 6 segments available in the complete report.

Regional Architecture and Country Demand Map

Western Europe holds 29% of spending, above the usual band ceiling, because European product passport regulation is the only binding requirement anywhere forcing item-level digital identity onto products at real scale. North America follows at 25% on retail carrier mandates rather than on any regulation.

Western Europe

Western Europe takes 29% of spending, above the 26% band ceiling, and the reason is regulatory rather than commercial: European product passport rules are the only binding requirement anywhere forcing item-level digital identity onto products at scale. Textiles, batteries and electronics enter scope on a published timetable, with roughly 30 months until the next substantial expansion. German, French and Italian brand owners are consequently running compliance programmes rather than marketing pilots. Growth at 10.8% is the slowest of any region despite that, because the installed carrier base was already the largest anywhere here before the regulation arrived at all. Compliance here largely replaces earlier experimentation rather than adding on top of it.
Share: 29% | CAGR: 10.8% (2026 to 2036)

North America

Twenty-five percent of spending reaches North America, driven by retail mandates rather than by any regulation of comparable force. Major grocery and general merchandise chains set dates for accepting two-dimensional carriers at checkout, which obliges every supplier packing for those shelves to change artwork regardless of interest in the capability. Zebra Technologies, Digimarc and Impinj all hold substantial positions here. Pharmaceutical serialisation requirements add a separate and long-established driver in a category that has marked at item level for years. Growth at 11.4% sits marginally below the global rate, on a market where carrier penetration was already comparatively high before the retail mandates arrived. Canadian adoption follows the same retail requirements closely.
Share: 25% | CAGR: 11.4% (2026 to 2036)
Regional intelligence for 5 additional markets available in the complete report: East Asia, South Asia and Pacific, Latin America, Middle East and Africa, Eastern Europe. Contact sales@marketmindsadvisory.com.
physical-digital-integration-market-country-cagr-analysis-1789994996788

Where This Category Is Won

The printed carrier costs a fraction of a cent, the regulation specifies a minimum that a brand can meet very cheaply indeed, and almost all of the commercial value sits in the resolution service rather than in anything actually printed. The four levers below follow those facts rather than any argument about carrier formats.

Sell Resolution Ownership Rather Than Printed Carriers

A printed two-dimensional carrier costs around 0.2 cents at production volume, which is not a number any customer negotiates hard over, while the resolution service behind it carries the data, the content and the customer relationship. Around 61% of scans currently land on the brand owner's own system, meaning a substantial share reach somebody else. Suppliers selling only the printing are competing for much the cheapest element of the whole project. Suppliers selling resolution are selling the part of it that the brand will still be paying for in 10 years time.
Market Impact: Only 61% of consumer scans resolve internally today

Call On Regulatory Affairs Rather Than Marketing

Product passport obligations are approved by regulatory affairs against a published timetable, with roughly 30 months until the next substantial scope expansion, while connected packaging pilots were approved by brand teams against engagement targets nobody audited closely. Those are entirely different buyers carrying different budgets, different evaluation criteria and quite different tolerance for delay. Suppliers whose commercial organisation still calls exclusively on marketing are pitching to somebody who no longer controls the decision, and are losing programmes to competitors who worked out where the budget authority had actually moved to.
Market Impact: Passport compliance deadlines arrive within just 30 months

Give Brands A Reason To Exceed The Minimum

A brand can satisfy the regulation using a conforming carrier pointing at a static page, spending very little at all beyond the 0.2 cents already committed to the printing. Authentication, recall precision and resale verification each supply a commercial reason to spend more than that, and each is measurable in a way engagement metrics never genuinely were. Suppliers presenting compliance alone are selling into a budget the customer wants to minimise. Suppliers presenting measured incident reduction are selling into one that the customer has a genuine interest in growing instead.
Market Impact: Minimum compliance costs only 0.2 cents per item

Build Redirection That Survives Format Change

Carrier formats, data models and resolution conventions are still being settled between several bodies working toward overlapping specifications at different speeds, and brands are reluctant to commit artwork changes across 5,000 or more stock keeping units into that uncertainty. A resolution layer that can redirect without any reprinting removes the risk that a format decision taken today proves wrong later on. That capability is worth more to a hesitant customer than any argument about which standard will eventually prevail, and it converts a deferred decision into a signed one considerably faster.
Market Impact: Artwork changes span fully 5,000 stock keeping units

Who Controls the Margin Pool

Five suppliers hold just 34% of revenue in this category, which is low for a technology market and reflects that it spans label printing, silicon, imaging and platform software rather than any single technology family. Avery Dennison, Zebra Technologies, Digimarc, Impinj and Sato Holdings lead. All participants here are assessed on physical-digital linking hardware, media and platform revenue rather than on broader corporate scale.
Competition is splitting along a line that did not previously exist, between suppliers who print or manufacture the carrier and those who operate the resolution service behind it. The printing side competes on cost at 0.2 cents per item and on production integration. The resolution side competes on data ownership, content management and compliance reporting, which are entirely different capabilities sold to entirely different buyers inside the same customer.

Pressure is emerging from software platform suppliers holding no manufacturing capability at all, reaching the resolution buyer directly and leaving the printing to whoever the customer already happens to use. Rankings shift within compliance-driven programmes rather than in marketing pilots, particularly across the European categories entering passport scope on the published timetable.
physical-digital-integration-market-company-positioning-matrix-1789994997330

Competitive Moat and Risk Dimensions

AVERY DENNISON

Moat: Converting Scale And Integration

Avery Dennison applies carriers inside label and packaging converting operations already embedded in customer production, so the marking arrives as part of material supply rather than as a separate project anybody must manage. That position is hard to attack because it requires converting capacity at comparable scale rather than any particular technology. The relationship exists before the digital requirement does.
AVERY DENNISON

Risk: Value Migrating To Resolution

The printed carrier costs around 0.2 cents while the resolution service behind it carries the data, the content and the customer relationship over many years. Software platform suppliers with no manufacturing are reaching that buyer directly and leaving the printing to whoever the customer already uses. Converting scale defends a shrinking share of what the customer actually spends.
DIGIMARC

Moat: Resolution Layer Position

Digimarc operates on the side of the category where value is accumulating, selling identity resolution and the data behind the scan rather than any physical marking at all. That places the company in the conversation about data ownership, where brands are increasingly focused, and it requires no converting capacity. Suppliers built around manufacturing find that position hard to reach.
DIGIMARC

Risk: Compliance Minimalism Exposure

A brand can meet a product passport obligation with a conforming carrier and a static page, spending almost nothing on resolution capability of any kind. That is precisely what many intend, and it caps the addressable spend well below supplier forecasts. Defending the position requires giving brands authentication, recall or resale reasons to exceed the regulatory minimum.

Players Tracked

Prominent Players

Avery Dennison
Zebra Technologies
Digimarc
Impinj
Sato Holdings

Other Key Players

Honeywell
TSC Auto ID Technology
Toshiba Tec
Brother Industries
Markem-Imaje
Domino Printing Sciences
Videojet Technologies
Scandit
Cognex
Datalogic
NXP Semiconductors
Identiv
Leonhard Kurz
Authentix
Checkpoint Systems

Recent Developments

MARCH 2025

European Passport Scope Expansion Confirmed For Further Categories

European authorities confirmed additional product categories entering digital product passport scope on a published timetable, a regulatory development rather than any corporate transaction. Compliance obligations are approved by regulatory affairs against fixed dates rather than by brand teams against engagement targets, which changes the buyer and the budget together.
Signal: A single date written into regulation moves budget authority from marketing across to regulatory affairs immediately.
SEPTEMBER 2024

Retail Chains Set Dates For Two-Dimensional Checkout Acceptance

Major grocery and general merchandise retailers set dates for accepting two-dimensional data carriers at checkout in place of linear barcodes, a commercial mandate rather than any merger or acquisition. Suppliers packing for those shelves must change artwork regardless of whether they want the additional digital capability the carrier makes possible.
Signal: Once the carrier is being printed anyway, pointing it somewhere genuinely useful costs almost nothing more.
JULY 2025

Indian Pharmaceutical Serialisation Requirements Extend Further

Indian authorities extended item-level serialisation requirements across additional exported pharmaceutical categories, a regulatory development rather than any commercial transaction. Indian brand owners adopt without the legacy carrier base that slows change in older markets, which lets them specify current formats directly rather than migrating from something older.
Signal: Markets without any legacy carrier base adopt the current formats faster than established ones can migrate.

What Item Identity Costs

Substrate and label material accounts for roughly 29% of delivered cost in printed carrier applications, sourced from paper and film converters supplying at very large scale. Printing equipment amortisation and ink absorb around 21%. Silicon and antenna material take about 34% in radio tagging applications specifically, and platform hosting with data operations absorbs the balance across resolution services.
Paper and specialty film pricing moved sharply through 2022 and 2023 as energy costs fed into pulp and coating production across Europe, and converters passed most of that through to brand owners on annual contracts. Avery Dennison Annual Report 2023 and Sato Holdings Annual Report 2023 both record raw material and energy cost as principal operating variables through the period. Contracted material supply absorbed the movement considerably better than spot purchasing.

The competitive disadvantage mechanism is where a supplier sits in the value split rather than what materials cost. A printing business competes on 0.2 cents per item against material costs it does not control, while a resolution business carries almost no material exposure at all. Exposure concentrates entirely among converters and equipment suppliers, and not at all among the platform suppliers competing for the same customer budget.
physical-digital-integration-market-cost-volatility-analysis-1789994997525

Contract Substrate Supply Across Multi-Year Terms

Substrate and label material runs around 29% of delivered cost in printed applications, and pricing moved sharply when energy fed into pulp and coating production. Multi-year contracted supply at agreed pricing removes exposure to a cost line dominating a business already competing at 0.2 cents per item. Converters buying on spot terms carry a disadvantage nothing recovers.

Move Revenue Toward Resolution And Platform Services

Printed carriers carry material exposure of roughly 29% while resolution services carry almost none at all, and the resolution side is where customer spending is actually growing. Shifting revenue mix toward platform and data services reduces material sensitivity considerably. The obstacle is organisational rather than technical, since converting businesses rarely hold software commercial capability.

Design Radio Tag Antennas For Material Substitution

Silicon and antenna material account for around 34% of radio tagging cost, and antenna conductor pricing has moved considerably with metals markets over recent years. Designs allowing alternative conductor materials preserve margin when pricing moves against the primary choice. Suppliers locked to one antenna material discover during a price move that requalification takes longer than the pricing cycle does.

Portfolio Architecture for Margin Defence

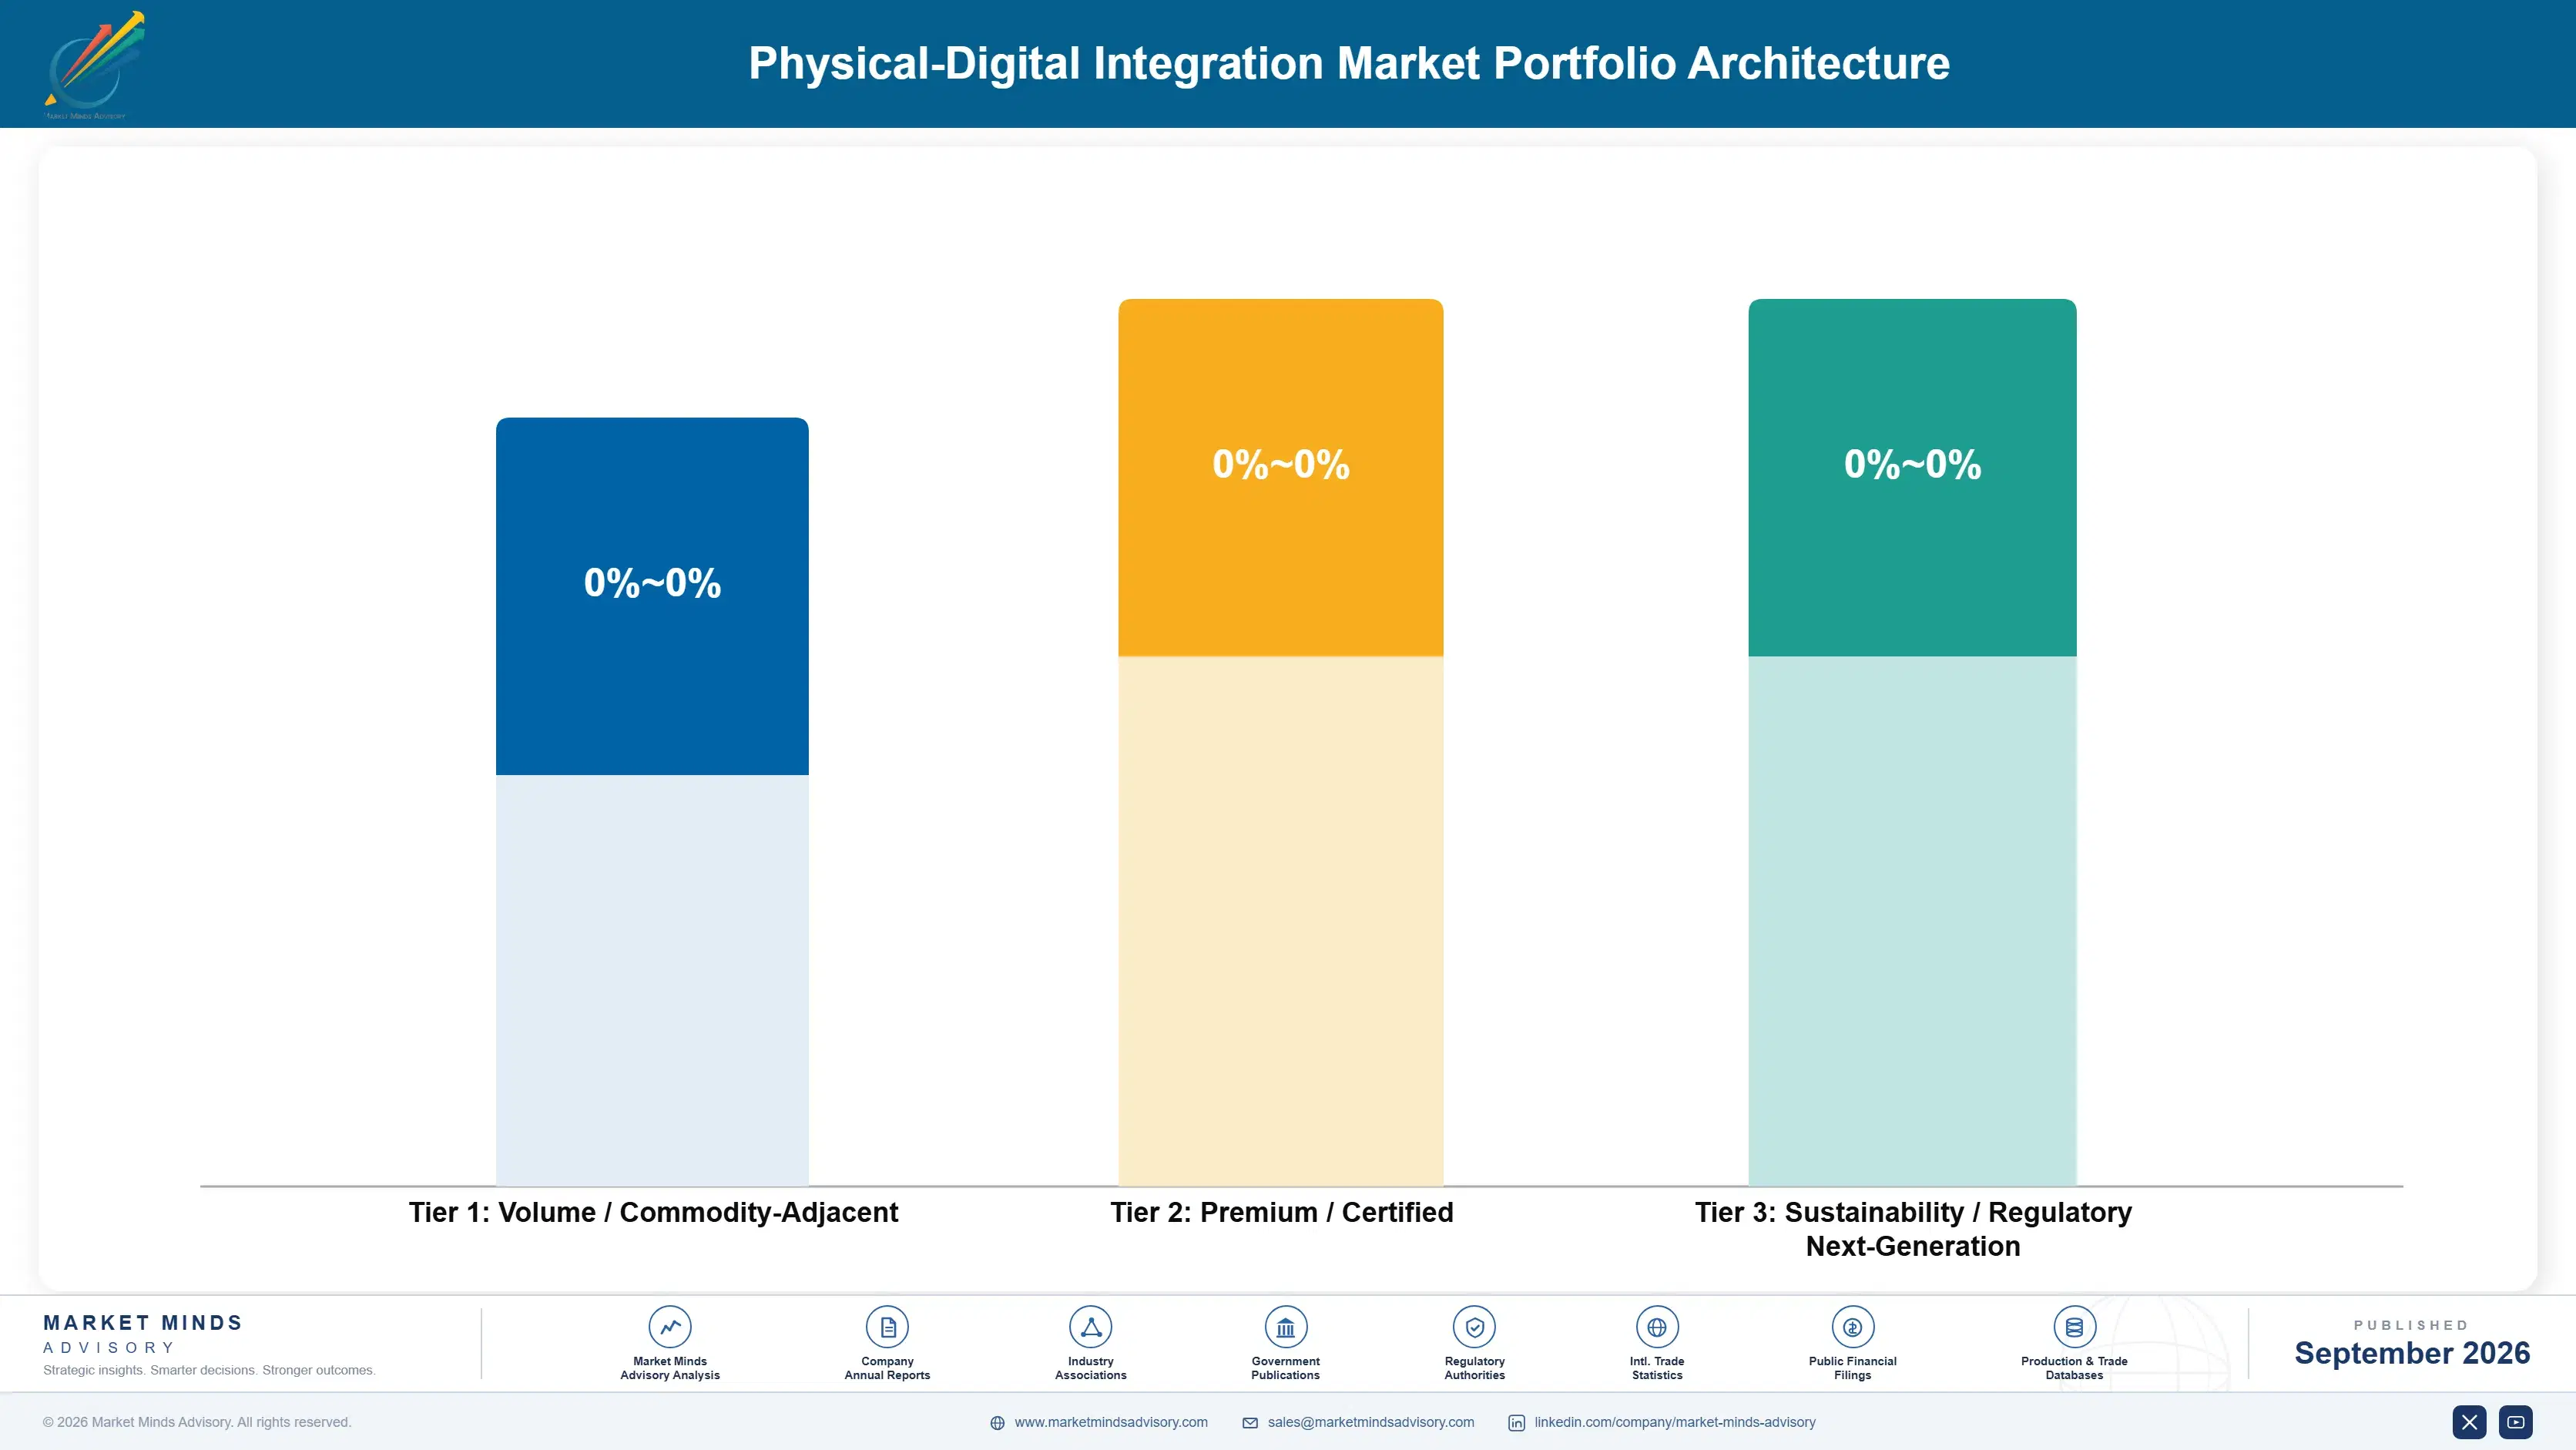
Margin architecture separates almost entirely on whether the revenue is material or software. Linear barcode printing and standard label supply earn least, competing on material cost at very high volume. Radio tags and connected label electronics sit above on silicon and design content. Resolution services, authentication platforms and compliance reporting earn most, because none of them carries material cost and all recur annually.
The volume versus premium tension runs between converting and platform rather than between carrier types. A converter earns thin margin on 0.2 cents per item and holds the customer through production integration. A platform earns many times that on a fraction of the project value and holds the customer through data. Suppliers positioned only in converting are defending the relationship while somebody else takes the economics.

High-value pools concentrate in resolution services and authentication platforms, neither of which is reached through printing capability or converting scale. Both are sold to regulatory affairs and brand protection functions rather than to packaging procurement. Reaching them requires commercial capability that converting businesses have historically not built, which is why platform entrants without manufacturing keep taking that ground.

Volume / Commodity-Adjacent

Linear barcode printing, standard label supply and basic two-dimensional carrier printing, competing on material cost at very high volume. The ten point spread separates converters holding contracted substrate supply from those exposed to spot material pricing across their whole book.
Gross Margin: 18% to 28%

Premium / Certified

Radio tags, connected label electronics and covert marking materials, where silicon content, design capability and verification performance determine selection. The twelve point spread tracks how much of the value is proprietary design rather than assembled from components other suppliers also purchase.
Gross Margin: 34% to 46%

Sustainability / Regulatory / Next-Generation

Resolution services, authentication platforms and compliance reporting software, carrying no material cost and recurring annually against a regulatory obligation. The eighteen point spread reflects how much of the offer is genuine platform rather than reporting built per customer.
Gross Margin: 62% to 80%
physical-digital-integration-market-portfolio-architecture-1789994998022

High-value Sub-segments and Strategic Watch-out

Two-Dimensional Data Carriers And Resolver Services

Grows at 17.7% on product passport regulation and retail checkout mandates arriving at more or less the same moment. The eighteen point spread reflects platform depth. The printed carrier itself costs 0.2 cents, so nearly all of the commercial value sits in the resolution service.
Gross Margin: 62% to 80%

Connected Packaging And Smart Label Electronics

Grows at 15.2% wherever the pack must do more than simply identify itself, through tamper evidence, temperature history or genuine product authentication. The twelve point spread here reflects proprietary design content. Brand protection and quality functions buy this category rather than any marketing team does.
Gross Margin: 34% to 46%

Computer Vision Product Recognition

Grows at 13.6% as retail shelf monitoring and checkout-free store formats both identify products without requiring any printed carrier on the product at all. The twelve point spread here reflects recognition model performance. It competes directly with printed marking rather than complementing it across several important applications.
Gross Margin: 34% to 46%

Linear Barcode Systems

Grows at only 2.4%, the slowest of all six technology classes, as retail checkout mandates move acceptance across toward two-dimensional carriers on published dates. The ten point spread here reflects substrate supply contracting. Enormous installed printing volume keeps it commercially relevant for some years yet.
Gross Margin: 18% to 28%

Why Resolution Choices Persist

The annuity here is artwork rather than contract. Once a carrier is printed across a product range, changing where it points means either reprinting thousands of stock keeping units or operating a redirection layer, and reprinting is the expensive option nobody chooses willingly. Packaging artwork cycles run years between revisions. A resolution service selected during a compliance programme is embedded far longer than its commercial agreement suggests.
Depth varies considerably by what the scan actually does. A resolution service holding compliance records and customer interaction data is deeply embedded, since the data does not move easily and the regulatory record must stay accessible. Authentication platforms are similar. Simple redirection to a marketing page is barely embedded at all, and brands change it without much thought, which is why suppliers should be careful about which of these they actually sold.

The buyer has moved from marketing toward regulatory affairs and brand protection, and that changes the entire conversation. A brand team evaluated engagement rates against pilot budgets. A regulatory function evaluates conformance against a published deadline. A brand protection function evaluates measured incident reduction. Suppliers still calling on marketing are addressing the one buyer who no longer holds the budget.
physical-digital-integration-market-end-use-penetration-index-1789994998520

What Decides These Programmes

These are among the four positions where our research anticipates prominent divergence between winners and laggards over the coming forecast period. Each is grounded in the demand model, the regulatory perimeter, and the announced capacity pipeline.
01 / RESOLUTION OWNERSHIP SELLING

Sell The Destination, Not The Printed Code

A printed two-dimensional carrier costs around 0.2 cents at full production volume, which is not a figure any procurement function spends real time negotiating over, while the resolution service behind it carries the data, the content and the customer relationship for years afterwards. Roughly 61% of consumer scans currently land on the brand owner's own system, meaning a substantial share reach somebody else entirely. Suppliers selling only the printing are competing hard for much the cheapest element of the whole project.
02 / REGULATORY BUYER COVERAGE

Follow Budget Authority To Compliance Functions

Product passport obligations are approved by the regulatory affairs function against a published timetable with roughly 30 months until the next substantial scope expansion, while connected packaging pilots were approved by brand teams against engagement targets that nobody ever properly audited. Those are entirely different buyers carrying different budgets, evaluation criteria and tolerance for delay. Suppliers whose commercial organisation still calls exclusively on marketing are pitching to somebody who no longer controls either the decision or the money sitting behind it.
03 / BEYOND MINIMUM POSITIONING

Give Brands A Commercial Reason To Spend

A brand can satisfy a product passport obligation with the cheapest conforming carrier pointing at a static page, spending very little at all beyond the 0.2 cents per item already committed to the printing itself. Authentication, recall precision and resale verification each supply a commercial reason to spend beyond that minimum, and each is measurable in a way that engagement metrics never genuinely were. Suppliers presenting compliance alone are selling into a budget that the customer has every intention of minimising.
04 / FORMAT RISK ABSORPTION

Let Brands Commit Before Standards Settle

Carrier formats, data models and resolution conventions are still being settled between several bodies working toward overlapping specifications at different speeds, which leaves brand owners genuinely reluctant to commit artwork changes across many thousands of stock keeping units. A resolution layer that redirects without any reprinting at all removes the risk that a format decision taken now proves wrong later. That capability converts a deferred decision into a signed one considerably faster than any argument about which standard will eventually prevail.

Engagement Snapshot From the Field

A live engagement with an industry participant carrying material or product regulatory and market exposure ahead of a defining policy shift, showing how our research translates into a defensible multi-year portfolio strategy.
MARKET MINDS ADVISORY · CLIENT ENGAGEMENT SUMMARY
Physical-Digital Integration Producer Strategic Portfolio Review and Transition Roadmap 2026·Investment Scenario on Physical-Digital Integration Exposure Evaluation 2025-26
CLIENT PROFILE
A European apparel brand selling across fourteen countries, facing product passport obligations on a published timetable and running an unrelated connected packaging pilot in its marketing function. The two programmes had no contact with each other. Nobody had established where existing product scans resolved to, and the answer turned out to matter considerably more than anybody expected.
STRATEGIC CHALLENGE
Marketing wanted to extend its engagement pilot across the range and treat compliance as a by-product. Regulatory affairs wanted a minimum conforming solution delivered against the deadline, with no interest in engagement at all. Procurement wanted the cheapest carrier available. Three functions were pursuing three incompatible answers and the deadline applied to all of them.
MMA APPROACH
MMA established where scans on existing product actually resolved, which nobody internally had measured, then modelled compliance-minimum against extended options including authentication and resale verification. We assessed resolution service options on data ownership terms rather than on features, and mapped the passport timetable against the brand's artwork revision cycles. Work drew on 47 expert interviews conducted in Q4 2025.
KEY FINDINGS
  1. Around 4 in 10 scans on existing product resolved to a third-party service rather than to the brand, which nobody inside the business had realised was happening.
  2. The compliance minimum cost close to nothing beyond printing, but committed the brand to artwork that would need reprinting if the destination ever changed later.
  3. Resale verification produced measurable commercial return in the brand's secondhand channel, unlike the engagement pilot which had produced none (client-reported, unverified by MMA).
  4. Two of the four resolution services shortlisted claimed rights over scan data that the brand's own legal function found genuinely unacceptable on review.
CLIENT PROFILE
A European apparel brand selling across fourteen countries, facing product passport obligations on a published timetable and running an unrelated connected packaging pilot in its marketing function. The two programmes had no contact with each other. Nobody had established where existing product scans resolved to, and the answer turned out to matter considerably more than anybody expected.
STRATEGIC CHALLENGE
Marketing wanted to extend its engagement pilot across the range and treat compliance as a by-product. Regulatory affairs wanted a minimum conforming solution delivered against the deadline, with no interest in engagement at all. Procurement wanted the cheapest carrier available. Three functions were pursuing three incompatible answers and the deadline applied to all of them.
MMA APPROACH
MMA established where scans on existing product actually resolved, which nobody internally had measured, then modelled compliance-minimum against extended options including authentication and resale verification. We assessed resolution service options on data ownership terms rather than on features, and mapped the passport timetable against the brand's artwork revision cycles. Work drew on 47 expert interviews conducted in Q4 2025.
KEY FINDINGS
  1. Around 4 in 10 scans on existing product resolved to a third-party service rather than to the brand, which nobody inside the business had realised was happening.
  2. The compliance minimum cost close to nothing beyond printing, but committed the brand to artwork that would need reprinting if the destination ever changed later.
  3. Resale verification produced measurable commercial return in the brand's secondhand channel, unlike the engagement pilot which had produced none (client-reported, unverified by MMA).
  4. Two of the four resolution services shortlisted claimed rights over scan data that the brand's own legal function found genuinely unacceptable on review.
RECOMMENDED STRATEGY
Phase 1: Phase one: deploy a redirection layer so the printed carrier destination can change without reprinting artwork across the entire product range. Phase 2: Phase two: select the resolution service on data ownership terms rather than on features, since two shortlisted options failed legal review outright. Phase 3: Phase three: fund resale verification rather than engagement work, because it produced measurable commercial return where the marketing pilot demonstrably had not.
OUTCOME
The brand deployed a redirection layer before printing anything and met the passport deadline without committing to a permanent destination (client-reported, unverified by MMA). Scan resolution moved substantially back to brand-owned systems. Resolution service selection now goes through legal review on data terms, which is the change that outlasted the compliance programme itself.

Frequently Asked Questions

Foundational context covering the market sizes, CAGR, scope, country, region and competition that inform every finding below. This section is provided to cover basics and most often pre-purchase conversations, answered from the MMA Primary Research Dataset.

What is the current size of the Physical-Digital Integration Market?

Global value reaches USD 10.5 billion in 2026, measured as linking hardware, media and platform revenue across six technology classes. The 2025 base is USD 9.4 billion.

How large will the Physical-Digital Integration Market be by 2036?

The market reaches USD 32.0 billion by 2036, an increase of USD 21.5 billion across the forecast period. That represents 3.05 times expansion from the 2026 base.

What is the CAGR for the Physical-Digital Integration Market 2026 to 2036?

The base case runs at 11.8% annually, with a bull case at 13.1% if passport scope widens faster than published and a bear case at 10.5% if brands satisfy the regulation minimally.

Which segment is growing fastest?

Two-dimensional data carriers and resolver services grow at 17.7%, half again the market rate of 11.8%. European passport rules require a conforming data carrier on products within scope.

Who are the major companies in the Physical-Digital Integration Market?

Avery Dennison, Zebra Technologies, Digimarc, Impinj and Sato Holdings lead on linking hardware, media and platform revenue, together holding 34%. Honeywell and Scandit hold smaller positions.

Which country is growing fastest?

India leads at 16.9%, on pharmaceutical serialisation requirements for exported medicines and on retail formalisation proceeding at pace. China and Brazil both follow behind it.

Report Segmentation Architecture

The full report scope spans multiple orthogonal segmentation dimensions, with cross-tabulated demand data provided for each dimension pair. Coverage extends further to regional breakdowns, trend trajectories, and the competitive detail needed to support segment-level decision-making.

By Technology Class

  • Two-Dimensional Data Carriers And Resolver Services
  • Connected Packaging And Smart Label Electronics
  • Computer Vision Product Recognition
  • RFID And NFC Tagging Systems
  • Digital Watermarking And Covert Marking
  • Linear Barcode Systems

By End-Use Industry

  • Apparel And Footwear
  • Food And Beverage
  • Pharmaceuticals And Medical Products
  • Consumer Electronics
  • Cosmetics And Personal Care
  • Automotive Parts And Components

By Commercial Dimension

  • Brand Owner Direct Purchase
  • Converter And Printer Channel
  • Retailer Mandated Deployment
  • Regulatory Compliance Programmes
  • Platform Subscription Services
  • Systems Integrator Delivery

By Region

  • North America
  • Western Europe
  • East Asia
  • South Asia and Pacific
  • Latin America
  • Middle East and Africa
  • Eastern Europe

Scope, Methodology, and Coverage

Every figure in this report is reproducible from documented input assumptions. The scope below maps the historical period, the forecast horizon, the segmentation dimensions, and the countries covered, alongside the underlying primary and qualitative methodology.
Historical Period
2020 to 2025
Forecast Period
2026 to 2036
Base Year
2025 (USD billions; MMA Primary Research Dataset, September 2026)
Market Definition
This report covers technologies creating a machine-readable link between a physical item and a digital record, by technology class: two-dimensional data carriers and resolver services, connected packaging and smart label electronics, computer vision product recognition, RFID and NFC tagging systems, digital watermarking and covert marking, and linear barcode systems. It excludes point-of-sale terminals and payment infrastructure, general enterprise data management software, industrial sensors not attached to individual items, and logistics execution systems.
Quantitative Units
USD millions, hardware, media and platform revenue basis; marked item volumes; carrier cost per item in cents; scan resolution ownership as a percentage; regulatory scope deadlines in months.
Segmentation Dimensions
Technology class; end-use industry; commercial purchase route and buyer function; geography across seven regions.
Regions Covered
North America, Western Europe, East Asia, South Asia and Pacific, Latin America, Middle East and Africa, Eastern Europe
Countries Covered
Germany, France, Italy, Spain, Netherlands, United Kingdom, Poland, Czechia, United States, Canada, Mexico, Brazil, Argentina, China, Japan, South Korea, India, Australia, Saudi Arabia, South Africa.
Key Companies Profiled
Avery Dennison, Zebra Technologies, Digimarc, Impinj, Sato Holdings, Honeywell, Toshiba Tec, Brother Industries, Markem-Imaje, Domino Printing Sciences, Scandit, Cognex, Datalogic, NXP Semiconductors, Checkpoint Systems.
Quantitative Methodology
Primary survey, n=3,800 respondents, Q4 2025, six countries; demand-side model with trade association cross-validation
Qualitative Methodology
47 expert interviews, Q4 2025; applied to validate demand model assumptions, identify emerging dynamics, and assess competitive positioning
Report Format
PDF and XLSX data workbook (Word format preview document)
Publisher
Market Minds Advisory
Report Code
MMA-2026-TEC-701
Published
September 2026
Contact
sales@marketmindsadvisory.com | www.marketmindsadvisory.com

Purchase the full Physical-Digital Integration Market Report (2026 to 2036).

This report sizes the global physical-digital integration market from 2026 to 2036 across six technology classes, six end-use industries and seven regions. It explains why a carrier costing 0.2 cents per item has made resolution ownership the commercial question, with roughly 61% of consumer scans currently landing on brand-owned systems. European product passport obligations are analysed as the force moving budget authority from marketing to regulatory affairs, against a scope timetable quantified in months. Cost composition is sourced to company annual reports. Regional analysis explains why Western Europe leads at 29% of spending.
Six technology classes sized through to 2036
Carrier economics quantified against resolution service value
Product passport timetable mapped to category exposure
Twenty named suppliers assessed on linking revenue
Four revenue levers with quantified commercial impact
Anonymised apparel brand compliance engagement documented in full

Built For The People Who Decide

From boardroom strategy to bench-side execution, this report is read cover-to-cover by leaders shaping the next decade of their industry, turning demand scenarios, market dynamics and valuation benchmarks into decisions.
CXOs/ Presidents/ VPs/ Managers
M&A and Corporate Development
Strategy Teams and R&D Heads
Procurement and Product Directors
Regulatory and Compliance Leaders
Investor Relations and Equity Analysts