Market Minds Advisory
Photonic Sensor Market

Photonic Sensor Market: Optical Sensing Technologies for Automotive, Industrial, and Healthcare Applications.

Autonomous vehicle perception requirements and industrial process monitoring precision demands are pulling photonic sensors past conventional electronic alternatives, rewarding manufacturers who cut cost per channel while meeting automotive-grade reliability standards.

Lead Analyst

Published

September 2026

Make Smarter Decisions with Customized Research Insights

Request a free sample report and evaluate market opportunities, growth trends, and competitive dynamics relevant to your business needs.

2025 MARKET VALUE$5.8BMarket Size 2025
2036 FORECAST VALUE$17.4BBase Case , 2026 to 2036
CAGR 2026 TO 203610.5 %Bull 11.8% / Bear 9.2%
INCREMENTAL OPPORTUNITY$11.0BNet 10- year value creation
EXPANSION MULTIPLE2.71x2036 value over 2026 base
Strategic Levers
M&A Pipeline
Regional Outlook
Country Rankings
Competitive Intelligence
Segmental Deep-dive
Call-Us : 91 93563 13602

Executive Snapshot and Market Trajectory.

Photonic sensors have moved from specialized instrumentation into mainstream automotive and industrial procurement, as autonomous vehicle programs and factory automation deployments demand optical measurement precision and range that conventional electronic sensors simply cannot deliver at comparable cost per channel today across most current applications and use cases.
Automotive LiDAR programs and industrial machine vision installations are the primary commercial forces here, concentrating early scale volume in China and the United States, where autonomous vehicle development and factory automation investment both run furthest ahead. Consumer electronics time-of-flight sensors and medical optical coherence tomography devices absorb a meaningfully growing share of unit volume, since both applications benefit from continued cost reduction in laser diode and photodetector components driven by automotive-scale manufacturing.
Competitive intensity spans a fragmented field of specialized sensor manufacturers, automotive-grade component suppliers, and vertically integrated technology companies developing photonic sensing in-house for their own platforms, a structure considerably more dispersed than most semiconductor categories maintain today. Falling component costs driven by rising automotive LiDAR production volume are pulling photonic sensing into cost-sensitive consumer and industrial applications that previously could not justify the premium price point.
Market Definition
The Photonic Sensor Market covers devices that use light generation, transmission, or detection to measure distance, presence, chemical composition, or physical properties, including LiDAR, time-of-flight, fiber optic, and optical coherence tomography sensors sold as standalone components or integrated modules. It excludes conventional camera image sensors used purely for visible-light photography and software-only image processing systems that do not incorporate dedicated photonic sensing hardware.
Base Year Value
$5.8B in 2025 (MMA Primary Research Dataset, September 2026)
Forecast Period
2026 to 2036, eleven discrete annual values
CAGR
10.5% base case. Bull 11.8%. Bear 9.2%.
Fastest Growth Segment
LiDAR Photonic Sensors for Autonomous Vehicle Perception Systems: 17.5% CAGR
Fastest Growth Country
China: 13.0% CAGR
Fastest Growth Region
South Asia and Pacific: 12.5% CAGR
Largest Region
East Asia: 30% of 2025 global value
Market Leaders
Hamamatsu Photonics, Sony Semiconductor Solutions, ams OSRAM, Hesai Group, and Lumentum Holdings lead the global Photonic Sensor Market. Source: MMA Primary Research Dataset, July 2026, and company disclosures.
Primary Survey
n=3,800 procurement and R&D decision-makers, Q4 2025, six countries
Methodology
Demand-side build-up, cross-validated against public data, 47 expert interviews

Photonic Sensor Market Forecast Scenarios

photonic-sensor-market-size-forecast-scenario-1790002614478
Photonic sensor demand grew steadily between 2020 and 2025 as industrial machine vision and early automotive driver assistance programs adopted optical sensing alongside conventional radar and camera systems, while medical device makers layered optical coherence tomography into a growing range of diagnostic equipment. The historical growth rate of 9.0% reflects broadening industrial adoption well before autonomous vehicle programs reached meaningful production scale.
The base case rests on three commercial mechanisms: autonomous vehicle programs scaling LiDAR deployment from pilot fleets to production vehicle platforms as component costs fall with manufacturing volume, industrial automation installations adding optical sensing points per production line for quality inspection and precision measurement, and medical device manufacturers integrating optical coherence tomography and photonic biosensing into a broader range of diagnostic equipment. Together these push photonic sensing from a specialized instrumentation category into mainstream component status through 2036.
A bull scenario centers on faster-than-expected robotaxi and autonomous trucking fleet deployment, which requires multiple LiDAR units per vehicle and would pull volume forward well ahead of the base case timeline. The principal bear risk is that camera-and-radar-only autonomous vehicle architectures, favored by some manufacturers for cost reasons, gain market share and reduce LiDAR's addressable vehicle population.

Photonic Sensing Fragments Across Application-Specific Cost Curves

Photonic sensing spans a genuinely broad set of technologies, from LiDAR time-of-flight ranging to fiber optic strain measurement to optical coherence tomography imaging, each serving distinct customer bases with different qualification requirements and purchasing cycles across separate industries. This diversity keeps the overall market fragmented even as individual application segments, particularly automotive LiDAR, consolidate around a smaller number of qualified suppliers over time.
MARKET CONCENTRATION (CR5)42%share held by the five largest sensor manufacturers
LIDAR UNIT COST DECLINE62%reduction in average LiDAR unit cost since early automotive adoption
AUTOMOTIVE DESIGN-IN SHARE34%shipment volume flowing into automotive perception system applications
TOP PRODUCING COUNTRY SHARE44%photonic component output concentrated within a single leading country
INDUSTRIAL DEPLOYMENT SHARE29%shipment volume flowing into factory automation and inspection systems
LASER DIODE COST SHARE31%total sensor module cost attributable to laser diode components
Cost curves differ sharply by application: automotive LiDAR unit costs have fallen dramatically as production volume scaled across multiple vehicle platforms, while specialized fiber optic sensing for industrial and defense applications remains a low-volume, high-margin business where customers pay for measurement precision rather than cost efficiency. This bifurcation means suppliers rarely compete across both ends of the market simultaneously with the same product line.
Supply concentrates among photonic component manufacturers with in-house laser diode and photodetector fabrication capability, a considerably narrower group than the broader sensor assembly market that sources these components externally from third parties. Automotive qualification cycles for LiDAR suppliers routinely stretch beyond two years, creating a meaningful moat for incumbents already through that process against newer entrants still building automotive-grade reliability track records.
"Everyone assumes LiDAR is the whole photonic sensor story, but the fiber optic sensing business quietly generates better margin with a fraction of the competitive noise. That's where the smart capital has been going."
Director, Photonics and Optical Sensing Practice · MMA Technology Practice · September 2026

Market Trends

Solid-State LiDAR Architectures Replace Mechanical Spinning Designs

Automotive LiDAR has shifted decisively from mechanical spinning units toward solid-state and micro-electromechanical mirror architectures that meet automotive vibration and reliability standards mechanical designs could not achieve at acceptable cost. Solid-state units now account for roughly 65% of new automotive LiDAR design wins, up from a small minority just three years ago, as manufacturers prioritize the smaller form factor and lower failure rate these architectures offer over long vehicle service life. This transition is consolidating supplier share around companies that made the architectural bet early, while mechanical LiDAR specialists work to retrofit their product lines or exit the automotive segment.
Market Impact: 1 to 5 units per vehicle
Time-of-Flight Sensors Expand Beyond Smartphone Camera Focus

Time-of-flight photonic sensors, originally deployed mainly for smartphone camera autofocus assistance, are expanding into robotics navigation, gesture recognition, and industrial proximity sensing as component costs fall alongside smartphone-driven manufacturing scale that few other sensor categories can match. Roughly 200 million time-of-flight sensor units now ship annually into non-smartphone applications, a category that essentially did not exist five years ago in any meaningful commercial volume. Component manufacturers originally focused on consumer electronics are building dedicated industrial and robotics product lines to capture this rapidly expanding demand base across multiple end markets.
Market Impact: 45% growth in industrial sensor deployment

Market Opportunities and Growth Drivers

Autonomous Vehicle Programs Require Multiple LiDAR Units Per Vehicle

Autonomous vehicle perception stacks increasingly rely on LiDAR to provide direct distance measurement that camera and radar systems cannot match under poor lighting or weather conditions, and each vehicle platform requires between one and five LiDAR units depending on the autonomy level targeted. Global robotaxi and autonomous trucking fleet deployments are projected to exceed 500,000 vehicles by 2030, each requiring automotive-grade LiDAR qualified to survive years of continuous operation in demanding conditions. This concentrated, high-reliability requirement is pulling qualification investment toward a narrow set of suppliers capable of meeting automotive validation standards.
Market Impact: 20% of programs now exclude LiDAR

Factory Automation Adds Optical Inspection Points Per Production Line

Manufacturing automation investments are steadily adding optical inspection and measurement points per production line as manufacturers pursue tighter quality control and defect detection, and each additional inspection point typically requires a dedicated photonic sensor rather than a conventional camera alone. Installed industrial photonic sensor counts have grown by roughly 45% over the past five years across surveyed manufacturing facilities worldwide, reflecting rising automation density. This steady demand growth provides a stable revenue base that offsets the more cyclical swings in automotive LiDAR procurement cycles tied directly to vehicle platform launches.
Market Impact: 3 to 4 years to revenue

Market Restraints and Challenges

Camera-and-Radar-Only Architectures Threaten LiDAR Addressable Market

Some autonomous vehicle developers have committed to camera-and-radar-only perception architectures, arguing that computer vision advances make LiDAR's added cost unnecessary for their approach. The root cause is that LiDAR still carries a meaningful cost premium over camera and radar components even after years of price decline, and some manufacturers judge that premium unjustified given their specific software approach to perception. Roughly 20% of announced autonomous vehicle programs now exclude LiDAR entirely from their sensor suite. LiDAR suppliers are mitigating this by pushing into non-automotive applications like robotics and industrial automation where the technology faces less architectural competition.
Market Impact: 65% of design wins solid-state

Automotive Qualification Cycles Delay Revenue Recognition for Entrants

New photonic sensor entrants routinely face multi-year automotive qualification cycles before securing their first production design win, delaying revenue recognition well beyond typical technology company investment timelines. The root cause is that automotive customers require extensive reliability testing across temperature, vibration, and lifetime cycles that smaller companies often lack the capital to fund without external investment support. Qualification alone can consume 3 to 4 years before first meaningful shipment revenue arrives. Entrants are mitigating this by pursuing industrial and robotics customers first, generating revenue while automotive qualification proceeds in parallel.
Market Impact: 200 million units in new applications
3 additional market trends, 4 additional growth drivers, and 2 additional restraints and challenges are covered in the full report. Contact sales@marketmindsadvisory.com to access the complete intelligence.

Segment CAGR and Growth Architecture

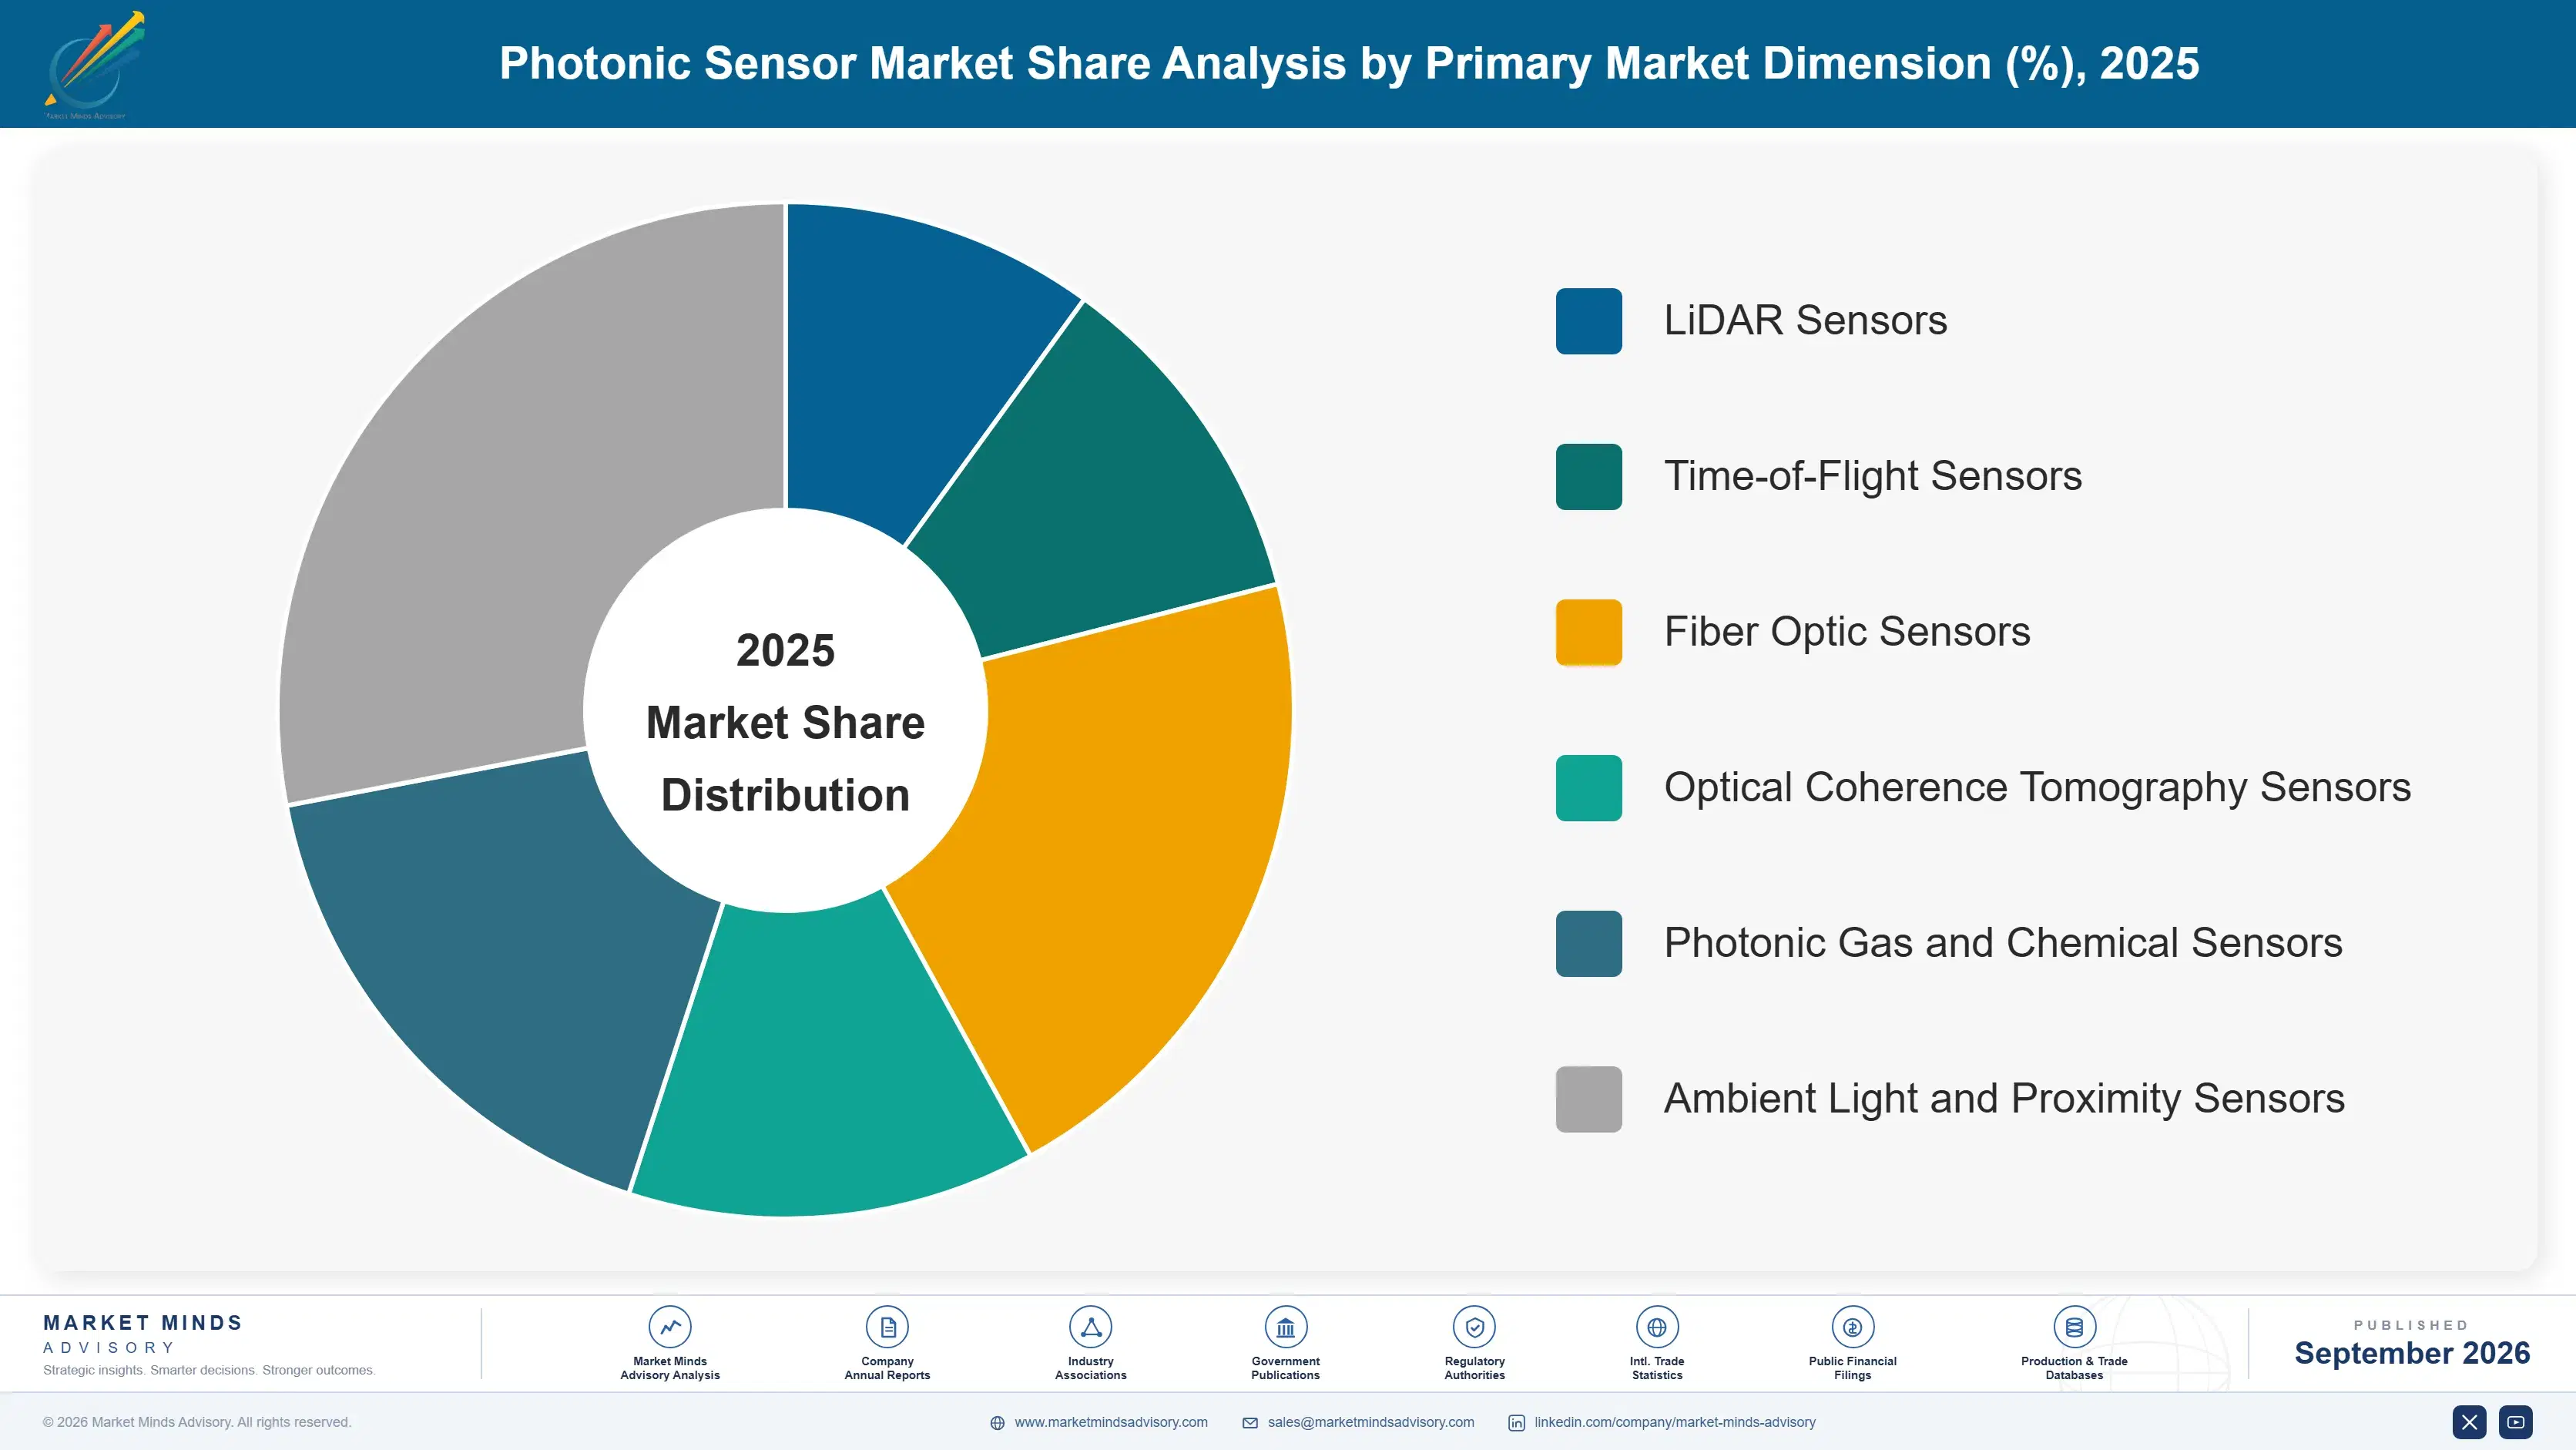
The Photonic Sensor Market segments by technology type across six categories spanning LiDAR, time-of-flight, fiber optic, and optical coherence tomography sensing, reflecting the primary engineering approach customers specify when writing procurement and integration requirements. Two segments outpace the market average, driven respectively by autonomous vehicle deployment and expanding non-automotive time-of-flight applications across robotics and industrial settings.
photonic-sensor-market-market-share-analysis-1790002615355

LiDAR Photonic Sensors for Autonomous Vehicle Perception Systems

LiDAR photonic sensors for autonomous vehicle perception systems are the fastest-growing segment, expanding as robotaxi and autonomous trucking fleets scale from pilot programs into genuine commercial deployment across multiple metropolitan markets worldwide and beyond. Solid-state architectures have displaced most mechanical spinning designs, cutting both unit cost and failure rates enough to satisfy automotive-grade reliability requirements that earlier LiDAR generations could not meet under real-world driving conditions and extended service life. Suppliers that secured early design wins with leading autonomous vehicle developers now benefit from multi-year production commitments spanning entire vehicle platform lifecycles, while newer entrants face a lengthy qualification gauntlet before earning comparable production volume at meaningful commercial scale and pricing parity.
CAGR 17.5%

Time-of-Flight Sensors for Robotics and Industrial Applications

Time-of-flight sensors for robotics and industrial applications form the second-fastest segment, growing as component costs fall alongside smartphone-driven manufacturing scale that makes photonic sensing viable for cost-sensitive robotics navigation and proximity detection applications previously reliant on standalone cameras alone entirely. Warehouse automation and collaborative robotics deployments increasingly specify time-of-flight sensing for obstacle detection and precise positioning rather than relying solely on conventional camera vision systems that struggle under variable lighting conditions and cluttered environments. Component manufacturers originally focused entirely on smartphone camera modules are building dedicated industrial and robotics product lines, adapting existing manufacturing scale to serve this newly significant demand base across multiple industries, geographies, and deployment contexts worldwide.
CAGR 15.0%
Full segment breakdown across 6 segments available in the complete report.

Regional Architecture and Country Demand Map

Photonic sensor demand concentrates wherever automotive LiDAR manufacturing, industrial automation, and consumer optical component production intersect, with East Asia leading on component fabrication scale while North America and Western Europe anchor autonomous vehicle programs, industrial precision instrumentation, and safety certification standards across every major vehicle platform.

North America

North America hosts a concentrated cluster of autonomous vehicle developers and LiDAR design specialists, including several companies that pioneered solid-state architectures now standard across the industry worldwide. Robotaxi and autonomous trucking pilot programs across California, Arizona, and Texas generate design-in demand that pulls suppliers toward automotive-grade qualification years ahead of broader commercial deployment elsewhere. The region's medical device manufacturing base, concentrated around established diagnostic imaging companies, adds meaningful demand for optical coherence tomography sensors entirely independent of the automotive cycle and its funding swings. Industrial automation retrofits across manufacturing corridors add a third, steadier demand channel less exposed to autonomous vehicle development timelines, funding cycles, and broader capital market conditions.
Share: 27% | CAGR: 10.5% (2026 to 2036)

Western Europe

Precision engineering traditions across Germany and France sustain Western Europe's photonic sensor demand, concentrated in premium automotive platforms, industrial machine vision, and scientific instrumentation rather than high-volume consumer applications common elsewhere. German automakers and their tier-one suppliers are qualifying LiDAR and fiber optic sensing for advanced driver assistance systems ahead of many other markets, reflecting the region's stringent vehicle safety certification requirements and testing protocols. Fraunhofer Institute and university-affiliated photonics research clusters continue producing specialized fiber optic sensing intellectual property that regional manufacturers commercialize into industrial and defense applications across the continent. Scientific instrumentation demand from research institutions adds a further, smaller but stable channel largely insulated from automotive cycles.
Share: 20% | CAGR: 9.0% (2026 to 2036)
Regional intelligence for 5 additional markets available in the complete report: East Asia, South Asia and Pacific, Latin America, Middle East and Africa, Eastern Europe. Contact sales@marketmindsadvisory.com.
photonic-sensor-market-country-cagr-analysis-1790002616220

Where Photonic Sensor Vendors Actually Capture Margin

Photonic sensor vendors capture value beyond raw unit shipment through four commercial mechanisms that reward specification depth and qualification history over price competition alone in this market. Automotive design-win longevity, application engineering support, non-automotive diversification, and precision instrumentation pricing power all matter more here than in most sensor categories, given the qualification barriers involved.

Capturing Multi-Year Value from Automotive LiDAR Design-Wins

Winning a LiDAR socket in a new autonomous vehicle platform locks in supply for the life of that platform generation, typically five to seven years, since automotive customers rarely requalify a working sensor supplier once production begins in earnest. Vendors that price the initial design win competitively while protecting margin on the multi-year production run capture roughly 3 to 4 times the lifetime revenue of a single commodity transaction elsewhere. This favors suppliers with dedicated automotive account teams who can navigate lengthy qualification cycles years before volume production starts in earnest.
Market Impact: 3 to 4x lifetime revenue per design win

Providing Application Engineering Support for Non-Automotive Buyers

Vendors that offer dedicated application engineering support for robotics, industrial, and medical customers shorten the internal integration timeline these buyers face, a meaningful advantage since most lack the systems engineering depth that automotive customers already possess in-house today. Vendors bundling this support command a price premium of roughly 15 to 20% over suppliers offering bare sensor modules alone, since customers value the integration time saved more than the marginal component cost involved in the purchase. This lever works best for vendors expanding beyond automotive into robotics and industrial channels specifically.
Market Impact: Commands roughly a 15 to 20% price premium

Diversifying Revenue Across Automotive and Industrial Channels

Vendors serving both automotive LiDAR and industrial or medical photonic sensing channels smooth revenue volatility tied to automotive platform launch cycles, which can swing meaningfully year to year as design wins convert to production volume across different platforms and customer bases entirely. Diversified vendors reported roughly 30% lower revenue volatility than automotive-only specialists during the past two full platform cycles, according to public company disclosures and investor presentations reviewed. This diversification also spreads qualification investment across multiple customer bases rather than concentrating risk in a single automotive relationship over time.
Market Impact: Shows 30% lower revenue volatility across diversified vendors

Pricing Precision Instrumentation for Scientific and Defense Customers

Fiber optic and specialized photonic sensing sold into scientific instrumentation and defense applications commands substantially higher per-unit pricing than automotive or consumer volume products sold at scale, since these customers pay for measurement precision rather than cost efficiency at any price point available. Margins in this low-volume, high-precision segment routinely run 2 to 3 times higher than automotive-grade sensor margins, rewarding vendors who maintain specialized product lines rather than chasing automotive volume exclusively across the board. This segment also carries longer customer relationships with meaningfully less price pressure over time.
Market Impact: Runs 2 to 3x higher margin than automotive

Who Controls the Margin Pool

Revenue concentration in the Photonic Sensor Market sits at a CR5 of 42%, evaluated on photonic sensor product line revenue disclosed or estimated across each vendor's component and module portfolio. Hamamatsu Photonics and Sony Semiconductor Solutions lead by a meaningful margin, drawing on decades of component fabrication depth smaller LiDAR-focused entrants cannot replicate. The gap between the second and third-ranked vendor narrows considerably given the market's genuine fragmentation.
Current competitive activity centers on automotive LiDAR qualification races and non-automotive diversification moves, as specialized LiDAR companies expand into robotics and industrial sensing to smooth platform revenue volatility. Several vendors have opened dedicated application engineering teams serving robotics and medical customers, treating integration support as a genuine differentiator. Consolidation is picking up as smaller LiDAR specialists without automotive design wins struggle to fund qualification investment.

Emerging pressure comes from camera-and-radar-only autonomous vehicle architectures that could shrink LiDAR's addressable vehicle population if that approach gains broader adoption over the coming decade. Rankings could shift meaningfully if a well-capitalized entrant secures a marquee autonomous vehicle design win, since automotive sockets carry multi-year exclusivity that reorders standing for years. Vendors lacking diversified end-market exposure risk severe revenue swings tied to single-customer platform timing.
photonic-sensor-market-company-positioning-matrix-1790002617075

Competitive Moat and Risk Dimensions

HAMAMATSU PHOTONICS

Moat: Component Fabrication Depth

Hamamatsu's decades of photodetector and laser diode fabrication expertise let it supply components across LiDAR, medical imaging, and scientific instrumentation simultaneously, spreading research and development cost across a broader revenue base than single-application competitors. This breadth reduces the incentive for customers to qualify a second source for specialized components across multiple product lines.
HAMAMATSU PHOTONICS

Risk: Limited Automotive Volume Focus

Hamamatsu's historical strength in scientific and medical instrumentation has meant less dedicated automotive account infrastructure than pure-play LiDAR competitors have built specifically for that market. Capturing a larger share of automotive design wins will require continued investment in automotive-specific qualification and account management capability that competitors already possess.
SONY SEMICONDUCTOR SOLUTIONS

Moat: Consumer Electronics Manufacturing Scale

Sony's dominant position in image sensors gives it manufacturing scale and process expertise that translates directly into cost-competitive time-of-flight sensor production for both smartphone and emerging robotics applications. This scale advantage lets Sony price competitively in high-volume segments where smaller specialists cannot match unit economics.
SONY SEMICONDUCTOR SOLUTIONS

Risk: Automotive LiDAR Market Entry Gap

Sony has not established comparable automotive LiDAR design wins to the specialized LiDAR companies leading that segment, leaving a meaningful gap in the fastest-growing part of the photonic sensor market. Closing this gap would require either significant organic investment or acquisition of an existing automotive-qualified LiDAR specialist.

Players Tracked

Prominent Players

Hamamatsu Photonics
Sony Semiconductor Solutions
ams OSRAM
Hesai Group
Lumentum Holdings

Other Key Players

RoboSense
Innoviz Technologies
Velodyne Lidar
Ouster
Luminar Technologies
Cepton
Infineon Technologies
STMicroelectronics
Analog Devices
IPG Photonics
II-VI Incorporated
Trumpf
Carl Zeiss AG
Keyence Corporation
First Sensor

Recent Developments

MAY 2025

Shanghai Fab Adds Automotive LiDAR Lines

Hesai Group expanded solid-state LiDAR production capacity at its Shanghai manufacturing facility, adding dedicated lines for automotive-qualified units following rising order backlogs from Chinese electric vehicle manufacturers. The organic capacity expansion supports anticipated volume growth as these automakers scale advanced driver assistance features across a broader range of vehicle models.
Signal: Signals sustained EV manufacturer demand pull for dedicated solid-state LiDAR manufacturing capacity across all of China
OCTOBER 2025

Multi-Year Robotics Supply Agreement Signed

Sony Semiconductor Solutions signed a multi-year supply agreement with a leading robotics automation equipment maker to provide time-of-flight sensors for next-generation warehouse and industrial robots. The agreement, not a joint venture or equity arrangement, commits both parties to fixed volume and technical support terms extending across multiple product generations.
Signal: Extends Sony's time-of-flight sensing reach into industrial robotics well beyond its original smartphone camera focus entirely
FEBRUARY 2026

Acquisition Adds Structural Monitoring Sensing

Lumentum Holdings acquired a smaller fiber optic sensing startup specializing in structural health monitoring for infrastructure applications, adding distributed acoustic sensing intellectual property to its existing photonic component portfolio. The acquisition strengthens Lumentum's position in the growing infrastructure monitoring segment without requiring years of internal development.
Signal: Adds structural health monitoring sensing capability without years of costly internal research and development effort required

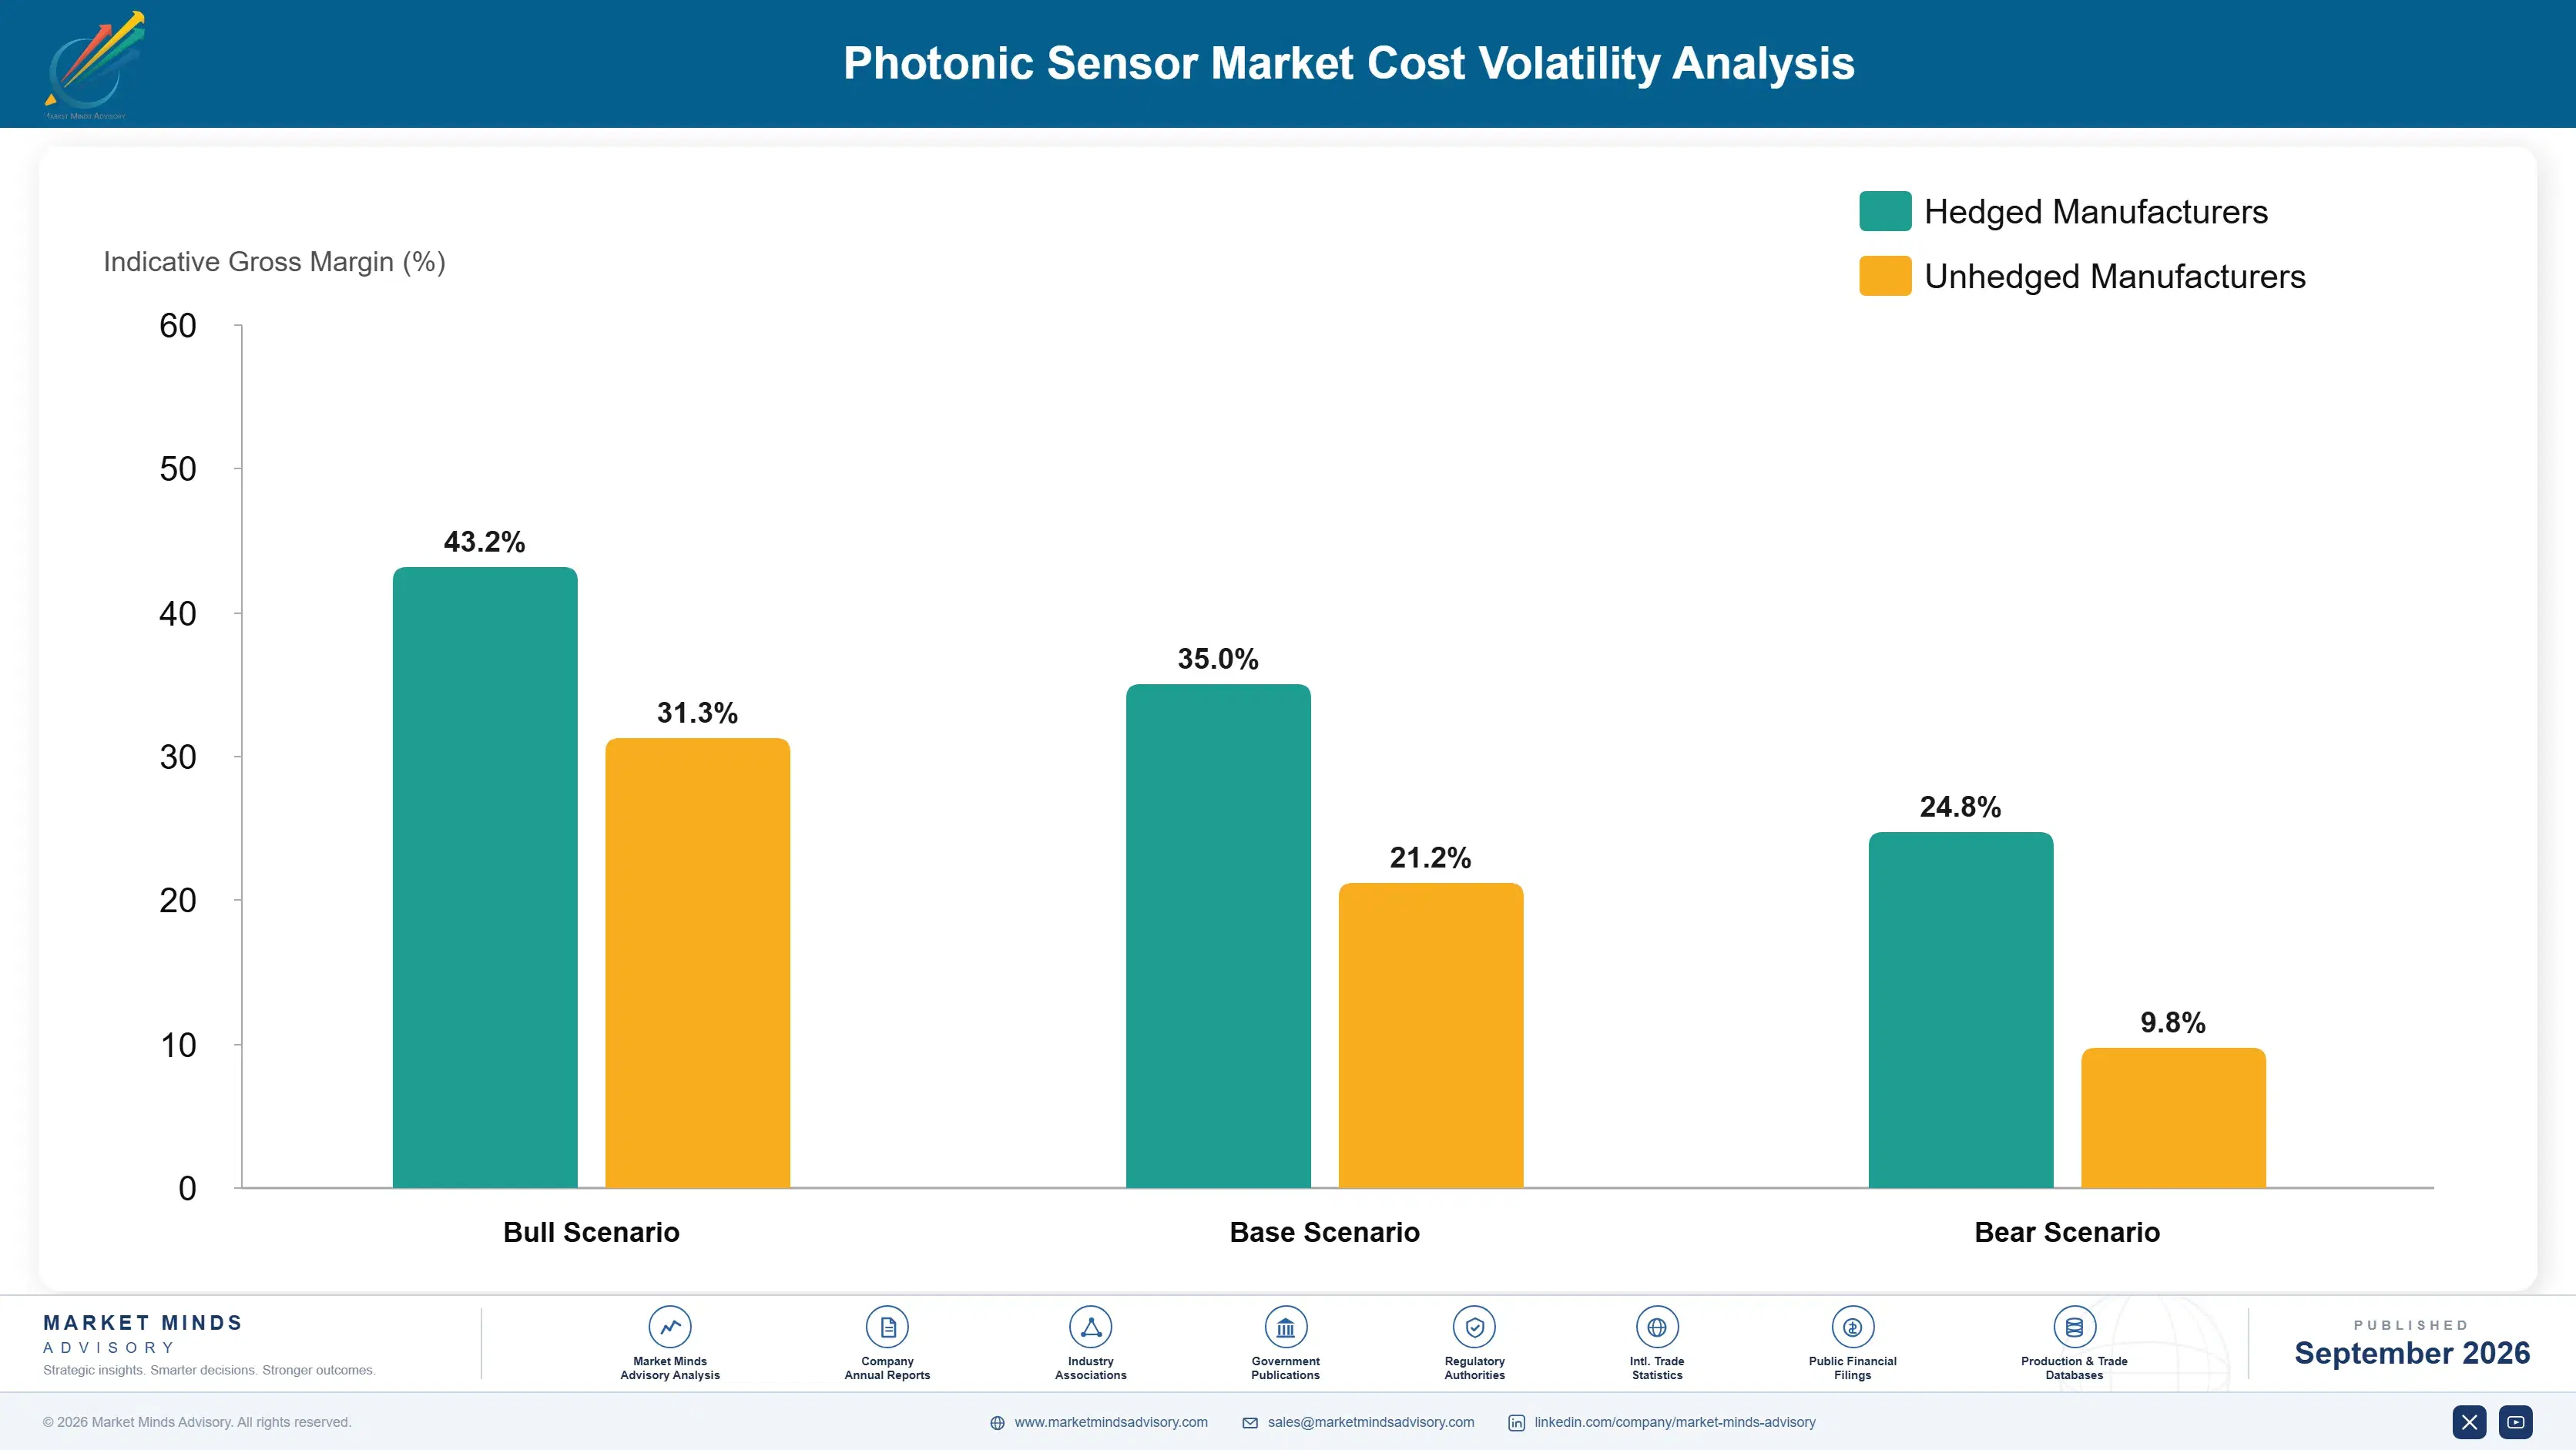
Laser Diode and Photodetector Supply Exposure

Laser diodes and photodetectors together account for roughly 45% of photonic sensor production cost, sourced from a concentrated set of specialty compound semiconductor fabricators in Japan, Taiwan, and the United States that few competitors can match at scale. Optical lens assemblies and precision packaging represent a further 25% of cost, with assembly capacity concentrated in China and Southeast Asia.
Gallium arsenide substrate pricing spiked sharply during the 2022-2023 compound semiconductor demand surge, when automotive LiDAR, 5G infrastructure, and solar cell manufacturers competed for the same limited specialty wafer capacity, according to the US Department of Commerce's semiconductor supply chain review. Lead times for automotive-grade laser diodes stretched from a typical twelve weeks to beyond thirty weeks at the peak, forcing several LiDAR makers to delay production ramp schedules by multiple quarters.

Vendors without long-term compound semiconductor supply agreements or in-house laser diode fabrication face a lasting cost disadvantage during upcycles, since spot-market pricing for automotive-grade components can run well above contracted rates when capacity tightens. Vertically integrated manufacturers like Hamamatsu and Sony absorb less margin pressure than fabless LiDAR assemblers dependent entirely on external component allocation decisions.
photonic-sensor-market-cost-volatility-analysis-1790002617399

Securing Multi-Year Compound Semiconductor Supply Agreements

Large buyers are increasingly negotiating multi-year laser diode and photodetector supply agreements directly with compound semiconductor fabricators, trading committed volume for insulation against spot-market price swings during industry cycles. This approach worked well for vendors already under contract during the 2022-2023 shortage, avoiding the worst lead-time extensions that spot-market buyers experienced across the industry.

Dual-Sourcing Laser Diodes Across Multiple Fabricators

Vendors are qualifying laser diodes and photodetectors from more than one compound semiconductor fabricator per product line, reducing exposure to any single supplier's capacity constraints or production disruptions during peak demand periods. This raises qualification cost modestly but protects continuity when demand surges or geopolitical tension affects any single fabrication hub, a scenario buyers now weigh explicitly.

Investing in Vertical Integration for Critical Components

Some vendors are investing directly in laser diode and photodetector fabrication capability rather than relying entirely on external suppliers, reducing exposure to spot-market pricing during upcycles. This vertical integration took years to build for companies that now benefit most, giving early movers a durable cost advantage over fabless competitors during periods of tight supply.

Portfolio Architecture for Margin Defence

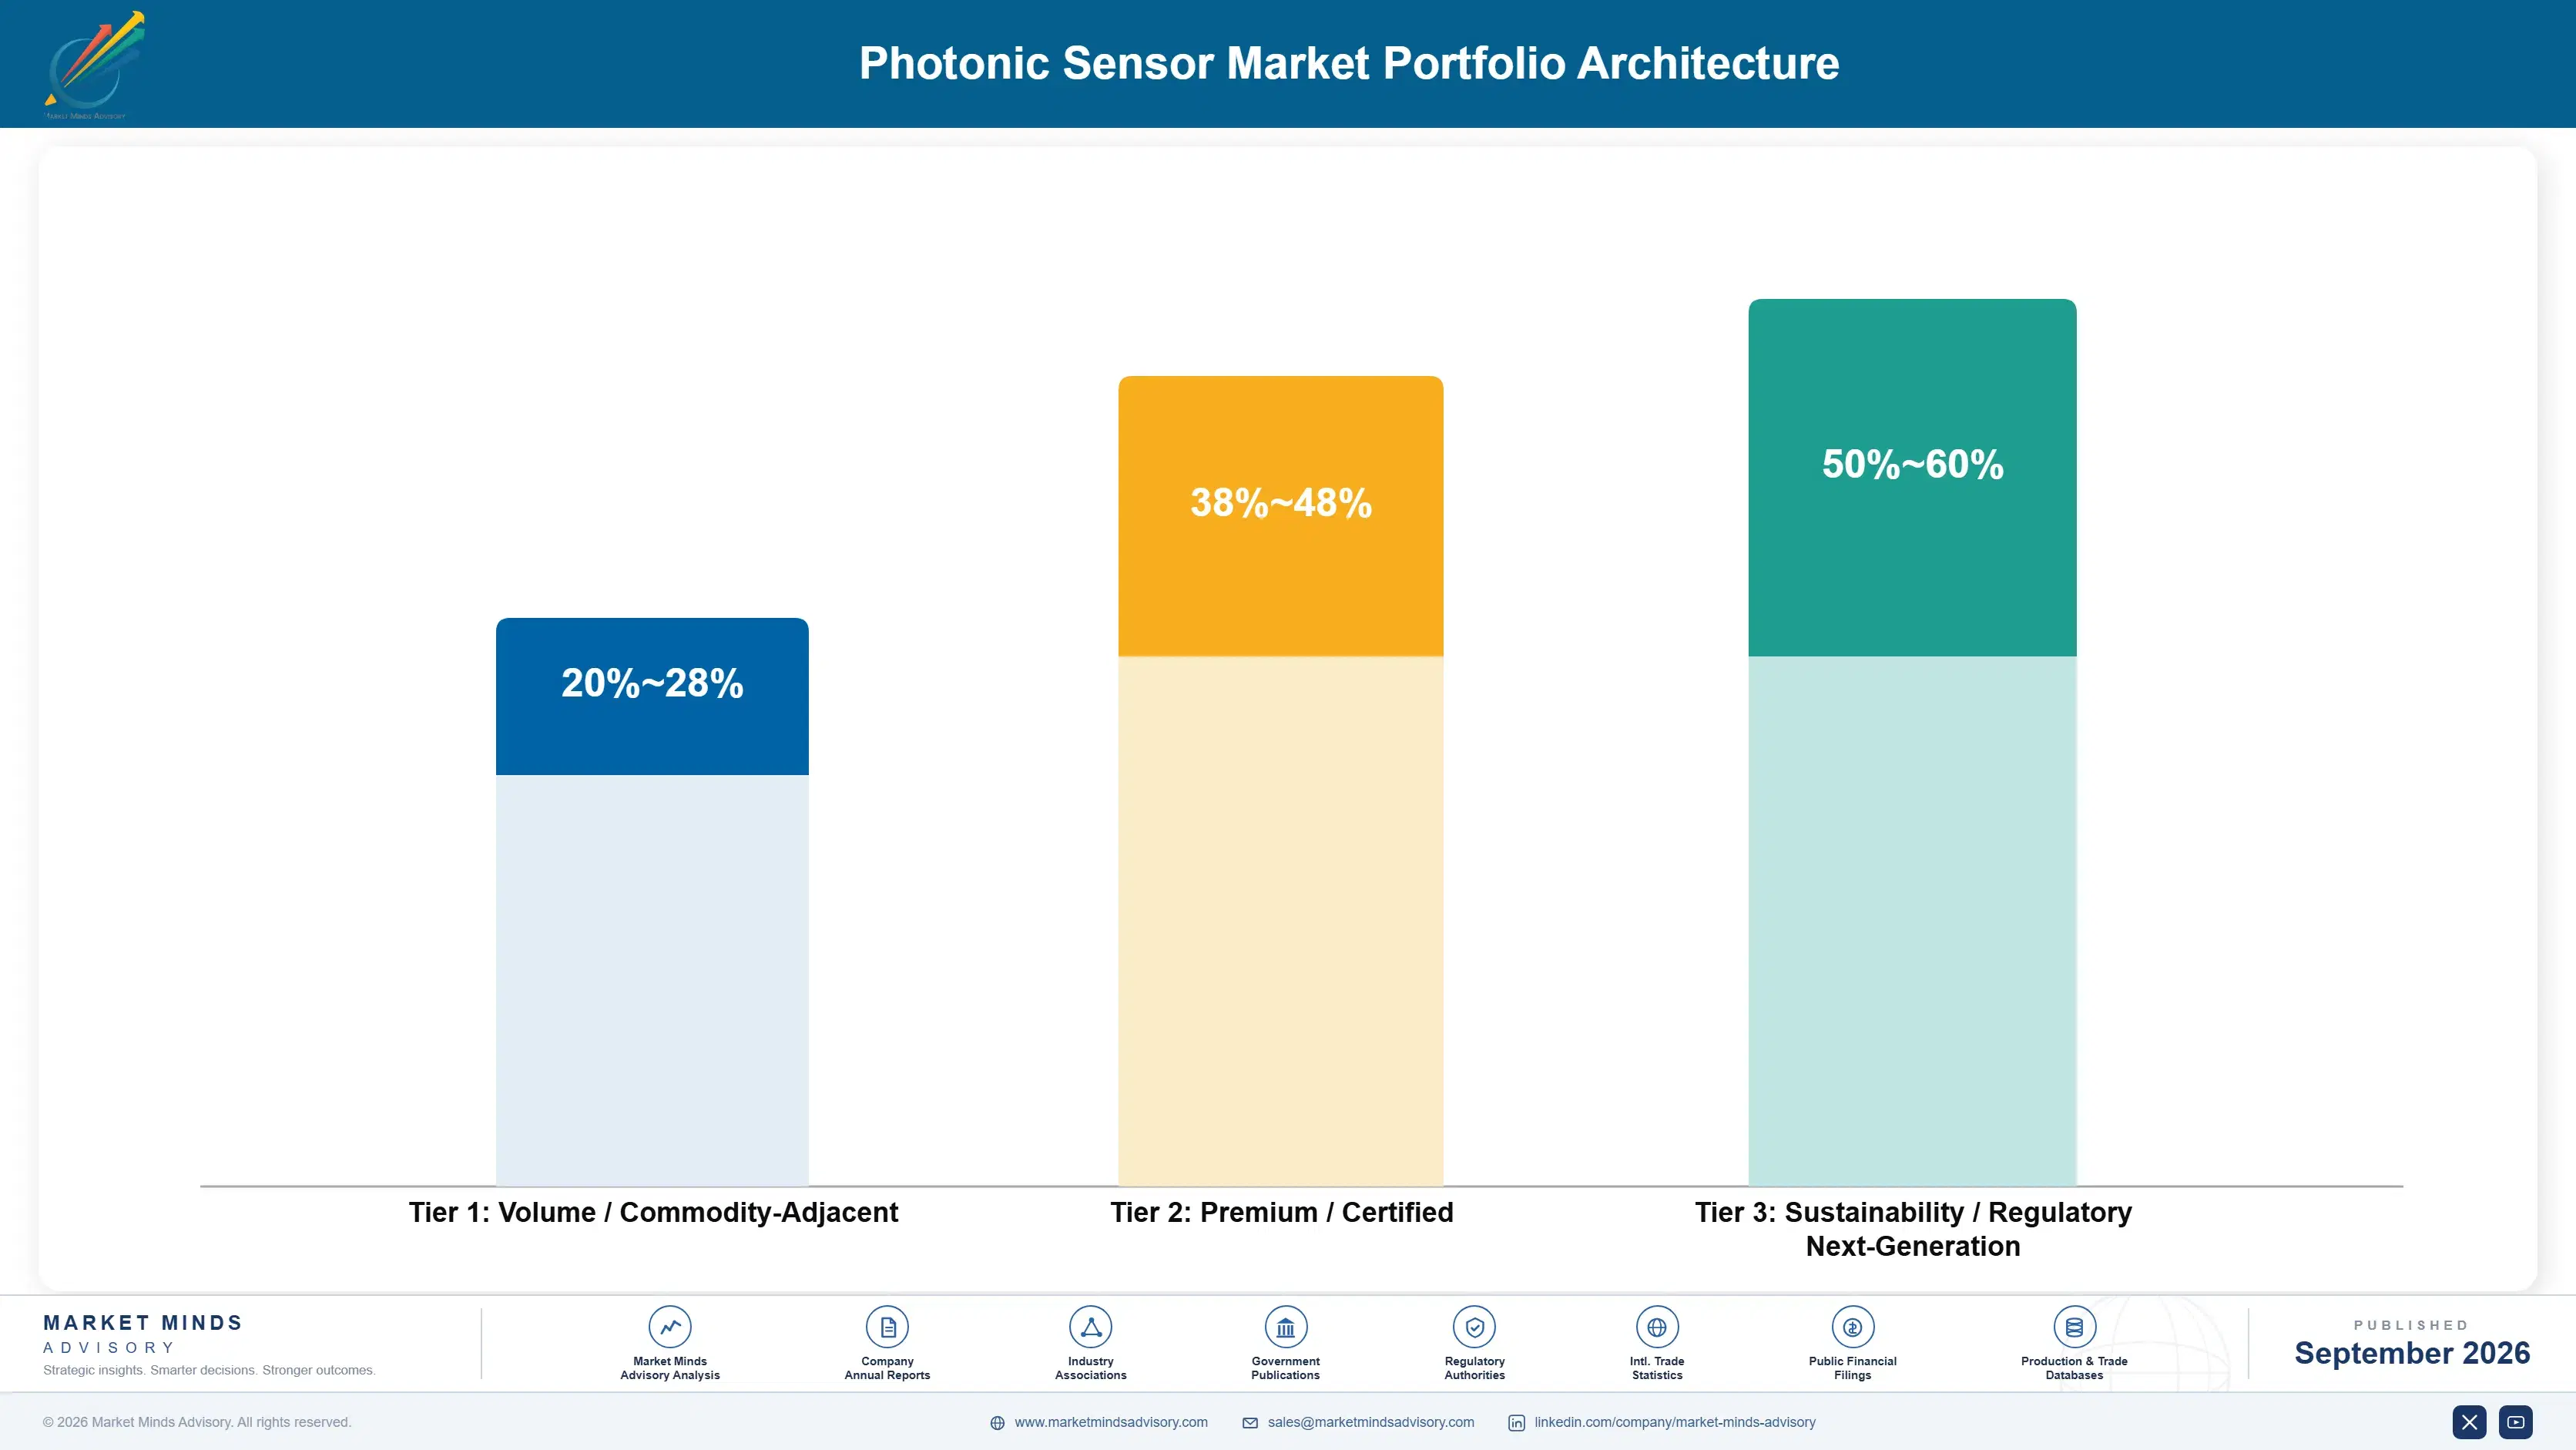
Photonic sensor vendors organize their portfolios across three margin tiers reflecting genuinely different commercial relationships, from commodity time-of-flight sensors sold into consumer electronics up through certified automotive LiDAR to specialized scientific and defense instrumentation for demanding environments. Gross margin varies substantially across tiers, concentrating at the top where measurement precision and low supplier counts keep competition thin.
Volume tier products compete on unit cost and manufacturing scale against consumer electronics component suppliers, offering limited differentiation and correspondingly thin margin across most product lines and customer segments. Premium tier automotive LiDAR earns margin through demonstrated qualification history and reliability track records that customers value well beyond the marginal cost of the sensor itself, creating durable pricing power that consumer-grade vendors cannot access.

The tension between consumer volume and automotive premium product lines shapes fabrication capacity allocation decisions, since manufacturing capacity committed to consumer time-of-flight sensors cannot easily flex toward automotive-grade LiDAR production during a sudden demand surge from automakers ramping new platforms. Vendors maintaining strength in both categories use consumer revenue to fund the multi-year automotive qualification investment needed to win LiDAR design sockets at scale.

Volume / Commodity-Adjacent

Consumer time-of-flight sensors for smartphones and basic robotics, competing on unit cost and manufacturing scale against a broad field of established component suppliers with limited differentiation across the wider category.
Gross Margin: 20-28%

Premium / Certified

Automotive-qualified LiDAR and industrial machine vision sensors with demonstrated reliability history, priced for qualification depth and precision rather than raw unit cost alone across the product line, portfolio, and customer base.
Gross Margin: 38-48%

Sustainability / Regulatory / Next-Generation

Specialized scientific instrumentation and defense-grade fiber optic sensing, commanding the widest margin given limited qualified supplier counts and deep measurement precision requirements across the entire category, buyer set, and application range.
Gross Margin: 50-60%
photonic-sensor-market-portfolio-architecture-1790002618185

High-value Sub-segments and Strategic Watch-out

LiDAR for Autonomous Vehicle Perception

This segment combines the fastest unit growth in the category with strong gross margin, as automotive customers pay directly for demonstrated qualification history and long reliability track records. Vendors with proven multi-year automotive design-win history are positioned to capture disproportionate value through the next decade.
Gross Margin: 45-55%

Time-of-Flight Sensors for Robotics

Robotics and industrial navigation applications drive strong growth alongside moderate margin, since cost-sensitive buyers still expect pricing closer to consumer electronics than automotive components generally. This combination of solid growth and improving margin makes it a priority investment area for vendors expanding beyond consumer electronics.
Gross Margin: 35-42%

Time-of-Flight Sensors for Consumer Electronics

This segment remains the volume core outside automotive and industrial applications, generating steady unit shipments even as growth trails the market average and margin stays thin under sustained price competition. It funds operating scale but contributes proportionally less to profit than its shipment volume suggests.
Gross Margin: 18-25%

Fiber Optic Sensors for Structural Monitoring

Growth here trails the market average today, but rising infrastructure inspection mandates and aging asset monitoring requirements across multiple industries could accelerate demand faster than currently modeled by most vendors. Vendors should watch qualification activity in this adjacent segment closely over the next two to three years.
Gross Margin: 40-48%

Qualification Depth Across Application Verticals

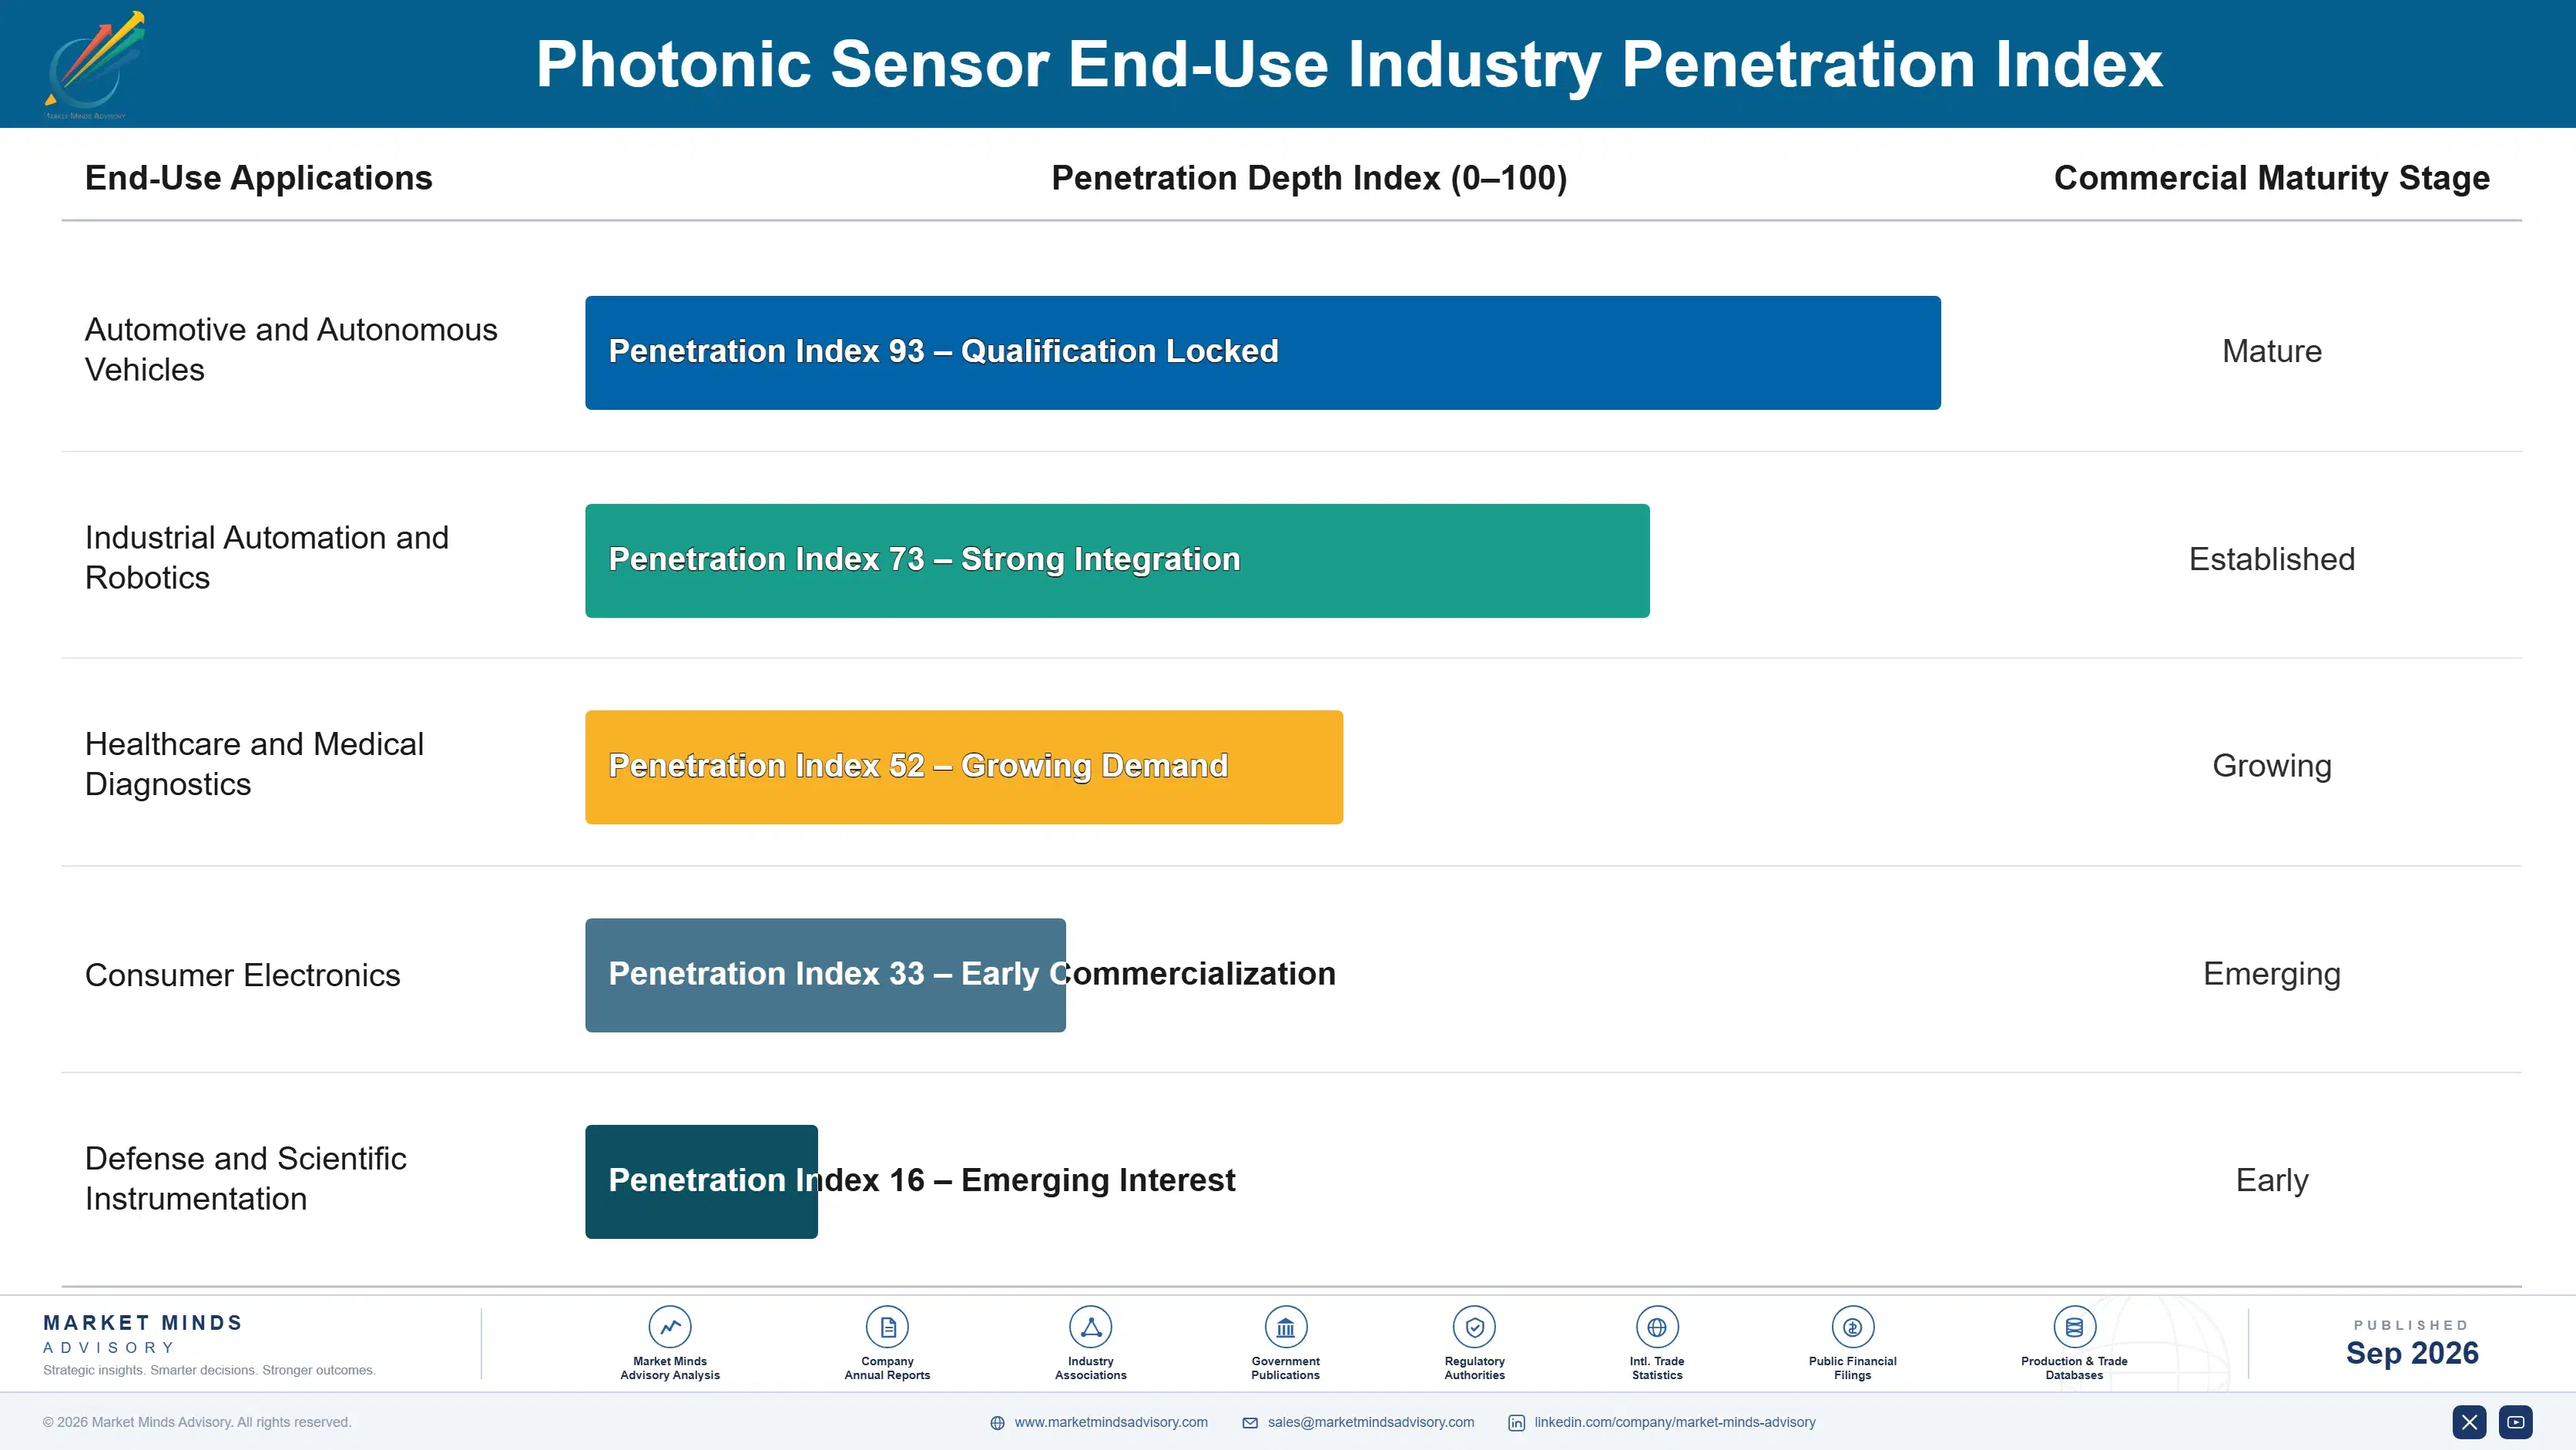
Photonic sensor revenue behaves like an annuity once a vendor clears automotive qualification, since automakers rarely reopen a validated sensor design mid-platform given the engineering cost of revalidating a new supplier's reliability profile. A single automotive LiDAR win generates recurring shipment revenue across an entire vehicle platform lifecycle without renewed sales effort, provided the vendor keeps production quality consistent.
Stickiness varies meaningfully by end-use vertical: automotive LiDAR carries the deepest lock-in given multi-year qualification cycles and platform lifecycles stretching five to seven years, while consumer time-of-flight sensors turn over far faster as smartphone products refresh annually and price competition intensifies with each generation. Scientific and defense instrumentation sits at the other extreme, with customer relationships often outlasting a single product generation entirely given specialized certification requirements.

Buyer profiles are shifting generationally as autonomy engineering authority moves from generalist sensor procurement teams toward specialized perception engineers who understand LiDAR's specific role within a broader sensor fusion architecture. These buyers prioritize demonstrated field reliability data and integration support over vendor relationships built around conventional automotive component purchasing, favoring vendors who invest in dedicated technical account teams over legacy distributor relationships.
photonic-sensor-market-end-use-penetration-index-1790002619034

Where Photonic Sensor Strategy Focuses Next

These are among the four positions where our research anticipates prominent divergence between winners and laggards over the coming forecast period. Each is grounded in the demand model, the regulatory perimeter, and the announced capacity pipeline.
01 / AUTOMOTIVE LIDAR QUALIFICATION INVESTMENT

Prioritize Automotive LiDAR Qualification Over Consumer Volume Chasing

Automotive LiDAR qualification is the single highest-value investment available to photonic sensor vendors today, since a won design generates recurring shipment revenue across an entire vehicle platform lifecycle with minimal renewed sales effort required. Vendors chasing consumer volume instead compete on price in a segment with thinner margin and no qualification moat protecting share against new entrants at all. The engineering investment required to clear automotive qualification pays back many times over across a five-to-seven-year platform relationship spanning multiple vehicle generations.
02 / NON-AUTOMOTIVE REVENUE DIVERSIFICATION

Diversify Into Robotics and Industrial Channels for Stability

Diversified vendors reported roughly 30% lower revenue volatility than automotive-only specialists during the past two full platform cycles, a meaningful advantage given how unpredictable automotive platform timing can genuinely be for smaller suppliers without diversified revenue. Building dedicated application engineering support for robotics and industrial customers now positions a vendor to capture growing non-automotive demand before automotive revenue concentration becomes a genuine liability during the next downturn. Waiting risks ceding this diversification advantage permanently to competitors already investing there today.
03 / COMPOUND SEMICONDUCTOR SUPPLY SECURITY

Lock In Laser Diode Supply Before the Next Shortage

The 2022-2023 compound semiconductor shortage proved that vendors without secured laser diode and photodetector supply face lead-time extensions that cost customer relationships for years afterward and across product cycles. Securing multi-year supply agreements now, while negotiating leverage still favors buyers, protects against a repeat episode as automotive LiDAR and robotics demand both keep climbing steadily across every major region. Vendors that wait until the next tightness cycle begins will negotiate from a materially weaker position than those who act now.
04 / SCIENTIFIC INSTRUMENTATION MARGIN FOCUS

Protect Premium Scientific and Defense Instrumentation Margins

Scientific and defense instrumentation margins run 2 to 3 times higher than automotive-grade sensor margins, yet this segment receives far less strategic attention than the higher-volume automotive LiDAR business commands from most vendors. Vendors that maintain specialized product lines for this segment rather than reallocating all engineering resources toward automotive volume protect a genuinely durable, high-margin revenue stream over the long run. Abandoning this segment to chase automotive scale would sacrifice margin quality for volume that thinner competitors can undercut easily.

Engagement Snapshot From the Field

A live engagement with an industry participant carrying material or product regulatory and market exposure ahead of a defining policy shift, showing how our research translates into a defensible multi-year portfolio strategy.
MARKET MINDS ADVISORY · CLIENT ENGAGEMENT SUMMARY
Photonic Sensor Producer Strategic Portfolio Review and Transition Roadmap 2026·Investment Scenario on Photonic Sensor Exposure Evaluation 2025-26
CLIENT PROFILE
The client is a mid-size warehouse robotics equipment manufacturer supplying automated guided vehicles to logistics operators across North America and Europe, with annual equipment revenue exceeding $250 million (client-reported, unverified by MMA). The company was redesigning its navigation sensor suite to reduce reliance on camera-only obstacle detection and needed to evaluate photonic sensing options for its next-generation vehicle platform launching within a year.
STRATEGIC CHALLENGE
The client's engineering team lacked deep experience specifying time-of-flight or LiDAR sensors, having relied primarily on camera vision suppliers for prior platform generations entirely. Leadership was uncertain which photonic sensing approach best balanced detection reliability, cost, and integration complexity given the company's tight development timeline and limited internal photonics expertise.
MMA APPROACH
MMA conducted structured interviews with the client's engineering and procurement leadership alongside primary survey benchmarking data on time-of-flight and LiDAR adoption across comparable robotics manufacturers in the same industry segment and geography. The analysis mapped available sensor options against the client's specific navigation requirements, cost targets, and integration timeline constraints carefully.
KEY FINDINGS
  1. Time-of-flight sensors matched the client's obstacle detection requirements at roughly one-third the total cost of automotive-grade LiDAR alternatives that were fully evaluated.
  2. Two of six evaluated vendors offered pre-built reference integrations for the client's existing navigation software stack, cutting integration time quite meaningfully overall.
  3. Vendors with dedicated robotics application engineering support delivered working prototypes approximately two full months faster than vendors lacking any such support entirely.
  4. Total sensor suite cost increased by roughly 12% over the camera-only baseline, offset by an estimated reduction in field collision incidents (client-reported, unverified by MMA).
CLIENT PROFILE
The client is a mid-size warehouse robotics equipment manufacturer supplying automated guided vehicles to logistics operators across North America and Europe, with annual equipment revenue exceeding $250 million (client-reported, unverified by MMA). The company was redesigning its navigation sensor suite to reduce reliance on camera-only obstacle detection and needed to evaluate photonic sensing options for its next-generation vehicle platform launching within a year.
STRATEGIC CHALLENGE
The client's engineering team lacked deep experience specifying time-of-flight or LiDAR sensors, having relied primarily on camera vision suppliers for prior platform generations entirely. Leadership was uncertain which photonic sensing approach best balanced detection reliability, cost, and integration complexity given the company's tight development timeline and limited internal photonics expertise.
MMA APPROACH
MMA conducted structured interviews with the client's engineering and procurement leadership alongside primary survey benchmarking data on time-of-flight and LiDAR adoption across comparable robotics manufacturers in the same industry segment and geography. The analysis mapped available sensor options against the client's specific navigation requirements, cost targets, and integration timeline constraints carefully.
KEY FINDINGS
  1. Time-of-flight sensors matched the client's obstacle detection requirements at roughly one-third the total cost of automotive-grade LiDAR alternatives that were fully evaluated.
  2. Two of six evaluated vendors offered pre-built reference integrations for the client's existing navigation software stack, cutting integration time quite meaningfully overall.
  3. Vendors with dedicated robotics application engineering support delivered working prototypes approximately two full months faster than vendors lacking any such support entirely.
  4. Total sensor suite cost increased by roughly 12% over the camera-only baseline, offset by an estimated reduction in field collision incidents (client-reported, unverified by MMA).
RECOMMENDED STRATEGY
Phase 1: Phase 1 (Sensor Technology Evaluation): Compare time-of-flight and LiDAR options directly against navigation requirements and specific cost and timeline targets. Phase 2: Phase 2 (Vendor Selection and Prototyping): Select finalist vendors and build working prototypes directly on the target vehicle platform itself. Phase 3: Phase 3 (Production Integration): Finalize sensor sourcing agreements and fully integrate them into the entire next-generation vehicle production line schedule.
OUTCOME
The client selected a time-of-flight sensor vendor with strong robotics application engineering support, integrating the new sensor suite within the original development timeline as planned. Early field testing showed a meaningful reduction in obstacle detection failures compared to the camera-only baseline (client-reported, unverified by MMA).

Frequently Asked Questions

Foundational context covering the market sizes, CAGR, scope, country, region and competition that inform every finding below. This section is provided to cover basics and most often pre-purchase conversations, answered from the MMA Primary Research Dataset.

What is the current size of the Photonic Sensor Market?

The Photonic Sensor Market is valued at $5.8 billion in 2025. This reflects global shipment revenue for LiDAR, time-of-flight, fiber optic, and optical coherence tomography sensors across applications.

How large will the Photonic Sensor Market be by 2036?

The market is projected to reach $17.4 billion by 2036, up from $6.41 billion in 2026. That expansion represents a 2.71 times multiple over the eleven-year forecast period.

What is the CAGR for the Photonic Sensor Market 2026 to 2036?

The market is forecast to grow at a 10.5% compound annual growth rate between 2026 and 2036. Bull and bear scenarios range from 11.8% to 9.2%, reflecting autonomous vehicle adoption pace uncertainty.

Which segment is growing fastest?

LiDAR photonic sensors for autonomous vehicle perception systems lead growth at 17.5% CAGR, roughly 1.67 times the overall market rate. Demand comes from robotaxi and autonomous trucking fleet expansion.

Who are the major companies in the Photonic Sensor Market?

Hamamatsu Photonics, Sony Semiconductor Solutions, ams OSRAM, Hesai Group, and Lumentum Holdings lead the market. Together they hold a CR5 of 42% based on photonic sensor product revenue.

Which country is growing fastest?

China leads country-level growth at a 13.0% CAGR, driven by its rapidly scaling autonomous vehicle and robotaxi development alongside dominant time-of-flight sensor manufacturing. This outpaces the broader East Asia average.

Report Segmentation Architecture

The full report scope spans multiple orthogonal segmentation dimensions, with cross-tabulated demand data provided for each dimension pair. Coverage extends further to regional breakdowns, trend trajectories, and the competitive detail needed to support segment-level decision-making.

By Primary Market Dimension

  • LiDAR Sensors
  • Time-of-Flight Sensors
  • Fiber Optic Sensors
  • Optical Coherence Tomography Sensors
  • Photonic Gas and Chemical Sensors
  • Ambient Light and Proximity Sensors

By End-Use Industry

  • Automotive and Autonomous Vehicles
  • Industrial Automation and Robotics
  • Healthcare and Medical Diagnostics
  • Consumer Electronics
  • Defense and Scientific Instrumentation

By Commercial Dimension

  • Direct OEM Design-In Sourcing
  • Distributor and Channel Sales
  • Bundled Application Engineering Support
  • Reference Design Licensing

By Region

  • North America
  • Western Europe
  • East Asia
  • South Asia and Pacific
  • Latin America
  • Middle East and Africa
  • Eastern Europe

Scope, Methodology, and Coverage

Every figure in this report is reproducible from documented input assumptions. The scope below maps the historical period, the forecast horizon, the segmentation dimensions, and the countries covered, alongside the underlying primary and qualitative methodology.
Historical Period
2020 to 2025
Forecast Period
2026 to 2036
Base Year
2025 (USD billions; MMA Primary Research Dataset, September 2026)
Market Definition
The Photonic Sensor Market covers devices that use light generation, transmission, or detection to measure distance, presence, chemical composition, or physical properties, including LiDAR, time-of-flight, fiber optic, and optical coherence tomography sensors sold as standalone components or integrated modules. It excludes conventional camera image sensors used purely for visible-light photography and software-only image processing systems that do not incorporate dedicated photonic sensing hardware.
Quantitative Units
USD billions (current prices); unit shipment volume where applicable
Segmentation Dimensions
By Primary Market Dimension; By End-Use Industry; By Commercial Dimension; By Region
Regions Covered
North America, Western Europe, East Asia, South Asia and Pacific, Latin America, Middle East and Africa, Eastern Europe
Countries Covered
USA, China, Germany, France, UK, Japan, South Korea, India, Australia, Canada, Brazil, Mexico, Indonesia, Vietnam, Thailand, Malaysia, UAE, Saudi Arabia, South Africa, Nigeria, Turkey, Poland, Netherlands, Italy, Spain, Sweden, Switzerland, Argentina, Colombia, Singapore, and additional markets relevant to this sector
Key Companies Profiled
Hamamatsu Photonics, Sony Semiconductor Solutions, ams OSRAM, Hesai Group, Lumentum Holdings, RoboSense, Innoviz Technologies, Velodyne Lidar, Ouster, Luminar Technologies, Cepton, Infineon Technologies, STMicroelectronics, Analog Devices, IPG Photonics, II-VI Incorporated, Trumpf, Carl Zeiss AG, Keyence Corporation, First Sensor
Quantitative Methodology
Primary survey, n=3,800 respondents, Q4 2025, six countries; demand-side model with trade association cross-validation
Qualitative Methodology
47 expert interviews, Q4 2025; applied to validate demand model assumptions, identify emerging dynamics, and assess competitive positioning
Report Format
PDF and XLSX data workbook (Word format preview document)
Publisher
Market Minds Advisory
Report Code
MMA-2026-TEC-970
Published
September 2026
Contact
sales@marketmindsadvisory.com | www.marketmindsadvisory.com

Purchase the full Photonic Sensor Market Report (2026 to 2036).

This report delivers a comprehensive assessment of the global Photonic Sensor Market, covering sizing, segmentation, competitive dynamics, and regional demand patterns through 2036. It profiles twenty leading vendors across LiDAR specialists, component fabricators, and diversified technology companies, examining how autonomous vehicle programs and industrial automation are reshaping adoption economics. The analysis draws on primary survey data from 3,800 respondents and 47 expert interviews conducted in the fourth quarter of 2025. Readers gain a structured view of where qualification value concentrates and how sourcing strategy should evolve.
Detailed twenty-vendor competitive profiles and positioning
Full seven-region demand share and CAGR breakdown
Six-segment product growth and margin tier analysis
In-depth laser diode supply chain risk assessment
Automotive LiDAR qualification and strategy guidance
Anonymized client sensor sourcing engagement case study

Built For The People Who Decide

From boardroom strategy to bench-side execution, this report is read cover-to-cover by leaders shaping the next decade of their industry, turning demand scenarios, market dynamics and valuation benchmarks into decisions.
CXOs/ Presidents/ VPs/ Managers
M&A and Corporate Development
Strategy Teams and R&D Heads
Procurement and Product Directors
Regulatory and Compliance Leaders
Investor Relations and Equity Analysts