Market Minds Advisory
Photo Editor App Market

Photo Editor App Market: Photo Editor App Market: Consumer Editing, Generative Tools and Subscription Economics, 2026 to 2036

About one install in thirty ever pays, and the ones who do are almost all editing pictures of themselves. Publishers who built tools for photographers built for a customer that does not spend.

Lead Analyst

Published

September 2026

Make Smarter Decisions with Customized Research Insights

Request a free sample report and evaluate market opportunities, growth trends, and competitive dynamics relevant to your business needs.

2025 MARKET VALUE$5.4BMarket Size 2025
2036 FORECAST VALUE$20.3BBase Case , 2026 to 2036
CAGR 2026 TO 203612.8 %Bull 14.1% / Bear 11.5%
INCREMENTAL OPPORTUNITY$14.2BNet 10- year value creation
EXPANSION MULTIPLE3.33x2036 value over 2026 base
Strategic Levers
M&A Pipeline
Regional Outlook
Country Rankings
Competitive Intelligence
Segmental Deep-dive
Call-Us : 91 93563 13602

Executive Snapshot and Market Trajectory.

Roughly 3.4% of installs ever convert to paying, and 62% of paid revenue comes from retouching people rather than scenes. The paying customer is editing a picture of their own face. A decade of product investment has been aimed at people who stay free. That gap is very wide.
Generative editing and object replacement grows at 19.2%, half again the market rate of 12.8%, and it has broken the unit economics underneath the subscription model. Each generated image costs the publisher around USD 0.019 in inference, so the busiest subscribers now cost about 1.7 times what they pay. Flat monthly pricing was never designed for a product with marginal cost. Nobody designed for this.
Five publishers hold 41% of category revenue, and East Asia takes 31% of it, well above what user counts alone would produce. Chinese and Korean publishers established portrait retouching as a paid category years before Western competitors treated it seriously. Distribution fees and inference together consume more than half of what a subscription collects. Annual revenue per payer sits near USD 31, so there is very little left to divide once both are paid.
Market Definition
This market covers consumer and prosumer photo editing applications sold on subscription or purchase, including general mobile photo editing, generative editing and object replacement, portrait retouching and beautification, professional desktop and raw workflow software, restoration and enhancement tools, and template and social content creation. It excludes video editing applications, camera hardware and firmware, stock image licensing, social platform editing features not separately monetised, and enterprise digital asset management.
Base Year Value
$5.4B in 2025 (MMA Primary Research Dataset, September 2026)
Forecast Period
2026 to 2036, eleven discrete annual values
CAGR
12.8% base case. Bull 14.1%. Bear 11.5%.
Fastest Growth Segment
Generative Editing And Object Replacement: 19.2% CAGR
Fastest Growth Country
Indonesia: 18.4% CAGR
Fastest Growth Region
South Asia and Pacific: 14.9% CAGR
Largest Region
East Asia: 31% of 2025 global value
Market Leaders
Adobe, Canva, Picsart, Meitu, and Lightricks lead the field. Source: MMA Primary Research Dataset, July 2026.
Primary Survey
n=3,800 procurement and R&D decision-makers, Q4 2025, six countries
Methodology
Demand-side build-up, cross-validated against public data, 47 expert interviews

Photo Editor App Market Forecast Scenarios

photo-editor-app-market-size-forecast-scenario-1790007950312
Growth between 2020 and 2025 came from subscription conversion rather than from new users. Install bases were already enormous and largely free, and publishers spent the period converting a small fraction of them onto recurring plans while raising prices on those who stayed. Historical growth of 11.4% reflects that monetisation work, which was mostly complete in mature markets before generative tools arrived and changed the product entirely.
The base case at 12.8% rests on three mechanisms. Generative editing gives publishers something genuinely new to charge for after a decade of incremental filter improvements. Local payment methods and carrier billing across Southeast Asia and Latin America are removing the card requirement that suppressed conversion in very large install bases. And restoration tools reach an audience with no interest in photography, editing old family pictures rather than making new ones.
The bull case at 14.1% turns on generative capability becoming valuable enough that consumers accept usage based pricing, which would fix the marginal cost problem and raise revenue per user substantially. The bear case at 11.5% is device manufacturers absorbing generative editing into the camera application, which would remove the reason to install anything at all for the majority of casual users.

The Paying User Edits Themselves

The commercial centre of this market is portrait editing, and it took Western publishers an embarrassingly long time to accept that. Some 62% of paid revenue comes from retouching faces and bodies, not from adjusting exposure on landscapes. Conversion runs at 3.4% of installs, and the converting user is overwhelmingly editing a photograph of themselves before posting it somewhere.
TOP FIVE CONCENTRATION41%Share of category revenue held by the leading publishers
INSTALL TO PAID CONVERSION3.4%Share of installs that ever become paying subscribers
GENERATIVE EDIT COSTUSD 0.019Inference expense incurred by the publisher per generated image
HEAVY USER COST RATIO1.7Compute cost against subscription revenue for the busiest users
PORTRAIT SHARE OF REVENUE62%Paid revenue from retouching people rather than scenes
ANNUAL REVENUE PER PAYERUSD 31Average paid by a converting subscriber each year
Generative tools then introduced a cost structure the category had never carried. Every generated image costs the publisher roughly USD 0.019 in inference, which is trivial once and significant across a heavy user producing hundreds monthly. The busiest subscribers now cost about 1.7 times what they pay, and a flat monthly price cannot absorb that indefinitely without limits somewhere. Flat pricing cannot absorb that indefinitely without limits.
Distribution takes the rest. Application platform commissions plus inference consume more than half of what a subscription collects before any engineering is paid for, which is why publishers with direct billing relationships or carrier arrangements operate at margins the store-dependent majority cannot approach. Annual revenue per payer sits near USD 31, so there is not much to divide. Direct billing is the only escape available.
"For a decade this industry built sophisticated tools for people who wanted better photographs, and the money was always with people who wanted to look better in them. The publishers who accepted that early are the ones with subscription businesses. The others have very large free user bases."
Practice Director, Consumer Applications and Digital Media · MMA Technology Practice · September 2026

Market Trends

Generative Editing Introduces Marginal Cost To Subscriptions

Photo editing was pure software for its entire history, with no cost attached to a user opening the application a thousand times. Generative fill, object removal, and background replacement each consume inference, roughly USD 0.019 per generated image, which turns usage into expense for the first time. Heavy subscribers now cost about 1.7 times what they pay. Publishers are responding with credit allowances, tiered generation limits, and usage based upgrades, all of which complicate a pricing model consumers had found refreshingly simple to understand. Consumers had found flat pricing refreshingly simple to understand.
Market Impact: Segment grows at 16.7%
Local Payment Methods Remove The Conversion Barrier

Very large install bases across Southeast Asia and Latin America converted poorly for a reason that had nothing to do with product quality: users did not hold the payment cards that application stores required. Carrier billing, local wallets, and regional payment methods have removed that obstacle. Indonesian growth of 18.4% leads every country covered as a direct consequence. Conversion in these markets is now approaching mature market rates, though revenue per payer remains far lower, so the effect on revenue is smaller than the user figures suggest. Revenue per payer stays far lower than mature markets.
Market Impact: Generates 62% of revenue

Market Opportunities and Growth Drivers

Restoration Reaches Users With No Photographic Interest

Enhancing and repairing old family photographs attracts an audience that has never wanted to edit anything and will not download a creative tool, and it converts unusually well because the outcome is emotional rather than aesthetic. Restoration and enhancement tools grow at 16.7% on that basis. The user is frequently older, buys once or subscribes briefly, and does not compare products the way a creative user does. Acquisition through social sharing of results is remarkably efficient, since the output is inherently something people show other people. Organic distribution follows the shared result.
Market Impact: Consumes over 50% of revenue

Portrait Editing Sustains The Only Reliable Conversion

Retouching faces and bodies generates 62% of paid revenue in a category where only 3.4% of installs pay anything at all, and the reason is that the outcome matters to the user in a way an improved landscape does not. That concentration has been stable for years and shows no sign of shifting. Publishers who invested in raw processing depth, colour science, and professional workflow built genuine craft for an audience that overwhelmingly uses free tools and has no intention of paying for better ones. That audience uses free tools and intends to keep doing so.
Market Impact: Threatens 96.6% free base

Market Restraints and Challenges

Distribution Fees And Inference Consume Most Revenue

Application platform commissions plus generative inference together take more than half of a subscription before engineering is funded, and the root cause is that publishers control neither. Annual revenue per payer near USD 31 leaves very little to divide once both are paid. Commercially this caps what any store dependent publisher can invest in product, and it advantages those with direct billing or carrier arrangements. Participants respond by pursuing web checkout where platform rules allow, negotiating carrier billing terms directly, and moving smaller models onto the device. Neither party negotiates with the publisher.
Market Impact: Costs USD 0.019 per image

Device Manufacturers Absorb Editing Into Camera Software

Object removal, background replacement, and portrait adjustment increasingly ship inside the camera application that arrives with the phone, and the root cause is that manufacturers use these features to differentiate hardware rather than to earn software revenue. For casual users this removes any reason to install a separate application. Commercially it erodes the free install base that conversion depends on. Participants respond by pursuing depth manufacturers will not match, by targeting restoration and portrait users with specific intent, and by building presence on desktop where manufacturers do not compete. Manufacturers differentiate hardware rather than earn software revenue.
Market Impact: Drives 18.4% Indonesian growth
3 additional market trends, 4 additional growth drivers, and 2 additional restraints and challenges are covered in the full report. Contact sales@marketmindsadvisory.com to access the complete intelligence.

Segment CAGR and Growth Architecture

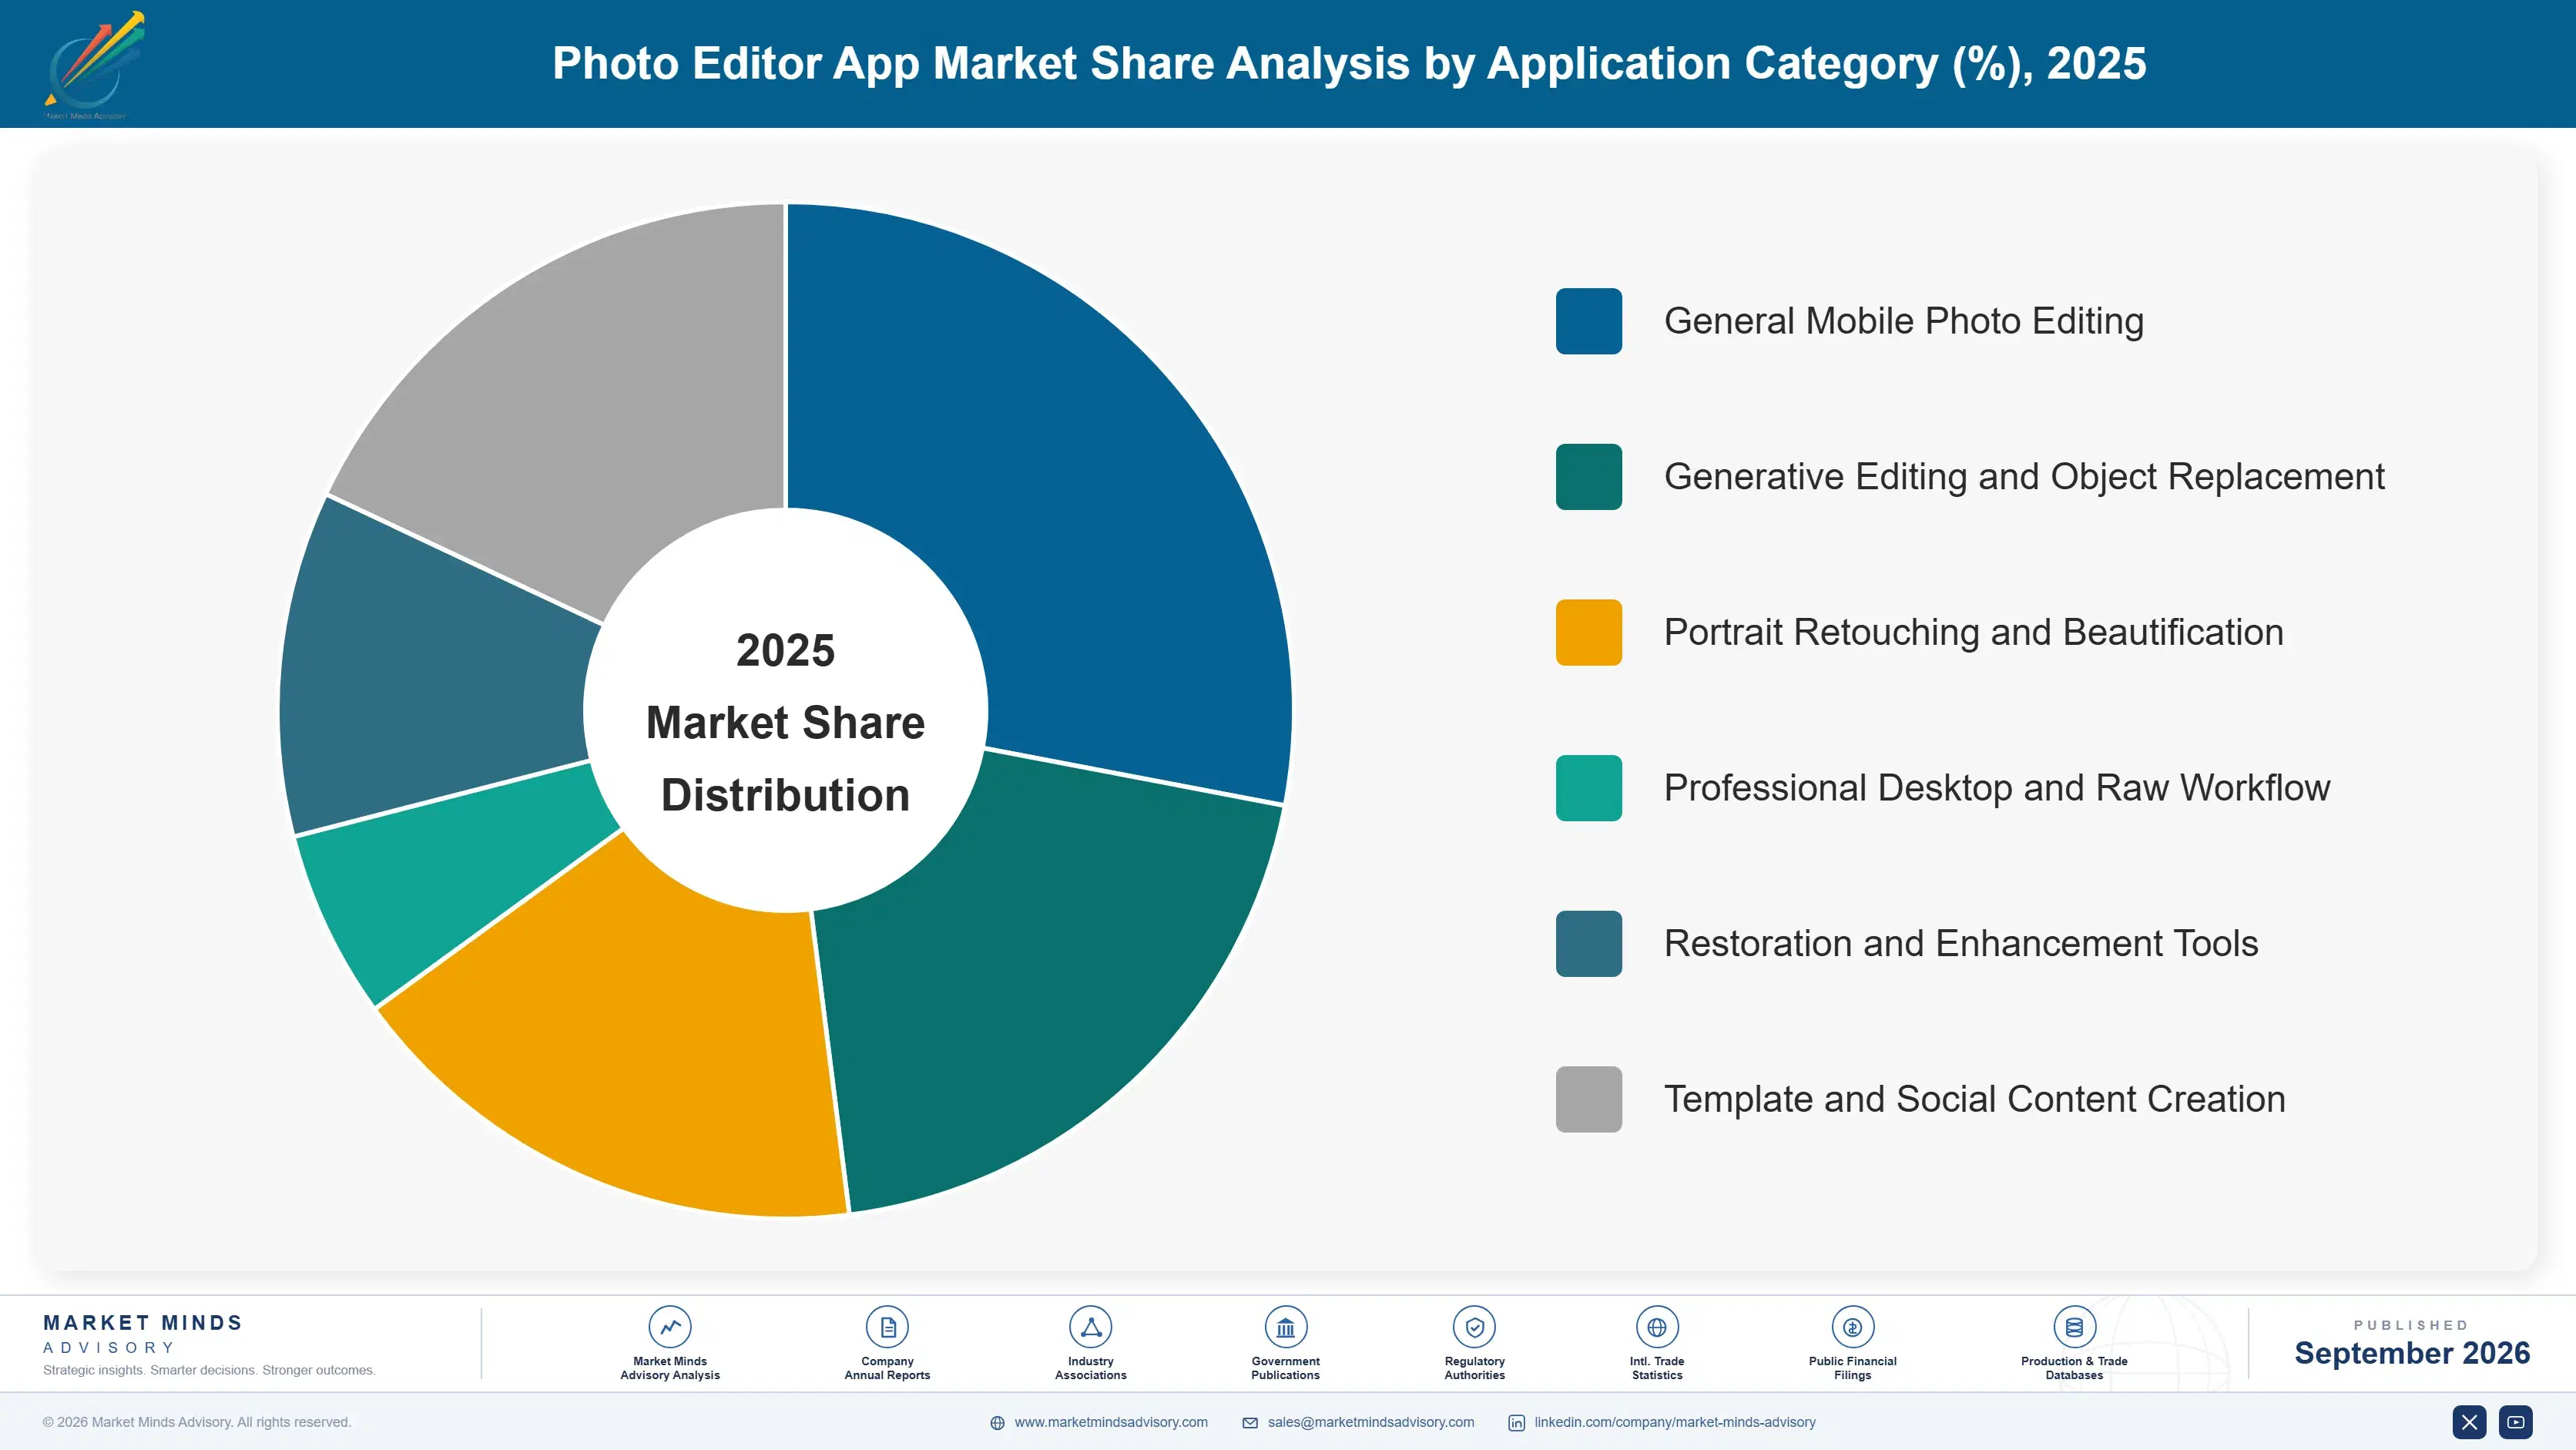
Segmentation follows what the application does. Six categories cover the market: general mobile photo editing, generative editing and object replacement, portrait retouching and beautification, professional desktop and raw workflow, restoration and enhancement tools, and template and social content creation. Portrait editing carries revenue while generative tools carry growth. Professional workflow attracts the least paying audience of the six.
photo-editor-app-market-market-share-analysis-1790007950907

Generative Editing And Object Replacement

Generative editing grows at 19.2%, half again the market rate of 12.8%, and it is the first genuinely new thing publishers have had to sell after a decade of incremental filter improvement. It also carries the category's first marginal cost, at roughly USD 0.019 per generated image, which means the busiest subscribers cost about 1.7 times what they pay under flat monthly pricing. Credit allowances and generation limits are the industry's answer so far, and they complicate a model consumers had understood easily. Whether users accept usage based pricing is the open commercial question in this segment. Nobody has answered it yet. Users had understood the old model easily. Limits arrived quickly.
CAGR 19.2%

Restoration And Enhancement Tools

Restoration grows at 16.7% by reaching people who have no interest in photography at all. Repairing a damaged family photograph is an emotional outcome rather than an aesthetic one, and it converts far better than creative editing because the user wants a specific result rather than a capability. The buyer is frequently older, purchases once or subscribes briefly, and does not compare products against alternatives the way a creative user does. Acquisition is unusually efficient, since restored photographs are inherently things people show to family, which produces organic distribution no advertising budget can match. Positioning it separately rather than burying it inside a creative suite decides whether anybody finds it.
CAGR 16.7%
Full segment breakdown across 6 segments available in the complete report.

Regional Architecture and Country Demand Map

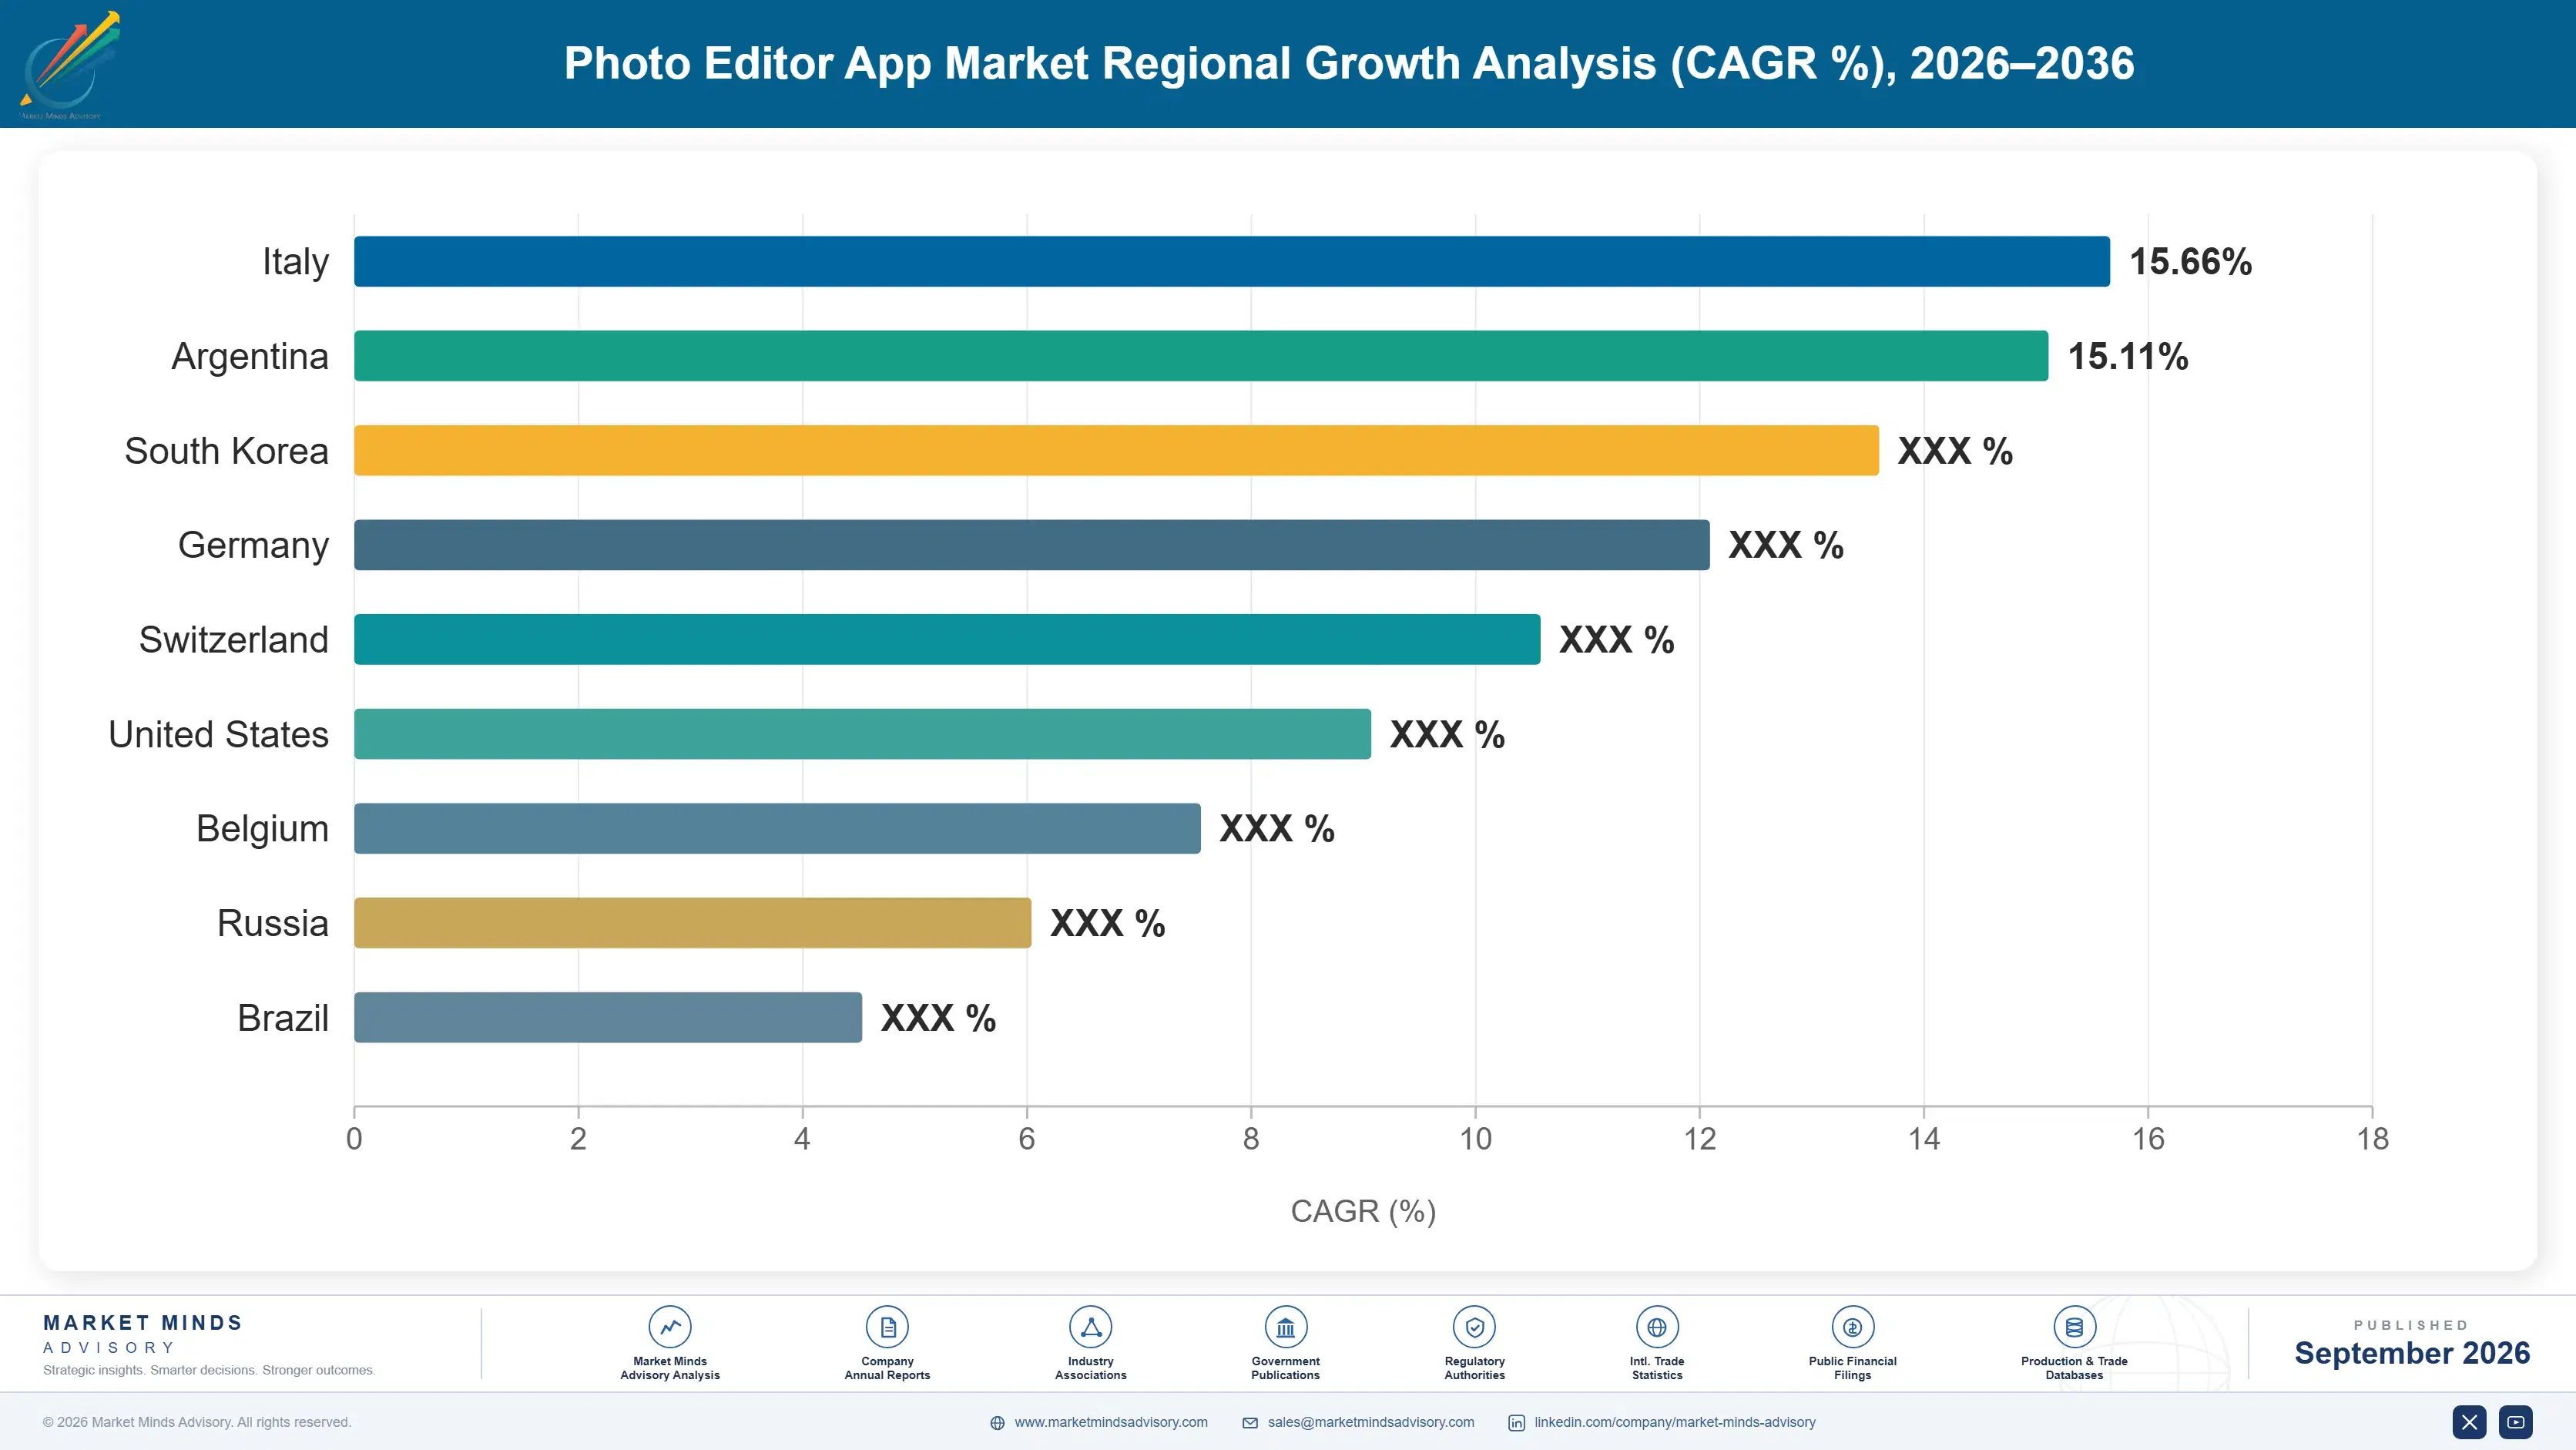
Regional shares reflect paid revenue rather than installs or usage, and the two diverge enormously. Read the table as a revenue map, because several regions carry install bases among the largest anywhere while contributing very little. Install counts and paid revenue tell entirely different stories here.

East Asia

At 31% East Asia sits just above the standard band, and portrait editing explains most of it. Chinese and Korean publishers established beautification as a paid category years before Western competitors took it seriously, and consumer willingness to pay for appearance editing is higher here than anywhere else covered. Japanese users spend well on both portrait and creative tools. Growth of 13.8% runs above the world rate as generative capability extends what these applications can offer. Domestic publishers dominate Chinese revenue, and international competitors have made very little progress against them. Willingness to pay for appearance editing is higher here than anywhere else covered in this report. Domestic publishers dominate.
Share: 31% | CAGR: 13.8% (2026 to 2036)

North America

Revenue per payer is the highest of any region, which carries a 24% share on an install base far smaller than Asia's. Professional and prosumer desktop subscriptions account for an unusually large proportion, since this is where the paying creative audience genuinely concentrates. Generative editing adoption has been rapid, and so has resistance to the credit allowances that followed it. Growth of 11.9% is moderate, held back by conversion that is already close to its ceiling and by device manufacturers absorbing casual editing into camera applications shipped with the phone. Resistance to credit allowances has been as rapid as adoption of the generative features themselves. Conversion is near its ceiling.
Share: 24% | CAGR: 11.9% (2026 to 2036)
Regional intelligence for 5 additional markets available in the complete report: Western Europe, South Asia and Pacific, Latin America, Middle East and Africa, Eastern Europe. Contact sales@marketmindsadvisory.com.
photo-editor-app-market-country-cagr-analysis-1790007951435

Where Publishers Actually Earn Money

Four commercial moves separate publishers with real subscription businesses from those holding very large free install bases. Each starts from the same uncomfortable arithmetic: about 3.4% of installs pay, revenue per payer is near USD 31, and platform fees plus inference take over half of that. Install growth contributes nothing to any of it.

Build For The Face Not The Photograph

Portrait retouching generates 62% of paid revenue while professional colour and raw processing depth attracts users who overwhelmingly stay free. Publishers reallocating product investment toward appearance editing report conversion improving 40% to 70% within a year, because the outcome matters to the user in a way a better landscape never did. It is an uncomfortable reallocation for teams who take photography seriously, and the revenue evidence has been consistent for a decade now. Teams who take photography seriously find the reallocation genuinely uncomfortable, and the revenue evidence has not changed in a decade.
Market Impact: Improves paid conversion by 40% to 70% overall

Price Generative Usage Rather Than Absorbing It

Every generated image costs roughly USD 0.019 in inference, and the busiest subscribers now cost about 1.7 times what they pay under flat monthly pricing. Publishers introducing credit allowances with paid top-ups recover margin on heavy users while leaving light users unaffected, improving contribution per subscriber by 20% to 35%. Consumers dislike the complexity and accept it when the allowance is generous enough that most never encounter it, which requires setting the threshold from actual usage distribution rather than from finance preference. Thresholds set from finance preference rather than usage data generate complaints for no additional margin.
Market Impact: Improves contribution per subscriber by 20% to 35%

Reach Emerging Markets Through Carrier Billing

Install bases across Southeast Asia and Latin America stayed free because users lacked the payment cards application stores required, not because the product failed them. Carrier billing and local payment methods removed that, and publishers integrating them report conversion in these markets rising 2.6 times within a year. Revenue per payer remains far below mature markets, so the tiers have to be built for those price points deliberately rather than converted from existing plans at an exchange rate. Converting mature market plans at an exchange rate produces prices nobody in these markets pays.
Market Impact: Raises market conversion by roughly 2.6 times overall

Target Restoration Buyers Who Reject Creative Tools

Repairing old family photographs reaches people with no interest in photography and converts far better than creative editing, because the user wants a specific emotional outcome rather than a capability. The segment grows at 16.7%. Acquisition is unusually cheap, since restored photographs are inherently shown to family, generating organic distribution that advertising cannot match. Publishers treating restoration as a separate product with its own positioning rather than a feature buried in a creative suite convert at roughly 3.1 times the rate. The buyer is older, buys once, and does not compare products.
Market Impact: Converts 3.1 times better than embedded features do

Who Controls the Margin Pool

Concentration is moderate. Five publishers hold 41% of category revenue, measured consistently on that basis across all participants, and they occupy quite different positions: a professional software incumbent, a design platform, and three mobile-first publishers built around portrait and social editing. The gap between the leader and the fifth is wide, and it reflects desktop subscription pricing more than any advantage in mobile user numbers. Desktop pricing rather than mobile reach explains the ranking.
Competition currently turns on three things: portrait editing quality that converts, generative capability priced without destroying margin, and payment reach into markets where cards are uncommon. Professional processing depth differentiates among a small and largely non-paying audience, which is why it decides so few commercial outcomes despite absorbing so much engineering attention. Engineering attention and commercial outcome have parted company here.

Pressure comes from two directions. Device manufacturers are absorbing casual editing into camera applications shipped with the phone, eroding the free install base at its source. Meanwhile design platforms with broader content creation are taking users who edit photographs as part of making something else. Rankings will shift toward publishers who price generative usage sustainably. Sustainable generative pricing decides the next few years.
photo-editor-app-market-company-positioning-matrix-1790007951963

Competitive Moat and Risk Dimensions

ADOBE

Moat: Professional Workflow And Format Depth

Decades of raw processing, colour management, and file format handling produce capability that professional and serious amateur users depend on and cannot replace, supported by a desktop subscription price point far above anything mobile publishers command. That revenue per user is what allows sustained investment nobody else in the category can fund.
ADOBE

Risk: Paying Audience Is Narrow

The professional and prosumer audience is small and largely already converted, while 62% of category revenue comes from portrait editing among consumers who do not want workflow depth at all. Growing beyond the existing base means competing on appearance editing against publishers whose products were designed for exactly that from the start.
MEITU

Moat: Portrait Category Definition Advantage

Establishing beautification as a paid consumer category years ahead of Western competitors produced both an installed habit and an accumulated understanding of what users actually want from appearance editing. That head start is visible in conversion rates, and international competitors have made very little progress against the position in its home market.
MEITU

Risk: Generative Cost Exposure Highest

Portrait applications generate the heaviest per-user edit volumes in the category, which makes inference cost exposure larger here than anywhere else at roughly USD 0.019 per generated image. Introducing usage limits risks the engagement the business depends upon, and absorbing the cost erodes margin on precisely the most valuable subscribers.

Players Tracked

Prominent Players

Adobe
Canva
Picsart
Meitu
Lightricks

Other Key Players

Google
Apple
Samsung Electronics
ByteDance
Snap
VSCO
BeFunky
Pixelmator
Skylum
ON1
Capture One
Topaz Labs
Remini
PhotoRoom
Fotor

Recent Developments

FEBRUARY 2026

Adobe Introduces Generation Credit Allowances Across Consumer Plans

Adobe introduced monthly generation credit allowances with paid top-ups across consumer subscription tiers, recovering inference cost from heavy users while leaving the great majority of subscribers unaffected by any change to what they pay. Allowances were set from observed usage distribution rather than from any finance target.
Signal: Flat subscription pricing is being retired quietly wherever generative usage carries genuine marginal cost per image.
SEPTEMBER 2025

Picsart Signs Carrier Billing Agreement For Southeast Asian Markets

Picsart entered a carrier billing agreement across several Southeast Asian markets, removing the payment card requirement that had suppressed conversion within install bases among the largest the publisher operates anywhere. Local price tiers were built specifically for these markets rather than converted from existing plans at an exchange rate.
Signal: Payment reach rather than product quality was the binding constraint in these very large install bases.
MAY 2025

Canva Acquires Photo Restoration And Enhancement Specialist

Canva completed an acquisition of a photo restoration specialist, adding a product reaching users with no interest in creative editing at all and converting on emotional outcome rather than on any creative capability offered. The acquired product will be positioned separately rather than folded into the design suite.
Signal: Restoration is being bought as a separate product because burying it inside creative suites suppresses conversion.

What A Subscription Actually Costs

Three inputs dominate publisher cost. Generative inference compute runs 28% to 36% of cost of goods sold for publishers with significant generative usage, and nothing at all for those without it. Application platform distribution commissions take 22% to 30% of revenue collected through stores. Engineering and content operations add a further 20% to 27%. Two of the three are set by parties the publisher cannot negotiate with.
Inference pricing moved substantially through 2024 and 2025 as model efficiency improved while generative feature usage rose sharply, and several publishers described the resulting margin volatility in their annual reports for those years. Efficiency gains were largely absorbed by higher usage rather than falling to the bottom line, which is a pattern this category should expect to continue for some time. This category should expect that to continue.

The competitive disadvantage mechanism runs through payment routing rather than through compute. A publisher collecting entirely through application stores surrenders up to 30% before anything else is paid, while one with web checkout or carrier arrangements keeps a materially larger share of the same subscription. Exposure varies by publisher type. Desktop-led publishers bill directly. Mobile-first publishers carry the full commission on almost everything.
photo-editor-app-market-cost-volatility-analysis-1790007952160

Move Smaller Generative Models Onto The Device

Not every generative operation requires server inference, and running smaller models locally removes the per-image cost entirely for the operations users perform most often. Quality is lower for complex edits, and for background removal or simple object erasure the difference is rarely noticed, which is precisely where the volume sits. Volume sits in the simple operations.

Route Renewals Through Direct Web Checkout

Application store commissions apply to what passes through them, and subscription renewals do not always have to. Publishers moving renewals to web checkout where platform rules permit retain materially more of the same revenue, though acquisition must still run through stores where discovery genuinely happens. Acquisition must still run through stores where discovery genuinely happens.

Set Generation Allowances From Actual Usage Distribution

Credit allowances protect margin only if they are set where the usage curve actually bends rather than where finance would prefer. Publishers analysing real distribution before setting thresholds report far less subscriber complaint at the same margin recovery, because most users never encounter the limit at all. Most subscribers then never encounter the limit at all.

Portfolio Architecture for Margin Defence

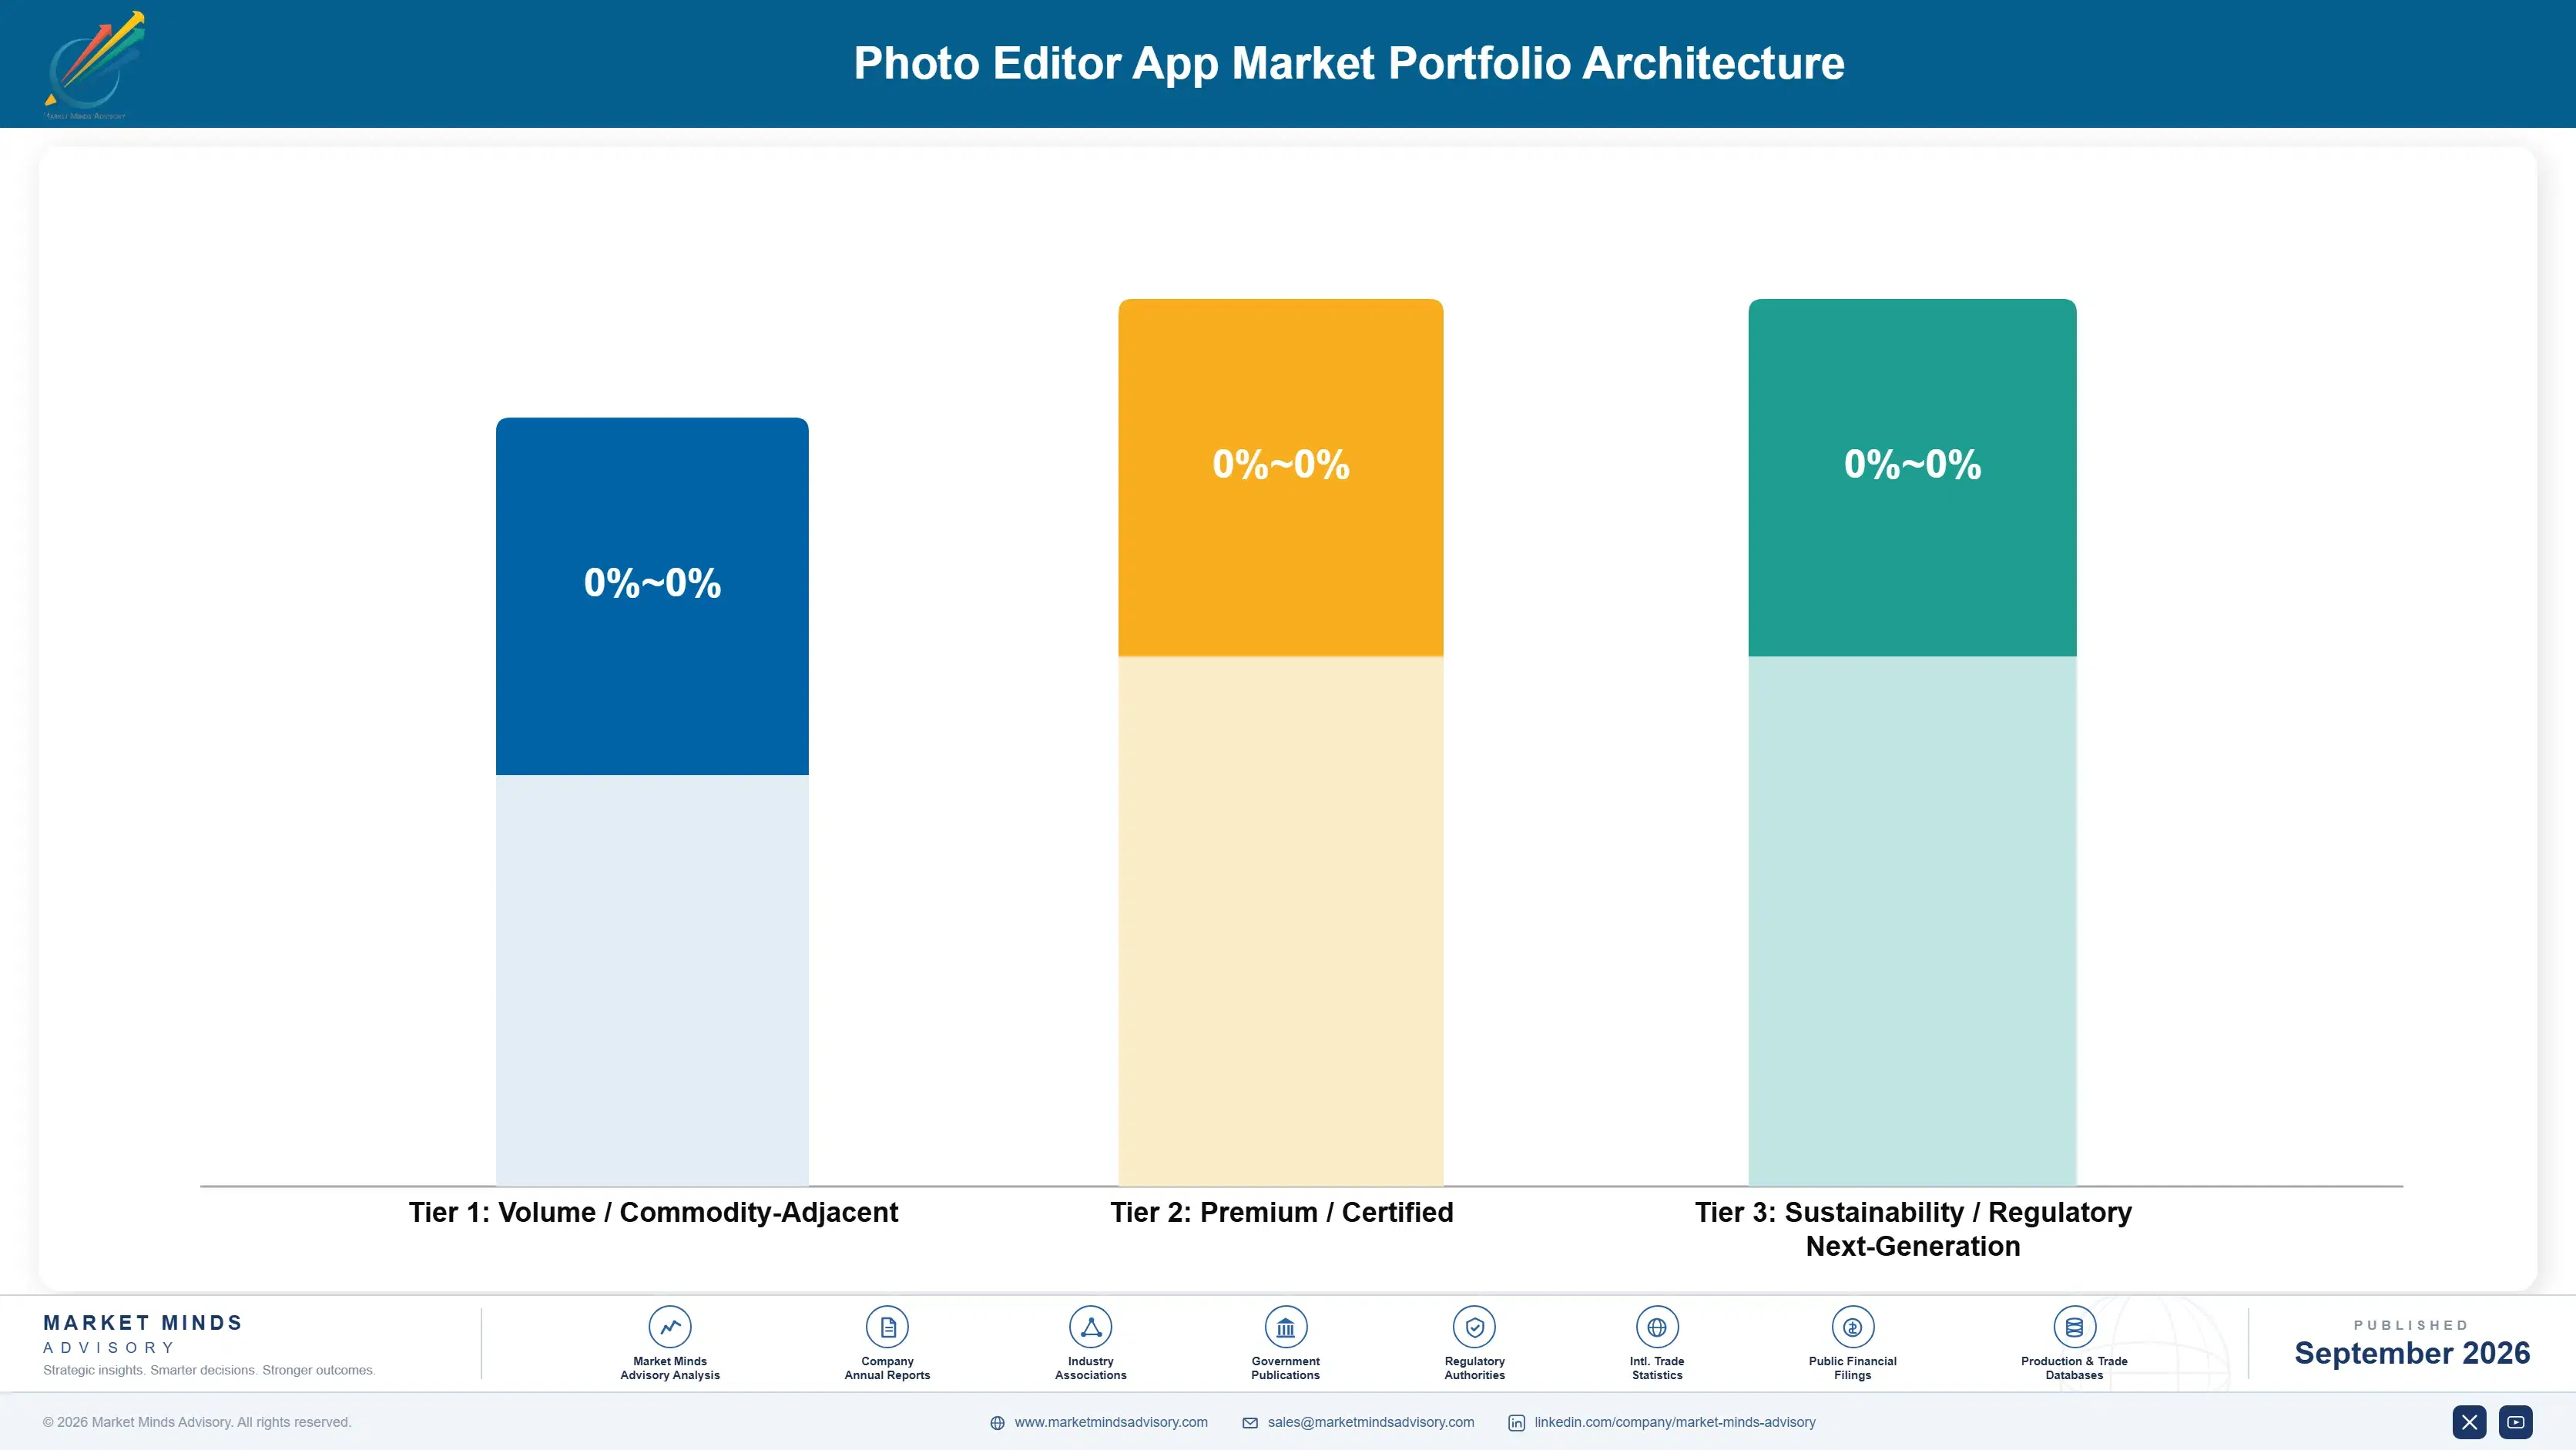
Margin follows whether the publisher controls billing and whether the feature carries compute cost. Free supported mobile editing earns almost nothing, since advertising revenue per user in this category is low and the audience is enormous. Portrait subscriptions collected through stores earn moderately. Direct billed desktop subscriptions and restoration products with local processing earn most, because neither surrenders a commission nor consumes inference per use.
The tension between volume and premium is severe and rarely discussed honestly. Install growth is nearly free to celebrate and contributes nothing, since 96.6% of installs never pay and heavy free users of generative features actively cost money. Paid conversion scales with product fit to the portrait and restoration audiences rather than with total downloads, which most publisher reporting obscures.

High-value pools concentrate where the user wants a specific outcome and will pay for it: portrait retouching before posting, restoring a damaged family photograph, and professional workflow among the small audience that genuinely needs it. These share a user with intent. Casual editing has no intent behind it, converts at almost nothing, and is being absorbed into the camera application anyway.

Volume / Commodity-Adjacent

Advertising supported casual mobile editing across very large free install bases with negligible revenue per user. Device manufacturers are absorbing the same functionality into camera applications. The twelve-point range reflects wide variation in advertising monetisation between publishers with different audience compositions.
Gross Margin: 22% to 34%

Premium / Certified

Portrait and creative subscriptions collected through application stores, surrendering commission on everything and carrying inference cost on generative features. The ten-point range separates publishers with generation allowances from those absorbing heavy user compute cost under flat monthly pricing.
Gross Margin: 48% to 58%

Sustainability / Regulatory / Next-Generation

Direct billed desktop subscriptions, restoration products processing locally, and carrier billed arrangements outside store commission. Neither commission nor per-image inference applies at full rate. The twelve-point range reflects how differently publishers have restructured payment routing across their subscriber bases.
Gross Margin: 64% to 76%
photo-editor-app-market-portfolio-architecture-1790007952663

High-value Sub-segments and Strategic Watch-out

Portrait Retouching Subscriptions

The revenue core, generating 62% of paid revenue on a category conversion rate of just 3.4%. Users want a specific outcome and pay for it reliably. The ten-point range reflects generative cost exposure, which runs highest here because portrait applications produce the heaviest edit volumes.
Gross Margin: 52% to 62%

Restoration And Enhancement Products

Growing at 16.7% and reaching users with no interest in photography, converting on emotional outcome rather than creative capability. Acquisition is unusually cheap through organic family sharing. The twelve-point range separates local processing from server inference on every restoration performed. Emotional outcome converts far better than capability.
Gross Margin: 60% to 72%

Generative Editing Feature Sets

Fastest growth at 19.2% and the first feature class in this category carrying real marginal cost at roughly USD 0.019 per image. Heavy subscribers cost about 1.7 times what they pay. The fourteen-point range reflects how far publishers have moved toward usage based pricing. Pricing is unresolved.
Gross Margin: 38% to 52%

Free Casual Mobile Editing

The strategic watch-out. Enormous install bases converting at almost nothing, monetised through low value advertising, and increasingly served by camera applications shipped with the phone. The fourteen-point range reflects advertising yield differences that do not change the underlying commercial problem at all. Camera applications absorb it.
Gross Margin: 18% to 32%

How These Subscriptions Behave

Retention in this category is unusually poor and publishers rarely publish it. Portrait subscribers frequently convert for a specific occasion and cancel afterwards, restoration buyers finish the photographs they cared about and leave, and only professional users renew from habit and dependency. Annual revenue per payer near USD 31 reflects short subscription lives more than it reflects low monthly pricing.
Engagement depth varies enormously by intent. Professional and prosumer desktop users embed deeply, with file libraries, presets, and workflow habits that make switching genuinely costly. Portrait users are attached to results rather than to any product and move readily when a competitor's output looks better. Casual editors have no attachment at all, and their behaviour is increasingly satisfied by whatever arrived on the phone.

The user has not changed but the publisher's understanding of them has, slowly and reluctantly. Product organisations built by photographers spent years serving an audience that mostly does not pay, while the revenue concentrated among people editing their own faces. Publishers who accepted that reallocated product investment years ago, and the conversion gap between the two groups is now very wide indeed.
photo-editor-app-market-end-use-penetration-index-1790007953153

Where This Market Rewards

These are among the four positions where our research anticipates prominent divergence between winners and laggards over the coming forecast period. Each is grounded in the demand model, the regulatory perimeter, and the announced capacity pipeline.
01 / AUDIENCE REALITY ACCEPTANCE

The money is in faces, not in photographs

Portrait retouching generates 62% of paid revenue in a category where only 3.4% of installs ever convert, while professional colour and raw processing depth attracts an audience that overwhelmingly stays free and intends to. Publishers reallocating product investment toward appearance editing report conversion improving 40% to 70% within a year. It is an uncomfortable reallocation for teams who take photography seriously, and the evidence has been consistent for a decade, and product organisations keep arguing with it anyway every year.
02 / MARGINAL COST PRICING

Flat subscriptions cannot absorb generative compute

Every generated image costs roughly USD 0.019 in inference, which means the busiest subscribers now cost about 1.7 times what they pay under a flat monthly price the category adopted when software had no marginal cost at all. Credit allowances with paid top-ups improve contribution per subscriber by 20% to 35% while leaving most users unaffected. Setting the threshold from actual usage distribution rather than finance preference is what keeps complaints down, and generous allowances mean most users never notice.
03 / PAYMENT REACH EXPANSION

Cards were the barrier, not the product

Enormous install bases across Southeast Asia and Latin America converted poorly because users did not hold the payment cards application stores required, which had nothing to do with whether the software served them well. Carrier billing and local payment methods lifted conversion 2.6 times within a year for publishers who integrated them. Revenue per payer stays far below mature markets, so tiers must be built for those price points deliberately, rather than converted at an exchange rate from existing plans.
04 / INTENT BASED POSITIONING

Restoration buyers will not open a creative suite

Repairing an old family photograph is an emotional outcome rather than a creative one, and it reaches people who have never wanted to edit anything and will not download a creative tool to do it. The segment grows at 16.7% with unusually cheap acquisition, since restored photographs get shown to family. Publishers positioning restoration as a separate product rather than a buried feature convert at roughly 3.1 times the rate, which is among the widest gaps in this whole category.

Engagement Snapshot From the Field

A live engagement with an industry participant carrying material or product regulatory and market exposure ahead of a defining policy shift, showing how our research translates into a defensible multi-year portfolio strategy.
MARKET MINDS ADVISORY · CLIENT ENGAGEMENT SUMMARY
Photo Editor App Producer Strategic Portfolio Review and Transition Roadmap 2026·Investment Scenario on Photo Editor App Exposure Evaluation 2025-26
CLIENT PROFILE
A mobile photo editing publisher with approximately 240 million lifetime installs across creative and portrait applications, and annual revenue near USD 190 million (client-reported, unverified by MMA). Generative features had been added to all products eighteen months earlier under existing flat subscription pricing, and gross margin had declined in every quarter since without an agreed explanation.
STRATEGIC CHALLENGE
Management believed the margin decline came from rising advertising acquisition costs, while the finance team suspected inference expense. Separately, install growth in Southeast Asia was strong and revenue from those markets was negligible, and nobody had established whether the cause was product fit or payment friction. Neither hypothesis had been tested against usage data.
MMA APPROACH
MMA decomposed cost per subscriber by usage decile to isolate inference expense, analysed conversion by market against available payment methods rather than against product engagement, and compared revenue contribution across creative, portrait, and restoration products to test where investment was actually returning. Restoration usage was isolated within the creative product.
KEY FINDINGS
  1. The heaviest 6% of subscribers consumed 54% of inference cost and generated negative contribution under flat pricing, which fully explained the observed margin decline.
  2. Southeast Asian conversion tracked payment method availability almost exactly, while measured engagement in those markets matched or exceeded mature market levels throughout.
  3. The portrait application converted at 5.8% of installs against 1.9% for the creative product, while creative had received roughly twice the engineering investment over three years.
  4. A restoration feature buried inside the creative application was used by very few, though users who found it converted at more than four times the product average.
CLIENT PROFILE
A mobile photo editing publisher with approximately 240 million lifetime installs across creative and portrait applications, and annual revenue near USD 190 million (client-reported, unverified by MMA). Generative features had been added to all products eighteen months earlier under existing flat subscription pricing, and gross margin had declined in every quarter since without an agreed explanation.
STRATEGIC CHALLENGE
Management believed the margin decline came from rising advertising acquisition costs, while the finance team suspected inference expense. Separately, install growth in Southeast Asia was strong and revenue from those markets was negligible, and nobody had established whether the cause was product fit or payment friction. Neither hypothesis had been tested against usage data.
MMA APPROACH
MMA decomposed cost per subscriber by usage decile to isolate inference expense, analysed conversion by market against available payment methods rather than against product engagement, and compared revenue contribution across creative, portrait, and restoration products to test where investment was actually returning. Restoration usage was isolated within the creative product.
KEY FINDINGS
  1. The heaviest 6% of subscribers consumed 54% of inference cost and generated negative contribution under flat pricing, which fully explained the observed margin decline.
  2. Southeast Asian conversion tracked payment method availability almost exactly, while measured engagement in those markets matched or exceeded mature market levels throughout.
  3. The portrait application converted at 5.8% of installs against 1.9% for the creative product, while creative had received roughly twice the engineering investment over three years.
  4. A restoration feature buried inside the creative application was used by very few, though users who found it converted at more than four times the product average.
RECOMMENDED STRATEGY
Phase 1: Phase one: introduce generation credit allowances set at the ninety-fourth usage percentile, recovering heavy user cost while leaving the great majority of subscribers unaffected. Phase 2: Phase two: integrate carrier billing across the four largest Southeast Asian markets and build price tiers for those markets rather than converting existing plans. Phase 3: Phase three: separate restoration into its own product with distinct positioning, and rebalance engineering investment toward the portrait application instead.
OUTCOME
Gross margin recovered seven percentage points within two quarters, and subscriber complaints about the credit allowance affected under two percent of the base (client-reported, unverified by MMA). Southeast Asian revenue rose more than threefold on unchanged install volume. The separated restoration product reached profitability within its first year.

Frequently Asked Questions

Foundational context covering the market sizes, CAGR, scope, country, region and competition that inform every finding below. This section is provided to cover basics and most often pre-purchase conversations, answered from the MMA Primary Research Dataset.

What is the current size of the Photo Editor App Market?

The market was worth USD 5.4 billion in 2025 and reaches USD 6.1 billion in 2026. Value covers consumer and prosumer editing applications sold on subscription or purchase.

How large will the Photo Editor App Market be by 2036?

MMA forecasts USD 20.3 billion by 2036, an increase of USD 14.2 billion across the forecast period. That represents 3.33 times the 2026 base of USD 6.1 billion.

What is the CAGR for the Photo Editor App Market 2026 to 2036?

The base case compound annual growth rate is 12.8%, with a bull case at 14.1% and a bear case at 11.5%. Historical growth from 2020 to 2025 ran at 11.4%.

Which segment is growing fastest?

Generative editing and object replacement grows at 19.2%, half again the market rate of 12.8%. It also introduced the category's first genuine marginal cost per use.

Who are the major companies in the Photo Editor App Market?

Adobe, Canva, Picsart, Meitu, and Lightricks lead, holding 41% of category revenue between them. Their positions rest on quite different audiences, pricing models, and billing routes.

Which country is growing fastest?

Indonesia grows at 18.4%, as carrier billing and local payment methods removed the card requirement suppressing conversion. Revenue per payer remains far below mature markets.

Report Segmentation Architecture

The full report scope spans multiple orthogonal segmentation dimensions, with cross-tabulated demand data provided for each dimension pair. Coverage extends further to regional breakdowns, trend trajectories, and the competitive detail needed to support segment-level decision-making.

By Application Category

  • General Mobile Photo Editing
  • Generative Editing and Object Replacement
  • Portrait Retouching and Beautification
  • Professional Desktop and Raw Workflow
  • Restoration and Enhancement Tools
  • Template and Social Content Creation

By End-Use Industry

  • Individual Consumers and Social Users
  • Professional Photographers and Studios
  • Small Business and Independent Sellers
  • Marketing and Creative Agencies
  • Education and Training Institutions
  • Publishing and Media Production

By Commercial Dimension

  • Application Store Subscription
  • Direct Web Checkout Subscription
  • Carrier Billed Subscription
  • One-Time Purchase Licence
  • Advertising Supported Free Tier
  • Device Manufacturer Bundled Distribution

By Region

  • East Asia
  • North America
  • Western Europe
  • South Asia and Pacific
  • Latin America
  • Middle East and Africa
  • Eastern Europe

Scope, Methodology, and Coverage

Every figure in this report is reproducible from documented input assumptions. The scope below maps the historical period, the forecast horizon, the segmentation dimensions, and the countries covered, alongside the underlying primary and qualitative methodology.
Historical Period
2020 to 2025
Forecast Period
2026 to 2036
Base Year
2025 (USD billions; MMA Primary Research Dataset, September 2026)
Market Definition
This market covers consumer and prosumer photo editing applications sold on subscription or purchase, including general mobile photo editing, generative editing and object replacement, portrait retouching and beautification, professional desktop and raw workflow software, restoration and enhancement tools, and template and social content creation. It excludes video editing applications, camera hardware and firmware, stock image licensing, social platform editing features not separately monetised, and enterprise digital asset management.
Quantitative Units
USD billions, paid application revenue
Segmentation Dimensions
Application category, end-use industry, commercial dimension, region
Regions Covered
East Asia, North America, Western Europe, South Asia and Pacific, Latin America, Middle East and Africa, Eastern Europe
Countries Covered
China, Japan, South Korea, Taiwan, United States, Canada, United Kingdom, Germany, France, Italy, Spain, Netherlands, India, Indonesia, Vietnam, Philippines, Thailand, Australia, Brazil, Mexico, Colombia, Saudi Arabia, United Arab Emirates, Egypt, Nigeria, South Africa, Poland, Russia adjacent markets, Romania, Turkey
Key Companies Profiled
Adobe, Canva, Picsart, Meitu, Lightricks, Google, Apple, Samsung Electronics, ByteDance, Snap, VSCO, BeFunky, Pixelmator, Skylum, ON1, Capture One, Topaz Labs, Remini, PhotoRoom, Fotor
Quantitative Methodology
Primary survey, n=3,800 respondents, Q4 2025, six countries; demand-side model with trade association cross-validation
Qualitative Methodology
47 expert interviews, Q4 2025; applied to validate demand model assumptions, identify emerging dynamics, and assess competitive positioning
Report Format
PDF and XLSX data workbook (Word format preview document)
Publisher
Market Minds Advisory
Report Code
MMA-2026-TEC-561
Published
September 2026
Contact
sales@marketmindsadvisory.com | www.marketmindsadvisory.com

Purchase the full Photo Editor App Market Report (2026 to 2036).

The full report sizes the photo editor application market across six application categories, seven regions, and thirty countries, with forecasts to 2036 under base, bull, and bear cases. It examines why portrait editing generates most paid revenue while creative depth attracts non-paying users, and what generative inference cost does to flat subscription pricing. Competitive analysis covers twenty participants evaluated consistently on category revenue, with detailed treatment of platform commission exposure and device manufacturer absorption. Cost structure, margin architecture by category, and regional monetisation drivers are analysed in full. Primary research includes 3,800 survey responses and 47 expert interviews.
Six application categories sized and forecast separately
Twenty participants evaluated on paid category revenue
Regional monetisation drivers across seven geographies assessed
Margin architecture by category and billing route
Generative inference cost analysis by subscriber usage decile
Conversion benchmarks by payment method availability and market

Built For The People Who Decide

From boardroom strategy to bench-side execution, this report is read cover-to-cover by leaders shaping the next decade of their industry, turning demand scenarios, market dynamics and valuation benchmarks into decisions.
CXOs/ Presidents/ VPs/ Managers
M&A and Corporate Development
Strategy Teams and R&D Heads
Procurement and Product Directors
Regulatory and Compliance Leaders
Investor Relations and Equity Analysts