Market Minds Advisory
Phenolic Boards Market

Phenolic Boards Market: Thermal Performance Premium, Fire Regulation Pull and Resin Cost Exposure, 2026 to 2036

Phenolic foam holds the best lambda value of any rigid board on the market, and that single number is what lets specifiers meet thermal targets without losing floor area to thicker walls.

Lead Analyst

Bilal Shaikh

Published

September 2026

Make Smarter Decisions with Customized Research Insights

Request a free sample report and evaluate market opportunities, growth trends, and competitive dynamics relevant to your business needs.

2025 MARKET VALUE$2.6BMarket Size 2025
2036 FORECAST VALUE$5.4BBase Case , 2026 to 2036
CAGR 2026 TO 20366.8 %Bull 8.0% / Bear 5.6%
INCREMENTAL OPPORTUNITY$2.6BNet 10- year value creation
EXPANSION MULTIPLE1.93x2036 value over 2026 base
Strategic Levers
M&A Pipeline
Regional Outlook
Country Rankings
Competitive Intelligence
Segmental Deep-dive
Call-Us : 91 93563 13602

Executive Snapshot and Market Trajectory

Two regulations are pulling in the same direction and phenolic sits at the intersection. Thermal performance targets keep tightening while fire rules have turned against combustible insulation, and phenolic foam is one of very few products that answers both without a thickness penalty.
Aluminium-foil-faced phenolic board grows at 10.2% annually, a full 1.50 times the market rate, because the facing is what delivers both the lowest achievable lambda and the vapour control that modern wall and roof build-ups now require as standard. East Asia holds 32% of global value, slightly above the standard regional band, because Chinese fire rules governing high-rise external wall insulation pushed enormous volume toward phenolic once combustible boards were restricted on tall buildings.
Concentration is high at 58% for the top five, unusual in construction materials, and it reflects just how difficult continuous phenolic lamination genuinely is to run at acceptable yield. Friability remains the honest weakness: phenolic foam is brittle at cut edges and its residual acidity attacks unprotected steel and aluminium, which is exactly why facing quality and installation detailing decide warranty exposure far more than thermal performance ever does.
Market Definition
The market covers rigid phenolic foam insulation boards manufactured by continuous or block lamination, including aluminium-foil-faced, tissue-faced, unfaced and glass-fibre-reinforced products, together with pre-insulated phenolic ductwork board. It excludes phenolic high-pressure laminate and compact sheet, phenolic plywood and formwork panels, polyisocyanurate and polyurethane boards, mineral wool, expanded and extruded polystyrene, and phenolic resins sold as raw material.
Base Year Value
$2.6B in 2025 (MMA Primary Research Dataset, August 2026)
Forecast Period
2026 to 2036, eleven discrete annual values
CAGR
6.8% base case. Bull 8.0%. Bear 5.6%.
Fastest Growth Segment
Aluminium-Foil-Faced Phenolic Insulation Board: 10.2% CAGR
Fastest Growth Country
India: 9.8% CAGR
Fastest Growth Region
South Asia and Pacific: 9.1% CAGR
Largest Region
East Asia: 32% of 2025 global value
Market Leaders
Kingspan Group, Recticel, Asahi Kasei, Sekisui Chemical, Unilin Insulation. Source: MMA Primary Research Dataset, July 2026.
Primary Survey
n=3,800 procurement and R&D decision-makers, Q4 2025, six countries
Methodology
Demand-side build-up, cross-validated against public data, 47 expert interviews

Phenolic Boards Market Forecast Scenarios

phenolic-boards-market-trends-size-forecast-scenario-1787311686476
The market compounded at 5.6% between 2020 and 2025, and regulation shaped it more than construction volume did. Demand fell through 2020, then recovered strongly as European renovation programmes and Chinese external wall fire rules both took effect. Phenol and formaldehyde pricing rose sharply through 2022, and producers spent two years recovering margin against fixed contractor pricing.
The 6.8% base case rests on three mechanisms. First, thermal regulation keeps tightening across Europe, Japan and increasingly the Gulf, and phenolic wins wherever wall thickness is constrained by plot boundaries or floor area value. Second, fire rules continue displacing combustible insulation on buildings above eighteen metres. Third, renovation rather than new build is now the larger demand pool, and retrofit favours thin high-performance boards because existing wall assemblies cannot absorb thickness.
The bull case at 8.0% assumes European renovation funding accelerates while Gulf thermal codes tighten as announced. The bear case at 5.6% turns on competition: polyisocyanurate producers have narrowed the lambda gap considerably, and mineral wool holds an unassailable fire position, so a period of soft phenol pricing that improves polyisocyanurate cost competitiveness would slow phenolic adoption in the mid-specification pool.

Why Lambda Value Wins The Specification

Phenolic board competes on one number that nothing else in rigid insulation can match. A lambda value of 0.018 to 0.021 watts per metre kelvin means a given thermal resistance is achieved in roughly two thirds the thickness that mineral wool requires and comfortably less than polyisocyanurate needs.
TOP FIVE CONCENTRATION58%Combined position of the five largest phenolic board producers
AVERAGE SELLING PRICE$34 per sq metreTypical realised price across faced and unfaced board types
TOP PRODUCING COUNTRY SHARE36%Chinese share of global phenolic insulation board output
THERMAL CONDUCTIVITY ACHIEVED0.018 W/mKLambda value reached against competing rigid insulation products
RESIN INPUT SHARE38% of COGSPhenol formaldehyde resin share of delivered board cost
CAPACITY UTILISATION67%Average operating rate across installed continuous lamination lines
Thinness is worth real money in the right situation and almost nothing in the wrong one. On a warehouse roof where thickness costs nothing, phenolic loses immediately to cheaper products. On an inner-city apartment retrofit where every millimetre of wall build-up removes lettable floor area, or on a facade constrained by a plot boundary, the arithmetic reverses completely. Specification therefore turns on the value of space saved rather than insulation cost per square metre, a conversation most contractors are not equipped to have.
Manufacturing difficulty explains the concentration. Continuous phenolic lamination requires precise control of exotherm, cure profile and cell structure, and the process window is narrow enough that yield losses punish inexperienced operators badly. Friability compounds it: boards passing every thermal test still crumble at cut edges on site, generating warranty claims unrelated to declared performance. Producers who solved both problems years ago hold positions newer entrants find hard to attack.
"Phenolic is the only insulation product where the sales argument is about floor area rather than about heat. Sell it as insulation and you lose to polyisocyanurate on price every time. Sell it as three extra square metres of lettable space per apartment and the price stops mattering, because the developer is comparing it to rent rather than to a board."
Principal Analyst, Building Envelope Materials Practice · MMA Construction and I

Market Trends

Fire Regulation Displaces Combustible Insulation Above Eighteen Metres

Building rules across the United Kingdom, several European states, Australia and China now restrict or prohibit combustible insulation on external walls of tall buildings, following facade fires that made the issue politically unavoidable. Phenolic foam achieves Euroclass B with low smoke and droplet performance, which places it inside most of those restrictions where polystyrene and standard polyurethane fall outside. Roughly 61% of new residential construction above eighteen metres in the European Union now faces some combustibility restriction. That converts insulation selection from a cost optimisation exercise into a compliance question entirely.
Market Impact: Doubles required wall resistance si
Renovation Overtakes New Build As The Larger Pool

European renovation programmes funded through national recovery and energy efficiency schemes have made retrofit the larger demand pool for high-performance insulation, and retrofit behaves differently from new construction. Existing wall assemblies, window reveals and floor-to-ceiling heights cannot absorb thickness, so thermal targets must be met within a fixed depth. Phenolic wins that constraint more often than any competing board. Renovation now accounts for roughly 54% of European phenolic board volume, against about 38% five years earlier, and the shift raises average selling prices because retrofit specifications run considerably tighter than new build.
Market Impact: Cuts installation labour 35%

Market Opportunities and Growth Drivers

Thermal Codes Tighten Faster Than Wall Depths Can Grow

Successive revisions to building thermal regulation across the European Union, United Kingdom, Japan and increasingly the Gulf states have raised required wall and roof performance without any corresponding relaxation of planning constraints on building envelope depth. Required wall thermal resistance in temperate European climates has roughly doubled since 2010. Developers facing plot boundary limits or floor area value cannot simply build thicker, which pushes specification toward the lowest lambda product available. That mechanism favours phenolic specifically rather than high-performance insulation generally, which is why the category has grown faster than the insulation market around it.
Market Impact: Drives 4% of installed area rework

Cold Chain And Data Centre Ductwork Adds Technical Demand

Pre-insulated phenolic ductwork has taken share from sheet metal with external insulation in data centres, pharmaceutical facilities and cold storage, because it delivers lower air leakage, faster installation and better hygiene performance in a single product. Data centre construction has grown strongly since 2021 and consumes substantial duct area per megawatt of capacity. Installation labour savings of roughly 35% against traditional metal ductwork with applied insulation are what actually win these projects, rather than any thermal argument on its own merits. Hygiene performance closes the pharmaceutical and healthcare work specifically, since cleanable closed-cell surfaces are written into those specifications.
Market Impact: Requires separation on 100% of deck

Market Restraints and Challenges

Friability Generates Warranty Claims Thermal Testing Never Predicts

Phenolic foam is brittle, and boards that pass every declared performance test can still crumble at cut edges during site handling. The root cause is closed-cell structure with thin, rigid cell walls: the same geometry that delivers low lambda also delivers poor mechanical toughness. Commercially this produces installation defects and warranty exposure unrelated to declared thermal performance, and it makes contractor training a real cost. Participants are responding with tougher facings, factory-cut components that reduce site cutting, and reinforced formulations that trade a little thermal performance for genuinely better handling robustness.
Market Impact: Restricts 61% of tall residential b

Residual Acidity Attacks Unprotected Metal Components

Phenolic foam retains acidic residues from the curing catalyst, and in the presence of moisture those residues corrode unprotected steel and aluminium in contact with the board. The root cause is chemistry inherent to the phenol formaldehyde cure rather than a manufacturing defect. Commercially this restricts use against bare metal decks and requires specified separation layers, adding cost and detailing complexity. Participants are addressing it through neutralised formulations, through facings that provide a moisture barrier, and through published detailing guidance that specifiers now increasingly demand before approving the product at all.
Market Impact: Reaches 54% of European volume
3 additional market trends, 4 additional growth drivers, and 2 additional restraints and challenges are covered in the full report. Contact sales@marketmindsadvisory.com to access the complete intelligence.

Segment CAGR and Growth Architecture

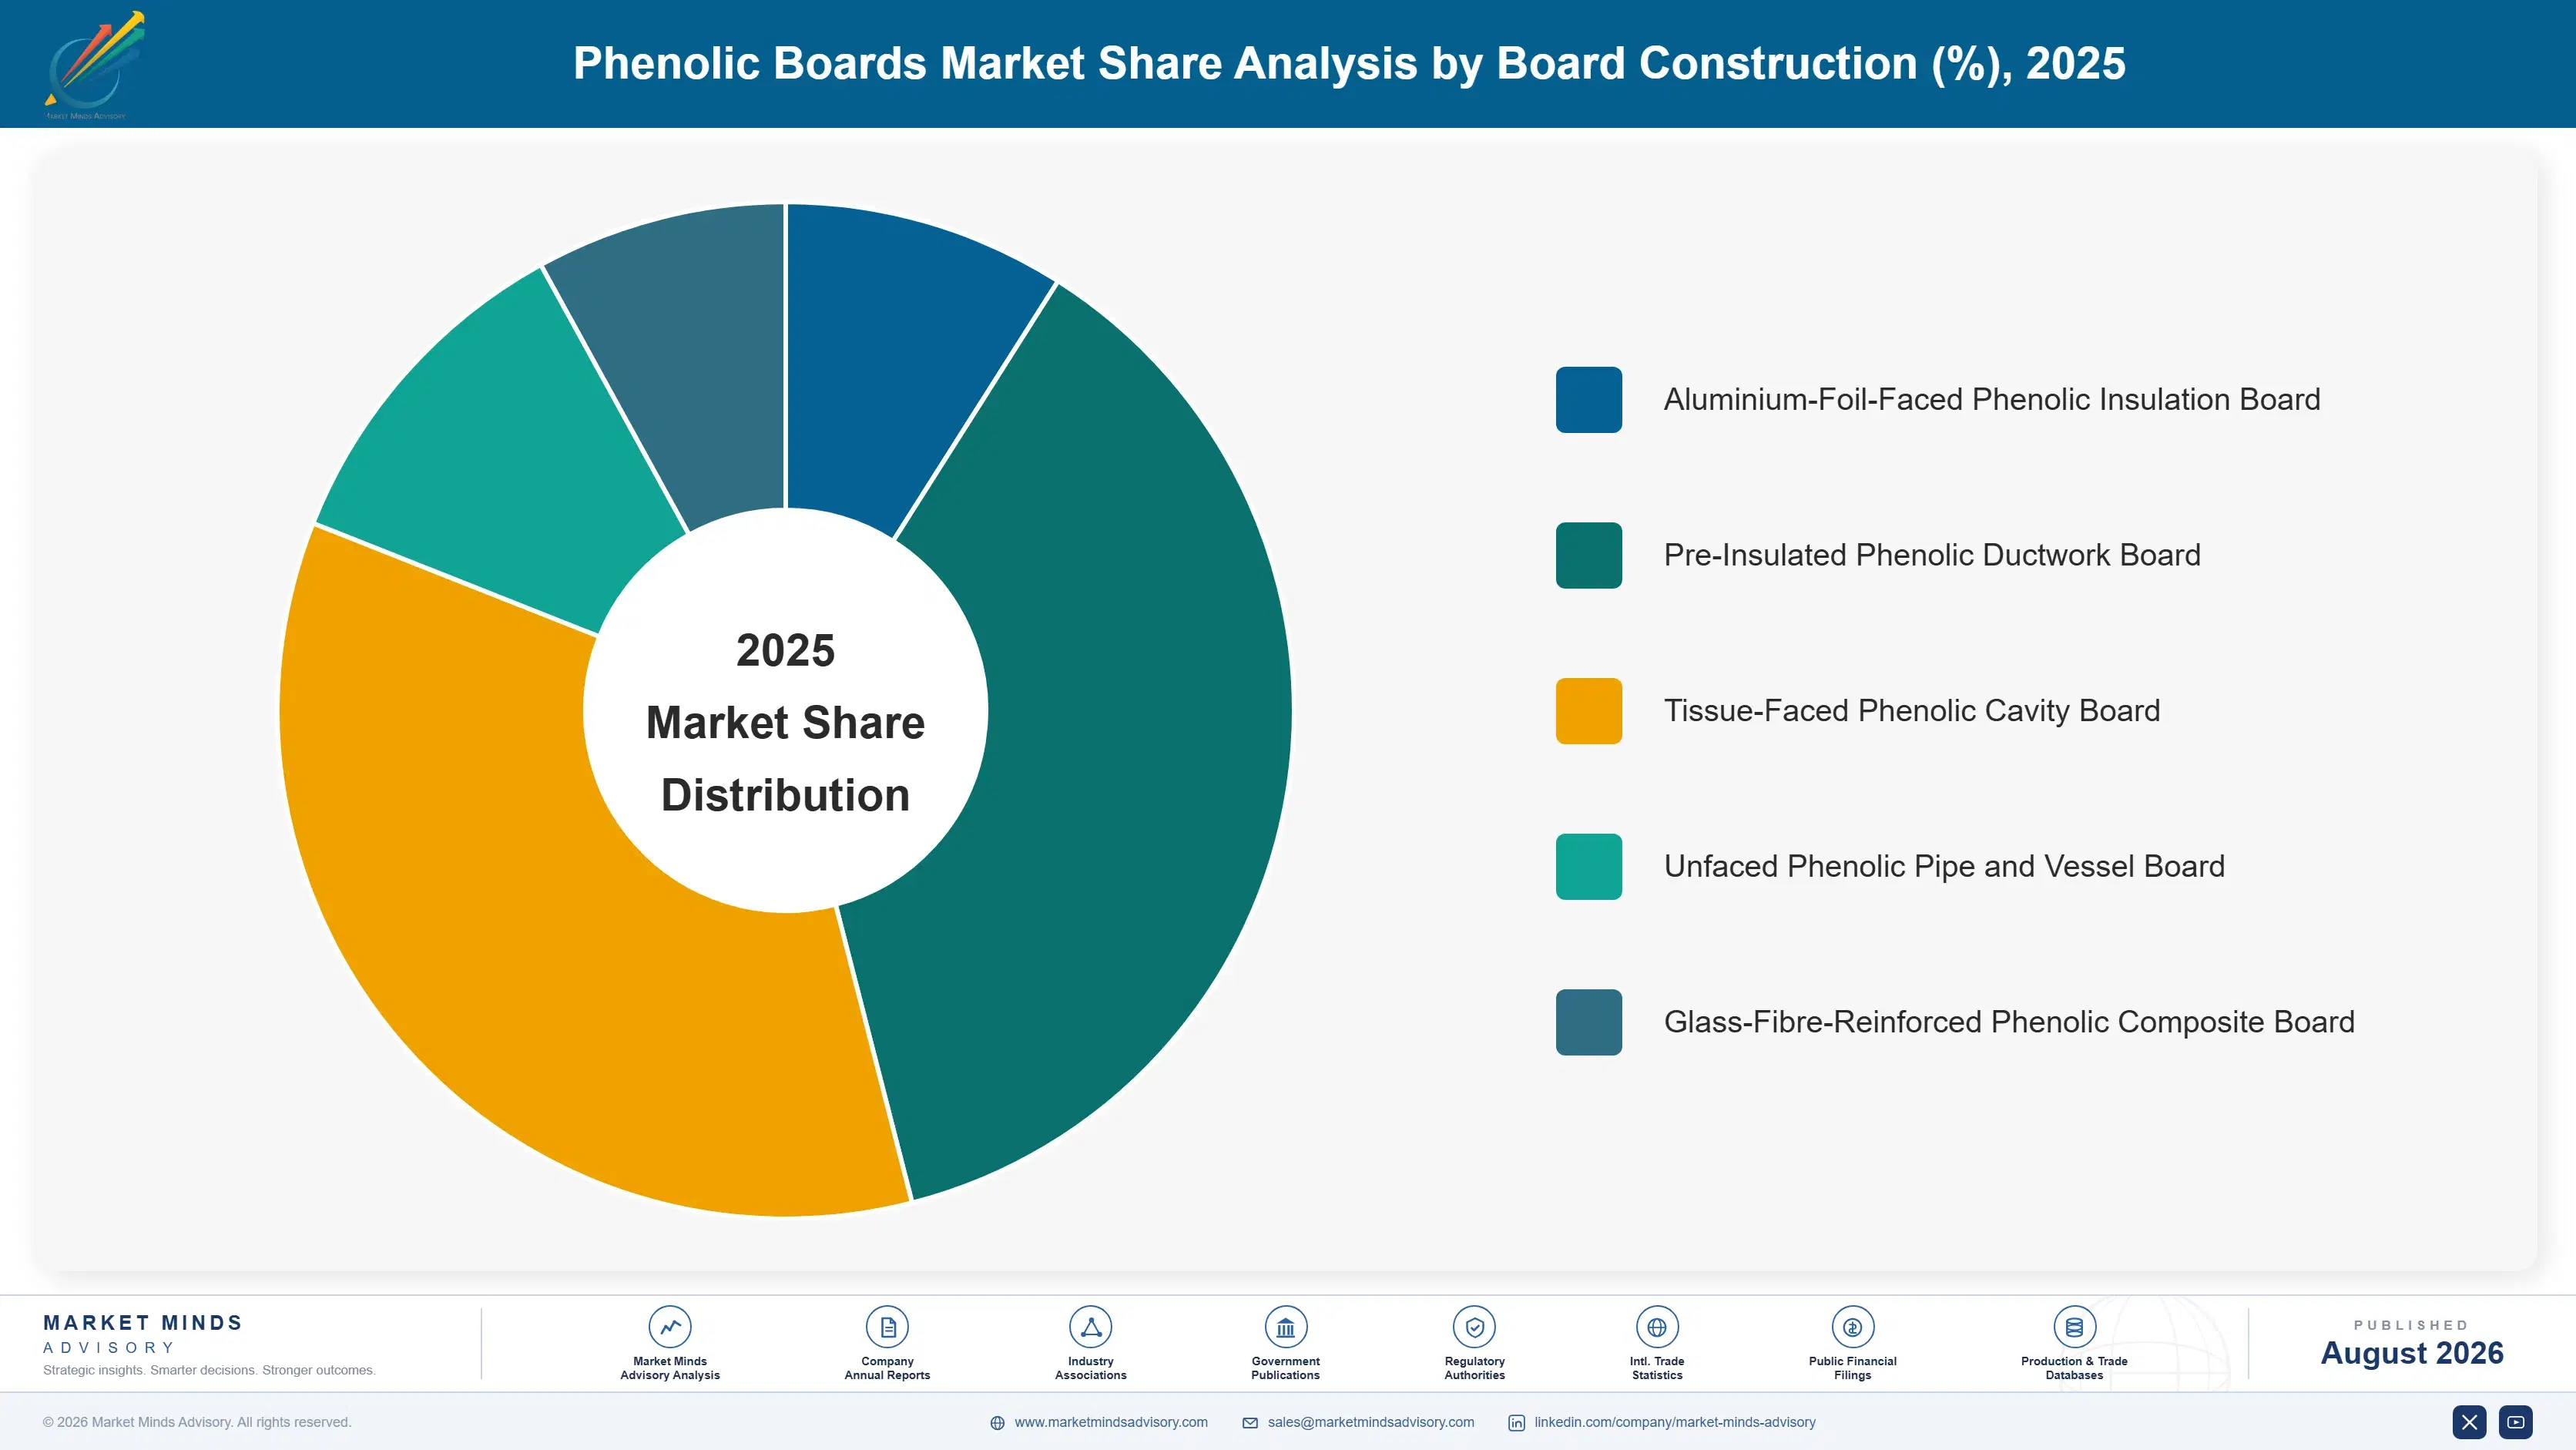
Segmentation follows board construction, meaning the facing type or formed configuration that determines achievable lambda, moisture performance, handling robustness and installed application. That single dimension governs which wall and roof build-ups a product can serve, what price it realises in each of them, and how much of the manufacturing yield risk a producer carries through lamination.
phenolic-boards-market-trends-market-share-analysis-1787311687068

Aluminium-Foil-Faced Phenolic Insulation Board

The fastest segment at 10.2%, a full 1.50 times the market rate, covering board laminated between aluminium foil or foil composite facings during continuous production. The facing does more commercial work than the foam: it delivers the lowest achievable lambda by suppressing radiative transfer at the surface, provides the vapour control that modern wall build-ups require, and protects the friable foam edge during handling. Demand concentrates in cavity wall, rainscreen and pitched roof applications where both thermal and moisture performance are specified together. Realised pricing runs roughly 30% above unfaced board, and the facing lamination step is where the great majority of manufacturing yield losses actually occur on any line.
CAGR 10.2%

Pre-Insulated Phenolic Ductwork Board

Growing at 8.9% annually on rigid phenolic board pre-formed into ductwork sections for air distribution in data centres, pharmaceutical plants, hospitals and cold storage facilities. The product competes against sheet metal ductwork with applied external insulation, and it wins on installation labour rather than on thermal performance, cutting fitting time by roughly 35% while delivering lower air leakage. Hygiene performance matters considerably in pharmaceutical and healthcare work, where cleanable closed-cell surfaces are written directly into the specification. Fabrication is carried out on site from flat board using proprietary cutting and jointing tooling, which makes installer training and channel relationships considerably more important in this segment than anywhere else in the market.
CAGR 8.9%
Full segment breakdown across 5 segments available in the complete report.

Regional Architecture and Country Demand Map

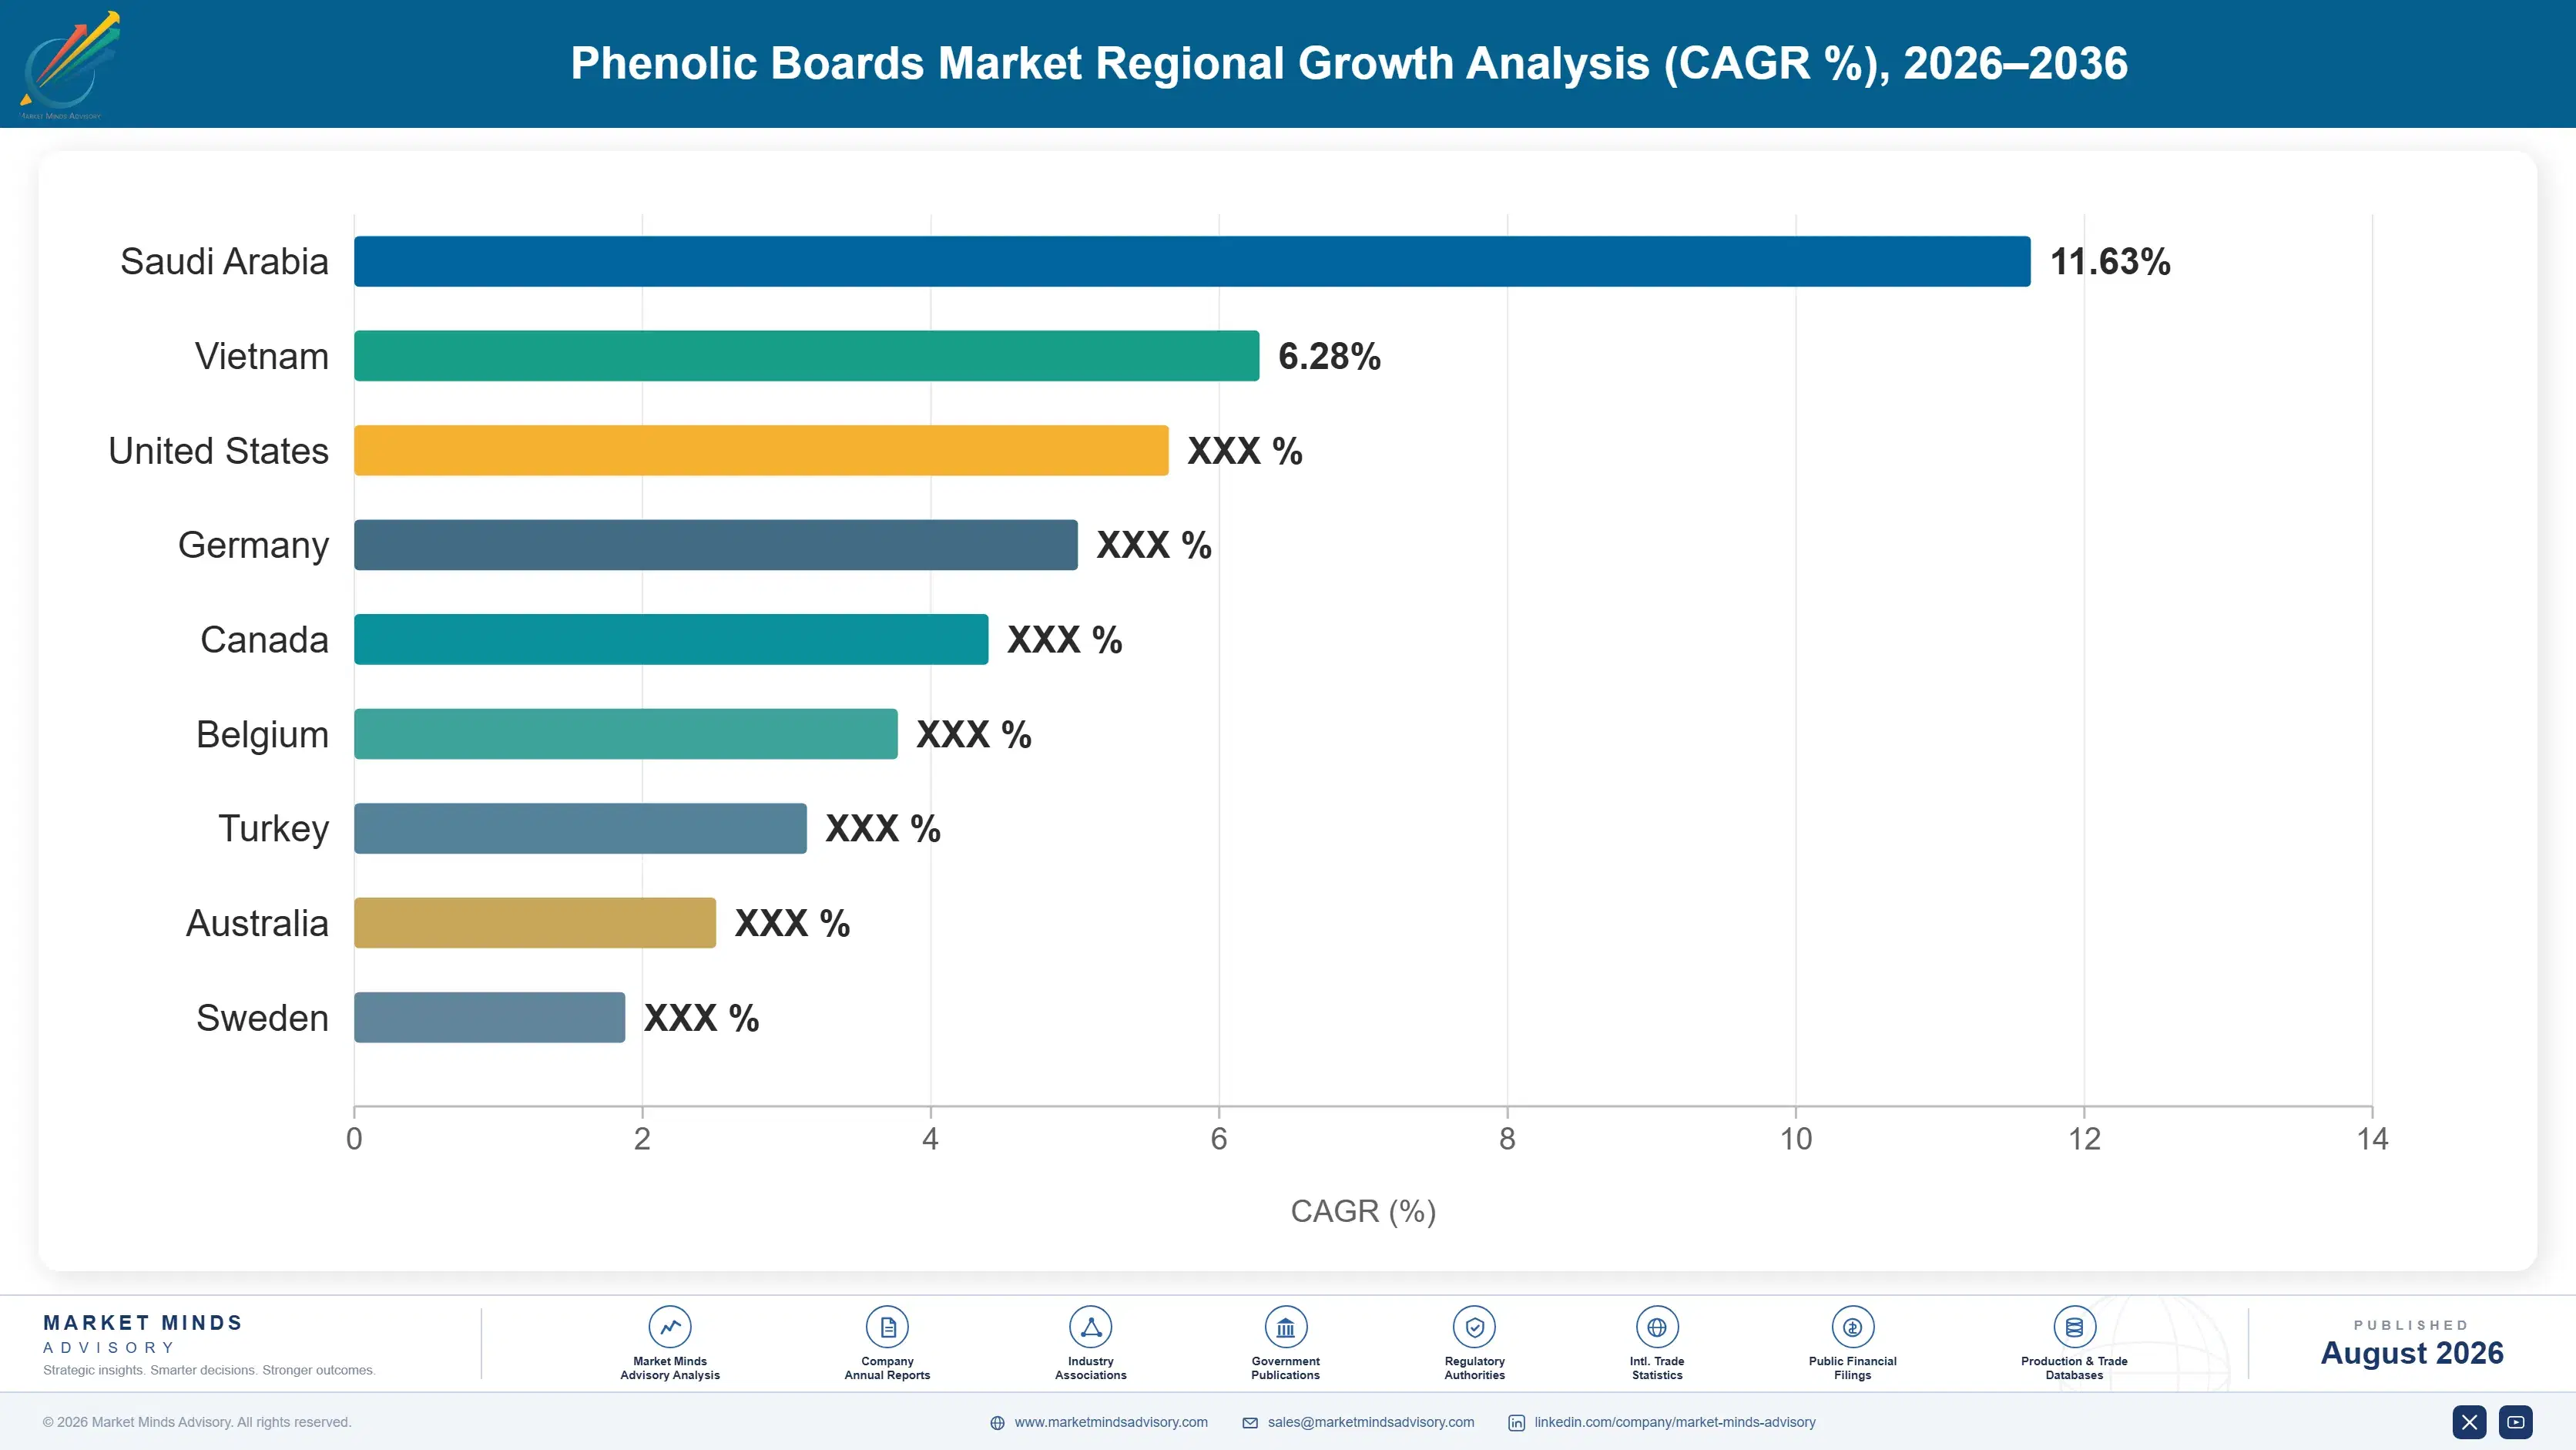
East Asia leads on volume because Chinese fire rules governing tall building facades redirected enormous demand toward phenolic foam. South Asia and Pacific grows fastest as Indian construction and cold chain expand together. Western Europe holds the highest realised pricing anywhere and the tightest specifications.

East Asia

Thirty-two percent of global value sits here. Note: this slightly exceeds the standard regional band because Chinese fire regulations restricting combustible external wall insulation on tall buildings redirected very large volumes toward phenolic foam, and domestic capacity expanded rapidly to serve it. Chinese output now covers roughly 36% of global board production. Japanese demand is smaller but far more demanding on specification, with Asahi Kasei and Sekisui supplying products at prices well above Chinese commodity levels. Growth of 8.0% reflects continued high-rise residential construction alongside data centre ductwork demand. Chinese quality variation remains wide across the many smaller producers. Korean demand is smaller and weighted toward commercial rather than residential construction.
Share: 32% | CAGR: 8.0% (2026 to 2036)

Western Europe

Twenty-four percent of value on 5.2% growth, below the global rate on mature construction volumes, but this is where realised pricing is highest anywhere. United Kingdom and Irish demand is disproportionate, reflecting both the origin of the product category and building regulation that has moved hardest against combustible insulation since 2017. Renovation now accounts for the majority of regional volume, and retrofit specifications favour thin high-performance boards because existing wall assemblies cannot absorb additional thickness. German and Nordic markets remain more loyal to mineral wool on fire grounds despite the thickness penalty involved. System-level fire test evidence has become the effective entry requirement for any tall building work at all here.
Share: 24% | CAGR: 5.2% (2026 to 2036)
Regional intelligence for 5 additional markets available in the complete report: North America, South Asia and Pacific, Latin America, Middle East and Africa, Eastern Europe. Contact sales@marketmindsadvisory.com.
phenolic-boards-market-trends-country-cagr-analysis-1787311687587

Where Board Margin Actually Accumulates

Four commercial moves separate the producers earning genuine specification margins from those merely selling insulation by the square metre. Each depends on holding something a contractor cannot obtain by switching board: facing lamination quality, published fire and detailing evidence, installer channel depth, or the factory fabrication that removes site cutting from the job entirely.

Sell Floor Area Saved Rather Than Insulation Value

Phenolic loses on price per square metre against polyisocyanurate every single time, and wins whenever the conversation moves to wall build-up depth. A 20 millimetre thickness saving across an inner-city apartment block returns two to three square metres of lettable area per unit, worth several thousand dollars in most European cities. Producers who equip their technical teams to make that calculation with a developer realise pricing 22% to 30% above those selling on thermal specification alone. The tool required is a spreadsheet and some training rather than any capital at all, which makes this the highest-return move available.
Market Impact: Realises up to 30% above thermal-le

Publish Detailing And Fire Evidence Specifiers Demand

Since 2017 specifiers have required documented fire test evidence at system rather than product level, plus published detailing guidance covering metal contact, edge protection and moisture management. Producers holding complete packages win specifications outright against boards with equivalent declared performance but thinner documentation. Testing and documentation cost between $2 million and $4 million across a product family, and they must be continuously maintained thereafter. Realised pricing runs about 12% higher, and more usefully the producer enters the specification before the contractor tender is issued rather than competing inside it afterwards.
Market Impact: Holds pricing about 12% above equiv

Build Installer Training And Channel Depth

Phenolic friability and acidity mean installation quality decides warranty exposure, and warranty claims cost far more than the margin on the boards involved. Producers running accredited installer programmes report warranty claim rates roughly 60% below those selling through general merchant channels without training. The programme itself costs under $3 million annually to run at national scale, which is trivial against the claims avoided. It also creates channel loyalty, because accredited installers specify the product that certifies them rather than whatever happens to be the cheapest board on a merchant shelf that week.
Market Impact: Cuts warranty claim rates by roughl

Supply Factory-Cut Components Instead Of Boards

Site cutting is where friability turns into waste, rework and warranty exposure, and it is also where contractors lose labour hours. Supplying factory-cut components dimensioned to the project rather than standard boards cuts site waste from roughly 12% to under 4% and removes most edge damage. Producers charge 15% to 20% more for the service and contractors accept it because labour and waste savings exceed the premium. It requires project engagement early enough to have real dimensions to work from, and that early engagement is itself a considerable commercial advantage.
Market Impact: Cuts site waste from 12% to under 4

Who Controls the Margin Pool

Concentration is high at 58% for the top five, measured on phenolic board revenue across all participants, and it reflects how demanding continuous phenolic lamination is to operate. Kingspan leads on the breadth of its faced board range combined with specification presence, and the gap to the second tier is widest in published fire and detailing evidence rather than in capacity.
Competition runs on three dimensions. Documented fire performance at system level matters most since 2017, because specifiers will not accept product-level declarations on tall buildings any longer. Facing quality and handling robustness matter almost as much, since warranty exposure sits there rather than in thermal performance. Price competition is intense but confined to the Chinese domestic market and to commodity roofing work, where declared lambda is the only thing anyone compares.

Two pressures are building. Polyisocyanurate producers have narrowed the lambda gap and hold a much better handling and cost position, which threatens phenolic wherever thickness is not genuinely binding. Meanwhile Chinese producers have scaled enormous capacity with wide quality variation, and consolidation there will eventually produce exporters with credible specification packages. Rankings shift where documented system evidence meets low-cost capacity, since neither alone wins tall building work now.
phenolic-boards-market-trends-company-positioning-matrix-1787311688108

Competitive Moat and Risk Dimensions

KINGSPAN GROUP

Moat: Deepest specification and evidence position

Complete system-level fire test evidence, published detailing guidance and long-standing relationships with architects and specifiers place the company inside specifications before contractor tendering begins. That position was built over years of testing investment and cannot be assembled quickly, which matters more since 2017 than any thermal or pricing argument does.
KINGSPAN GROUP

Risk: Reputational exposure to facade scrutiny

Public inquiries and litigation surrounding facade fires have drawn sustained attention to insulation manufacturers' testing and marketing practices, and the company has been named in that scrutiny. Commercial damage from reputational exposure in a specification-led business can exceed any product performance issue, because specifiers choose partly on institutional confidence.
RECTICEL

Moat: Strong European insulation channel

Established distribution and installer relationships across continental European markets give the company route-to-market depth that specification-led competitors match only in selected countries. Insulation is bought through merchants and installers as much as specified by architects, and channel presence converts regulation-driven demand into actual orders reliably.
RECTICEL

Risk: Narrower phenolic product breadth

Phenolic sits within a broader insulation portfolio weighted toward polyurethane and polyisocyanurate, which means internal capital competes across chemistries and the phenolic range is narrower than the category leader's. Where a specification demands the lowest possible lambda with full system evidence, that narrower range costs the company opportunities it cannot easily recover.

Players Tracked

Prominent Players

Kingspan Group
Recticel
Asahi Kasei
Sekisui Chemical
Unilin Insulation

Other Key Players

Hebei Aoteng Building Materials
Jiangsu Junchen New Material
Sichuan Zhongke Insulation
Beijing Zhongxin New Material
LG Hausys
SVK
Fletcher Insulation
IKO Group
Soprema
Knauf Insulation
Saint-Gobain
Ravago
Zhejiang Zhenshen Insulation
Nanjing Yasi New Material
Shandong Hongyi Insulation

Recent Developments

MARCH 2025

Kingspan expands phenolic lamination capacity in continental Europe

Additional continuous phenolic lamination capacity entered commercial service at a mainland European site during the first quarter, aimed squarely at the renovation demand funded through national energy efficiency programmes where retrofit thickness constraints favour thin high-performance boards over any thicker competing product available on the market.
Signal: Renovation rather than new build is now cl
JULY 2025

Asahi Kasei introduces reinforced phenolic board formulation

A reinforced phenolic board designed to improve edge handling and reduce site friability was introduced across the Japanese market, trading a small amount of thermal performance for the mechanical robustness that installers had been requesting across both residential and commercial applications consistently for several years.
Signal: Producers are now conceding some thermal p
NOVEMBER 2025

Unilin secures accredited installer programme expansion

An expanded accredited installer training and certification programme was rolled out across several continental European markets, reflecting how installation quality rather than declared board performance actually determines warranty exposure and how much genuine channel loyalty accreditation goes on to create for whichever producer runs the programme.
Signal: Installer accreditation is being used to b

What Drives Delivered Board Cost

Phenol formaldehyde resin accounts for roughly 38% of cost of goods, and it prices against benzene and methanol derivatives that move continuously. Blowing agents and surfactants add 14%, aluminium foil and tissue facings a further 17%. Energy for curing ovens contributes 9%, and freight another 12% because rigid board ships at low density and cubes out long before reaching weight limits.
The 2022 phenol episode compressed margins across the industry. Benzene and phenol pricing rose sharply as European chemical operators curtailed output, and board producers holding annual contractor pricing absorbed most of the increase directly. Kingspan annual reporting for the period documented substantial raw material cost pressure across its insulation businesses. Chinese producers with domestic phenol supply were considerably less affected, and several used the window to gain export share.

The competitive disadvantage mechanism runs through freight and contract structure. Board cubes out at roughly a third of trailer weight capacity, so delivered cost rises steeply with distance and regional manufacturing beats importing on all but the highest specifications. Producers selling into annual contractor frameworks absorb resin movement merchant sellers pass through in weeks. European producers carry both problems at once, buying resin at Western prices while supplying fixed frameworks.
phenolic-boards-market-trends-cost-volatility-analysis-1787311688302

Index framework contracts to phenol benchmarks

Annual contractor framework pricing against continuously moving phenol cost remains the single largest source of margin damage anywhere in this business. Producers now negotiate indexation clauses referencing published phenol, benzene and formaldehyde benchmarks, typically with a quarterly reset and a collar limiting total movement to eight percent in either direction across any contract year.

Locate lamination capacity inside freight radius

Rigid board cubes out at roughly a third of trailer weight capacity, so delivered cost rises steeply beyond about eight hundred kilometres from the plant. Regional lamination lines cost $28 million to $45 million each but beat importing decisively on all but the highest specifications, and they shorten lead times that project schedules increasingly cannot accommodate.

Recover curing oven heat across the lamination line

Curing ovens dominate energy consumption and most of the applied heat currently exhausts to atmosphere. Heat recovery retrofits cost roughly $2 million per line and cut energy cost of goods by around three percentage points, with payback inside four years at European industrial power prices and considerably faster where carbon pricing applies to thermal fuel.

Portfolio Architecture for Margin Defence

Margin architecture tracks documentation and facing quality rather than thermal performance. Unfaced board sold into commodity roofing and general industrial insulation runs at gross margins in the low twenties, competing on declared lambda alone. Faced board with full system fire evidence earns roughly twice that.
The volume-versus-premium tension is sharper here than in most construction materials because lamination lines run continuously and cannot be economically idled. Commodity unfaced and low-specification volume is what fills them between specified projects, yet that work carries the thinnest margin and competes directly against Chinese imports wherever freight permits. Producers who chase specification work exclusively find their lines underloaded, and an underloaded lamination line loses money quickly at these capital intensities.

Value concentrates where regulation or geometry removes the buyer's alternatives. Tall building facade work with system-level fire evidence sits at the top, because the specifier cannot accept a product-level declaration and very few producers hold the testing. Pre-insulated ductwork sits alongside on installation labour logic. Commodity roofing sits at the other extreme, where a declared lambda figure tells the buyer everything and pricing compresses toward resin cost plus freight.

Volume / Commodity-Adjacent

Unfaced and tissue-faced board supplied into commodity roofing, general industrial insulation and low-rise construction. Declared lambda is the only comparison buyers make, supplier choice is wide, and delivered cost decides. This volume exists mainly to keep continuous lamination lines loaded.
Gross Margin: 19-26%

Premium / Certified

Aluminium-foil-faced cavity and rainscreen board supplied with declared thermal and moisture performance into mainstream commercial and residential construction. Facing quality and handling robustness hold pricing. Range reflects the spread between merchant channel and directly specified project work.
Gross Margin: 28-38%

Sustainability / Regulatory / Next-Generation

Board supplied with full system-level fire test evidence for tall building facades, plus pre-insulated ductwork and factory-cut component packages. Documentation depth and fabrication service, rather than the foam itself, justify the pricing achieved in this tier.
Gross Margin: 40-54%
phenolic-boards-market-trends-portfolio-architecture-1787311688801

High-value Sub-segments and Strategic Watch-out

System-Evidenced Facade Board

High value on genuinely high growth, protected because specifiers on tall buildings will no longer accept product-level fire declarations at all. Testing and documentation cost several million dollars to assemble and must be maintained, which keeps the qualified producer field genuinely small and unlikely to widen quickly.
Gross Margin: 44-54%

Pre-Insulated Ductwork Board

Strong margins on solid underlying growth at 8.9%, winning on installation labour rather than on any thermal argument. Data centre and pharmaceutical facility construction drive it, and installer training requirements create a channel loyalty that competitors find genuinely difficult to displace inside any short timeframe.
Gross Margin: 38-48%

Commodity Unfaced Board

The loading backbone of every continuous lamination line, necessary because the asset cannot be idled economically, yet earning gross margins around twenty percent. Chinese imports compete this pool down hard wherever freight economics permit them to reach the market at all, and container rates decide that.
Gross Margin: 19-26%

Mainstream Faced Cavity Board

The strategic watch-out sitting in this portfolio. Polyisocyanurate producers have now narrowed the lambda gap considerably while holding a markedly better handling and cost position, so phenolic now retains this segment only in those projects where wall thickness is genuinely binding on the design itself.
Gross Margin: 28-38%

How This Demand Actually Recurs

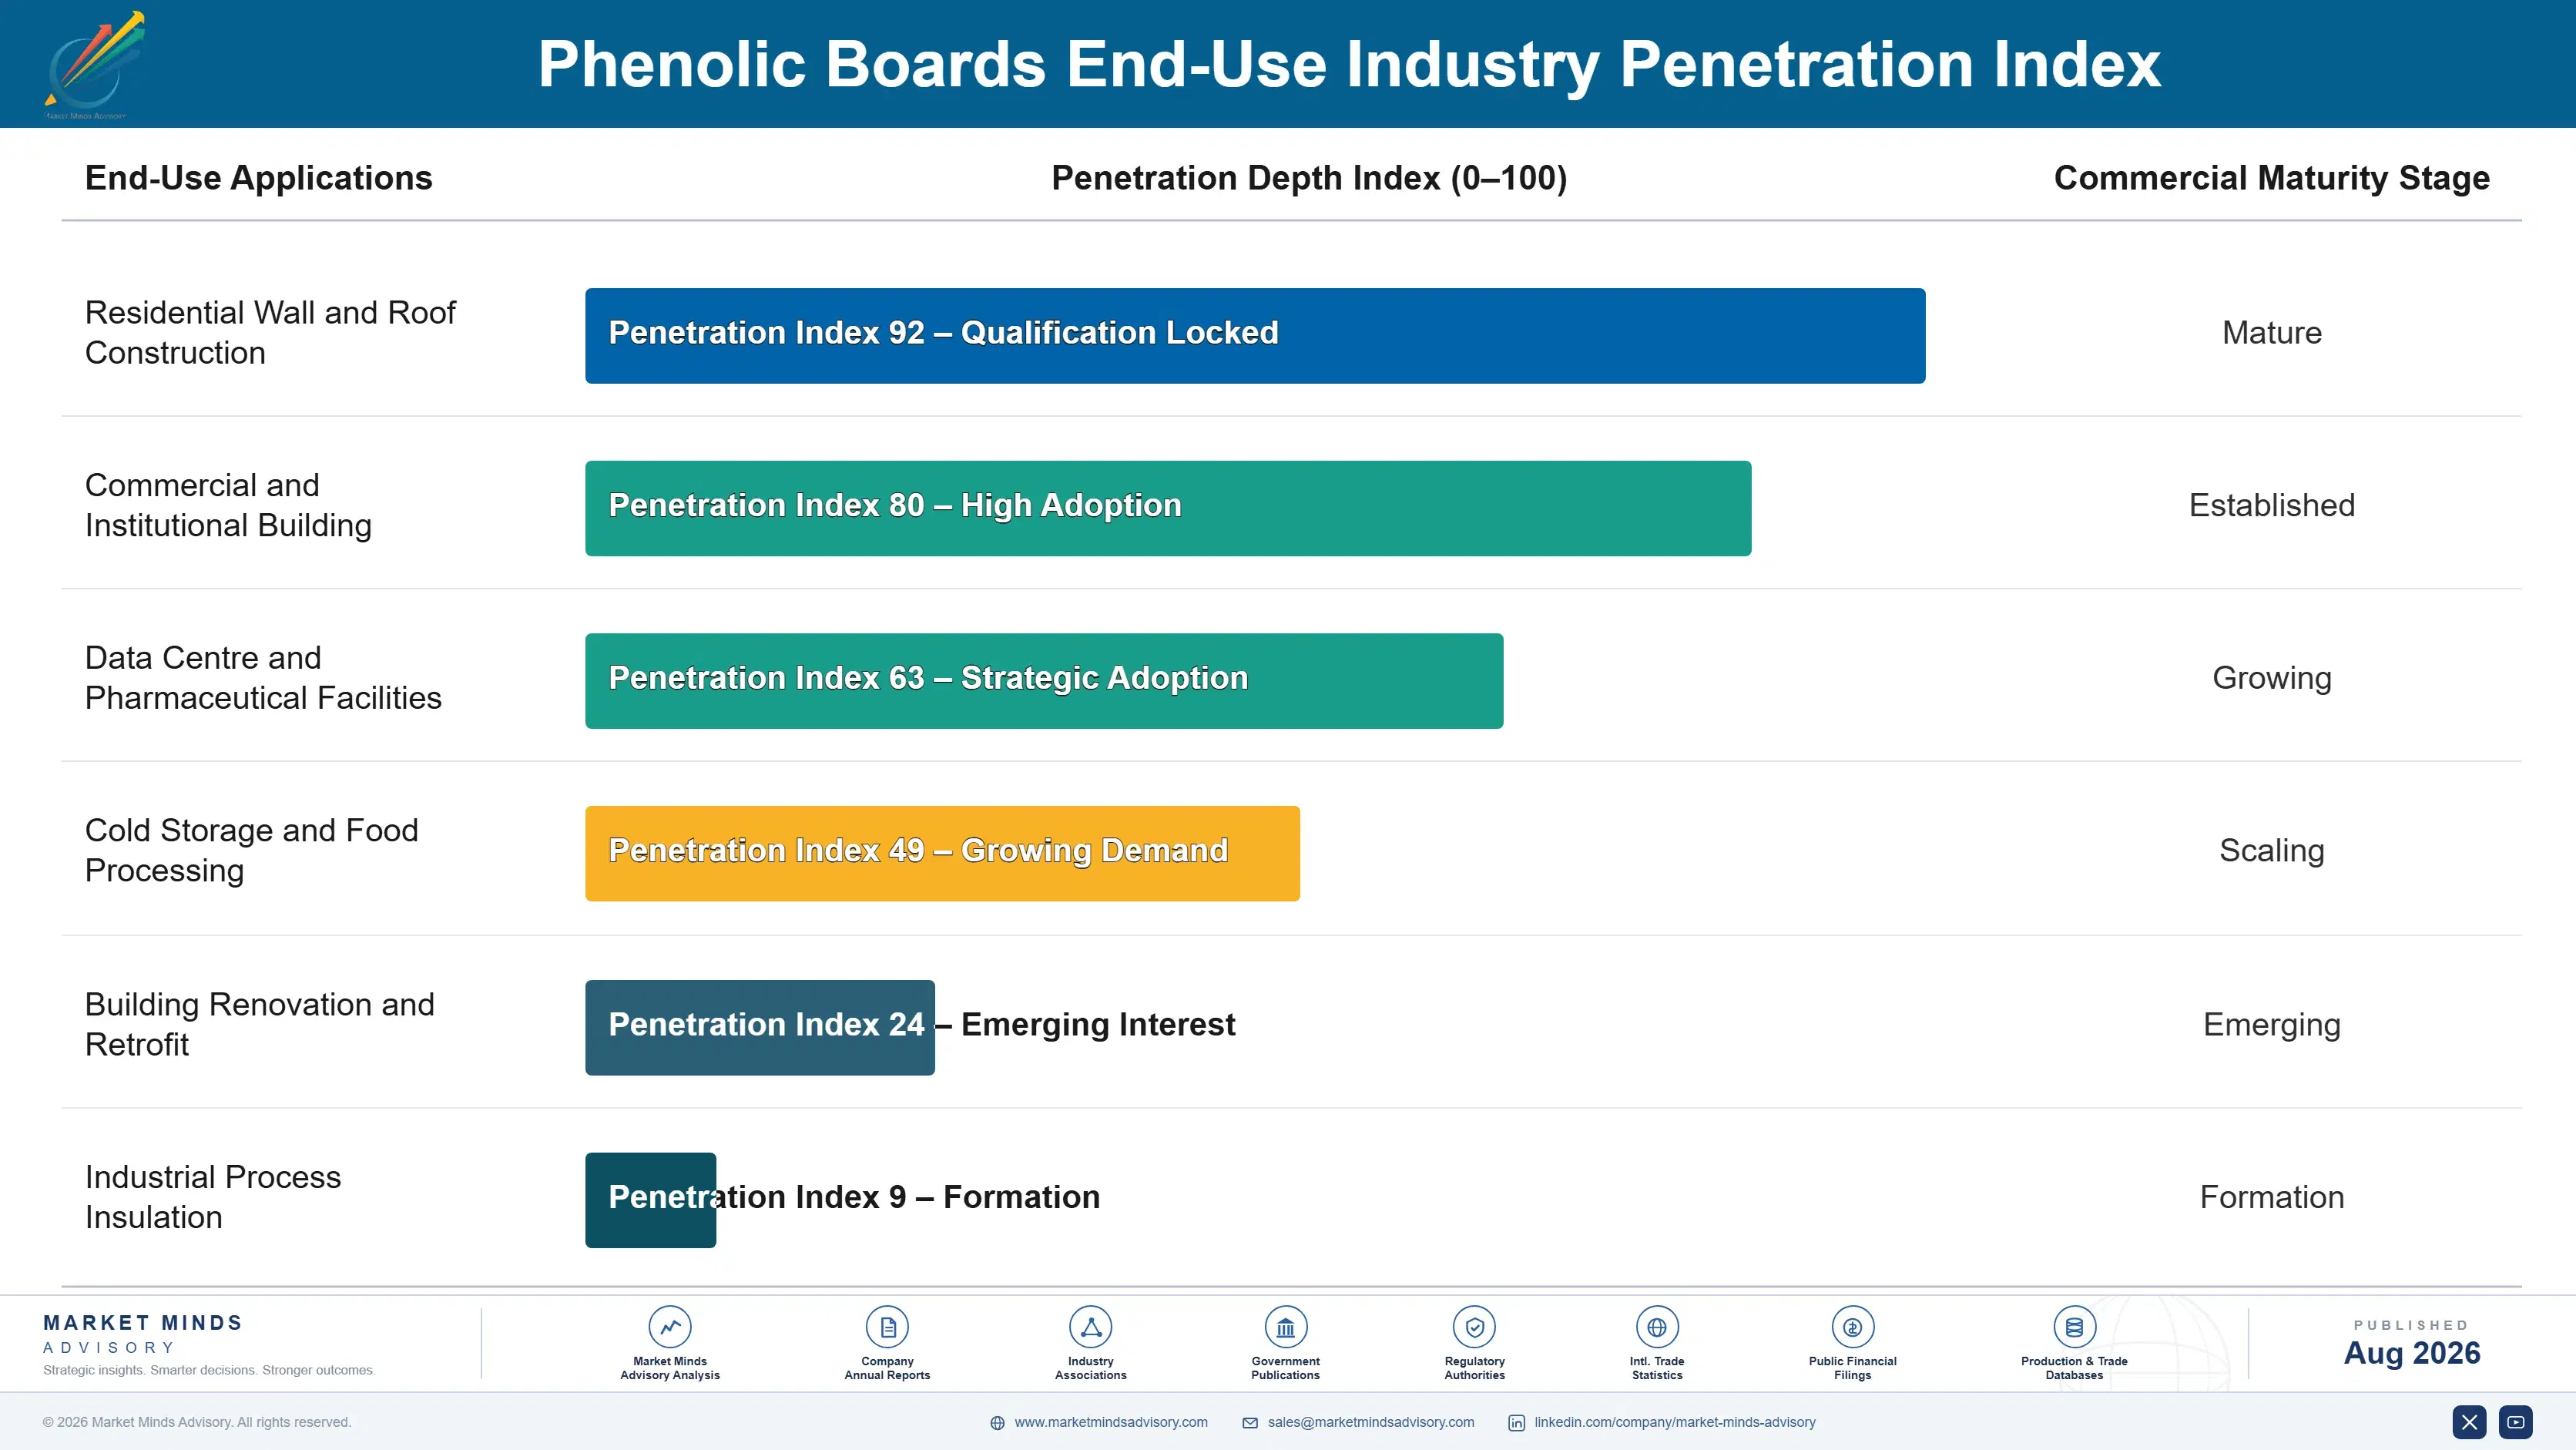
Phenolic board demand behaves as an annuity attached to a specification rather than to any individual project. Once a developer or engineering practice writes a product into its standard details, it recurs across every subsequent scheme, because redetailing a wall build-up costs design time nobody wants to spend twice.
Stickiness varies considerably by end use. Tall building facade work is the tightest, held by system-level fire test evidence that very few producers hold and that specifiers will not substitute against. Pre-insulated ductwork sits close behind, locked by installer training and proprietary fabrication tooling. Institutional construction is moderately sticky, held by standard details maintained across estates. Commodity roofing is barely sticky at all, with contractors buying whatever board on the merchant shelf meets the declared lambda most cheaply that week.

Buyer profiles have changed markedly since 2017. Insulation selection once sat with contractors optimising delivered cost against a thermal target. It now frequently involves fire engineers, building control approvers and insurers asking about system test evidence, combustibility classification and detailing compliance. Producers whose commercial approach still leads with lambda values and price lists find themselves talking to people for whom thermal performance was settled early and everything else remains open.
phenolic-boards-market-trends-end-use-penetration-index-1787311689287

Where To Place Capital

These are among the four positions where our research anticipates prominent divergence between winners and laggards over the coming forecast period. Each is grounded in the demand model, the regulatory perimeter, and the announced capacity pipeline.
01 / SPECIFICATION ARGUMENT DISCIPLINE

Sell floor area, never insulation cost per metre

Phenolic loses on price per square metre against polyisocyanurate in every comparison, and wins whenever the discussion moves to wall build-up depth and lettable area. A 20 millimetre thickness saving returns two to three square metres per apartment in a city block, worth several thousand dollars to the developer. Producers equipping technical teams to run that calculation realise 22% to 30% above those selling on thermal specification, and the tool needed is commercial training rather than any capital investment whatsoever.
02 / SYSTEM EVIDENCE INVESTMENT

Product declarations no longer win facade work

Specifiers on buildings above eighteen metres have refused product-level fire declarations since 2017, requiring system-level test evidence instead, and roughly 61% of new tall residential construction in the European Union now faces combustibility restriction. Testing and documentation cost between $2 million and $4 million across a product family, and they must be continuously maintained afterwards. That spend buys entry into the specification before contractor tendering, which is a fundamentally better commercial position to occupy than competing inside a tender afterwards.
03 / INSTALLATION QUALITY CONTROL

Friability makes installer training a margin decision

Phenolic foam is brittle and mildly acidic, so installation quality rather than declared performance determines warranty exposure, and claims cost far more than the margin on the boards that caused them. Producers running accredited installer programmes report warranty claim rates roughly 60% below merchant-channel sellers, at under $3 million annually to operate at national scale. Accreditation also builds real channel loyalty, since certified installers tend to specify the product that certifies them rather than whatever is cheapest on the shelf.
04 / LINE LOADING REALISM

Keep commodity volume, the line cannot idle

Continuous lamination lines run at capital intensities where underloading starts losing money very quickly, and commodity unfaced board earning gross margins of around twenty percent is what actually fills them between specified projects. Abandoning that work to protect average margin collapses fixed cost recovery considerably faster than any mix improvement can possibly offset. The realistic approach is holding that commodity volume at honest regional pricing for as long as freight economics continue to keep Chinese imports out of the market.

Engagement Snapshot From the Field

A live engagement with an industry participant carrying material or product regulatory and market exposure ahead of a defining policy shift, showing how our research translates into a defensible multi-year portfolio strategy.
MARKET MINDS ADVISORY · CLIENT ENGAGEMENT SUMMARY
Phenolic Boards Producer Strategic Portfolio Review and Transition Roadmap 2026·Investment Scenario on Phenolic Boards Exposure Evaluation 2025-26
CLIENT PROFILE
A privately held European insulation board manufacturer with annual revenue near $190 million (client-reported, unverified by MMA), operating two continuous phenolic lamination lines and selling predominantly through builders merchants across several continental markets. Roughly 74% of volume sold as mainstream faced cavity board against declared thermal performance, with no system-level fire test package and no accredited installer programme.
STRATEGIC CHALLENGE
The company was losing tall building work to competitors holding system-level fire evidence it did not have, while warranty claims from site handling damage had risen for three consecutive years. The board needed to decide between investing in fire testing documentation, an installer accreditation programme, or a third lamination line to chase volume growth instead.
MMA APPROACH
MMA modelled returns on all three investment options against specification win rates and warranty cost data, assessed which tall building specifications were realistically winnable with a documentation package, and benchmarked competitor installer programmes across five European markets. Findings were tested against 47 expert interviews covering specifier practice, fire engineering requirements and merchant channel behaviour.
KEY FINDINGS
  1. System-level fire testing across the product family would cost approximately $3.1 million (client-reported estimate, unverified by MMA) and open roughly 28% of regional tall building specifications the company could not previously bid.
  2. Warranty claims traced almost entirely to site cutting and edge damage rather than to any manufacturing defect, and an accredited installer programme addressed the cause directly at modest cost.
  3. A third lamination line would take the company to 58% utilisation across three lines from 71% across two, worsening fixed cost recovery rather than improving it at current demand.
  4. Merchant channel sales delivered 9 points lower gross margin than directly specified project work, and the channel mix rather than the product range explained most of the margin gap against competitors.
CLIENT PROFILE
A privately held European insulation board manufacturer with annual revenue near $190 million (client-reported, unverified by MMA), operating two continuous phenolic lamination lines and selling predominantly through builders merchants across several continental markets. Roughly 74% of volume sold as mainstream faced cavity board against declared thermal performance, with no system-level fire test package and no accredited installer programme.
STRATEGIC CHALLENGE
The company was losing tall building work to competitors holding system-level fire evidence it did not have, while warranty claims from site handling damage had risen for three consecutive years. The board needed to decide between investing in fire testing documentation, an installer accreditation programme, or a third lamination line to chase volume growth instead.
MMA APPROACH
MMA modelled returns on all three investment options against specification win rates and warranty cost data, assessed which tall building specifications were realistically winnable with a documentation package, and benchmarked competitor installer programmes across five European markets. Findings were tested against 47 expert interviews covering specifier practice, fire engineering requirements and merchant channel behaviour.
KEY FINDINGS
  1. System-level fire testing across the product family would cost approximately $3.1 million (client-reported estimate, unverified by MMA) and open roughly 28% of regional tall building specifications the company could not previously bid.
  2. Warranty claims traced almost entirely to site cutting and edge damage rather than to any manufacturing defect, and an accredited installer programme addressed the cause directly at modest cost.
  3. A third lamination line would take the company to 58% utilisation across three lines from 71% across two, worsening fixed cost recovery rather than improving it at current demand.
  4. Merchant channel sales delivered 9 points lower gross margin than directly specified project work, and the channel mix rather than the product range explained most of the margin gap against competitors.
RECOMMENDED STRATEGY
Phase 1: Phase one: commission system-level fire testing across the product family before any capacity decision, since it gates access to the highest-margin specification pool entirely. Phase 2: Phase two: launch accredited installer certification in the two largest markets, addressing warranty cost at its actual cause rather than through product reformulation. Phase 3: Phase three: cancel the third lamination line and redirect that capital toward direct specification selling capability and factory-cut component fabrication.
OUTCOME
The client completed fire testing within thirteen months and launched installer accreditation in two markets, reporting a warranty claim reduction of roughly 47% in the first full year (client-reported, unverified by MMA). The third lamination line was cancelled, utilisation on existing lines rose to 78%, and directly specified project work grew from 26% to 34% of volume.

Frequently Asked Questions

Foundational context covering the market sizes, CAGR, scope, country, region and competition that inform every finding below. This section is provided to cover basics and most often pre-purchase conversations, answered from the MMA Primary Research Dataset.

What is the current size of the Phenolic Boards Market?

The market was worth $2.6 billion in 2025 and is forecast to reach $2.78 billion in 2026. This covers rigid phenolic foam insulation boards and pre-insulated phenolic ductwork board.

How large will the Phenolic Boards Market be by 2036?

MMA forecasts $5.37 billion by 2036, an expansion multiple of 1.93 times the 2026 base. That represents $2.59 billion of incremental value across the forecast period.

What is the CAGR for the Phenolic Boards Market 2026 to 2036?

The base case compound annual growth rate is 6.8%, with a bull case of 8.0% and a bear case of 5.6%. Historical growth from 2020 to 2025 also ran at 5.6%.

Which segment is growing fastest?

Aluminium-foil-faced phenolic insulation board at 10.2%, a full 1.50 times the market rate. The facing delivers both the lowest achievable lambda and required vapour control.

Who are the major companies in the Phenolic Boards Market?

Kingspan Group, Recticel, Asahi Kasei, Sekisui Chemical and Unilin Insulation lead with 58% between them. Fifteen further producers hold meaningful regional positions across the market.

Which country is growing fastest?

India at 9.8%, pulled by commercial construction, data centre buildout and a rapidly expanding pharmaceutical cold chain. Regional manufacturing capacity remains limited relative to that demand.

Report Segmentation Architecture

The full report scope spans multiple orthogonal segmentation dimensions, with cross-tabulated demand data provided for each dimension pair. Coverage extends further to regional breakdowns, trend trajectories, and the competitive detail needed to support segment-level decision-making.

By Board Construction

  • Aluminium-Foil-Faced Phenolic Insulation Board
  • Pre-Insulated Phenolic Ductwork Board
  • Tissue-Faced Phenolic Cavity Board
  • Unfaced Phenolic Pipe and Vessel Board
  • Glass-Fibre-Reinforced Phenolic Composite Board

By End-Use Industry

  • Residential Wall and Roof Construction
  • Commercial and Institutional Building
  • Data Centre and Pharmaceutical Facilities
  • Cold Storage and Food Processing
  • Building Renovation and Retrofit
  • Industrial Process Insulation

By Commercial Dimension

  • Direct Supply to Specified Projects
  • Builders Merchant and Distributor Channel
  • Accredited Installer Programme Sales
  • Factory-Cut Component Packages
  • Ductwork Fabricator Supply Agreements

By Region

  • North America
  • Western Europe
  • East Asia
  • South Asia and Pacific
  • Latin America
  • Middle East and Africa
  • Eastern Europe

Scope, Methodology, and Coverage

Every figure in this report is reproducible from documented input assumptions. The scope below maps the historical period, the forecast horizon, the segmentation dimensions, and the countries covered, alongside the underlying primary and qualitative methodology.
Historical Period
2020 to 2025
Forecast Period
2026 to 2036
Base Year
2025 (USD billions; MMA Primary Research Dataset, August 2026)
Market Definition
This report covers rigid phenolic foam insulation boards manufactured by continuous or block lamination, spanning aluminium-foil-faced, tissue-faced, unfaced and glass-fibre-reinforced products, together with pre-insulated phenolic ductwork board fabricated from the same material. Coverage includes factory-cut component packages and the accredited installation services supplied alongside the boards. Phenolic high-pressure laminate and compact sheet, phenolic plywood and formwork panels, polyisocyanurate and polyurethane boards, mineral wool, expanded and extruded polystyrene, and phenolic resins sold as raw material are excluded from scope.
Quantitative Units
USD billions at producer realised prices; volume in million square metres at declared thickness; gross margin percentages and line utilisation by tier.
Segmentation Dimensions
Board construction, end-use industry, commercial dimension, region.
Regions Covered
North America, Western Europe, East Asia, South Asia and Pacific, Latin America, Middle East and Africa, Eastern Europe
Countries Covered
China, Japan, South Korea, India, Australia, Singapore, Vietnam, United States, Canada, Mexico, United Kingdom, Ireland, Germany, France, Netherlands, Brazil, Poland, Turkey, Saudi Arabia, United Arab Emirates.
Key Companies Profiled
Kingspan Group, Recticel, Asahi Kasei, Sekisui Chemical, Unilin Insulation, Hebei Aoteng Building Materials, LG Hausys, SVK, IKO Group, Soprema, and ten further producers.
Quantitative Methodology
Primary survey, n=3,800 respondents, Q4 2025, six countries; demand-side model with trade association cross-validation
Qualitative Methodology
47 expert interviews, Q4 2025; applied to validate demand model assumptions, identify emerging dynamics, and assess competitive positioning
Report Format
PDF and XLSX data workbook (Word format preview document)
Publisher
Market Minds Advisory
Report Code
MMA-2026-CON-753
Published
August 2026
Contact
sales@marketmindsadvisory.com | www.marketmindsadvisory.com

Purchase the full Phenolic Boards Market Report (2026 to 2036).

The full report sets out ten-year forecasts for phenolic boards by board construction, end-use industry and commercial model across seven regions. It quantifies the specification pool gated by system-level fire test evidence and identifies which producers currently hold it. Competitive assessment covers twenty producers on a consistent revenue basis, separating documentation depth from installed lamination capacity. Freight economics are modelled by distance from plant, isolating where regional manufacturing beats importing and where it does not. Findings draw on a quantitative survey of 3,800 respondents across six countries and 47 expert interviews conducted during the fourth quarter of 2025.
Ten-year forecasts by board construction and region
Fire evidence documentation mapped across twenty producers
Freight economics modelled by distance from lamination plant
Warranty cost drivers traced to installation rather than product
Thickness saving value quantified against lettable floor area
Margin architecture across three commercial portfolio tiers

Built For The People Who Decide

From boardroom strategy to bench-side execution, this report is read cover-to-cover by leaders shaping the next decade of their industry, turning demand scenarios, market dynamics and valuation benchmarks into decisions.
CXOs/ Presidents/ VPs/ Managers
M&A and Corporate Development
Strategy Teams and R&D Heads
Procurement and Product Directors
Regulatory and Compliance Leaders
Investor Relations and Equity Analysts