Market Minds Advisory
Pharmacy Automation Market

Pharmacy Automation Market: Robotics and Software Replacing Manual Dispensing

Hospitals and retail pharmacy chains are replacing manual counting and compounding with robotic systems as pharmacist labor shortages deepen, and sterile compounding safety rules are pulling IV automation into facilities.

Lead Analyst

Alice Ballenger

Published

September 2026

Make Smarter Decisions with Customized Research Insights

Request a free sample report and evaluate market opportunities, growth trends, and competitive dynamics relevant to your business needs.

2025 MARKET VALUE$5.8BMarket Size 2025
2036 FORECAST VALUE$14.2BBase Case , 2026 to 2036
CAGR 2026 TO 20368.5 %Bull 9.8% / Bear 7.2%
INCREMENTAL OPPORTUNITY$7.9BNet 10- year value creation
EXPANSION MULTIPLE2.26x2036 value over 2026 base
Strategic Levers
M&A Pipeline
Regional Outlook
Country Rankings
Competitive Intelligence
Segmental Deep-dive
Call-Us : 91 93563 13602

Executive Snapshot and Market Trajectory

Pharmacy directors increasingly treat automation as a labor strategy rather than a convenience purchase, replacing manual counting and compounding tasks as pharmacist and technician staffing shortages deepen across most developed healthcare systems, and payers now reinforce that shift through capital planning guidance offered to networks. That shapes committee decisions.
IV compounding automation is the clearest growth story, addressing sterile preparation error rates that manual technique cannot match at scale, and commercial momentum is concentrating in North America, where hospital labor cost pressure and compounding safety regulation outpace every other region MMA tracks by a considerable margin, reinforcing the region's outsized share of global equipment revenue. That concentration is unlikely to narrow meaningfully before decade's end.
Five manufacturers hold nearly two-thirds of global revenue, led by companies with deep hospital and retail pharmacy relationships rather than single-product specialists. Regulatory compliance pressure and integration with electronic health record systems shape purchasing decisions as much as underlying robotic precision does across every major product category in this market. Smaller specialists are chipping away at established players' share in the newest compliance-driven segment, particularly among mid-tier community hospitals. overall.
Market Definition
The Pharmacy Automation Market covers automated dispensing cabinets, robotic pill counting and packaging systems, medication carousels, IV compounding automation, and pharmacy inventory management software used in hospital, retail, and central fill pharmacy settings. It excludes electronic health record systems and general hospital supply chain software sold as separate product categories.
Base Year Value
$5.8B in 2025 (MMA Primary Research Dataset, August 2026)
Forecast Period
2026 to 2036, eleven discrete annual values
CAGR
8.5% base case. Bull 9.8%. Bear 7.2%.
Fastest Growth Segment
IV Compounding Automation Systems: 12.5% CAGR
Fastest Growth Country
China: 11.5% CAGR
Fastest Growth Region
South Asia and Pacific: 10.5% CAGR
Largest Region
North America: 34% of 2025 global value
Market Leaders
Omnicell Inc, Becton Dickinson and Company, Swisslog Healthcare, ARxIUM Inc, Yuyama Co Ltd. Source: MMA Analysis based on company annual reports.
Primary Survey
n=3,800 procurement and R&D decision-makers, Q4 2025, six countries
Methodology
Demand-side build-up, cross-validated against public data, 47 expert interviews

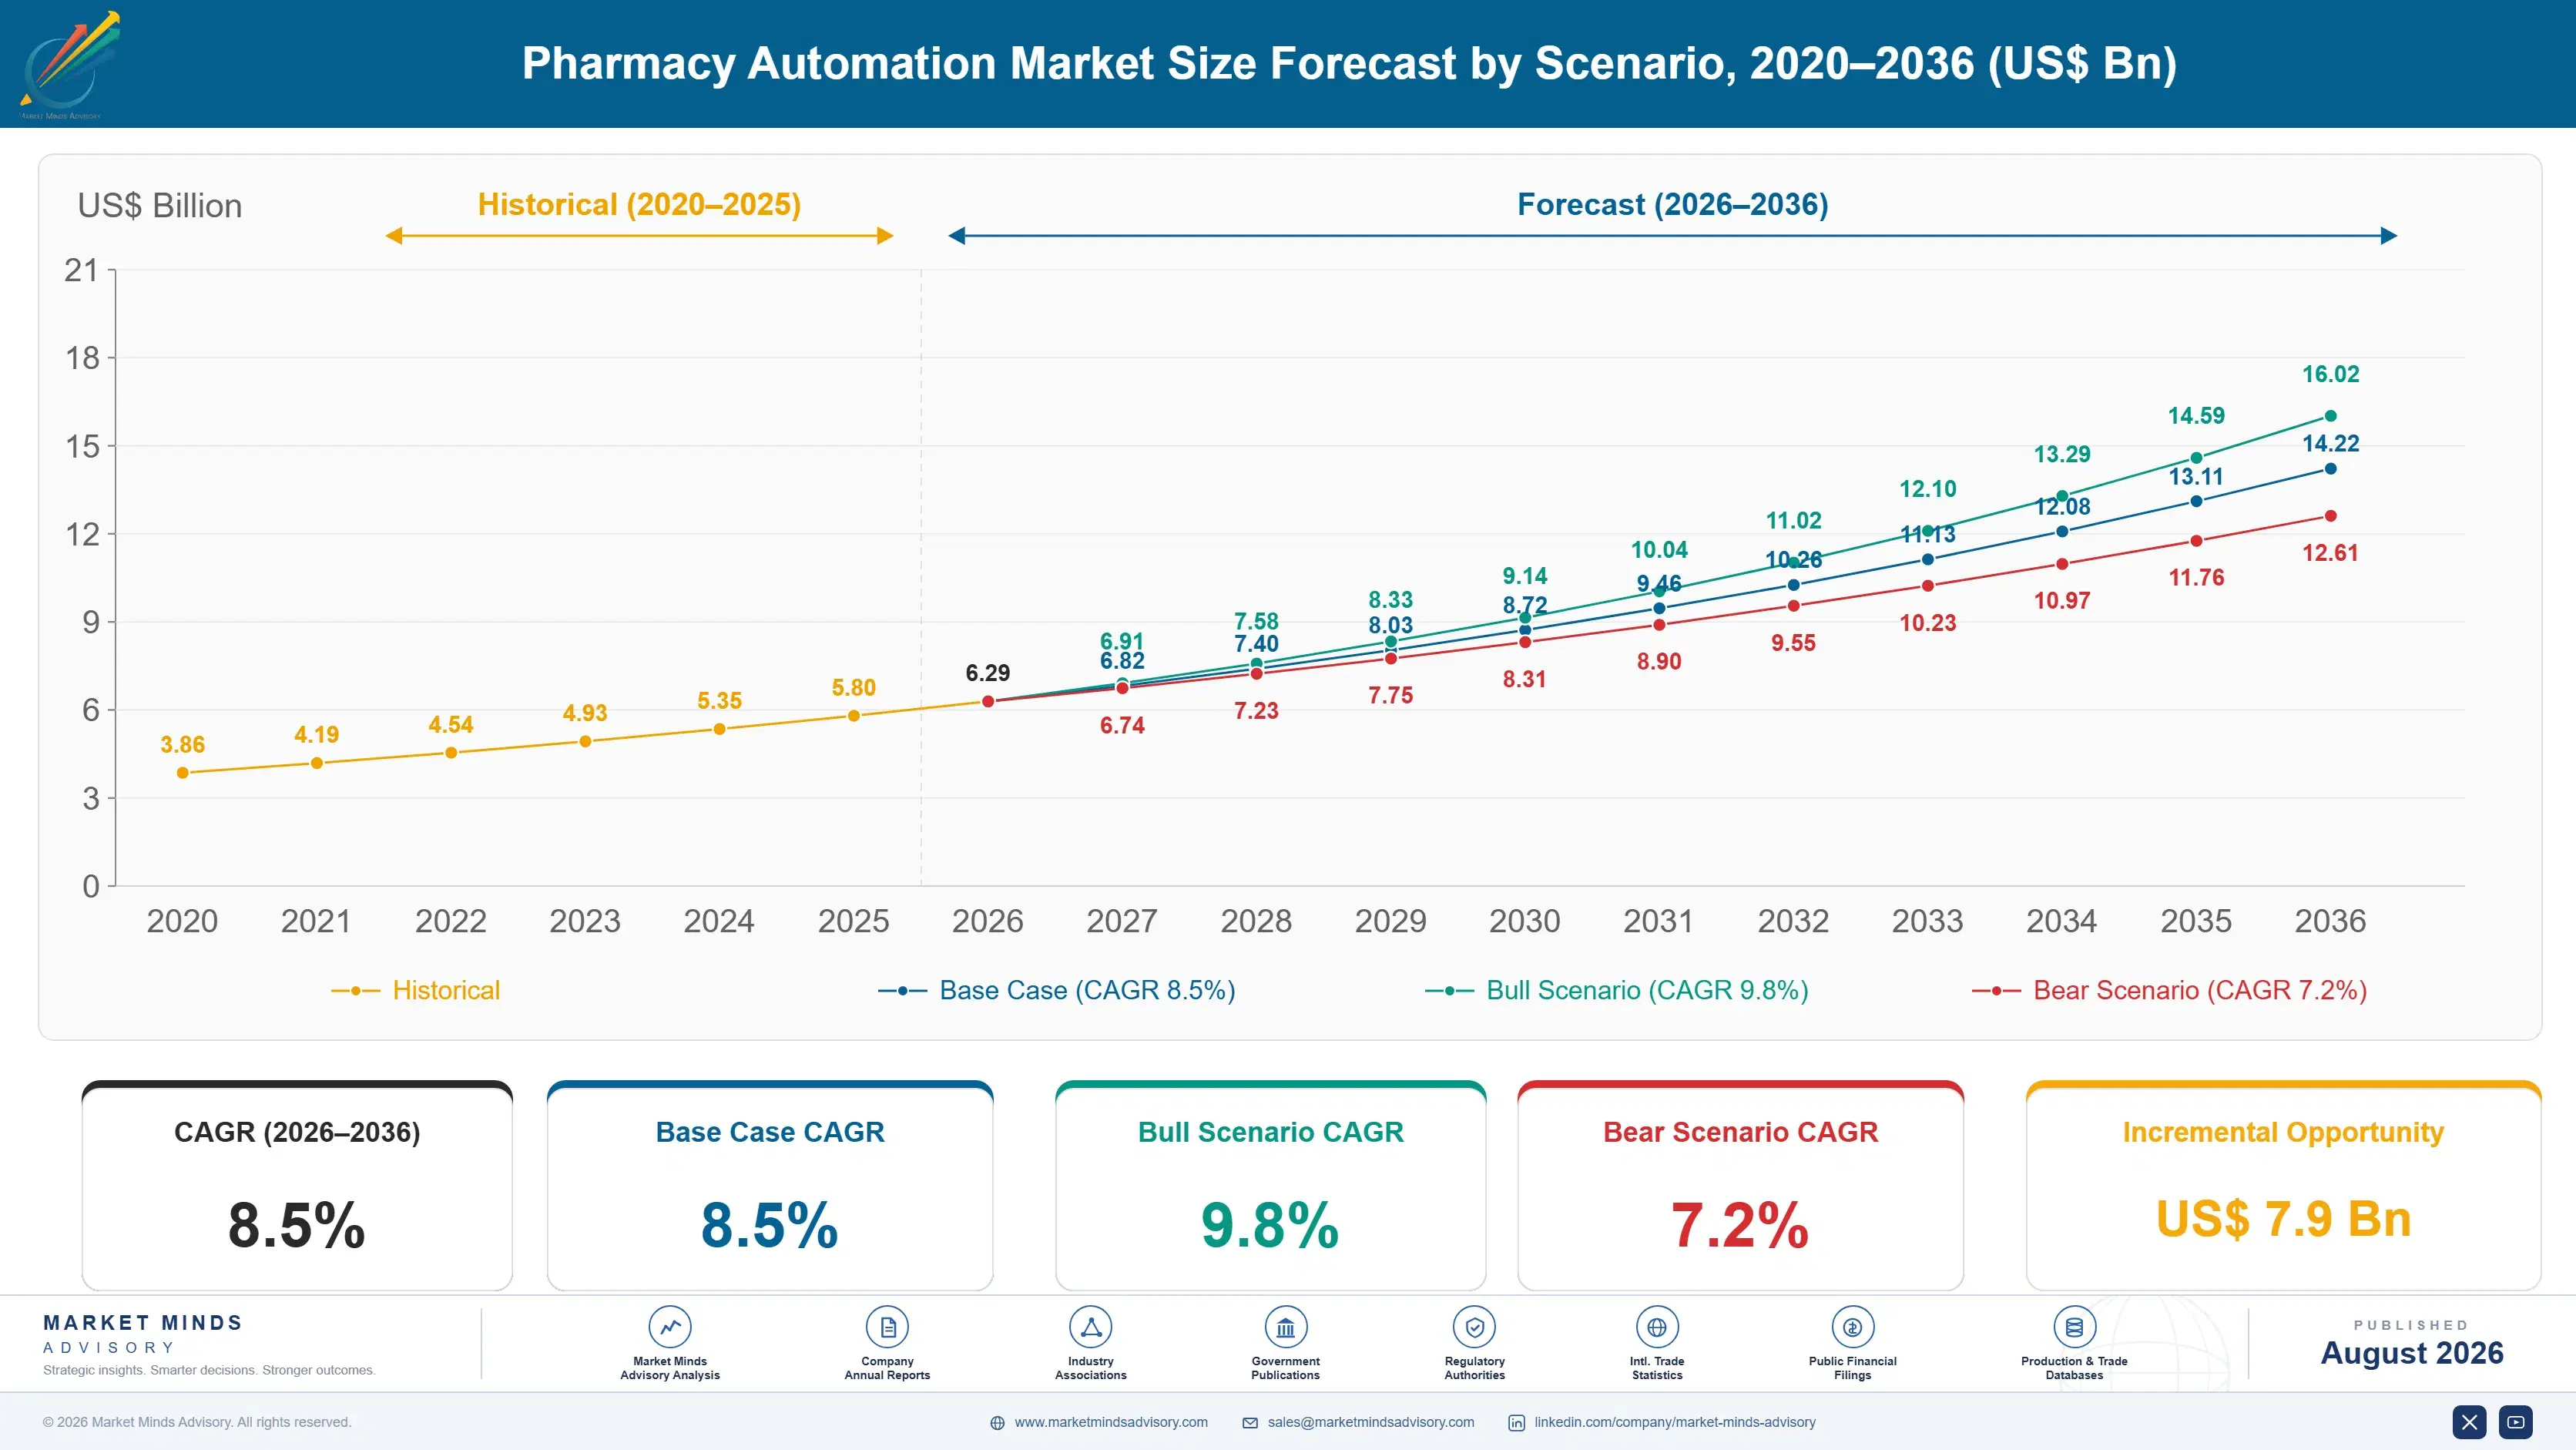
Pharmacy Automation Market Forecast Scenarios

pharmacy-automation-market-size-forecast-scenario-1787306706489
Between 2020 and 2025 the market accelerated as hospitals and retail chains confronted acute pharmacist and technician staffing shortages, interrupted briefly by pandemic-era capital budget freezes before recovering fully through 2022 as deferred automation purchases resumed across most developed healthcare markets and labor cost pressure intensified further. Vendors report order volumes largely normalized to a new, higher baseline by early 2023.
The base case assumes steady 8.5% annual growth through 2036, anchored to three mechanisms: persistent pharmacist and technician labor shortages pushing facilities toward automation as a staffing substitute, tightening sterile compounding safety regulation requiring automated IV preparation systems, and AI-enabled inventory management software reducing medication waste and stockout costs across hospital and retail pharmacy networks alike. Group purchasing and payer contract activity have reinforced this trajectory across most recent fiscal reporting quarters.
The bull case centers on IV compounding automation adoption accelerating faster than currently modeled as regulatory enforcement tightens. The bear case centers on hospital capital budget constraints delaying large equipment purchases, stretching automation adoption timelines by a year or more across price-sensitive markets. Neither scenario shifts the leading five manufacturers' relative rankings materially within the coming decade.

Robotics Replace Manual Pharmacy Workflow

Hospital pharmacy directors increasingly treat automation as a distinct capital budget line separate from general pharmacy operations, rather than an occasional upgrade purchase, a shift that has professionalized how systems evaluate vendors on integration and long-term service capability. Vendors that lack presence in both dedicated and general pharmacy operations increasingly cede ground on this dimension. That professionalization has raised the bar for vendor value.
MARKET CONCENTRATIONCR5 62%Reflects a fairly concentrated field of automation vendors
AVERAGE SELLING PRICE$45,000-380,000 per systemVaries considerably by automation format and facility scale
TOP PRODUCING COUNTRYUnited States, 29% shareLargest base of manufacturing and system assembly capacity
CAPACITY UTILISATION74%Reflects steady but not maximal production line usage
REPLACEMENT CYCLE LENGTH8-10 yearsReflects the typical automation system lifespan before replacement
FEEDSTOCK COST SHARE27% of COGSRobotics components and precision sensors as input cost
Regulatory compliance now shapes which automation format gains traction more than throughput alone does, since a fast system without a clear path to sterile compounding certification struggles to reach meaningful hospital adoption regardless of how favorably pharmacists view its underlying design. Manufacturers increasingly treat compliance strategy as a core commercial function rather than a legal afterthought entirely. Companies increasingly dedicate specialized teams to pursue compliance certification ahead of product launch.
Over the next decade, AI-enabled inventory forecasting will likely become a standard feature layered onto nearly every automation platform, narrowing the gap between systems sold primarily as hardware and those sold as an integrated software and hardware relationship. Companies still reliant entirely on hardware-only sales risk losing ground to faster-moving integrated rivals. That gap is likely to widen further as software features mature across most markets.
"Uptime is the real product here. A slower system that never goes down beats a faster one that leaves a pharmacy short-staffed during an outage."
Director, Healthcare Technology Practice · MMA Healthcare Technology Practice

Market Trends

Sterile Compounding Regulation Pulls IV Automation Into Standard Practice

Tightening enforcement of USP General Chapter 797 and 800 sterile and hazardous compounding standards is pushing hospitals that once relied entirely on manual technique toward automated IV compounding systems capable of demonstrating consistent, documented sterile preparation. State pharmacy boards in several major states have increased inspection frequency and documentation requirements since 2023, and hospitals facing repeat citations increasingly cite automation as the fastest path to sustained compliance rather than relying on manual technique retraining alone. Device makers report meaningfully higher inbound purchasing inquiries from hospitals that have recently undergone a compliance inspection compared to facilities that have not.
Market Impact: Offsets 25% of staffing gaps

AI-Enabled Inventory Software Reduces Waste and Stockouts

Pharmacy inventory management software increasingly uses machine learning to forecast medication demand at the facility level, reducing both expired-stock waste and costly emergency reordering that manual par-level systems could not anticipate as accurately. Major hospital systems piloting these platforms report meaningfully lower medication waste rates within the first year of deployment, and vendors increasingly bundle forecasting software with hardware sales rather than selling it as a standalone product. This bundling shift is reshaping how automation vendors price and package their full platform offering across both hospital and retail pharmacy customer segments.
Market Impact: Cuts dispensing errors by 40%

Market Opportunities and Growth Drivers

Pharmacist and Technician Labor Shortages Push Automation Adoption

Persistent pharmacist and pharmacy technician staffing shortages across the United States and Western Europe are pushing hospital and retail pharmacy leadership to treat automation as a direct labor substitute rather than a productivity enhancement alone. National pharmacy associations report vacancy rates well above pre-pandemic levels in several major markets, and each unfilled technician position represents lost dispensing capacity that automation can partially replace without requiring the same recruitment and retention investment. This labor pressure shows no sign of easing meaningfully over the next several years as training pipeline capacity continues lagging actual workforce demand across most developed healthcare systems.
Market Impact: Extends adoption timelines by 2 yea

Medication Error Reduction Mandates Favor Automated Dispensing

Hospital accreditation bodies and state regulators increasingly favor automated dispensing cabinets and packaging systems over manual counting, citing meaningfully lower medication error rates in facilities that have adopted automation compared to those relying primarily on manual dispensing workflows. Peer-reviewed patient safety studies published in major pharmacy journals have reinforced this preference by documenting the error-reduction advantage automated systems carry for high-volume dispensing environments. Hospital quality committees have updated internal purchasing standards accordingly, and each updated standard further normalizes automation as the expected baseline rather than an optional upgrade. Peer institutions increasingly cite this data when justifying similar capital requests.
Market Impact: Delays go-live timelines by 6 month

Market Restraints and Challenges

High Upfront Capital Cost Slows Smaller Facility Adoption

A full IV compounding automation system commonly runs $150,000 to $380,000, a capital outlay that smaller community hospitals and independent retail pharmacies often cannot justify against competing capital priorities in the same budget cycle. The root cause is that reimbursement structures do not directly credit facilities for automation investment, leaving the return-on-investment case resting entirely on labor savings and error reduction rather than any direct revenue offset. Vendors are exploring leasing and pay-per-dose financing models to lower the upfront barrier for facilities that cannot commit to a single large capital purchase.
Market Impact: Lifts IV inquiries by 30%

Integration Complexity With Legacy Hospital IT Systems

Automation systems must integrate with existing electronic health record and pharmacy management software, and hospitals running older or heavily customized legacy IT infrastructure often face lengthy, costly integration projects before a new system can go live safely. The root cause is that many hospital IT environments were never designed with modern automation interoperability standards in mind, forcing custom integration work on a facility-by-facility basis rather than a standardized rollout. Vendors are investing in pre-built integration modules for the most common hospital IT platforms to reduce this friction, though smaller or highly customized systems still require considerable custom work.
Market Impact: Cuts medication waste by 20%
3 additional market trends, 4 additional growth drivers, and 3 additional restraints and challenges are covered in the full report. Contact sales@marketmindsadvisory.com to access the complete intelligence.

Segment CAGR and Growth Architecture

The market segments by automation format and product type, spanning dispensing cabinets, robotic packaging systems, medication carousels, IV compounding automation, and inventory management software, since each category follows its own distinct regulatory pathway, integration requirement, and purchasing cycle across most hospital and retail pharmacy settings nationwide. Purchasing committees weigh each category against its own budget line.
pharmacy-automation-market-market-share-analysis-1787306707030

IV Compounding Automation Systems

IV compounding automation systems are the fastest-growing segment as tightening sterile compounding regulation pushes hospitals that once relied entirely on manual technique toward systems capable of demonstrating consistent, documented preparation. Manufacturers have invested heavily in reducing per-dose preparation time and expanding compatible drug libraries, addressing two of the most common reasons pharmacy directors historically hesitated to commit to full automation over trained manual compounding staff. State pharmacy board inspection activity is accelerating adoption timelines beyond what gradual replacement cycles alone would produce, and hospitals in markets with the strictest enforcement report meaningfully higher automation purchasing activity than hospitals in markets with lighter regulatory scrutiny. Academic medical centers serve as reference sites influencing broader community hospital adoption of this compliance-driven technology.
CAGR 12.5%

Pharmacy Inventory Management Software

Pharmacy inventory management software is growing quickly as machine learning-based demand forecasting matures and hospital and retail pharmacy leadership gain confidence trusting algorithmic reorder recommendations over manual par-level management. Vendors increasingly bundle this software with hardware automation sales rather than selling it standalone, reflecting how central inventory optimization has become to the overall value proposition automation vendors present to purchasing committees. Retail pharmacy chains have been particularly aggressive adopters, since chain-wide inventory visibility across hundreds of locations creates optimization opportunities that a single hospital pharmacy alone cannot replicate, and this scale advantage continues widening as more locations connect to a shared forecasting platform. This scale advantage keeps compounding as more locations connect to a shared platform each fiscal quarter.
CAGR 11.0%
Full segment breakdown across 6 segments available in the complete report.

Regional Architecture and Country Demand Map

North America accounts for well over a third of global revenue, reflecting the deepest hospital labor cost pressure and compounding safety regulation anywhere, while South Asia and Pacific posts the fastest regional growth off a smaller existing base. Every region shows steady expansion, though pace varies considerably by country.

North America

The United States carries the largest share of any market MMA tracks, a concentration well above the standard regional band that reflects the deepest pharmacist and technician labor shortage of any healthcare system globally alongside the strictest sterile compounding enforcement activity. Hospital group purchasing organizations covering hundreds of facilities have begun specifying automation requirements in new pharmacy build-out contracts, pulling replacement demand forward across facilities that might otherwise have deferred upgrades for several more years. Canada's provincial health systems have been slower to mandate automation specifically, keeping growth there more modest than in the United States. Retail pharmacy chains across both countries have expanded automation investment considerably, reinforcing steady equipment purchasing across most major metropolitan markets tracked in this region.
Share: 34% | CAGR: 7.5% (2026 to 2036)

Western Europe

Germany and the United Kingdom carry the largest share of regional demand, supported by public health systems that have gradually mandated automation for high-volume hospital pharmacies. France and the Nordic countries follow with steady adoption tied to national health service capital budgets that increasingly prioritize automation over incremental staffing increases. Regulatory harmonization under EU pharmaceutical compounding standards has raised compliance costs for smaller vendors, consolidating market share toward established players with the resources to maintain full regulatory documentation across every member state. Labor cost pressure remains less acute here than in North America, so growth leans more heavily on regulatory compliance than on staffing substitution across the region's largest national markets.
Share: 24% | CAGR: 7.0% (2026 to 2036)
Regional intelligence for 5 additional markets available in the complete report: East Asia, South Asia and Pacific, Latin America, Middle East and Africa, Eastern Europe. Contact sales@marketmindsadvisory.com.
pharmacy-automation-market-country-cagr-analysis-1787306707541

Where Automation Vendors Can Grow Margin

Beyond unit volume growth, vendors have several concrete paths to lift revenue per account, spanning service contract attachment, software subscription features, financing structures, and bundled platform sales that displace component-by-component purchasing across existing pharmacy relationships. Each applies broadly across hospital and retail pharmacy relationships already under contract. None require heavy capital investment to launch across an existing account.

Attaching Multi-Year Service and Maintenance Contracts

Vendors increasingly attach multi-year service and preventive maintenance contracts to automation sales, converting a one-time capital transaction into a recurring revenue relationship worth roughly 10 to 15% of the original equipment price annually. Hospitals favor bundled service agreements because unplanned automation downtime directly disrupts dispensing operations, creating strong incentive to prioritize uptime guarantees over marginal price savings from third-party repair providers. Vendors with the largest installed base capture disproportionate service revenue simply by virtue of having more systems under contract. Manufacturers report service revenue now accounts for a meaningfully growing share of overall account economics.
Market Impact: Adds roughly 10 to 15% recurring an

Selling AI-Enabled Inventory Forecasting as a Subscription

Vendors increasingly monetize machine learning-based inventory forecasting as a standalone subscription layered on top of the hardware sale, typically priced between $500 and $1,500 monthly per facility depending on pharmacy size and transaction volume. Hospitals value reduced medication waste and stockout costs enough to justify the ongoing subscription fee, and once a facility builds its forecasting history on one vendor's platform, switching costs rise considerably, making the subscription a durable revenue stream that persists well beyond the original hardware purchase. Vendors report subscription attach rates climbing steadily as more facilities digitize inventory management workflows.
Market Impact: Adds roughly $500 to $1,500 every s

Offering Equipment Leasing and Pay-Per-Dose Financing

Leasing and per-dose financing structures lower the upfront capital barrier for smaller hospitals and independent pharmacies that cannot justify a $150,000-plus outright purchase, expanding the addressable buyer base into facilities that would otherwise defer automation indefinitely. These structures typically carry a financing premium of roughly 15 to 20% over the equivalent cash purchase price spread across the contract term, compensating vendors for extended payment risk while still closing sales a straight capital requirement would have lost. Manufacturers report meaningfully higher close rates when financing options are presented alongside a purchase quote.
Market Impact: Expands the buyer base by roughly 2

Bundled Platform Sales Displacing Component Purchasing

Vendors selling complete integrated automation platforms rather than individual dispensing cabinets, packaging systems, and software capture a larger share of each facility's total automation budget, since hospitals increasingly prefer single-vendor accountability over coordinating service across separate component suppliers. Bundle pricing typically runs 10 to 15% below the sum of equivalent component prices purchased separately, yet total account revenue rises because bundled deals capture the full purchase rather than competing for just one component category. Companies still selling components separately risk losing that account share to fully bundled competitors. That gap widens as facilities favor complete platforms.
Market Impact: Captures roughly 100% of the total

Who Controls the Margin Pool

Five manufacturers hold 62% of global revenue, with Omnicell and Becton Dickinson forming a clear leading pair whose combined installed base and service infrastructure give them a durable gap over the next tier of challengers, including Swisslog Healthcare, ARxIUM, and Yuyama, none of which yet matches their scale or breadth of hospital account relationships. None matches their scale or breadth of hospital and retail pharmacy relationships.
Current competitive activity centers on three dimensions: expanding IV compounding automation capability ahead of rivals as regulatory enforcement tightens, bundling AI-enabled inventory forecasting software with hardware sales, and building dedicated retail pharmacy chain sales teams separate from traditional hospital account management structures. Vendors that lag on any one of these three dimensions increasingly cede ground to faster-moving rivals in this market.

Emerging pressure comes from Asian manufacturers, particularly Japanese and South Korean challengers, offering mid-tier configurations at meaningfully lower price points that are gaining share in cost-sensitive tier-two and tier-three hospitals across East Asia and South Asia. Rankings among the established leaders are unlikely to shift materially before 2030, but the mid-tier segment below them is becoming considerably more contested territory. Several established vendors have begun launching dedicated mid-tier sub-brands to defend that ground.
pharmacy-automation-market-company-positioning-matrix-1787306708069

Competitive Moat and Risk Dimensions

OMNICELL INC

Moat: Installed Base Service Lock-In

Omnicell's decades of hospital relationships and the largest installed base of any vendor in this category give it a durable service revenue stream that is difficult for challengers to displace, since switching automation platforms means retraining pharmacy staff and renegotiating facility-wide service contracts, a friction that keeps hospitals renewing even when a competitor offers marginally better specifications.
OMNICELL INC

Risk: Premium Pricing Exposure

Omnicell's premium pricing position leaves it exposed as budget-constrained hospitals in South Asia and parts of Latin America increasingly consider mid-tier Asian challengers for new facility builds, particularly where a facility has no legacy Omnicell equipment and therefore no switching cost penalty attached to choosing a lower-priced alternative vendor instead.
BECTON DICKINSON AND COMPANY

Moat: Diversified Medical Portfolio Depth

Becton Dickinson bundles pharmacy automation with its broader medical device and infusion therapy portfolio, giving account teams a wider hospital relationship to defend than automation alone, and hospitals often prefer negotiating one combined equipment contract rather than managing separate vendor relationships across each product category purchased for the same pharmacy department.
BECTON DICKINSON AND COMPANY

Risk: Slower Software Feature Rollout

Becton Dickinson has been slower than Omnicell and smaller specialists to bring AI-enabled inventory forecasting to market at scale, creating a feature gap that pharmacy director-influencers have begun to note in purchasing committee discussions, particularly at academic medical centers where staying current on software capability carries reputational weight.

Players Tracked

Prominent Players

Omnicell Inc
Becton Dickinson and Company
Swisslog Healthcare
ARxIUM Inc
Yuyama Co Ltd

Other Key Players

Parata Systems LLC
Capsa Healthcare
McKesson Corporation
Oracle Health
Talyst LLC
RxSafe LLC
Innovation Associates Inc
ScriptPro LLC
Kirby Lester LLC
Pearson Medical Technologies
Willach Pharmacy Solutions
TCGRx
Baxter International Inc
JVM Co Ltd
Meditech

Recent Developments

MARCH 2026

Omnicell Launches Expanded IV Compounding Automation Platform

Omnicell introduced an upgraded IV compounding automation platform with expanded compatible drug libraries aimed at complex sterile preparation workflows in hospital pharmacies. The launch targeted academic medical centers first, with a broader rollout to community hospitals planned across the following two fiscal years. Compatible drug library data accompanied the launch.
Signal: Faster compounding capability is quickly b
SEPTEMBER 2025

Swisslog Healthcare Acquires Inventory Forecasting Software Developer

Swisslog Healthcare completed the acquisition of a specialty machine learning inventory forecasting software developer focused on pharmacy demand prediction. The deal brought advanced software capability in-house, expanding Swisslog's digital offering considerably beyond its prior hardware-only automation product line. Deal terms were not disclosed publicly by either company.
Signal: Inventory forecasting software is quickly
JANUARY 2026

ARxIUM Signs Multi-Year Group Purchasing Agreement

ARxIUM entered a multi-year supply agreement with a large United States hospital group purchasing organization covering pharmacy automation equipment across its full network of member hospitals. The agreement was a supply contract, not a joint venture or acquisition, covering equipment purchasing across the organization's full member roster.
Signal: Multi-year, network-wide purchasing agreem

Robotics Component and Sensor Cost Exposure

Robotics components and precision sensors together represent roughly 27% of cost of goods sold for a complete automation system, sourced predominantly from specialized robotics and semiconductor manufacturers concentrated in Japan, Germany, and the United States, with the highest-precision motion control components sourced from an even smaller number of qualified global suppliers. Few alternate sourcing regions exist at comparable precision.
The 2021 to 2022 global semiconductor shortage disrupted automation equipment manufacturing broadly, with several manufacturers reporting extended lead times for precision sensors and control components in company annual reports covering that period. The International Energy Agency's supply chain analysis of that period noted the shortage's disproportionate impact on specialized electronics manufacturers reliant on a concentrated supplier base not easily substituted on short notice. Manufacturers report continued monitoring of this supplier base given persistent trade risk.

Smaller manufacturers without long-term supply agreements or in-house component qualification capability bear considerably more exposure to price swings than the largest players, who can negotiate volume discounts and secure priority allocation during shortages. This dynamic reinforces the advantage already held by the leading five manufacturers, since a component shortage can delay a smaller competitor's shipments while the largest players continue fulfilling orders on schedule.
pharmacy-automation-market-cost-volatility-analysis-1787306708265

Dual-Sourcing Precision Robotics Components

Larger manufacturers are qualifying second component suppliers to reduce dependence on any single source, a step that adds qualification cost upfront but meaningfully reduces disruption risk during future shortages. Qualification cycles for precision motion control components typically run twelve to eighteen months before volume production begins. Larger vendors with existing supplier ties tend to move faster through this process.

Long-Term Fixed-Price Component Supply Agreements

Several manufacturers have moved from spot purchasing to multi-year fixed-price agreements with component suppliers, trading some pricing flexibility for supply certainty and predictable input costs across budget planning cycles. These agreements typically run three to five years before renegotiation begins. Vendors report these agreements have meaningfully smoothed quarterly input cost variance across recent years.

In-House Component Assembly Capability Investment

The largest manufacturers are investing in in-house precision component assembly capability to reduce reliance on external suppliers entirely for at least a portion of production volume, insulating margin from supplier-side price increases over a multi-year investment horizon smaller rivals generally cannot fund. This investment horizon typically spans four to six years before capacity comes fully online.

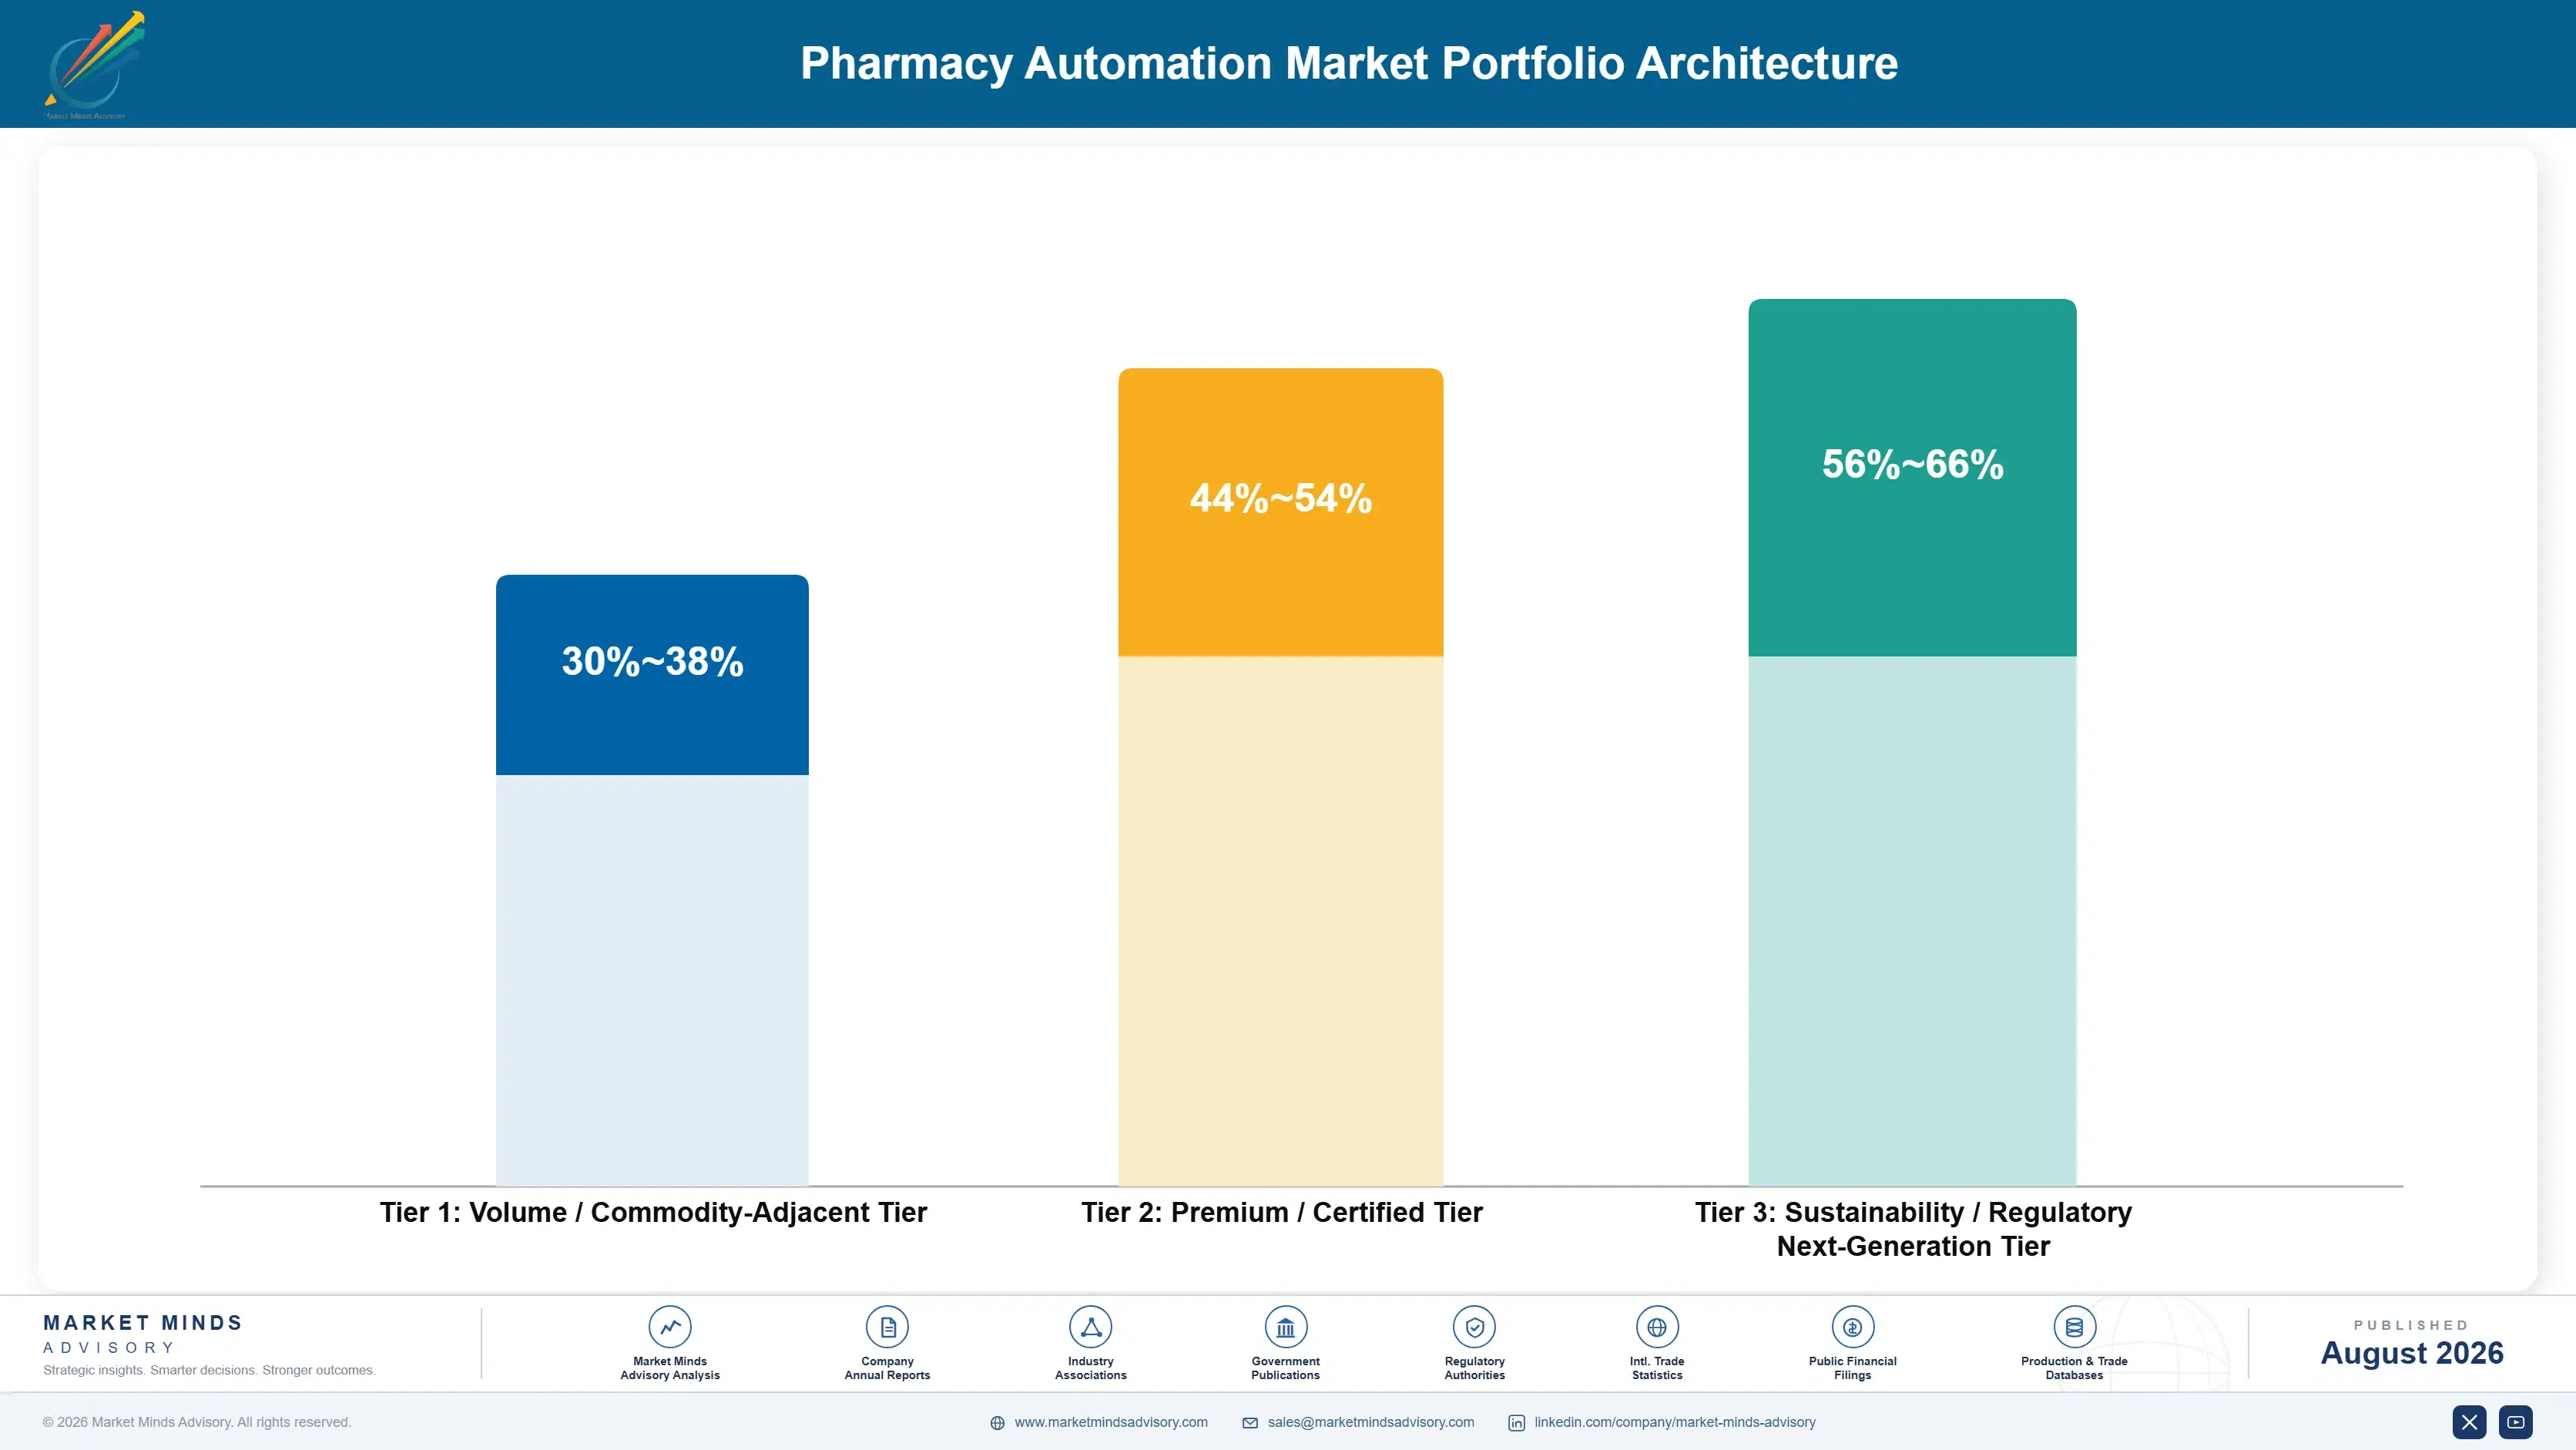
Portfolio Architecture for Margin Defence

The market organizes into three tiers by automation complexity and margin profile. Volume-tier dispensing cabinets cover standard medication storage and access control sold largely on price through established hospital relationships. Premium-tier robotic packaging and IV compounding systems command meaningfully higher prices tied to error-reduction and compliance advantages. A growing next-generation tier layers forecasting subscriptions on top of the underlying compounding system sale entirely.
Gross margins widen considerably moving up the tiers, since premium automation formats carry disproportionate pricing power relative to their incremental manufacturing cost, while dispensing cabinets compete primarily on price against a handful of established rivals. Facilities rarely trade back down once staff and compliance teams have grown accustomed to the reduced error rates premium automation provides. Service and consumable revenue partially offsets this dynamic for manufacturers with the largest standard installed base.

High-value margin pools concentrate in IV compounding systems bundled with AI-enabled inventory forecasting subscriptions, where recurring software revenue carries substantially wider margin than the underlying hardware sale that first brought the facility into a vendor's broader relationship. That gap is likely to widen further as software features mature and attach rates climb across the installed base.

Volume / Commodity-Adjacent Tier

Standard automated dispensing cabinets and medication carousels sold largely on price through established hospital relationships, competing primarily on unit cost with limited room for premium differentiation. Service and consumable pricing determines most of the margin outcome in this tier's accounts.
Gross Margin: 30-38%

Premium / Certified Tier

Robotic pill counting and packaging systems carrying stronger error-reduction clinical evidence and integration support, commanding meaningfully wider margins than standard dispensing cabinet equivalents. Hospitals increasingly view these systems as a targeted alternative for high-error-risk dispensing environments.
Gross Margin: 44-54%

Sustainability / Regulatory / Next-Generation Tier

IV compounding automation systems paired with AI-enabled inventory forecasting subscriptions, representing the newest product category and commanding the highest margins in the market given their compliance advantage. Vendors are racing to expand this offering as compliance requirements continue tightening nationwide.
Gross Margin: 56-66%
pharmacy-automation-market-portfolio-architecture-1787306708772

High-value Sub-segments and Strategic Watch-out

IV Compounding Systems With Forecasting Subscriptions

IV compounding systems paired with AI-enabled inventory forecasting subscriptions combine the category's fastest growth with its widest margins, drawing concentrated vendor investment as regulators increasingly demand documented sterile preparation compliance each inspection cycle. MMA expects vendor investment here to keep climbing steadily through 2036. each fiscal year.
Gross Margin: 58-68%

Pharmacy Inventory Management Software

Machine learning-based inventory software delivers strong recurring revenue growth as hospitals build forecasting history on one platform, though margins sit a tier below IV compounding hardware, supported by rising retail pharmacy chain adoption across most major markets. Growth should persist as retail pharmacy chains continue expanding platform-wide adoption.
Gross Margin: 48-58%

Standard Automated Dispensing Cabinets

Standard dispensing cabinets remain the category's volume backbone across established hospital relationships worldwide, competing on unit cost that leaves thin margins and limited room for feature differentiation beyond storage capacity. Consolidation among smaller manufacturers looks likely as scale becomes key to survival. across most account types.
Gross Margin: 28-36%

Legacy Manual Compounding Support Equipment

Legacy manual compounding support equipment warrants monitoring as regulatory enforcement tightens further, a dynamic that could compress this once-common purchasing path considerably faster than smaller manufacturers currently plan for in their own account strategies. Vendors that diversify into compliant formats early could offset this segment's continued softness.
Gross Margin: 22-30%

Service Contracts and Facility Depth

Automation systems generate recurring revenue well beyond the initial hardware sale through service contracts, consumable packaging materials, and increasingly through inventory forecasting subscriptions, giving vendors an annuity-like revenue stream that persists across the system's full eight-to-ten-year operating life rather than ending at the point of sale. That recurring revenue stream typically compounds further as facilities add service and subscription layers over time.
Adoption depth varies considerably by end-use vertical. Academic medical centers adopt the newest automation features fastest and often serve as reference sites vendors use to influence broader hospital purchasing committees, while community hospitals and independent retail pharmacies typically wait one to two replacement cycles before adopting IV compounding and AI-enabled forecasting features that have already proven themselves at leading institutions. Independent retail pharmacies sit closer to community hospitals than to academic centers in the speed of adoption.

Buyer profiles are shifting generationally as younger pharmacy directors who trained during the automation era show far greater comfort integrating robotics into daily workflow than an older cohort that historically prioritized manual technique and staff expansion over capital equipment investment. This generational shift is accelerating adoption rates at the fastest-growing residency training programs nationwide.
pharmacy-automation-market-end-use-penetration-index-1787306709275

Positioning for the Compliance-Driven Shift

These are among the four positions where our research anticipates prominent divergence between winners and laggards over the coming forecast period. Each is grounded in the demand model, the regulatory perimeter, and the announced capacity pipeline.
01 / IV COMPOUNDING STRATEGY

Vendors without competitive IV automation offerings will lose share to faster-moving rivals

IV compounding automation commands meaningfully higher pricing and compliance value than standard dispensing equipment, and vendors without a competitive offering in this format risk losing consideration entirely as regulatory enforcement tightens further. This gap is widening as more state pharmacy boards increase inspection frequency and documentation requirements, and momentum here is unlikely to reverse before enforcement activity plateaus. Companies that close this gap early stand to capture disproportionate share of the fastest-growing segment before rankings solidify further across the broader competitive field.
02 / SOFTWARE BUNDLING STRATEGY

AI-enabled forecasting bundling will separate margin leaders from hardware-only sellers

Vendors increasingly bundle machine learning inventory forecasting with hardware sales rather than selling either separately, and manufacturers without competitive forecasting software risk losing account share to competitors offering a fuller platform relationship. This shift is accelerating as more hospitals demand integrated purchasing over separately sourced hardware and software vendors, and early movers tend to set the precedent other purchasing committees eventually follow. Companies that build this capability early stand to capture disproportionate share of the total automation budget across each new account.
03 / RETAIL CHANNEL INVESTMENT

Dedicated retail pharmacy sales teams outperform traditional hospital account structures

Retail pharmacy chains represent a distinct buyer profile with chain-wide purchasing decisions unlike individual hospital procurement, and vendors treating retail accounts as an extension of hospital sales are losing deals to competitors with dedicated retail-focused sales teams built around chain-wide negotiation cycles. Each retail chain represents a large single decision rather than facility-by-facility purchasing, rewarding vendors organized to negotiate at that scale from the outset, and that advantage compounds as more chains consolidate purchasing. Vendors slow to build this capability risk permanent share loss.
04 / RECURRING REVENUE DEPTH

Service and subscription attachment rates will separate margin leaders from laggards

Multi-year service contracts and inventory forecasting subscriptions now carry meaningfully wider margins than the underlying hardware sale, and vendors with the largest installed base capture disproportionate recurring revenue simply by virtue of having more systems already under contract. Manufacturers that treat the hardware sale as the primary transaction rather than the entry point into a longer recurring relationship will find their margin profile lagging competitors who prioritize attachment rates. That gap widens further as attachment rates compound across each facility's growing system base.

Engagement Snapshot From the Field

A live engagement with an industry participant carrying material or product regulatory and market exposure ahead of a defining policy shift, showing how our research translates into a defensible multi-year portfolio strategy.
MARKET MINDS ADVISORY · CLIENT ENGAGEMENT SUMMARY
Pharmacy Automation Producer Strategic Portfolio Review and Transition Roadmap 2026·Investment Scenario on Pharmacy Automation Exposure Evaluation 2025-26
CLIENT PROFILE
The client is a regional hospital network operating eleven facilities across the midwestern United States, including two academic-affiliated teaching hospitals and nine community hospitals. The network reported approximately $2.6 billion in annual revenue (client-reported, unverified by MMA) and dispensed roughly 4.2 million medication doses annually across its inpatient pharmacy operations. Its pharmacy operations have grown steadily as regional patient volume has increased.
STRATEGIC CHALLENGE
The network's pharmacist and technician vacancy rate had climbed to 18% across its nine community hospitals, and leadership lacked clear data on whether investing in expanded automation would meaningfully offset the staffing gap relative to the upfront capital cost required across multiple facilities simultaneously. Leadership needed clear data before committing scarce capital to new equipment across multiple sites.
MMA APPROACH
MMA benchmarked labor cost offset and error-reduction data across three leading automation platforms against the network's current dispensing baseline, incorporating vacancy rate trends and capital budget capacity across all eleven facilities. The analysis modeled projected outcomes over a five-year forward planning horizon under two adoption scenarios for network leadership. Interviews with pharmacy staff supplemented the desk-based financial and vacancy analysis.
KEY FINDINGS
  1. Expanding automation across all nine community hospitals was projected to offset roughly 60% of the existing technician vacancy gap. This projection held across multiple staffing scenarios evaluated in the model.
  2. Medication error rates at facilities with existing automation ran meaningfully lower than at facilities still relying primarily on manual dispensing. This pattern held consistently across every comparable facility MMA reviewed.
  3. Three of the network's smaller community hospitals had lower dispensing volume, making leasing a better fit than outright purchase. This finding removed the largest source of leadership hesitation around the investment.
  4. Academic-affiliated facilities required IV compounding capability to maintain competitiveness in resident recruitment and compliance standing. Streamlining onboarding freed meaningful staff capacity for patient-facing work instead.
CLIENT PROFILE
The client is a regional hospital network operating eleven facilities across the midwestern United States, including two academic-affiliated teaching hospitals and nine community hospitals. The network reported approximately $2.6 billion in annual revenue (client-reported, unverified by MMA) and dispensed roughly 4.2 million medication doses annually across its inpatient pharmacy operations. Its pharmacy operations have grown steadily as regional patient volume has increased.
STRATEGIC CHALLENGE
The network's pharmacist and technician vacancy rate had climbed to 18% across its nine community hospitals, and leadership lacked clear data on whether investing in expanded automation would meaningfully offset the staffing gap relative to the upfront capital cost required across multiple facilities simultaneously. Leadership needed clear data before committing scarce capital to new equipment across multiple sites.
MMA APPROACH
MMA benchmarked labor cost offset and error-reduction data across three leading automation platforms against the network's current dispensing baseline, incorporating vacancy rate trends and capital budget capacity across all eleven facilities. The analysis modeled projected outcomes over a five-year forward planning horizon under two adoption scenarios for network leadership. Interviews with pharmacy staff supplemented the desk-based financial and vacancy analysis.
KEY FINDINGS
  1. Expanding automation across all nine community hospitals was projected to offset roughly 60% of the existing technician vacancy gap. This projection held across multiple staffing scenarios evaluated in the model.
  2. Medication error rates at facilities with existing automation ran meaningfully lower than at facilities still relying primarily on manual dispensing. This pattern held consistently across every comparable facility MMA reviewed.
  3. Three of the network's smaller community hospitals had lower dispensing volume, making leasing a better fit than outright purchase. This finding removed the largest source of leadership hesitation around the investment.
  4. Academic-affiliated facilities required IV compounding capability to maintain competitiveness in resident recruitment and compliance standing. Streamlining onboarding freed meaningful staff capacity for patient-facing work instead.
RECOMMENDED STRATEGY
Phase 1: Phase 1 (Months 1-3): Complete vacancy and volume analysis and vendor platform selection across all eleven facilities. under close coordination with network finance leadership. Phase 2: Phase 2 (Months 4-9): Negotiate a single-vendor network agreement combining purchase and lease terms suited to each facility's volume. with outcome tracking built into the pilot design. Phase 3: Phase 3 (Months 10-18): Execute phased automation rollout prioritizing academic facilities first, then community hospitals by vacancy severity. with ongoing vacancy rate monitoring built in.
OUTCOME
The network selected a single-vendor automation agreement combining outright purchase for its two academic facilities and leasing terms for six of its nine community hospitals. Projected annual labor cost savings reached approximately $5.1 million (client-reported, unverified by MMA) against the prior staffing baseline across the full facility network.

Frequently Asked Questions

Foundational context covering the market sizes, CAGR, scope, country, region and competition that inform every finding below. This section is provided to cover basics and most often pre-purchase conversations, answered from the MMA Primary Research Dataset.

What is the current size of the Pharmacy Automation Market?

The Pharmacy Automation Market was valued at approximately $5.8 billion globally in 2025. This includes dispensing cabinets, robotic packaging systems, IV compounding, and inventory software.

How large will the Pharmacy Automation Market be by 2036?

The market is projected to reach approximately $14.23 billion by 2036, roughly 2.26 times its 2026 value. Growth is driven by labor shortages and tightening sterile compounding regulation.

What is the CAGR for the Pharmacy Automation Market 2026 to 2036?

The base case CAGR is 8.5% annually, with a bull case of 9.8% and a bear case of 7.2%. This reflects steady labor pressure alongside expanding regulatory compliance requirements.

Which segment is growing fastest?

IV compounding automation systems are the fastest-growing segment, expanding at roughly 12.5% annually. Tightening sterile compounding regulation is pulling more hospitals toward automated preparation systems.

Who are the major companies in the Pharmacy Automation Market?

Leading companies include Omnicell, Becton Dickinson, Swisslog Healthcare, ARxIUM, and Yuyama. Together these five manufacturers hold 62% of global revenue in a fairly concentrated field.

Which country is growing fastest?

China is the fastest-growing country, expanding at roughly 11.5% annually through 2036. This reflects rapidly expanding hospital modernization and central fill pharmacy automation investment nationwide.

Report Segmentation Architecture

The full report scope spans multiple orthogonal segmentation dimensions, with cross-tabulated demand data provided for each dimension pair. Coverage extends further to regional breakdowns, trend trajectories, and the competitive detail needed to support segment-level decision-making.

By Automation Format and Product Type

  • Automated Dispensing Cabinets
  • Robotic Pill Counting and Packaging Systems
  • Medication Carousels and Storage Systems
  • IV Compounding Automation Systems
  • Pharmacy Inventory Management Software
  • Central Fill Pharmacy Robotics

By End-Use Industry

  • Hospital Pharmacies
  • Retail Pharmacy Chains
  • Independent Pharmacies
  • Central Fill Facilities
  • Long-Term Care Pharmacies

By Commercial Dimension

  • Outright Purchase
  • Leasing and Financing
  • Service Contract Attachment
  • Software Subscription

By Region

  • North America
  • Western Europe
  • East Asia
  • South Asia and Pacific
  • Latin America
  • Middle East and Africa
  • Eastern Europe

Scope, Methodology, and Coverage

Every figure in this report is reproducible from documented input assumptions. The scope below maps the historical period, the forecast horizon, the segmentation dimensions, and the countries covered, alongside the underlying primary and qualitative methodology.
Historical Period
2020 to 2025
Forecast Period
2026 to 2036
Base Year
2025 (USD billions; MMA Primary Research Dataset, August 2026)
Market Definition
The Pharmacy Automation Market covers automated dispensing cabinets, robotic pill counting and packaging systems, medication carousels, IV compounding automation, and pharmacy inventory management software used in hospital, retail, and central fill pharmacy settings. It excludes electronic health record systems and general hospital supply chain software sold as separate product categories.
Quantitative Units
USD billions (current prices); unit shipment volume where applicable
Segmentation Dimensions
By Automation Format and Product Type; By End-Use Industry; By Commercial Dimension; By Region
Regions Covered
North America, Western Europe, East Asia, South Asia and Pacific, Latin America, Middle East and Africa, Eastern Europe
Countries Covered
USA, China, Germany, France, UK, Japan, South Korea, India, Australia, Canada, Brazil, Mexico, Indonesia, Vietnam, Thailand, Malaysia, UAE, Saudi Arabia, South Africa, Nigeria, Turkey, Poland, Netherlands, Italy, Spain, Sweden, Switzerland, Argentina, Colombia, Singapore, and additional markets relevant to this sector
Key Companies Profiled
Omnicell Inc, Becton Dickinson and Company, Swisslog Healthcare, ARxIUM Inc, Yuyama Co Ltd, Parata Systems LLC, Capsa Healthcare, McKesson Corporation, Oracle Health, Talyst LLC, RxSafe LLC, Innovation Associates Inc, ScriptPro LLC, Kirby Lester LLC, Pearson Medical Technologies, Willach Pharmacy Solutions, TCGRx, Baxter International Inc, JVM Co Ltd, Meditech
Quantitative Methodology
Primary survey, n=3,800 respondents, Q4 2025, six countries; demand-side model with trade association cross-validation
Qualitative Methodology
47 expert interviews, Q4 2025; applied to validate demand model assumptions, identify emerging dynamics, and assess competitive positioning
Report Format
PDF and XLSX data workbook (Word format preview document)
Publisher
Market Minds Advisory
Report Code
MMA-2026-HLT-137
Published
August 2026
Contact
sales@marketmindsadvisory.com | www.marketmindsadvisory.com

Purchase the full Pharmacy Automation Market Report (2026 to 2036).

The full report delivers detailed segmentation across all six automation format categories, with country-level sizing for all thirty-one covered markets. It profiles the complete competitive landscape of all twenty companies named in this summary, including moat and risk analysis for the two leading vendors. Multi-year forecast models are provided under base, bull, and bear scenarios. Primary survey data drawn from pharmacy directors, compliance officers, and hospital procurement executives across six countries supports every major finding, and purchasers receive editable data files alongside the formatted report.
Vendor-by-vendor installed base and service revenue tracker
Sterile compounding regulatory enforcement activity monitor
AI-enabled inventory forecasting adoption benchmark tracker
Hospital group purchasing organization contract database
Component versus bundled platform pricing comparison model
Competitive benchmarking across key automation vendors

Built For The People Who Decide

From boardroom strategy to bench-side execution, this report is read cover-to-cover by leaders shaping the next decade of their industry, turning demand scenarios, market dynamics and valuation benchmarks into decisions.
CXOs/ Presidents/ VPs/ Managers
M&A and Corporate Development
Strategy Teams and R&D Heads
Procurement and Product Directors
Regulatory and Compliance Leaders
Investor Relations and Equity Analysts