Market Minds Advisory
Pharmaceutical Packaging Market

Pharmaceutical Packaging Market: Injectable Demand Now Outgrows The Solid-Dose Business That Built The Category

A commercial reading of pharmaceutical packaging, where GLP-1 and biologics injectable demand grows faster than the solid-dose business that built the category, and glass and elastomer capacity decides which suppliers get specified.

Lead Analyst

Bilal Shaikh

Published

September 2026

Make Smarter Decisions with Customized Research Insights

Request a free sample report and evaluate market opportunities, growth trends, and competitive dynamics relevant to your business needs.

2025 MARKET VALUE$148.6BMarket Size 2025
2036 FORECAST VALUE$325.9BBase Case , 2026 to 2036
CAGR 2026 TO 20367.4 %Bull 8.6% / Bear 6.2%
INCREMENTAL OPPORTUNITY$166.3BNet 10- year value creation
EXPANSION MULTIPLE2.04x2036 value over 2026 base
Strategic Levers
M&A Pipeline
Regional Outlook
Country Rankings
Competitive Intelligence
Segmental Deep-dive
Call-Us : 91 93563 13602

Executive Snapshot and Market Trajectory

Injectable packaging now grows faster than the solid-dose business that built this category, as GLP-1 obesity and diabetes therapies pull pre-filled syringe and auto-injector demand to a scale few suppliers had capacity planned for. Glass tubing and elastomer component supply increasingly decide launch timing more than drug manufacturing itself does.
The market stands at USD 148.6 billion in 2025 and reaches USD 325.89 billion by 2036 at a 7.4% CAGR. Pre-filled syringes and auto-injectors grow fastest at 13.8%, about 1.86 times the overall rate, as GLP-1 and biologics manufacturers specify self-administration formats over vial-and-needle delivery. North America holds the largest share at 28% on biologics manufacturing concentration, while India posts the quickest national growth at 11.6% on expanding generics and contract manufacturing capacity.
Concentration sits at a moderate CR5 of 44%, reflecting an industry where glass forming and elastomer formulation expertise increasingly separate qualified suppliers from a broader commodity packaging field. Two forces now reshape the field. Borosilicate glass tubing and elastomer component capacity has become the binding constraint on injectable drug launch timelines, and serialization requirements have turned packaging into a genuine compliance system rather than a passive container.
Market Definition
The pharmaceutical packaging market covers primary and secondary packaging components used to contain, protect, and deliver pharmaceutical and biologic drug products, including pre-filled syringes, auto-injectors, vials, ampoules, blister packaging, bottles, closures, cartridges, and serialization systems. Drug manufacturing equipment, the pharmaceutical products themselves, and general consumer packaging outside pharmaceutical applications are excluded.
Base Year Value
$148.6B in 2025 (MMA Primary Research Dataset, August 2026)
Forecast Period
2026 to 2036, eleven discrete annual values
CAGR
7.4% base case. Bull 8.6%. Bear 6.2%.
Fastest Growth Segment
Pre-Filled Syringes and Auto-Injectors: 13.8% CAGR
Fastest Growth Country
India: 11.6% CAGR
Fastest Growth Region
South Asia and Pacific: 9.4% CAGR
Largest Region
North America: 28% of 2025 global value
Market Leaders
West Pharmaceutical Services, Gerresheimer, SCHOTT Pharma, Stevanato Group, Becton Dickinson. Source: MMA Analysis based on company annual reports.
Primary Survey
n=3,800 procurement and R&D decision-makers, Q4 2025, six countries
Methodology
Demand-side build-up, cross-validated against public data, 47 expert interviews

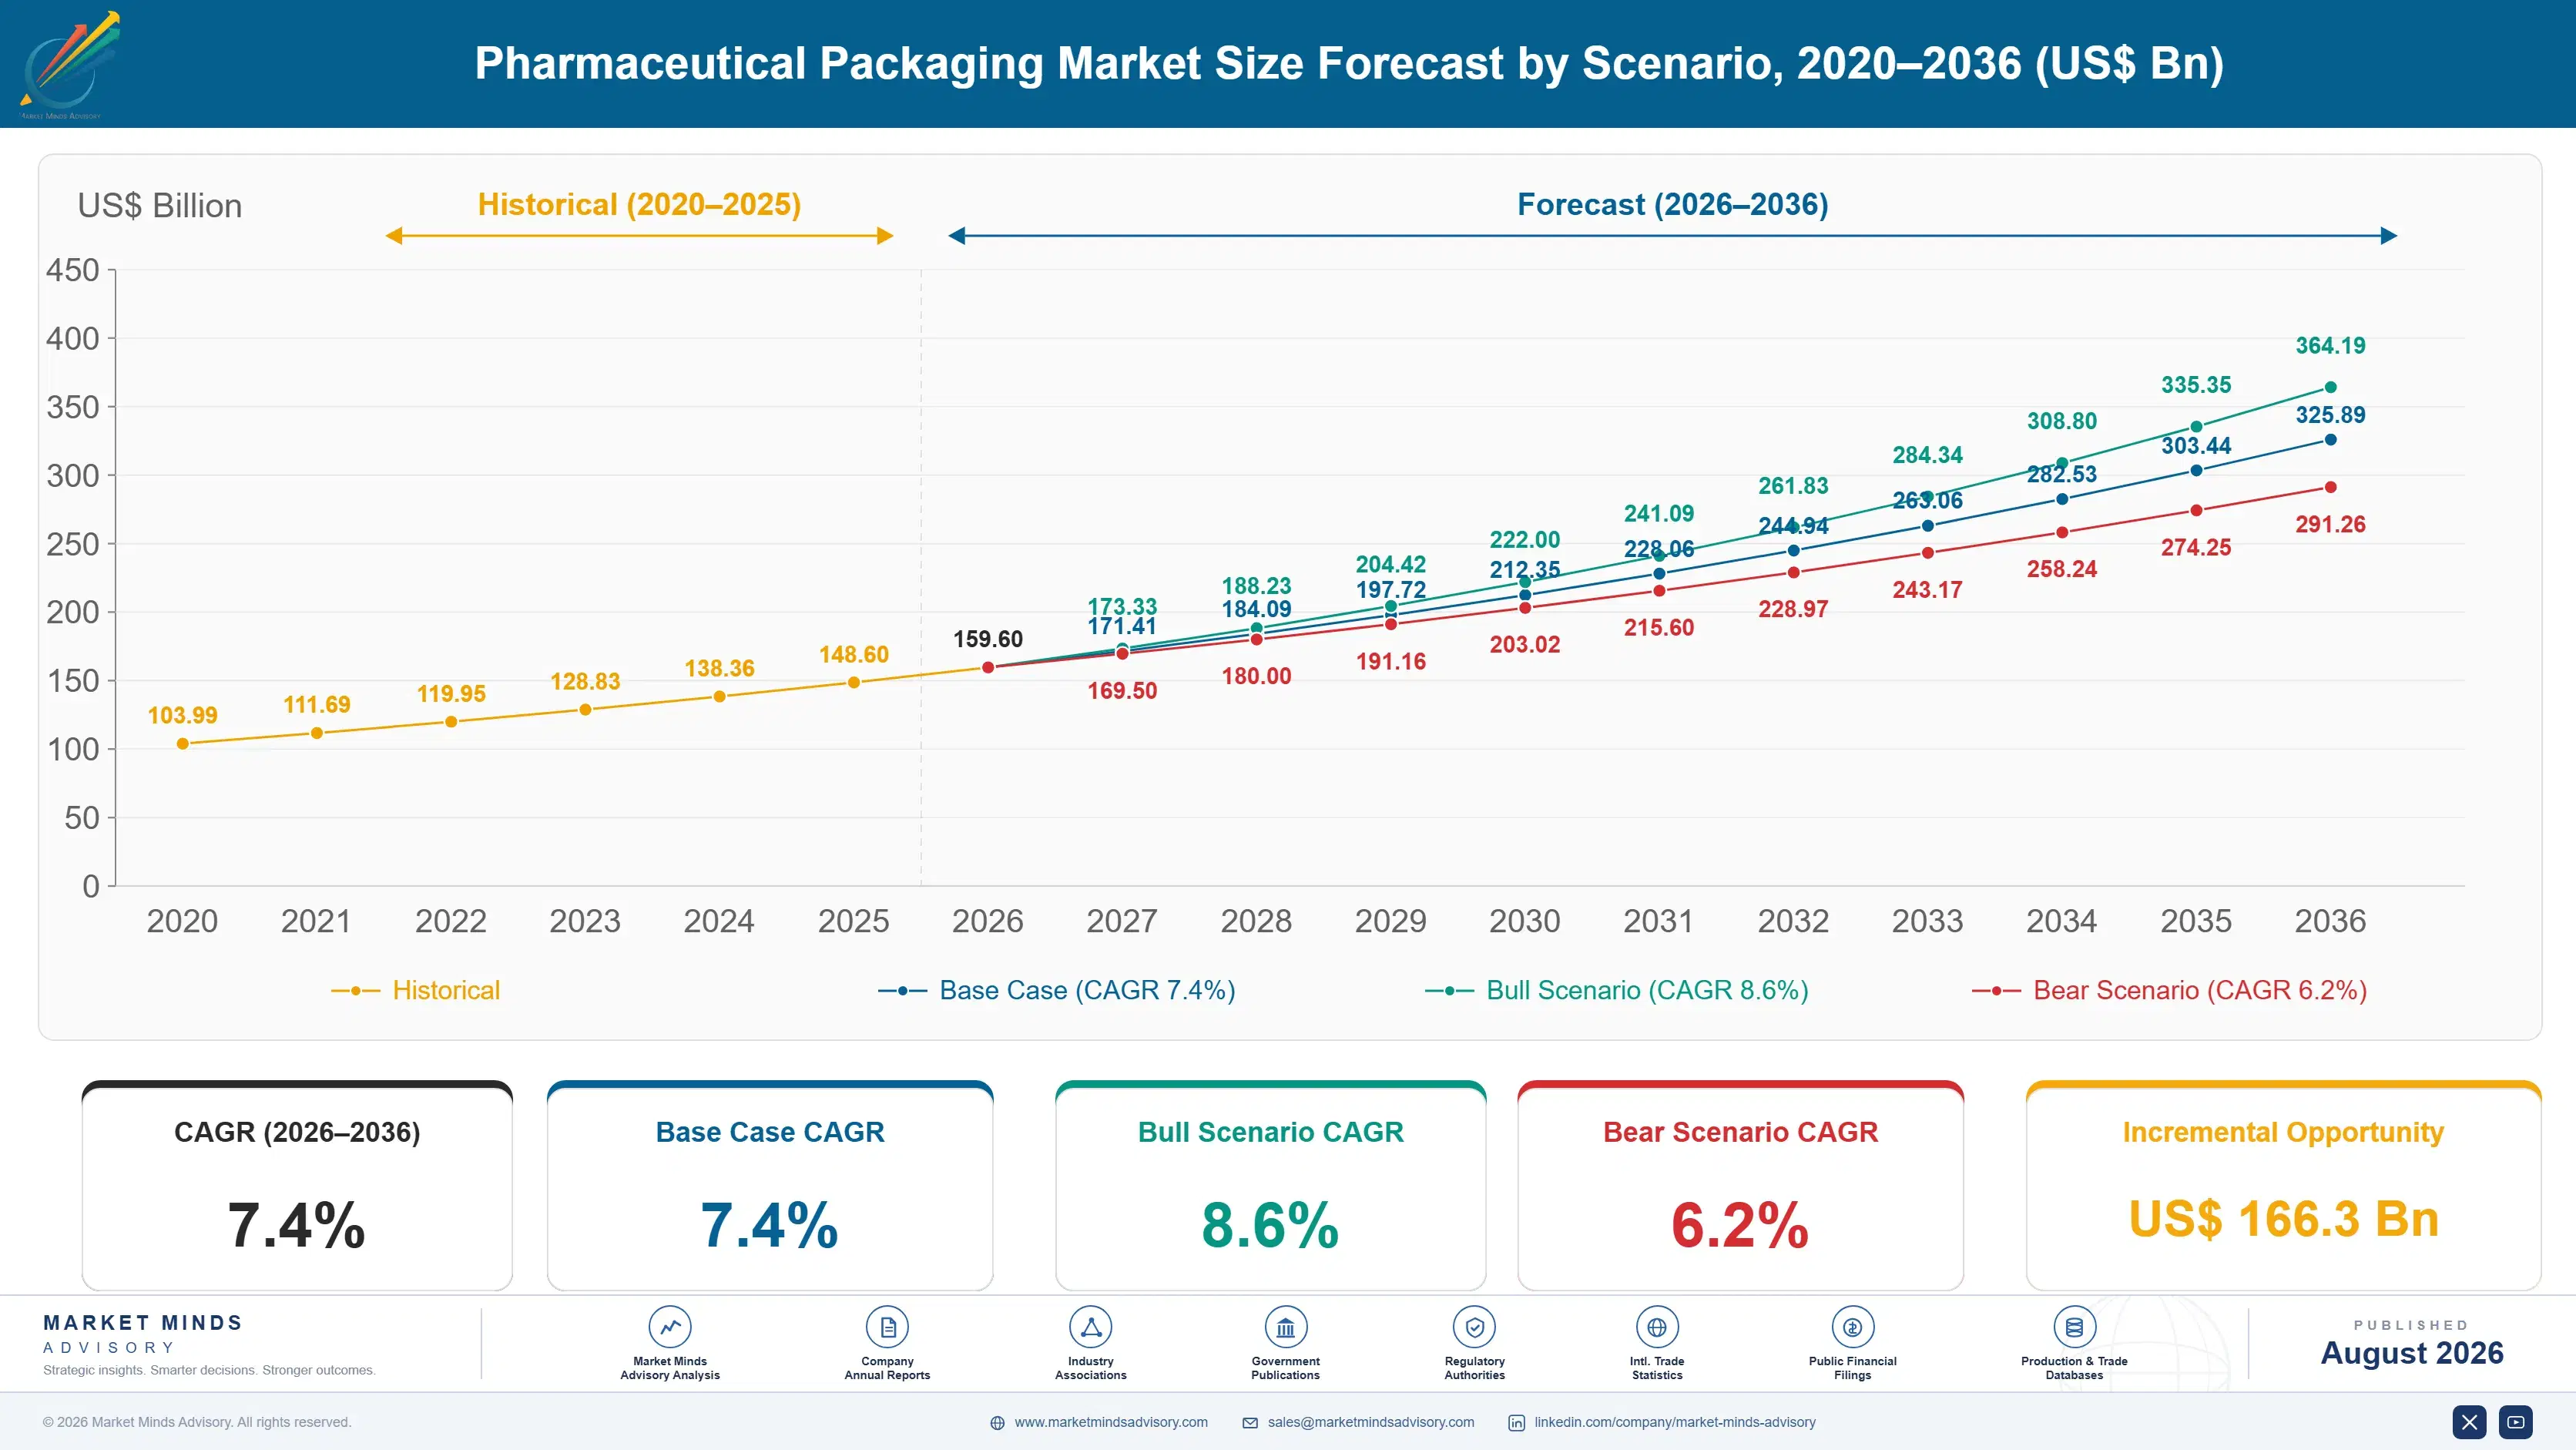
Pharmaceutical Packaging Market Forecast Scenarios

pharmaceutical-packaging-market-size-forecast-scenario-1787324397393
Growth from 2020 to 2025 compounded near 6.3%, steady through pandemic vaccine packaging demand before GLP-1 and broader biologics injectable growth accelerated the pace considerably from 2023 onward across most major pharmaceutical markets worldwide. Vial and syringe capacity that vaccine manufacturing had built found immediate new demand once obesity and diabetes injectable volumes began scaling rapidly worldwide.
Three mechanisms carry the base case to 7.4%. First, GLP-1 and biologics injectable growth: obesity, diabetes, and biologic therapies increasingly specify pre-filled syringes and auto-injectors over vial-and-needle delivery entirely across most major categories. Second, serialization and anti-counterfeiting regulation, as more markets require track-and-trace systems that turn packaging into active compliance infrastructure. Third, generic and CDMO manufacturing expansion, particularly across India and China, sustaining steady solid-dose and vial packaging demand growth.
The bull case at 8.6% assumes GLP-1 and biologics injectable volume continues scaling at its recent pace and glass and elastomer capacity expansion keeps pace with demand. The bear case at 6.2% assumes injectable drug capacity constraints and glass tubing supply limitations slow launch timelines, and that generic manufacturing growth in emerging markets moderates alongside broader pharmaceutical pricing pressure.

Why Glass And Elastomer Capacity Now Gates Drug Launches

Three forces set demand. Injectable drug growth provides the fastest-growing layer, as GLP-1, biologics, and specialty therapies increasingly specify pre-filled syringes and auto-injectors that require precision glass and elastomer components. Serialization regulation provides a second layer, turning packaging into active track-and-trace compliance infrastructure rather than a passive container. Generic and CDMO manufacturing expansion provides the steady base, particularly across India and Chin
MARKET CONCENTRATIONCR5: 44%Moderately concentrated among suppliers with proven glass and elastomer expertise
INJECTABLE END-USE SHAREAbout 32%Total packaging revenue tied to injectable drug delivery formats
TYPICAL QUALIFICATION TIMELINE18 to 36 monthsTime required to qualify new components with a manufacturer
BOROSILICATE GLASS COST SHARE30 to 42%Glass tubing and forming cost within total injectable packaging cost
TOP PRODUCING COUNTRY SHAREGermany: about 19%Global pharmaceutical glass and elastomer manufacturing output concentrated regionally
SERIALIZATION COMPLIANCE RATEAbout 91%Share of regulated markets requiring track-and-trace packaging systems
The commercial character is decided by component qualification and capacity rather than by unit price alone. A drug manufacturer cannot switch packaging suppliers without months of stability and compatibility testing, and glass tubing and elastomer capacity now runs well behind confirmed injectable drug demand. That is why suppliers with proven qualification track records and secured capacity command premium pricing that newer entrants cannot match regardless of technical capability.
The next decade turns on two things. Whether glass tubing and elastomer component manufacturing capacity expands fast enough to clear the injectable drug demand surge building across multiple therapeutic categories simultaneously. And whether serialization and anti-counterfeiting systems standardise sufficiently across regions to let suppliers build scale rather than country-specific compliance solutions.
"Everyone still asks whether a drug will get FDA approval. That used to be the bottleneck. Now the question is whether anyone can actually get the pre-filled syringes made, because the glass and rubber supply chain did not plan for GLP-1 volumes."
Director, Pharmaceutical Packaging Practice · MMA Packaging / Pharmaceutical and

Market Trends

GLP-1 Demand Strains Pre-Filled Syringe And Cartridge Capacity

GLP-1 obesity and diabetes therapies have pulled pre-filled syringe, auto-injector, and pen cartridge demand to a scale few packaging suppliers had capacity planned for even three years ago, and qualified manufacturing slots now run well behind confirmed drug volume. West Pharmaceutical Services and Stevanato Group have both announced significant capacity expansion, but new production lines take years to commission and qualify for injectable-grade use. This has shifted competitive advantage toward suppliers with existing capacity and proven delivery history over newer entrants still building a track record. Drug manufacturers increasingly treat capacity reservation as seriously as ingredient supply itself.
Market Impact: Injectable demand adds 3.4 points
Serialization Turns Packaging Into Active Compliance Infrastructure

Track-and-trace serialization requirements, now covering roughly 91% of major regulated pharmaceutical markets, have turned packaging from a passive container into an active compliance system requiring unique identifiers, aggregation data, and supply chain verification at every handoff point. Suppliers increasingly build dedicated serialization technology divisions rather than treating it as a printing add-on, since compliance failures can halt drug shipments entirely regardless of product quality. This shift favours packaging suppliers with integrated technology capability over pure component manufacturers lacking software and data infrastructure investment. Regulatory harmonisation across regions remains incomplete, forcing suppliers to support multiple country-specific serialization standards simultaneously.
Market Impact: CDMO demand grows near 8%

Market Opportunities and Growth Drivers

Biologics And GLP-1 Therapies Require Precision Injectable Packaging

Biologic drugs and GLP-1 therapies require injectable packaging manufactured to tolerances that solid-dose packaging never demanded, since protein stability and dosing accuracy depend directly on glass quality, elastomer formulation, and manufacturing precision. Drug developers specify packaging suppliers years ahead of commercial launch, giving early-qualified suppliers a demand pipeline visible well before volume materialises at scale. This dynamic has pulled injectable-grade capacity investment ahead of where solid-dose demand alone would have justified it, and suppliers slow to invest in precision manufacturing risk missing qualification windows tied to specific drug approval timelines.
Market Impact: Capacity gaps delay launches 12 mon

Generic And CDMO Manufacturing Expansion Sustains Steady Volume

Generic drug manufacturing and contract development and manufacturing organisation capacity continues expanding across India, China, and other emerging manufacturing hubs, sustaining steady demand for solid-dose blister packaging, vials, and bottles even as injectable formats capture the fastest growth. Indian generic manufacturers in particular are scaling capacity to serve both domestic and export markets, pulling packaging demand growth that tracks broader pharmaceutical manufacturing expansion closely across the industry. This driver provides a stable demand floor that offsets some of the volatility injectable-focused suppliers face from drug approval timing and clinical trial outcomes generally.
Market Impact: Compliance costs reach 7% of revenu

Market Restraints and Challenges

Glass And Elastomer Capacity Cannot Match Injectable Demand Surge

Demand for borosilicate glass tubing and injectable-grade elastomer components has outrun the manufacturing capacity of the small number of qualified suppliers, and qualification timelines of 18 to 36 months now determine how quickly a drug manufacturer can launch a new injectable product. The root cause is that glass forming and elastomer compounding require specialised manufacturing and extensive stability testing that cannot be scaled as quickly as demand has grown across multiple therapeutic categories. Commercially this delays revenue-generating drug launches regardless of how quickly clinical milestones are completed. Suppliers respond with capacity expansion and long-term reservation agreements.
Market Impact: Injectable share reaches 32% of rev

Serialization Compliance Costs Burden Smaller Manufacturers Disproportionately

Track-and-trace serialization systems require significant technology investment that smaller pharmaceutical manufacturers and packaging suppliers absorb disproportionately relative to their revenue base, since compliance infrastructure costs do not scale down proportionally with production volume. The root cause is that serialization technology requires similar core infrastructure regardless of manufacturer size, creating a fixed cost burden that larger competitors spread across far greater volume. Commercially this pushes smaller manufacturers toward outsourced serialization services or exit from markets requiring the most stringent compliance systems. Suppliers respond by offering serialization-as-a-service models that spread technology cost across multiple smaller customers.
Market Impact: Serialization coverage reaches 91%
3 additional market trends, 4 additional growth drivers, and 3 additional restraints and challenges are covered in the full report. Contact sales@marketmindsadvisory.com to access the complete intelligence.

Segment CAGR and Growth Architecture

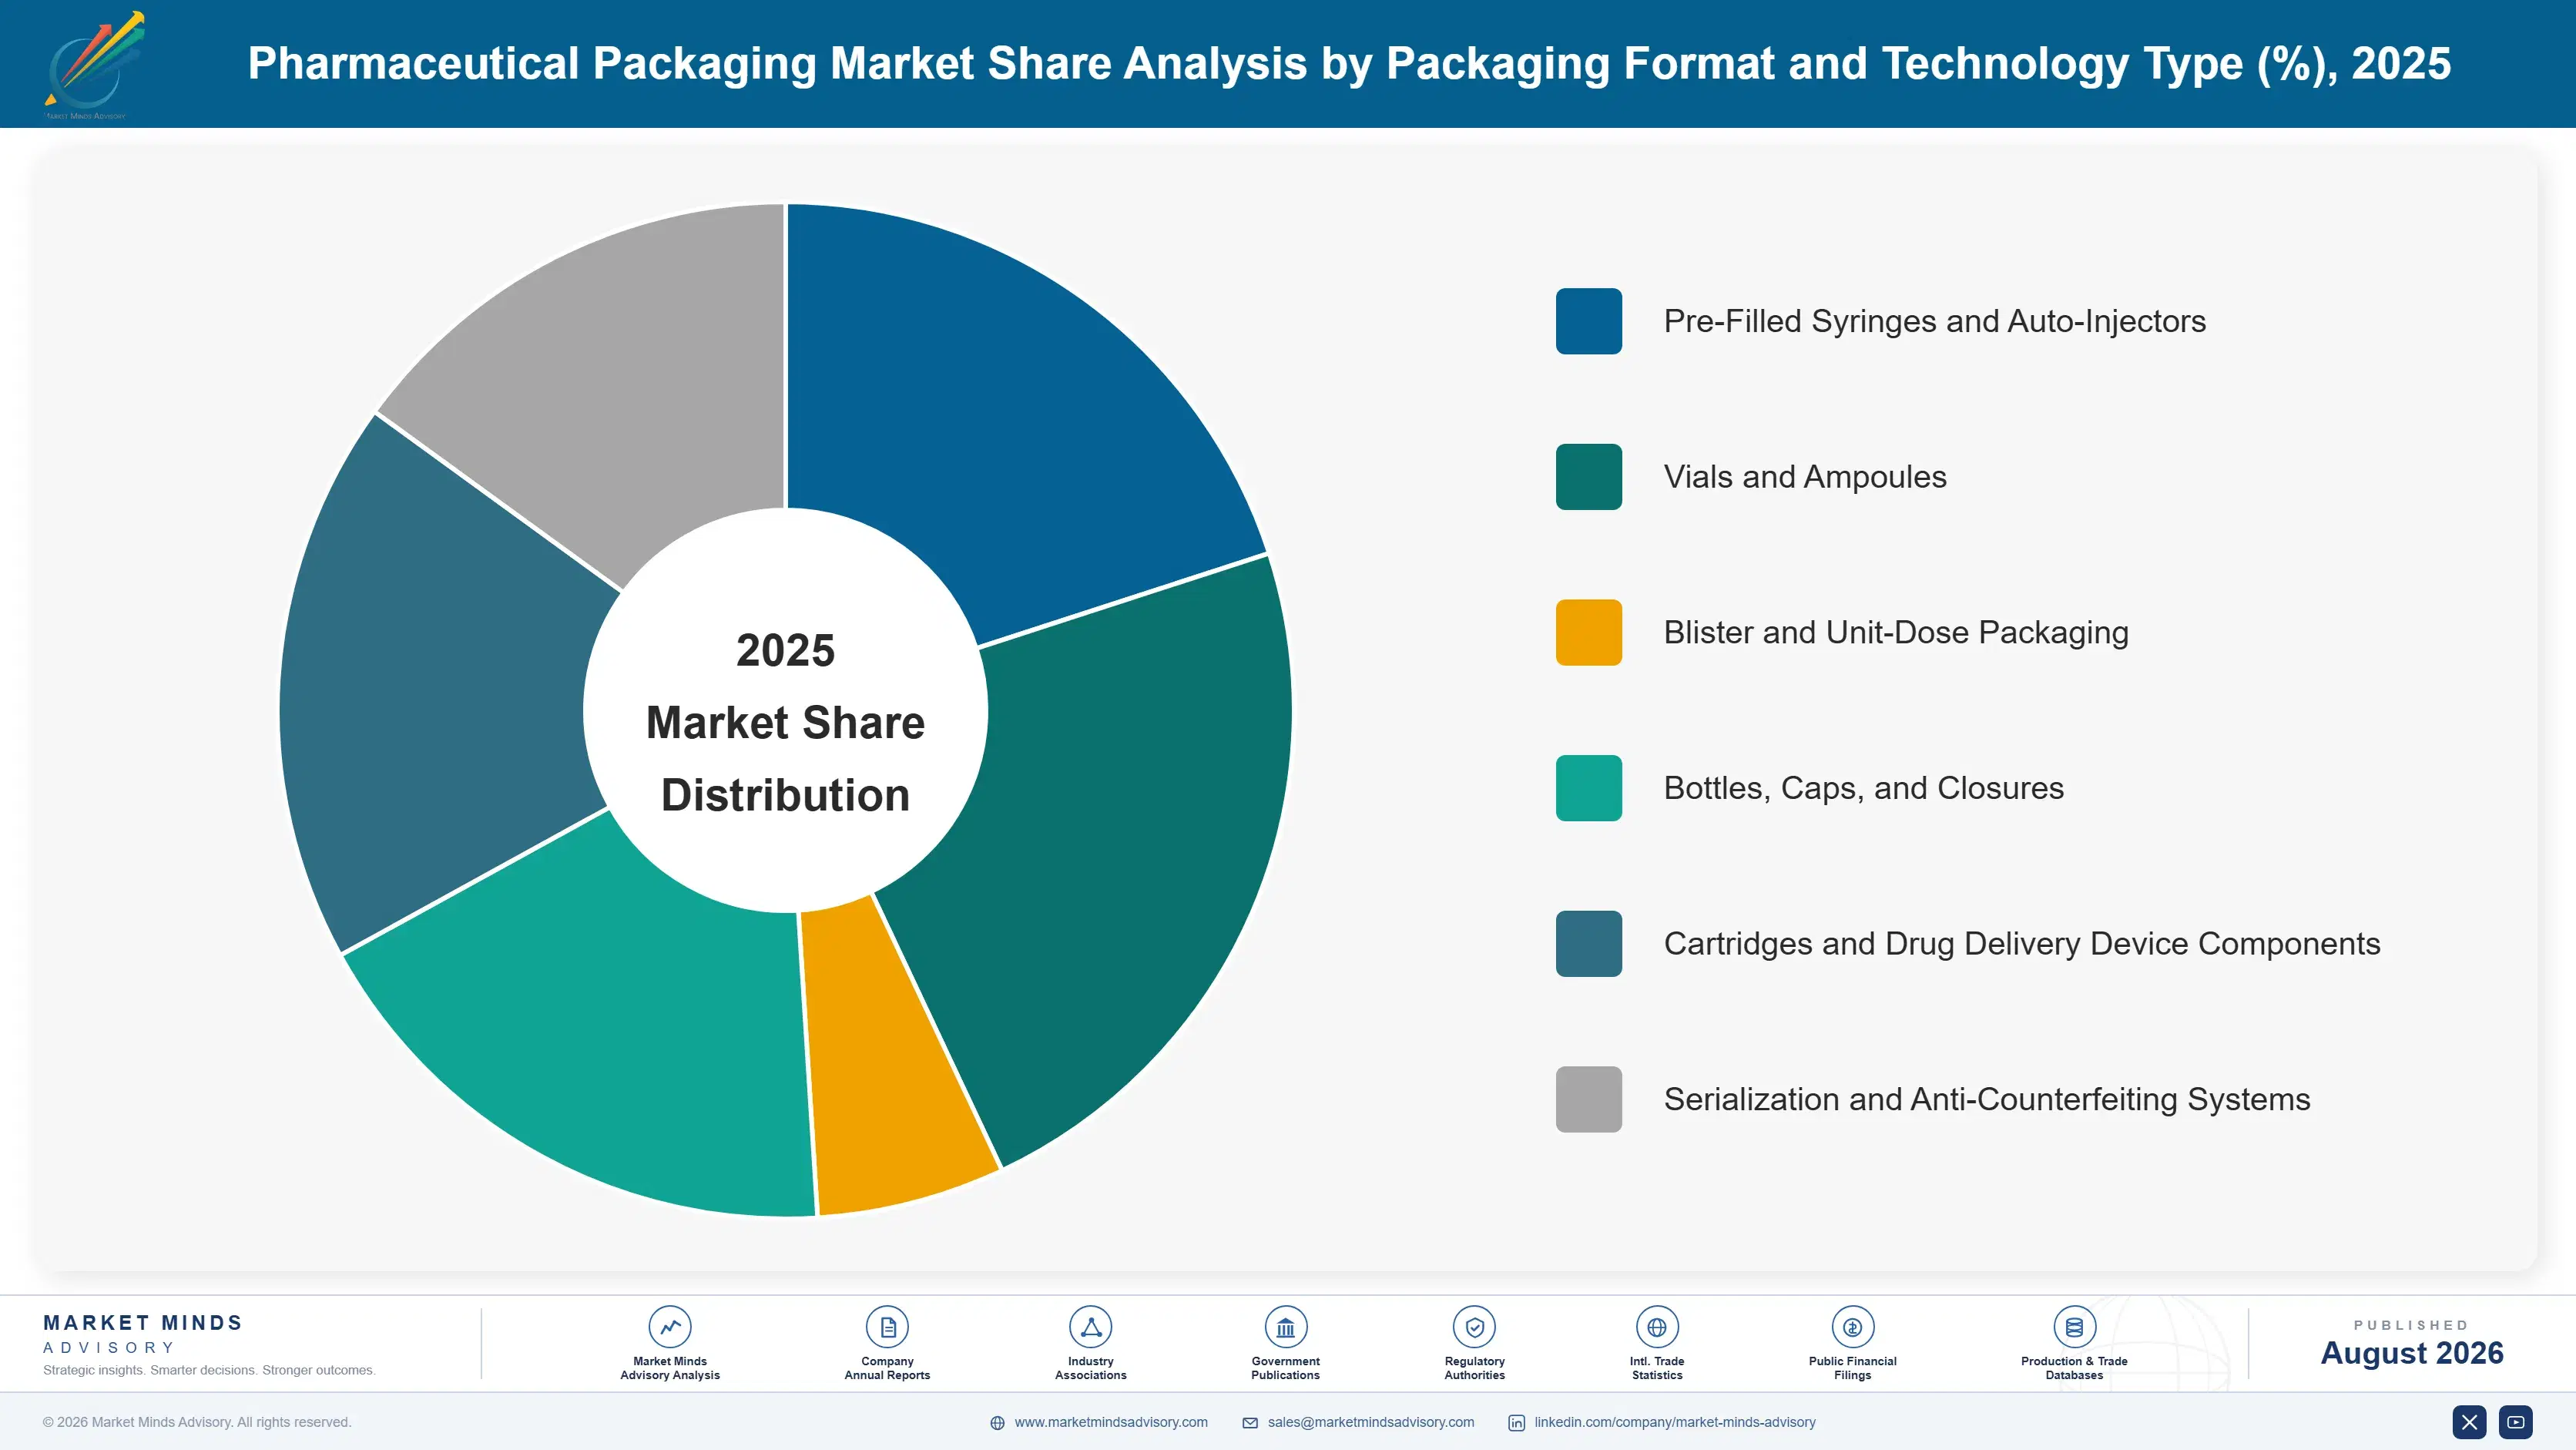
Segmentation follows packaging format and technology type, a single classification logic describing the physical container or delivery system a product specifies from the outset. Material type and end-use therapeutic category sit separately within the framework, since the same glass vial format serves both generic and biologic drug products through different qualification pathways and specification standards.
pharmaceutical-packaging-market-market-share-analysis-1787324397934

Pre-Filled Syringes and Auto-Injectors

Pre-filled syringes and auto-injectors grow fastest at 13.8%, about 1.86 times the overall 7.4% rate, covering ready-to-use injectable delivery systems that eliminate the vial-and-needle preparation traditional injectable drugs required. GLP-1 obesity and diabetes therapies have pulled demand for this format to a scale few suppliers had capacity planned for, since patient self-administration requires the precision, reliability, and ease of use these systems provide over conventional vials. Qualification requires extensive stability and compatibility testing between the drug formulation and the packaging system, creating switching costs that protect established suppliers considerably. West Pharmaceutical Services, Becton Dickinson, and Stevanato Group hold the strongest positions, having invested earliest in precision manufacturing capacity that newer entrants still work to replicate at comparable scale and quality.
CAGR 13.8%

Cartridges and Drug Delivery Device Components

Cartridges and drug delivery device components grow at 11.2%, the second-fastest category, as GLP-1 pen injectors and other reusable delivery devices require precision cartridge components manufactured to exacting tolerances that differ considerably from standalone syringe manufacturing processes used elsewhere. This category serves device manufacturers directly rather than only pharmaceutical companies, creating a distinct customer relationship built around device engineering integration rather than pure drug packaging qualification. Gerresheimer and SCHOTT Pharma hold strong positions here, having built dedicated cartridge manufacturing capability that requires different tooling and quality systems than standard vial or syringe production lines. Growth here tracks pen injector device adoption closely across major GLP-1 and biologics therapeutic categories worldwide.
CAGR 11.2%
Full segment breakdown across 6 segments available in the complete report.

Regional Architecture and Country Demand Map

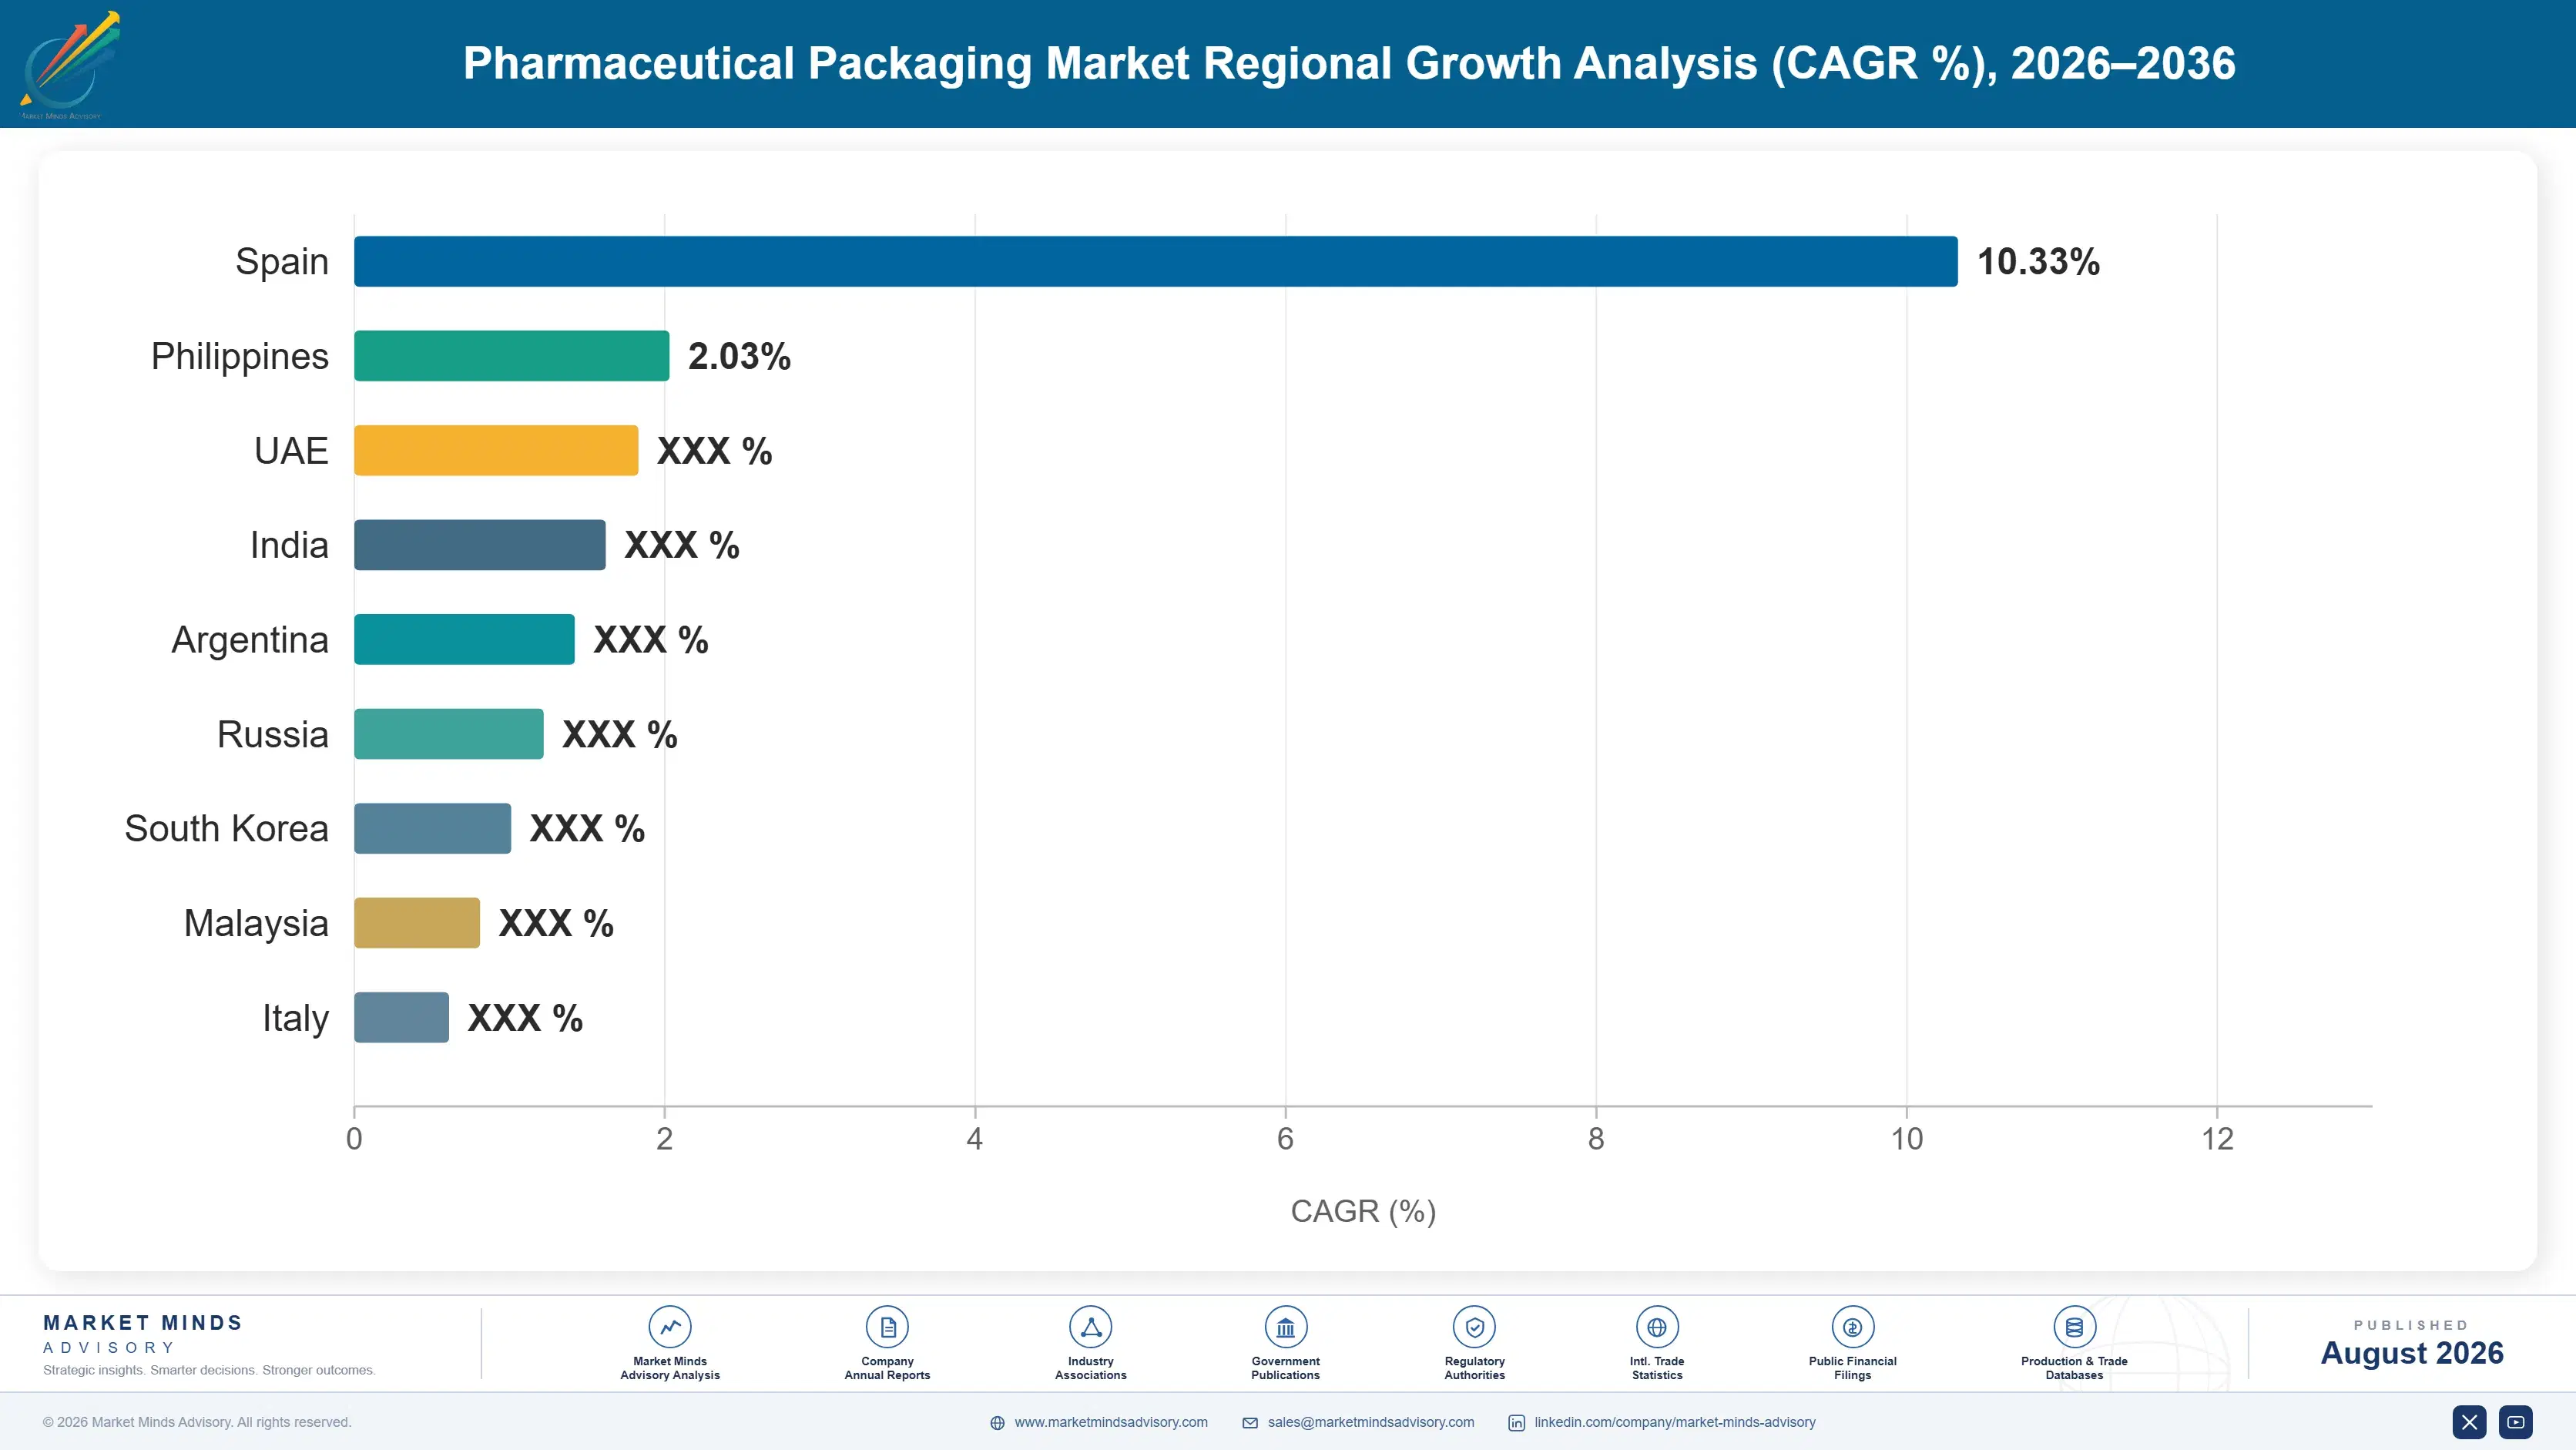
Biologics manufacturing concentration and regulatory stringency together set this overall distribution more than raw pharmaceutical volume alone ever really could. North America leads on biologics and injectable manufacturing scale, while the fastest growth sits in South Asia and Pacific under Indian generic manufacturing expansion specifically.

North America

Biologics and GLP-1 manufacturing concentration defines this 28% share more than any other single factor currently. United States injectable drug manufacturers are driving substantial demand for pre-filled syringes and auto-injectors, with GLP-1 therapy volume pulling packaging demand to a scale few suppliers had planned capacity around even recently. Canadian pharmaceutical manufacturing is smaller but growing steadily, serving both domestic and export markets across North America. Domestic glass and elastomer manufacturing capacity investment is accelerating under both private capital and policy support tied to supply chain resilience goals. Growth of 7.9% reflects injectable packaging demand pulling ahead of the region's already substantial solid-dose base. Domestic capacity investment increasingly determines how quickly this region's injectable pipeline actually converts to completed drug launches.
Share: 28% | CAGR: 7.9% (2026 to 2036)

Western Europe

German glass and elastomer manufacturing depth defines this 26% share more than any other factor. Germany hosts some of the world's most sophisticated pharmaceutical glass forming and elastomer compounding capability, supplying both regional and global injectable packaging demand from established manufacturing clusters. Swiss and French biologics manufacturing adds substantial injectable packaging demand tied to major pharmaceutical company headquarters located in the region. Regulatory stringency under EU serialization requirements has pushed suppliers toward compliance technology investment that smaller competitors struggle to match. Growth of 5.9% is the slowest of the seven, reflecting a mature manufacturing base growing from considerably larger installed capacity than newer-entrant regions carry. Manufacturing capacity, not demand growth, increasingly caps how fast this pipeline expands.
Share: 26% | CAGR: 5.9% (2026 to 2036)
Regional intelligence for 5 additional markets available in the complete report: East Asia, South Asia and Pacific, Latin America, Middle East and Africa, Eastern Europe. Contact sales@marketmindsadvisory.com.
pharmaceutical-packaging-market-country-cagr-analysis-1787324398455

Where Pharmaceutical Packaging Suppliers Capture Value

Competing on standard vial and bottle price alone means competing against commodity packaging that specification increasingly commoditises across nearly every general category and region today. The four moves below shift value toward positions a commodity supplier cannot simply match: injectable capacity reservation, serialization technology integration, device manufacturer relationships, and precision qualification track record built over years.

Sell Long-Term Injectable Capacity Reservation Contracts

Glass tubing and elastomer qualification timelines of 18 to 36 months have made manufacturing capacity itself a strategic asset, and suppliers offering drug manufacturers multi-year capacity reservation contracts capture demand certainty that project-by-project bidding never provides. Drug manufacturers increasingly compete for position in supplier production queues years ahead of commercial launch, which means securing reservation agreements early locks in customer relationships before a drug even completes regulatory approval. This model shifts suppliers from transactional component sales toward planning partnerships considerably harder for capacity-constrained competitors to displace once a launch timeline depends on it.
Market Impact: Qualification of 18 to 36 months re

Build Integrated Serialization Technology Capability Now

Serialization coverage already reaches roughly 91% of major regulated markets, and suppliers with integrated compliance technology capability win specification contests that pure component manufacturers lacking software investment cannot match. Building this capability requires sustained investment in data infrastructure and regulatory tracking across multiple country-specific standards simultaneously, a barrier that favours established suppliers over new entrants. Suppliers should treat serialization technology as a core capability rather than an add-on service, since compliance failures can halt drug shipments entirely regardless of the underlying packaging quality itself, often for weeks at a time.
Market Impact: Serialization now covers 91% of all

Build Direct Device Manufacturer Relationships For Cartridges

Cartridge and drug delivery device components grow at 11.2% as GLP-1 pen injectors and reusable delivery devices require precision components manufactured to device-specific tolerances, and suppliers with direct device manufacturer relationships capture this expansion before component-only competitors can access the same specification decisions. These relationships require device engineering integration capability beyond standard pharmaceutical packaging qualification, favouring suppliers who invested in this capability ahead of the broader device adoption curve. This positioning also insulates revenue from single-drug approval risk, since device platform relationships often span multiple drug products using the same delivery system.
Market Impact: Cartridge components grow 11.2% ver

Document Precision Qualification Track Record Rigorously

Drug manufacturers increasingly select packaging suppliers based on proven qualification track record over unit price alone, since a failed stability or compatibility test costs far more in delayed launch revenue than any price differential a lower-cost, unproven supplier might have offered. Suppliers with strong completed qualification portfolios spanning 18 to 36 months of testing history command premium pricing that new entrants cannot match regardless of their cost structure, because the perceived qualification risk of an unproven supplier outweighs typical price advantages in decision-making. Companies should document and market qualification performance data as aggressively as they market component specifications.
Market Impact: Qualification failures cost 6 to 12

Who Controls the Margin Pool

Concentration sits at a moderate CR5 of 44%, with West Pharmaceutical Services, Gerresheimer, SCHOTT Pharma, Stevanato Group, and Becton Dickinson holding leading positions built on decades of glass forming and elastomer expertise. The gap between leaders and challengers rests on qualification track record and manufacturing capacity rather than component design alone. Participants are assessed on one basis, annual revenue from pharmaceutical packaging components and directly attached serializati
Competition runs along three dimensions. First, injectable-grade manufacturing capacity, the binding constraint that increasingly decides which suppliers can accept new drug manufacturer commitments. Second, serialization technology integration, particularly for suppliers serving markets with the most stringent compliance requirements. Third, device manufacturer relationships, particularly as GLP-1 pen injector and auto-injector adoption continues expanding across therapeutic categories.

Pressure is building from Indian and Chinese manufacturers gaining credibility in solid-dose and increasingly injectable packaging, narrowing a quality gap that established Western suppliers assumed would persist much longer. Meanwhile specialist device component manufacturers are capturing share from general-purpose packaging suppliers lacking precision cartridge manufacturing investment. Rankings should favour suppliers with proven injectable capacity and integrated serialization capability over those competing purely on standard component price.
pharmaceutical-packaging-market-company-positioning-matrix-1787324398976

Competitive Moat and Risk Dimensions

WEST PHARMACEUTICAL SERVICES

Moat: Elastomer formulation depth and scale

West Pharmaceutical Services holds the deepest elastomer formulation expertise in the industry, built across decades of injectable packaging relationships that competitors cannot shortcut quickly. Its focused injectable and biologics packaging portfolio lets it invest disproportionately in precision manufacturing capability. Early investment in GLP-1-driven capacity expansion positioned it ahead of competitors still responding to demand that had already materialised.
WEST PHARMACEUTICAL SERVICES

Risk: Capacity constraints limit near-term growth

Even West's substantial capacity expansion has not fully closed the gap between GLP-1 demand and available manufacturing slots, capping near-term revenue growth regardless of order book strength. Chinese and Indian manufacturers are narrowing the quality gap faster than expected in less demanding applications. Its concentration in elastomer and injectable packaging leaves it less diversified than broader competitors across solid-dose categories.
GERRESHEIMER

Moat: Glass forming breadth and reach

Gerresheimer combines deep glass forming expertise across vials, syringes, and cartridges into a broad injectable packaging portfolio that few competitors match in combined breadth. Its established relationships with major pharmaceutical and device manufacturers span decades of qualification history across multiple product categories. Manufacturing presence across multiple regions supports faster qualification and delivery for global drug launches.
GERRESHEIMER

Risk: Capital intensity strains expansion pace

Glass forming capacity expansion requires substantial capital with multi-year commissioning timelines, limiting how quickly Gerresheimer can respond to demand surges compared with more nimble specialist competitors. Currency and energy cost exposure on European manufacturing adds margin volatility some competitors avoid more easily. Specialist cartridge manufacturers are winning some device-specific contracts where narrower technical focus matters more than broad portfolio breadth.

Players Tracked

Prominent Players

West Pharmaceutical Services
Gerresheimer
SCHOTT Pharma
Stevanato Group
Becton Dickinson

Other Key Players

Amcor
AptarGroup
Corning
Berry Global
CCL Industries
Nipro Corporation
Datwyler Holding
SGD Pharma
Origin Pharma Packaging
Constantia Flexibles
Catalent
Piramal Glass
Schreiner MediPharm
Kloeckner Pentaplast
Sonoco Products

Recent Developments

JANUARY 2025

West Pharmaceutical Services expands elastomer component capacity

West Pharmaceutical Services announced a capacity expansion at an existing facility dedicated to elastomer component production, aiming to meet GLP-1 and biologics injectable demand that had outrun prior planning assumptions. This was an organic expansion rather than an acquisition or joint venture, adding lines qualified for injectable-grade elastomer manufacturing specifically.
Signal: Suppliers are sizing capacity investment a
SEPTEMBER 2024

SCHOTT Pharma completes acquisition of cartridge component manufacturer

SCHOTT Pharma completed the acquisition of a specialist manufacturer of precision cartridge components for pen injector devices, adding manufacturing capability the company had previously sourced through third-party suppliers. This was a full acquisition bringing manufacturing and design capability directly in-house, not a licensing arrangement with the target company.
Signal: Bringing cartridge manufacturing in-house
MAY 2025

Stevanato Group signs multi-year supply agreement with biologics manufacturer

Stevanato Group signed a multi-year supply agreement with a major biologics manufacturer to reserve pre-filled syringe manufacturing capacity across an expanding portfolio of injectable drug products. This was a capacity reservation supply agreement rather than an equity stake or acquisition, formalising priority production allocation in exchange for committed volume.
Signal: Reservation agreements are becoming the st

Borosilicate Glass, Elastomer, And Precision Manufacturing

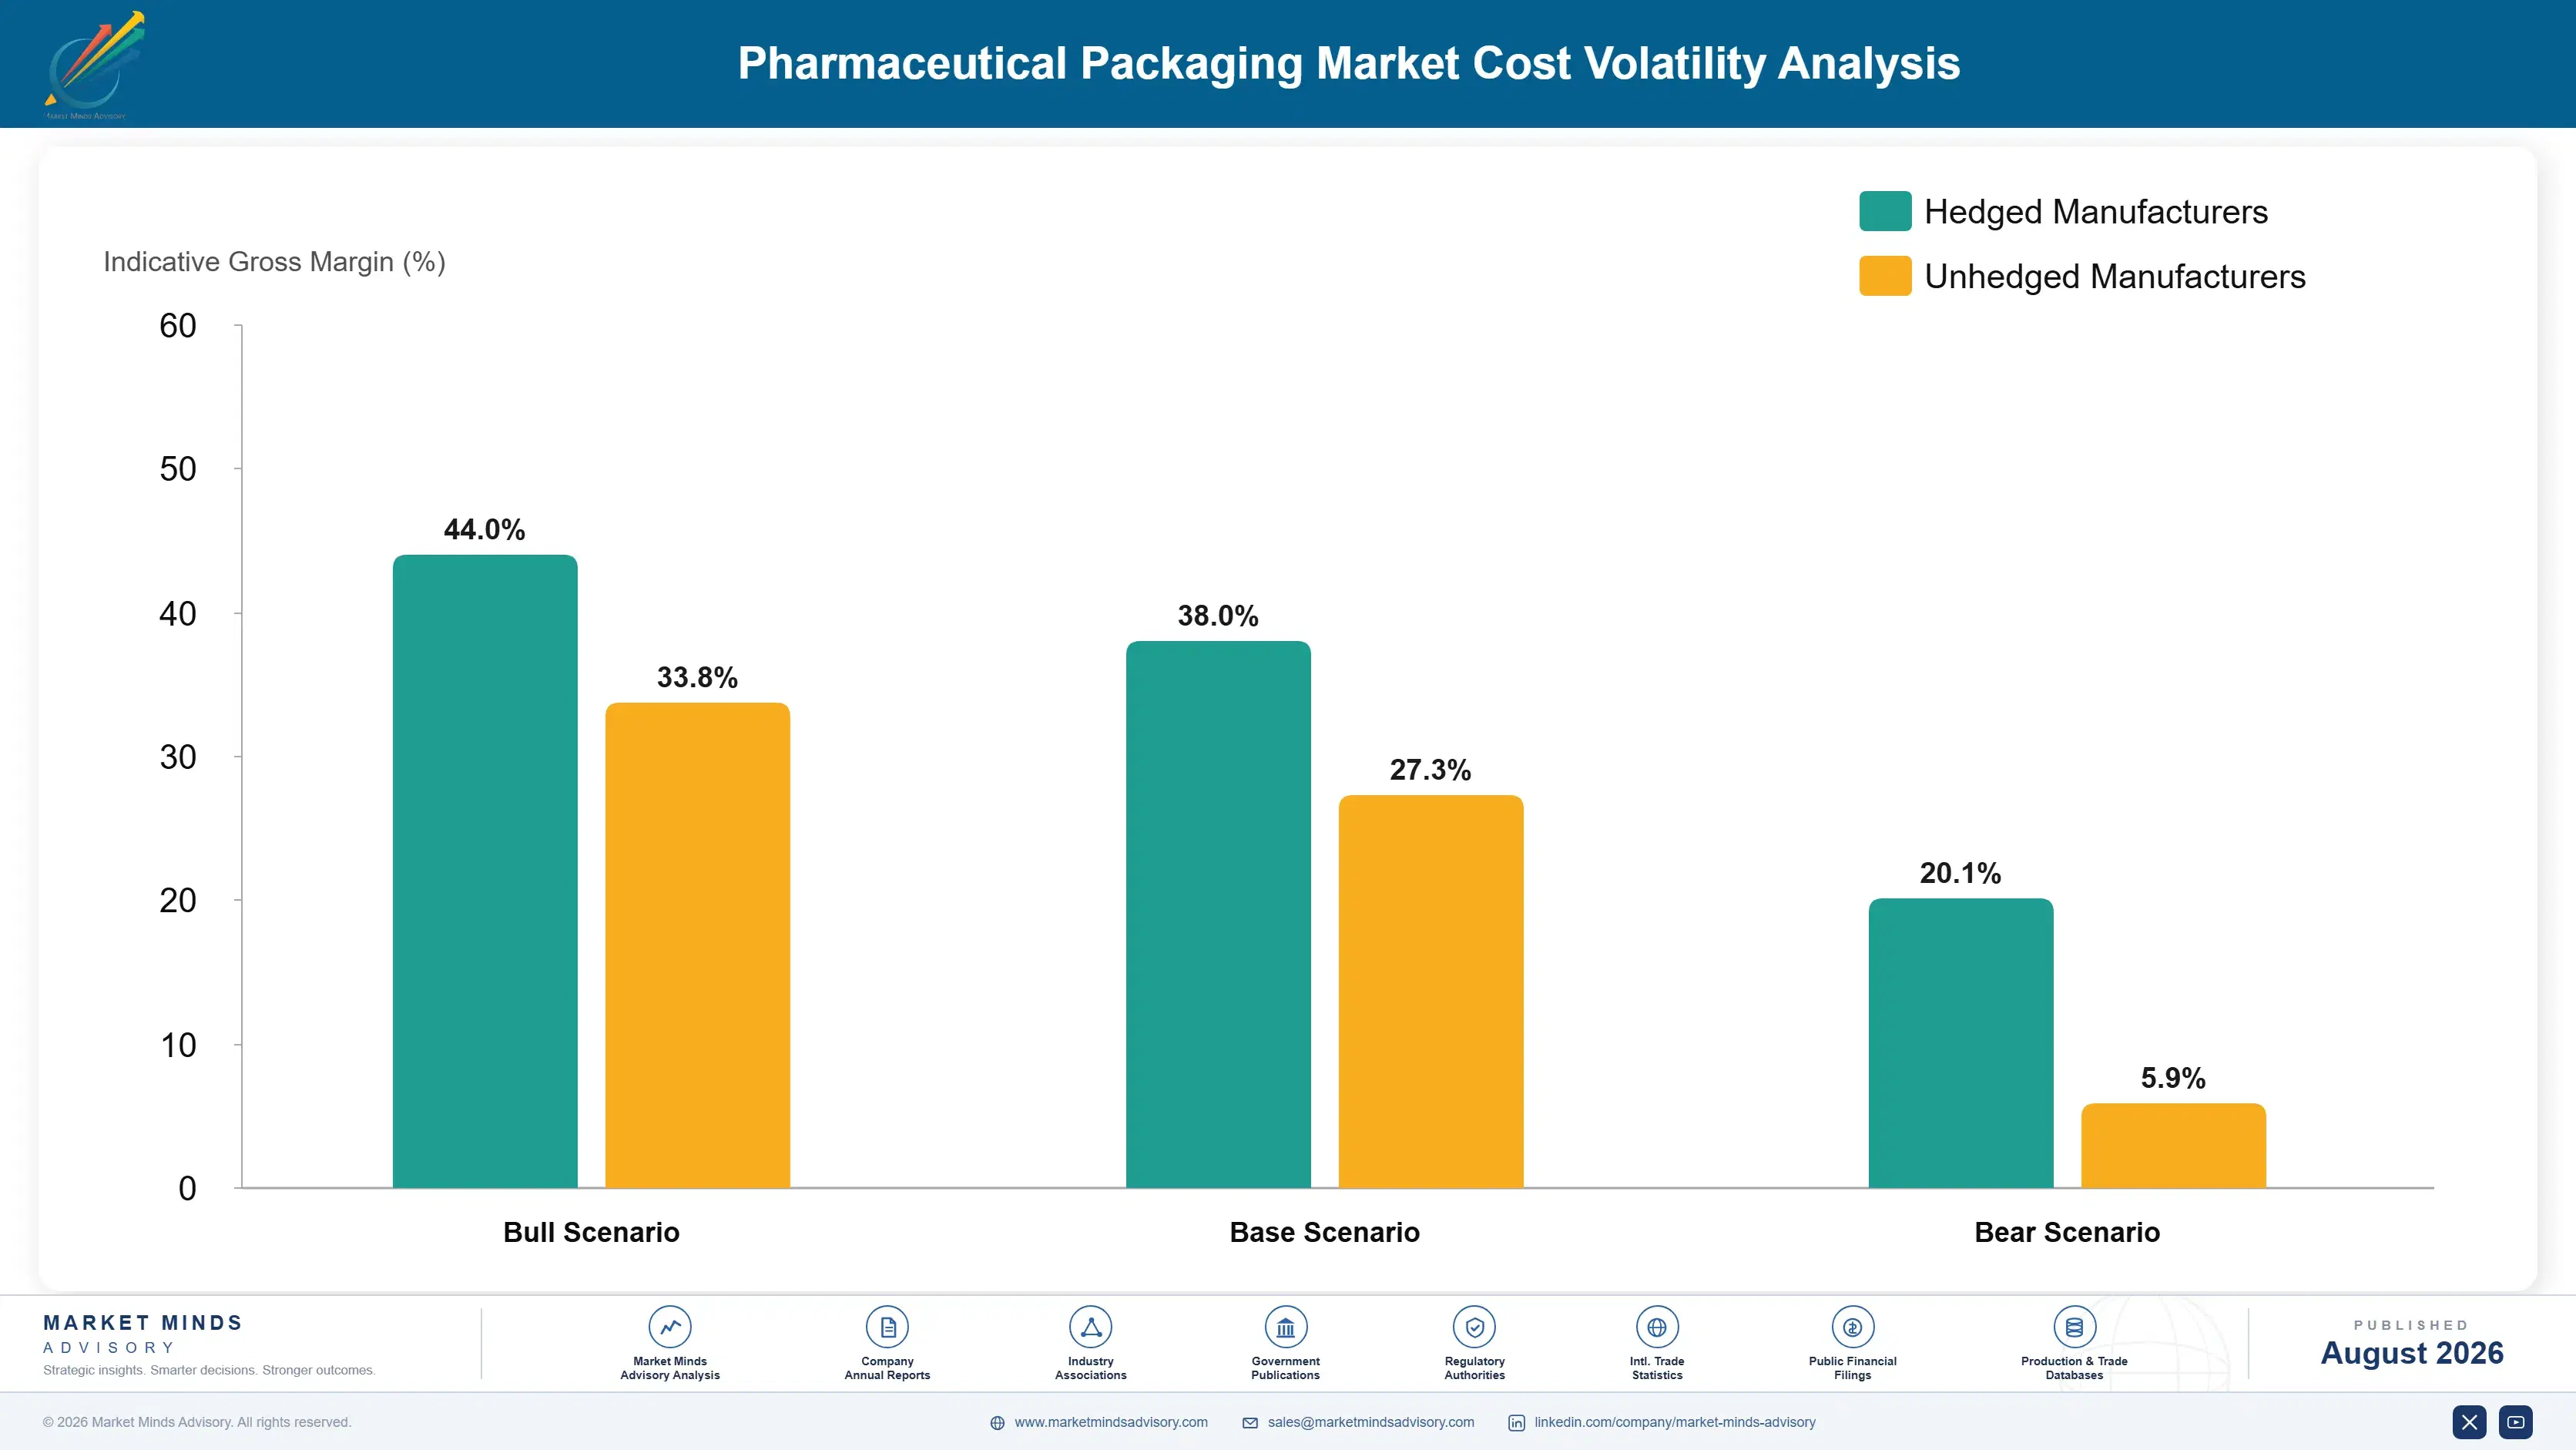
Borosilicate glass and elastomer materials dominate cost in this category. Glass tubing and forming costs account for roughly 30% to 42% of cost of goods sold for injectable packaging specifically, reflecting the precision manufacturing these components require. Elastomer compounding and closure materials add a further 18% to 26%, while quality control and serialization technology account for 12% to 18% and rising as compliance requirements tighten further.
Borosilicate glass supply concentration has been the sharpest recent pressure. Production disruption at a small number of specialty glass tubing facilities constrained downstream component output across multiple packaging suppliers simultaneously through parts of 2022 and 2023, according to industry reporting referenced in pharmaceutical supply chain assessments. Suppliers without backward integration or diversified glass sourcing absorbed meaningful margin and delivery pressure during that period that better-positioned competitors avoided.

Exposure separates by vertical integration and customer mix. A supplier dependent on external glass tubing supply faces availability risk that a backward-integrated competitor simply does not carry, while one serving primarily injectable and biologics customers can pass through cost increases more readily than one competing in price-sensitive generic applications. Suppliers with diversified glass and elastomer sourcing weather disruption considerably better than narrowly sourced specialists.
pharmaceutical-packaging-market-cost-volatility-analysis-1787324399171

Pursue backward integration into glass tubing production

External glass tubing dependence exposes suppliers to availability and price risk they cannot fully control during disruption at concentrated facilities. Backward integration requires substantial capital and only justifies itself at meaningful production scale, which is why relatively few suppliers have pursued it. Those that have hold a genuine cost and reliability advantage through disruptions that periodically affect this industry.

Diversify elastomer and glass sourcing across regions

Relying on a narrow glass or elastomer supplier base concentrates both price and availability risk exactly when injectable demand is strongest and supply tightest. Qualifying multiple suppliers across regions preserves negotiating leverage and supply continuity during disruption. Suppliers that started diversifying sourcing early now hold a genuine advantage over competitors still narrowly sourced to a single facility.

Prioritise injectable and biologics customers during volatility

Customers requiring extensive qualification, injectable and biologics manufacturers specifically, accept price increases more readily than generic solid-dose customers because switching suppliers carries requalification cost and delay outweighing any short-term savings. Suppliers should weight commercial strategy toward these customers during volatility, since pricing power concentrates where switching cost is highest and buyer patience is lowest.

Portfolio Architecture for Margin Defence

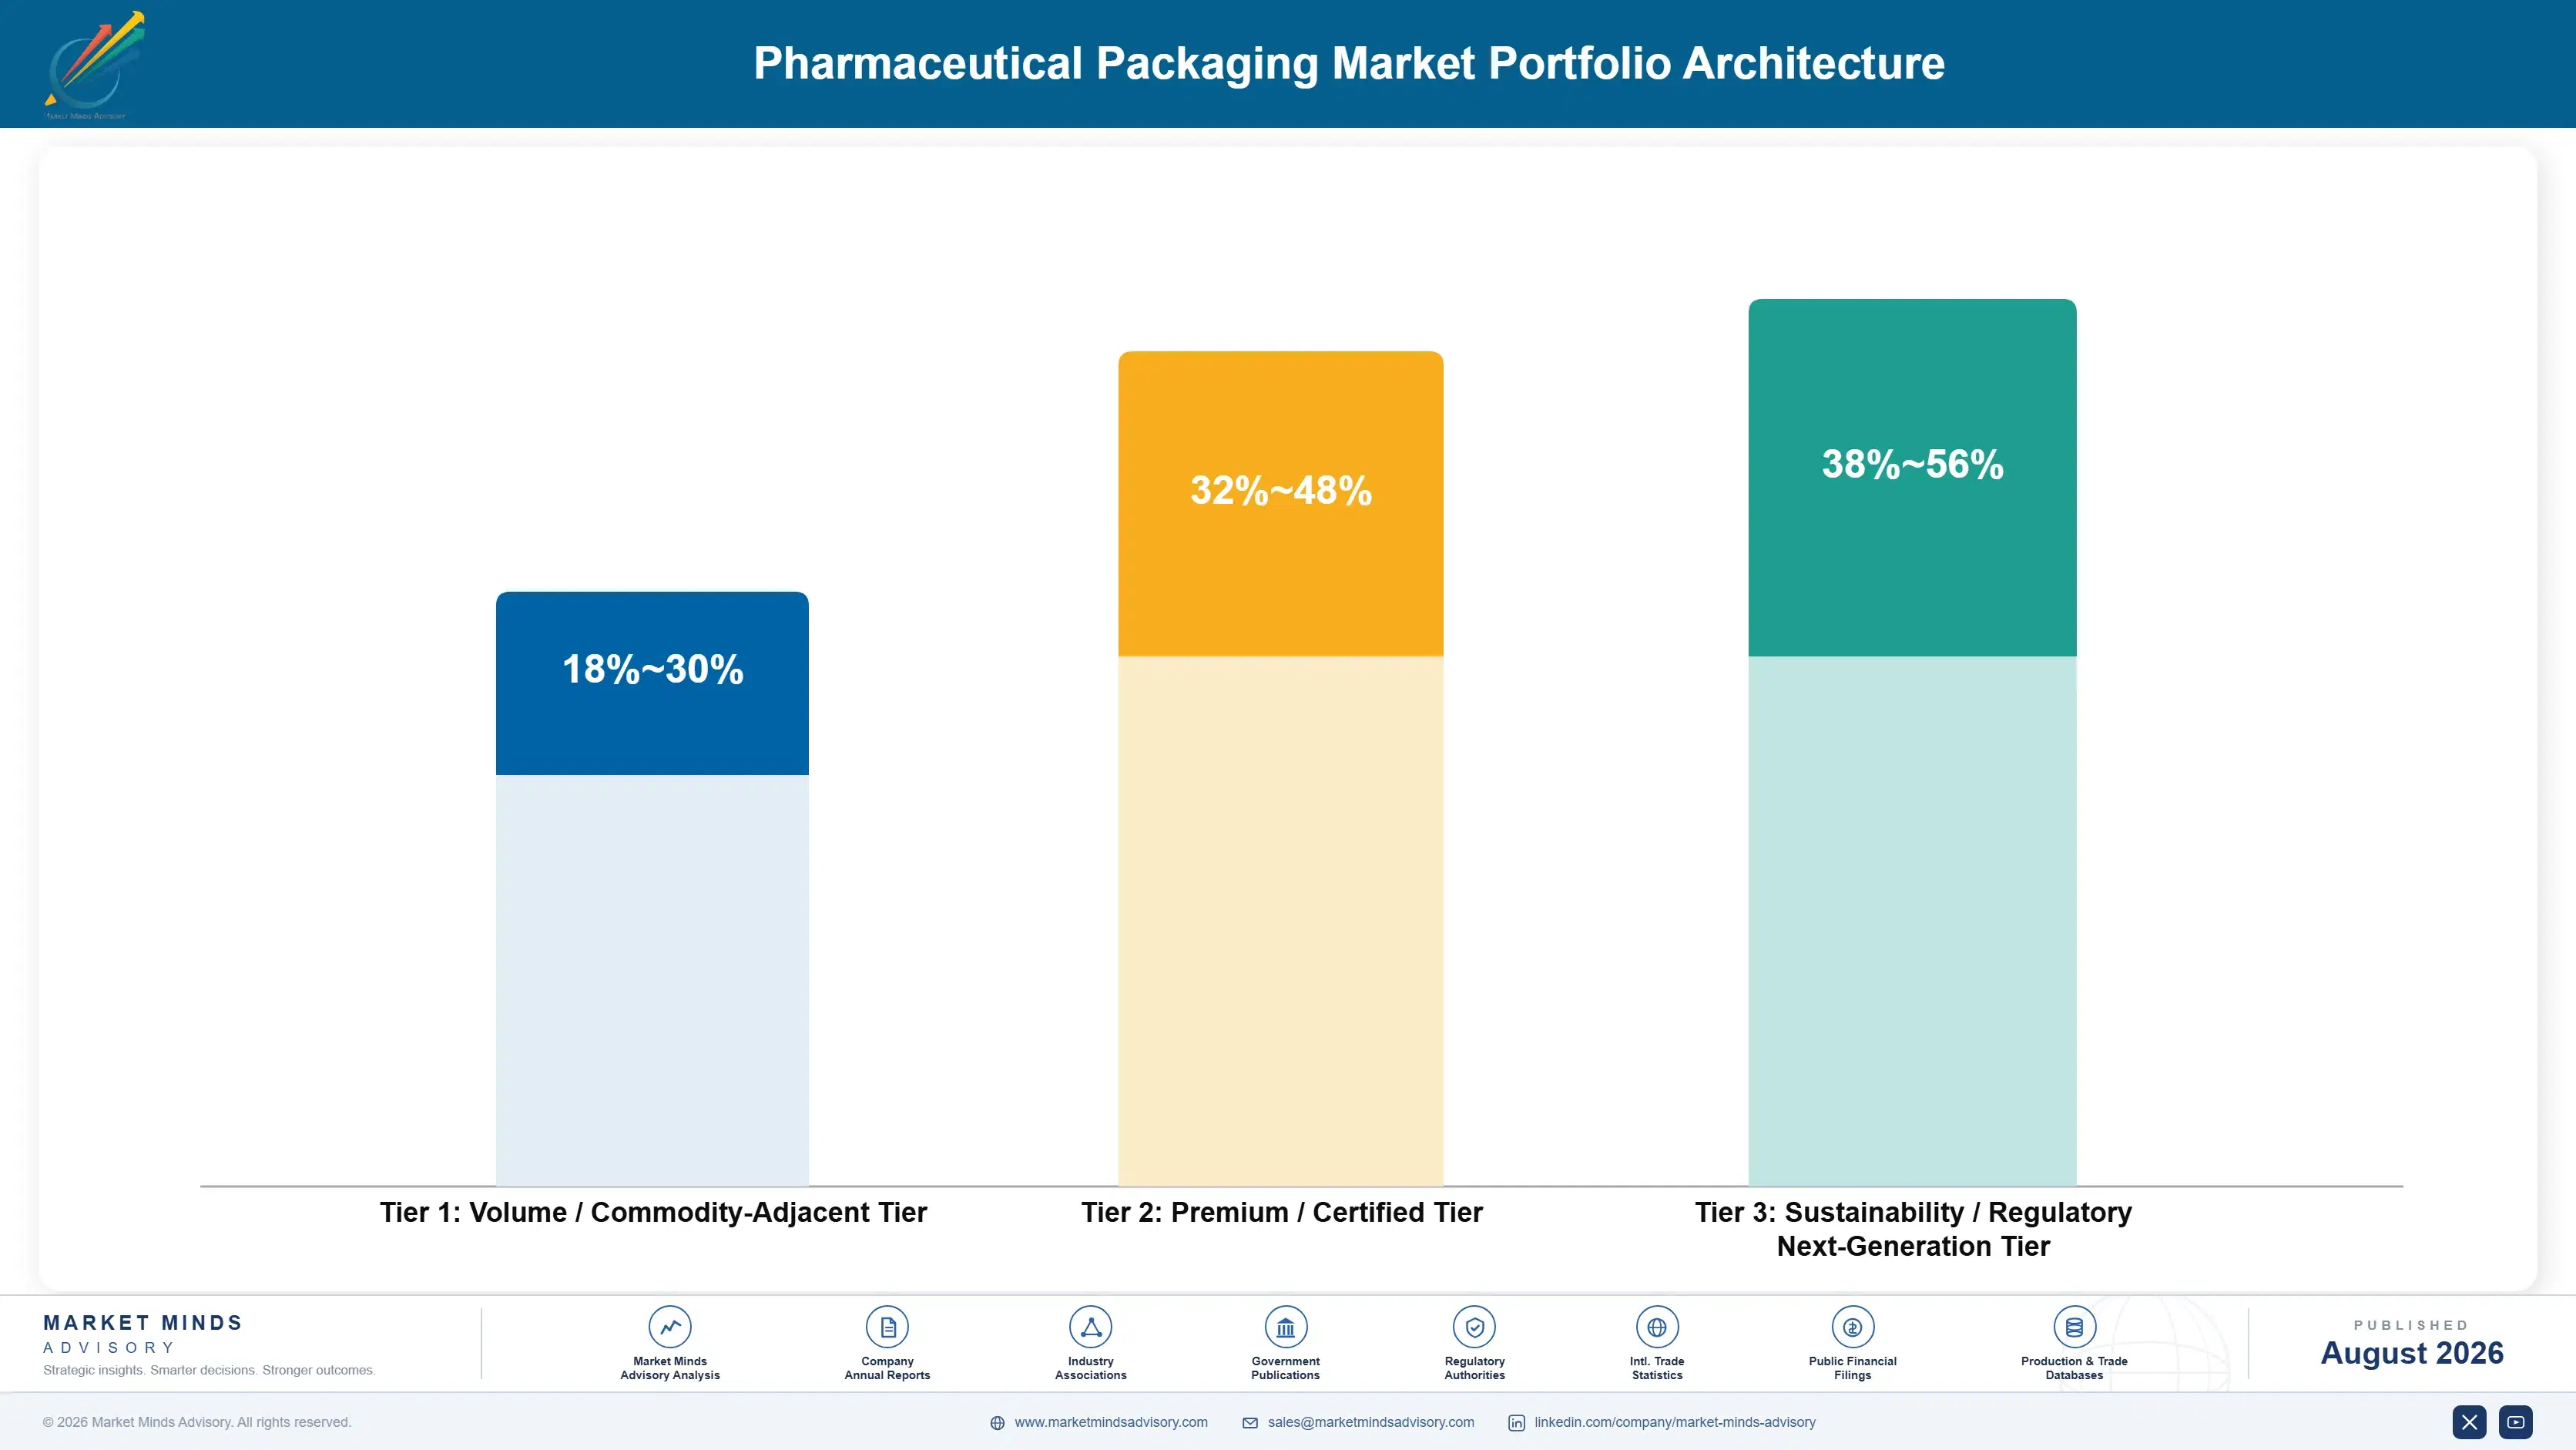
The portfolio splits into three tiers with distinct economics. Standard solid-dose packaging including bottles and blister formats forms the volume tier, competing on price against a widening field of suppliers including Indian and Chinese manufacturers. Injectable-grade vials, syringes, and elastomer components earn considerably more, since manufacturing precision and qualification barriers both resist commoditisation. Auto-injectors, cartridges, and serialization systems sit differently again,
The tension runs between defending solid-dose packaging volume, which still funds much of the business today for several major suppliers, and investing in injectable and device component capability that increasingly drives growth. Suppliers over-indexed on solid-dose risk missing the injectable transition that has already reshaped where capital flows industry-wide. Yet building injectable-grade manufacturing capacity requires sustained investment that margins alone do not always fund.

High-value pools concentrate where manufacturing precision, qualification barriers, or technology integration limit competition: pre-filled syringe and auto-injector capacity reserved under long-term contract, cartridge components serving GLP-1 pen injector platforms, and serialization systems bundled with compliance technology support. All three resist price competition that standard solid-dose packaging increasingly faces from a widening field. Commodity-adjacent bottles and closures sold on price alone sit at the other end.

Volume / Commodity-Adjacent Tier

Standard bottles, closures, and blister packaging sold largely on price against a widening field of qualified suppliers including increasingly capable Indian and Chinese manufacturers competing closely on cost and delivery speed.
Gross Margin: 18-30%

Premium / Certified Tier

Injectable-grade vials, pre-filled syringes, and elastomer components with proven qualification track records, where manufacturing precision and stability data command sustained pricing power over unqualified alternatives that simply cannot compete at all.
Gross Margin: 32-48%

Sustainability / Regulatory / Next-Generation Tier

Auto-injectors, GLP-1 pen cartridges, and integrated serialization systems sold with demonstrated device compatibility and bundled compliance technology support that competitors have not yet fully replicated at comparable scale industry-wide today.
Gross Margin: 38-56%
pharmaceutical-packaging-market-portfolio-architecture-1787324399665

High-value Sub-segments and Strategic Watch-out

Pre-Filled Syringes and Auto-Injectors

High value and high growth at 13.8%, the fastest category, as GLP-1 and biologics manufacturers specify self-administration formats over vial-and-needle delivery across most major markets worldwide today still now. Injectable manufacturing capacity, not drug demand, is now the binding growth constraint across most major markets.
Gross Margin: 34-52%

Cartridges and Drug Delivery Device Components

High value with strong growth at 11.2% as GLP-1 pen injectors and reusable delivery devices require precision components manufactured to device-specific tolerances across most producing regions worldwide today still now consistently overall universally. Growth tracks pen injector device adoption closely across major therapeutic categories worldwide.
Gross Margin: 36-54%

Vials and Ampoules

The volume core by revenue, growing moderately as both generic and biologics manufacturing continue expanding steadily while pre-filled formats increasingly capture new specification budget allocation across most regions worldwide today still now overall universally. Competition on price is most intense in this established category worldwide.
Gross Margin: 24-38%

Blister and Unit-Dose Packaging

The strategic watch-out, growing slowest as injectable and device-based delivery formats increasingly capture specification budget that solid-dose packaging would otherwise have received across most regions worldwide today still. Standard blister demand remains steady but persistently slower than injectable categories overall currently and consistently now universally.
Gross Margin: 20-32%

How Qualification Relationships Actually Persist

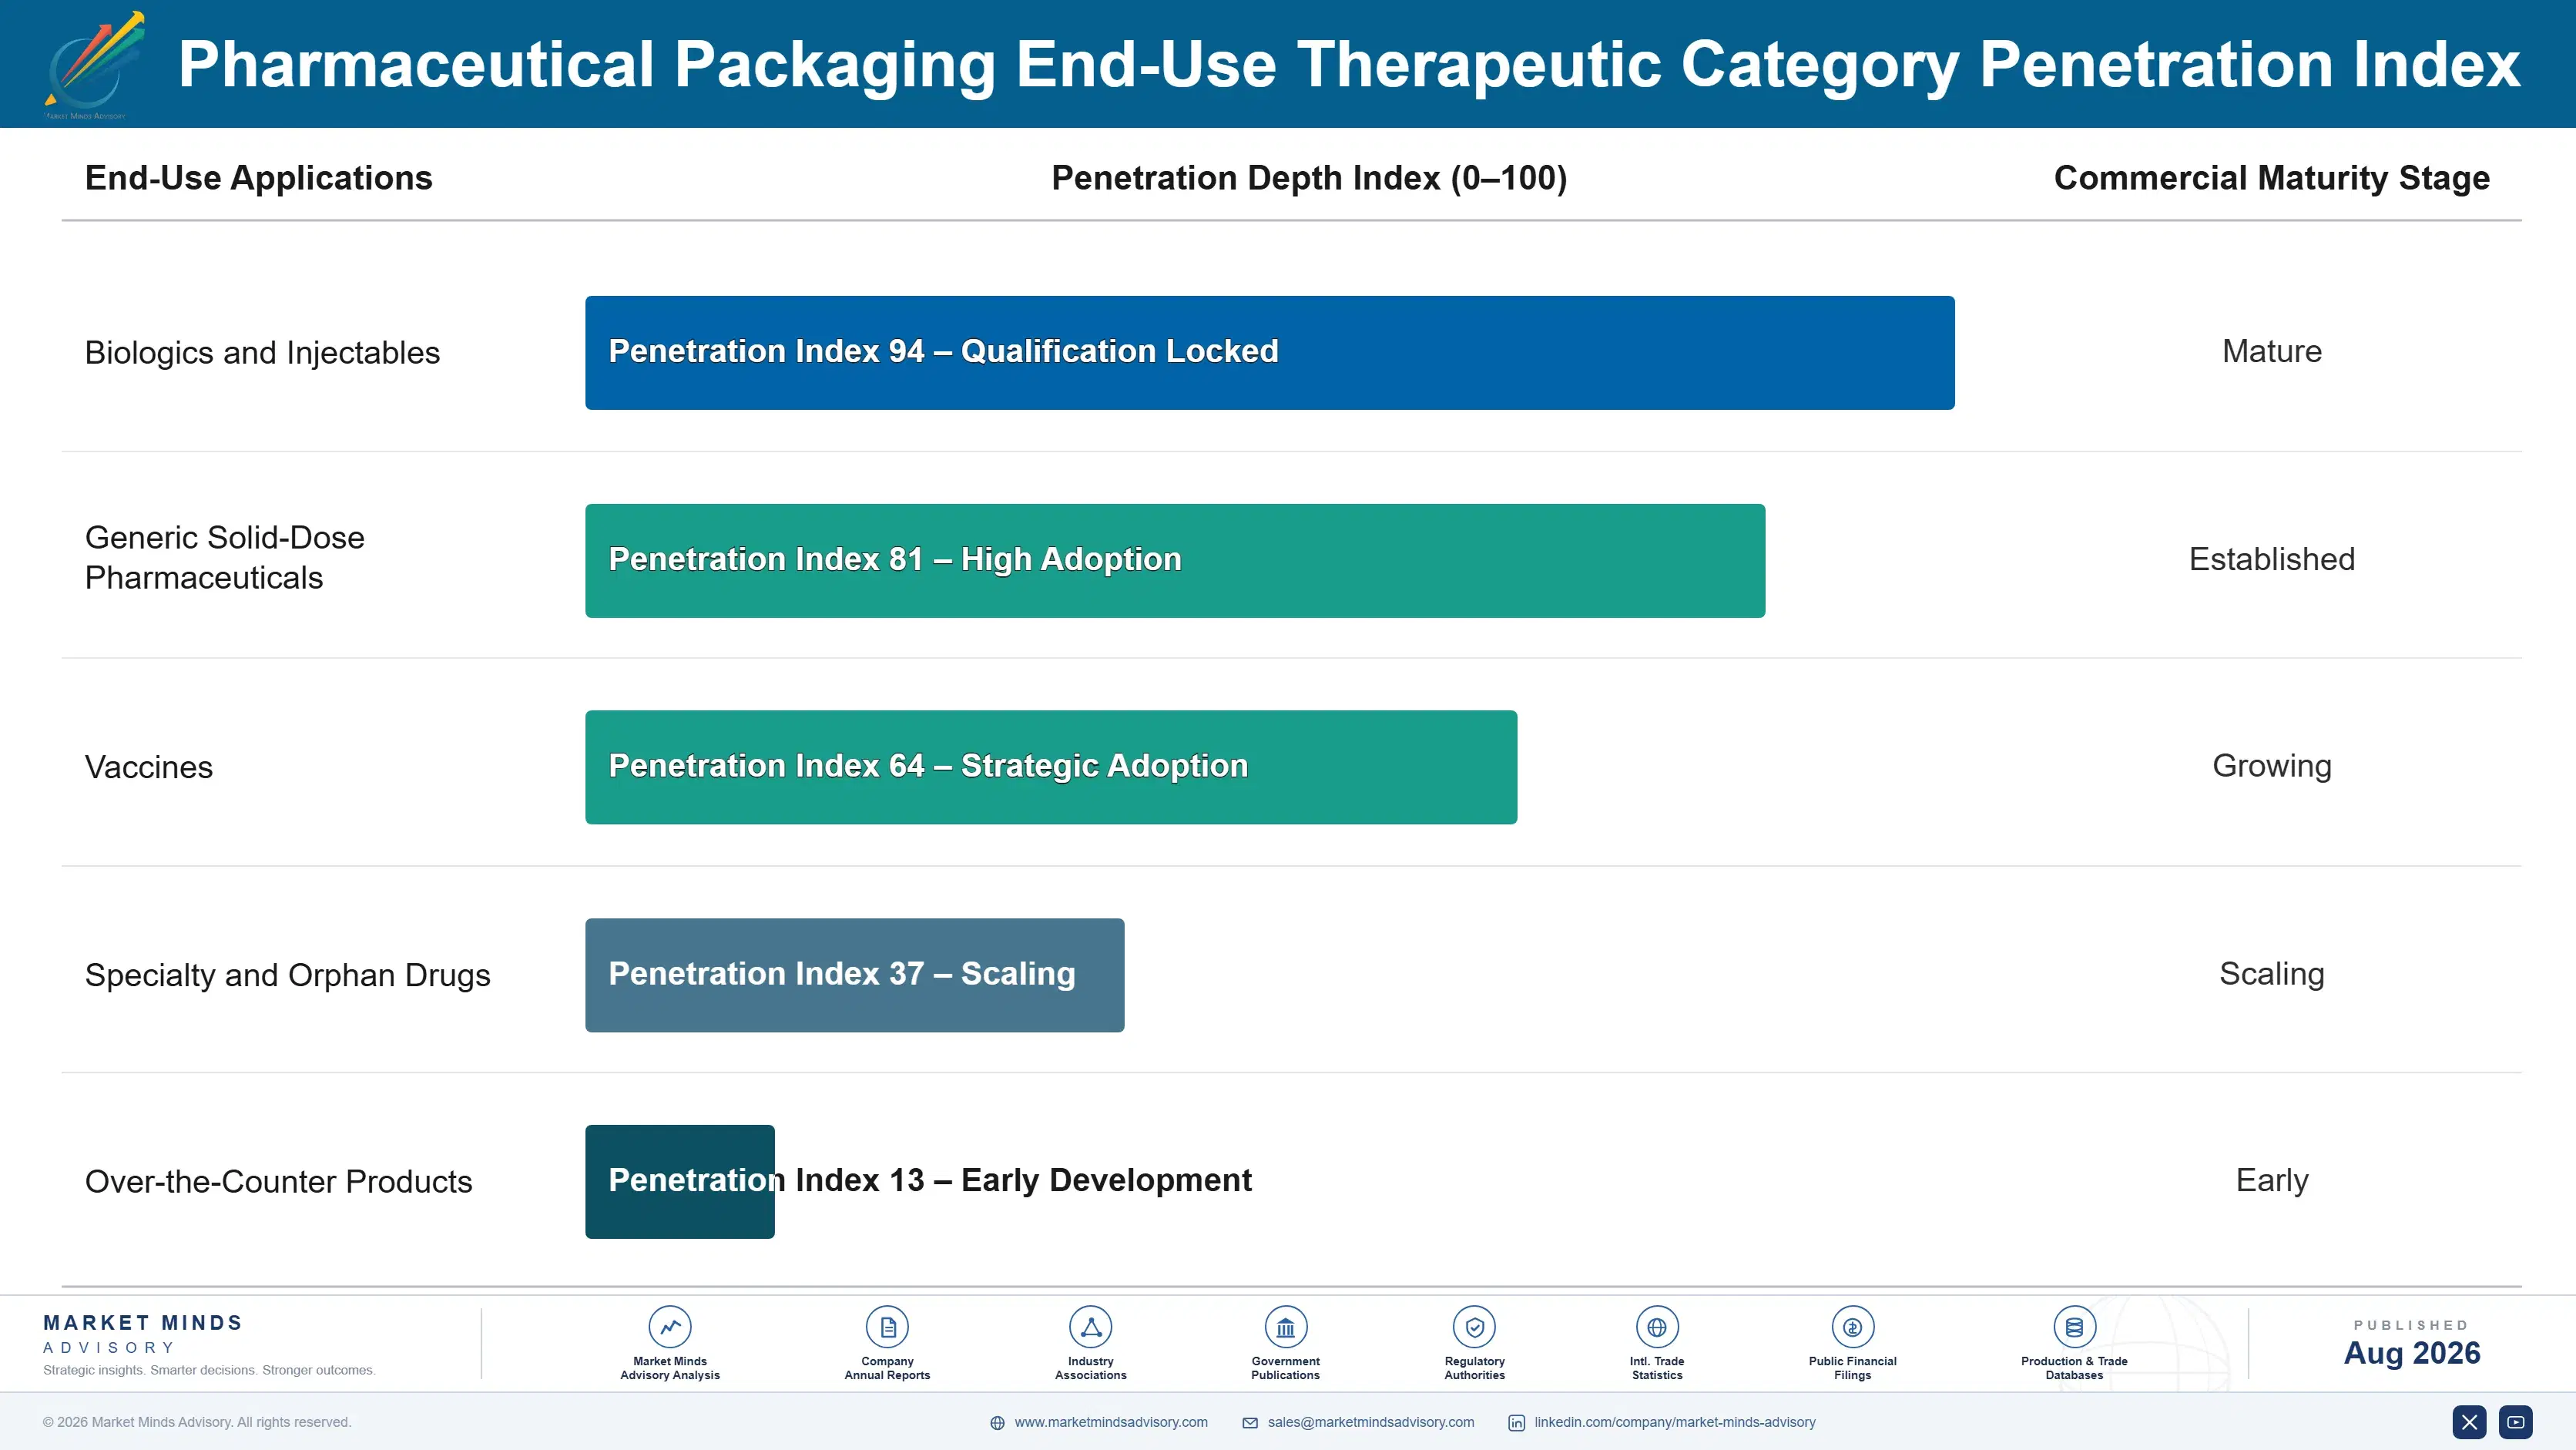
Revenue depends on qualification relationships persisting across a drug product's commercial life, and once a manufacturer qualifies a packaging supplier's component through stability testing, switching suppliers mid-programme requires costly requalification that protects the incumbent for years. Injectable and device component contracts, once qualified, generate recurring volume across the full commercial life rather than one-time purchases. A small number of large pharmaceutical and biologics
Adoption depth varies sharply by application. Injectable and biologics manufacturing adopt deepest, since qualification requirements are strictest and switching cost highest once a component is validated for a specific formulation. Generic and CDMO manufacturing adopts steadily, driven by cost and reliable supply rather than technical differentiation. Solid-dose applications adopt most price-sensitively, with decisions often made primarily on cost.

Buyer profiles have shifted from procurement managers focused on unit price toward quality and regulatory affairs teams who evaluate suppliers against documented stability data and multi-year supply reliability. Procurement increasingly runs years ahead of commercial launch to secure injectable-grade manufacturing slots, a planning horizon solid-dose procurement never required. Younger pharmaceutical development teams also treat serialization and device compatibility as default requirements rather than exceptions.
pharmaceutical-packaging-market-end-use-penetration-index-1787324400172

Our Call On Pharmaceutical Packaging

These are among the four positions where our research anticipates prominent divergence between winners and laggards over the coming forecast period. Each is grounded in the demand model, the regulatory perimeter, and the announced capacity pipeline.
01 / INJECTABLE SETS THE PACE

GLP-1 demand decides growth more than solid-dose volume

Injectable packaging already accounts for roughly 32% of total revenue, a share that has grown considerably faster than solid-dose demand as GLP-1 and biologics therapies pull volume that few suppliers had capacity planned for even three years ago. Suppliers that invested early in injectable-grade manufacturing capacity are capturing qualification relationships years before competitors organised around solid-dose assumptions can respond. Companies should size capacity investment around injectable demand curves specifically now, because waiting for that demand to become obvious guarantees arriving after the qualification window has already closed.
02 / CAPACITY BEATS SPOT ORDERS

Early booking now matters more than component price

Glass tubing and elastomer qualification timelines of 18 to 36 months have made manufacturing capacity itself a strategic asset, and drug manufacturers increasingly book production slots years ahead of commercial launch to secure delivery timing. This is a genuine capacity bottleneck rather than a temporary shortage, since qualified precision manufacturing cannot expand as quickly as demand has grown across multiple regions. Suppliers and manufacturers should treat capacity as a strategic asset worth securing years ahead of need, since the queue decides launch dates more than price.
03 / SERIALIZATION AS CORE CAPABILITY

Compliance technology now decides specification more than price

Serialization coverage already reaches roughly 91% of major regulated markets, and suppliers with integrated compliance technology capability are winning specification contests that pure component manufacturers lacking software investment cannot match. This dynamic favours suppliers who treated serialization as a core capability years before it became mandatory across most major markets currently in force. Companies without comparable technology investment should build it now, because compliance failures can halt drug shipments entirely regardless of how well-manufactured the underlying packaging component actually is.
04 / DEVICE RELATIONSHIPS COMPOUND VALUE

Cartridge manufacturers should court device platforms directly

Cartridge and drug delivery device components grow at 11.2% against an overall market at 7.4%, because GLP-1 pen injectors and reusable delivery devices require precision components that only suppliers with device engineering integration capability can reliably provide. Suppliers with direct device manufacturer relationships are capturing this expansion before component-only competitors can access the same specification decisions being made across the industry right now. Companies should prioritise device platform relationships over single-drug packaging contracts, since platform relationships often span multiple drug products using the same delivery system.

Engagement Snapshot From the Field

A live engagement with an industry participant carrying material or product regulatory and market exposure ahead of a defining policy shift, showing how our research translates into a defensible multi-year portfolio strategy.
MARKET MINDS ADVISORY · CLIENT ENGAGEMENT SUMMARY
Pharmaceutical Packaging Producer Strategic Portfolio Review and Transition Roadmap 2026·Investment Scenario on Pharmaceutical Packaging Exposure Evaluation 2025-26
CLIENT PROFILE
A mid-sized biologics manufacturer preparing to launch its first GLP-1 injectable product engaged MMA while evaluating packaging suppliers for the first time. The client reported a commercial launch timeline assuming pre-filled syringe component delivery within 14 months, based on an initial supplier estimate the internal team had not independently benchmarked against current market conditions (client-reported, unverified by MMA).
STRATEGIC CHALLENGE
Commercial launch planning and manufacturing scheduling had been built around the 14 month component delivery estimate from a single supplier conversation, without benchmarking against actual current market qualification timelines. Competing biologics manufacturers launching similar GLP-1 products were simultaneously seeking capacity from the same limited supplier base, a risk the internal team had not fully assessed. The board wanted independent verification before finalising launch commitments.
MMA APPROACH
MMA benchmarked current pre-filled syringe qualification and delivery timelines across qualified suppliers against the client's assumed 14 month timeline, incorporating actual recent GLP-1 launch delivery data rather than supplier sales estimates. We assessed competing regional demand for syringe capacity from other GLP-1 launches seeking the same supplier base concurrently. We then modelled launch timeline risk under realistic qualification scenarios against the original assumption.
KEY FINDINGS
  1. Realistic qualification and delivery timelines across qualified suppliers ranged from 22 to 30 months, considerably longer than the 14 month estimate launch planning had been built around.
  2. Three competing biologics manufacturers had already begun capacity reservation discussions with the same limited supplier base, threatening the client's ability to secure timely delivery entirely.
  3. Launch timeline assuming the original 14 month estimate risked a commercial delay costing an estimated USD 40 million in lost early-market revenue (client-reported, unverified by MMA).
  4. Early capacity reservation with a supplier offering documented delivery history could secure a 24 month timeline, still requiring launch replanning but meaningfully better than unreserved market position.
CLIENT PROFILE
A mid-sized biologics manufacturer preparing to launch its first GLP-1 injectable product engaged MMA while evaluating packaging suppliers for the first time. The client reported a commercial launch timeline assuming pre-filled syringe component delivery within 14 months, based on an initial supplier estimate the internal team had not independently benchmarked against current market conditions (client-reported, unverified by MMA).
STRATEGIC CHALLENGE
Commercial launch planning and manufacturing scheduling had been built around the 14 month component delivery estimate from a single supplier conversation, without benchmarking against actual current market qualification timelines. Competing biologics manufacturers launching similar GLP-1 products were simultaneously seeking capacity from the same limited supplier base, a risk the internal team had not fully assessed. The board wanted independent verification before finalising launch commitments.
MMA APPROACH
MMA benchmarked current pre-filled syringe qualification and delivery timelines across qualified suppliers against the client's assumed 14 month timeline, incorporating actual recent GLP-1 launch delivery data rather than supplier sales estimates. We assessed competing regional demand for syringe capacity from other GLP-1 launches seeking the same supplier base concurrently. We then modelled launch timeline risk under realistic qualification scenarios against the original assumption.
KEY FINDINGS
  1. Realistic qualification and delivery timelines across qualified suppliers ranged from 22 to 30 months, considerably longer than the 14 month estimate launch planning had been built around.
  2. Three competing biologics manufacturers had already begun capacity reservation discussions with the same limited supplier base, threatening the client's ability to secure timely delivery entirely.
  3. Launch timeline assuming the original 14 month estimate risked a commercial delay costing an estimated USD 40 million in lost early-market revenue (client-reported, unverified by MMA).
  4. Early capacity reservation with a supplier offering documented delivery history could secure a 24 month timeline, still requiring launch replanning but meaningfully better than unreserved market position.
RECOMMENDED STRATEGY
Phase 1: Phase 1 (0 to 3 months): Initiate capacity reservation discussions immediately with the supplier offering the most credible 24 month delivery commitment. Phase 2: Phase 2 (3 to 10 months): Renegotiate launch timeline and manufacturing scheduling around the realistic 24 month component delivery timeline. Phase 3: Phase 3 (10 to 24 months): Execute component qualification and manufacturing against the renegotiated timeline with regular milestone tracking and review.
OUTCOME
The client secured capacity reservation with the recommended supplier and renegotiated its commercial launch timeline around the realistic 24 month delivery estimate before competing biologics manufacturers could claim the same limited supplier capacity. Early engagement avoided the revenue risk the original 14 month assumption would have created if delivery had slipped further (client-reported, unverified by MMA).

Frequently Asked Questions

Foundational context covering the market sizes, CAGR, scope, country, region and competition that inform every finding below. This section is provided to cover basics and most often pre-purchase conversations, answered from the MMA Primary Research Dataset.

What is the current size of the Pharmaceutical Packaging Market?

The global pharmaceutical packaging market is valued at USD 148.6 billion in 2025, covering pre-filled syringes, vials, blister packaging, bottles, cartridges, and serialization systems. Drug manufacturing equipment is excluded.

How large will the Pharmaceutical Packaging Market be by 2036?

The market is forecast to reach USD 325.89 billion by 2036 in the base case, about 2.04 times the 2026 level. That represents incremental value of roughly USD 166.29 billion across the decade.

What is the CAGR for the Pharmaceutical Packaging Market 2026 to 2036?

The market grows at a 7.4% CAGR in the base case, with bull and bear scenarios at 8.6% and 6.2%. The spread turns mainly on GLP-1 and biologics injectable volume growth and glass and elastomer capacity expansion.

Which segment is growing fastest?

Pre-filled syringes and auto-injectors grow fastest at 13.8%, about 1.86 times the overall rate, as GLP-1 and biologics manufacturers specify self-administration formats. Cartridges and device components follow at 11.2%.

Who are the major companies in the Pharmaceutical Packaging Market?

Leading companies include West Pharmaceutical Services, Gerresheimer, SCHOTT Pharma, Stevanato Group, and Becton Dickinson. Concentration sits at a moderate CR5 of 44%, reflecting proven glass and elastomer expertise.

Which country is growing fastest?

India grows fastest at an 11.6% CAGR, as domestic generic and contract manufacturing capacity expands to serve both domestic and export markets. China follows on continued generic and biologics manufacturing expansion.

Report Segmentation Architecture

The full report scope spans multiple orthogonal segmentation dimensions, with cross-tabulated demand data provided for each dimension pair. Coverage extends further to regional breakdowns, trend trajectories, and the competitive detail needed to support segment-level decision-making.

By Packaging Format and Technology Type

  • Pre-Filled Syringes and Auto-Injectors
  • Vials and Ampoules
  • Blister and Unit-Dose Packaging
  • Bottles, Caps, and Closures
  • Cartridges and Drug Delivery Device Components
  • Serialization and Anti-Counterfeiting Systems

By End-Use Therapeutic Category

  • Biologics and Injectables
  • Generic Solid-Dose Pharmaceuticals
  • Vaccines
  • Specialty and Orphan Drugs
  • Over-the-Counter Products

By Commercial Dimension

  • Direct Pharmaceutical Manufacturer Supply
  • Device Manufacturer Supply
  • Contract Manufacturing Channel
  • Serialization and Compliance Services

By Region

  • North America
  • Western Europe
  • East Asia
  • South Asia and Pacific
  • Latin America
  • Middle East and Africa
  • Eastern Europe

Scope, Methodology, and Coverage

Every figure in this report is reproducible from documented input assumptions. The scope below maps the historical period, the forecast horizon, the segmentation dimensions, and the countries covered, alongside the underlying primary and qualitative methodology.
Historical Period
2020 to 2025
Forecast Period
2026 to 2036
Base Year
2025 (USD billions; MMA Primary Research Dataset, August 2026)
Market Definition
The pharmaceutical packaging market comprises primary and secondary packaging components used to contain, protect, and deliver pharmaceutical and biologic drug products, valued at manufacturer revenue from components and directly attached serialization and compliance services. It spans pre-filled syringes, auto-injectors, vials, ampoules, blister and unit-dose packaging, bottles and closures, cartridges and drug delivery device components, and serialization and anti-counterfeiting systems. Drug manufacturing equipment, the pharmaceutical products themselves, and general consumer packaging outside pharmaceutical applications are excluded.
Quantitative Units
USD billions (current prices); component volume in units where applicable
Segmentation Dimensions
By Packaging Format and Technology Type; By End-Use Therapeutic Category; By Commercial Dimension; By Region
Regions Covered
North America, Western Europe, East Asia, South Asia and Pacific, Latin America, Middle East and Africa, Eastern Europe
Countries Covered
USA, China, Germany, France, UK, Japan, South Korea, India, Australia, Canada, Brazil, Mexico, Indonesia, Vietnam, Thailand, Malaysia, UAE, Saudi Arabia, South Africa, Nigeria, Turkey, Poland, Netherlands, Italy, Spain, Sweden, Switzerland, Argentina, Colombia, Singapore, and additional markets relevant to this sector
Key Companies Profiled
West Pharmaceutical Services, Gerresheimer, SCHOTT Pharma, Stevanato Group, Becton Dickinson, Amcor, AptarGroup, Corning, Berry Global, CCL Industries, Nipro Corporation, Datwyler Holding, SGD Pharma, Origin Pharma Packaging, Constantia Flexibles, Catalent, Piramal Glass, Schreiner MediPharm, Kloeckner Pentaplast, Sonoco Products
Quantitative Methodology
Primary survey, n=3,800 respondents, Q4 2025, six countries; demand-side model with trade association cross-validation
Qualitative Methodology
47 expert interviews, Q4 2025; applied to validate demand model assumptions, identify emerging dynamics, and assess competitive positioning
Report Format
PDF and XLSX data workbook (Word format preview document)
Publisher
Market Minds Advisory
Report Code
MMA-2026-PAC-315
Published
August 2026
Contact
sales@marketmindsadvisory.com | www.marketmindsadvisory.com

Purchase the full Pharmaceutical Packaging Market Report (2026 to 2036).

The full MMA Pharmaceutical Packaging report sizes the market across six packaging format categories, five end-use therapeutic categories, four commercial dimensions, and seven regions through 2036. It profiles 20 companies on a consistent pharmaceutical packaging revenue basis, scoring each on injectable manufacturing capacity, serialization technology integration, and device manufacturer relationship depth. Scenario models quantify how GLP-1 and biologics injectable growth, serialization regulation, and glass and elastomer capacity constraints move both component volume and achievable margin by format category. The report also includes qualification timeline benchmarking by supplier, glass and elastomer capacity tracking, and serialization compliance requirement tracking across major regulated markets.
Six-category and four-dimension market sizing to 2036
Twenty-company benchmark on pharmaceutical packaging revenue basis
Injectable qualification timeline and capacity tracking by supplier
Glass and elastomer supply capacity assessment by manufacturer
Serialization compliance requirement tracking across major markets
GLP-1 and biologics demand correlation analysis by packaging format

Built For The People Who Decide

From boardroom strategy to bench-side execution, this report is read cover-to-cover by leaders shaping the next decade of their industry, turning demand scenarios, market dynamics and valuation benchmarks into decisions.
CXOs/ Presidents/ VPs/ Managers
M&A and Corporate Development
Strategy Teams and R&D Heads
Procurement and Product Directors
Regulatory and Compliance Leaders
Investor Relations and Equity Analysts