Market Minds Advisory
PET Preform Market

PET Preform Market: Resin Pass-Through, Cavitation Economics, and a Recycled Mandate Nobody Can Source

Resin is four fifths of the cost, so nobody here sells plastic. They sell conversion, freight density, and increasingly the ability to source a recycled grade that trades above the virgin material.

Lead Analyst

Bilal Shaikh

Published

September 2026

Make Smarter Decisions with Customized Research Insights

Request a free sample report and evaluate market opportunities, growth trends, and competitive dynamics relevant to your business needs.

2025 MARKET VALUE$32.5BMarket Size 2025
2036 FORECAST VALUE$58.0BBase Case , 2026 to 2036
CAGR 2026 TO 20365.4 %Bull 6.6% / Bear 4.2%
INCREMENTAL OPPORTUNITY$23.7BNet 10- year value creation
EXPANSION MULTIPLE1.69x2036 value over 2026 base
Strategic Levers
M&A Pipeline
Regional Outlook
Country Rankings
Competitive Intelligence
Segmental Deep-dive
Call-Us : 91 93563 13602

Executive Snapshot and Market Trajectory

This industry exists because a preform is dense and a blown bottle is mostly air. Ship the solid one and blow it at the filling line, and the freight arithmetic works. Take that away and there is no traded preform market at all, only bottlers moulding for themselves.
Growth follows beverage volume with a slow mix shift on top. Multilayer barrier preforms grow fastest at 8.1%, exactly 1.50 times the market rate, as oxygen-sensitive juice, beer, and dairy products move into plastic. Hot-fill and heat-set preforms follow at 6.9% on Asian ready-to-drink volume. East Asia holds the largest share on Chinese conversion capacity, while South Asia and Pacific sits well above its framework band on the strength of Indian packaged beverage growth.
Concentration is only 21% across the top five on annual preform output, and 46% of all preforms are never sold at all because bottlers mould them in-house. Resin at 79% of cost means converters are effectively toll processors, and the contract negotiation that matters is the pass-through clause. Recycled content mandates are the one force that could reorder this. Nothing else on the horizon reorders this industry meaningfully at all.
Market Definition
This market covers injection-moulded polyethylene terephthalate preforms supplied for subsequent stretch blow moulding into bottles and containers, measured across merchant sales and captive in-house production. Scope includes monolayer, lightweight short-neck, multilayer barrier, hot-fill and heat-set, wide-mouth, and large-format preform constructions. PET resin production, blown bottles, closures, blow moulding machinery, injection systems, and non-PET preform materials are excluded.
Base Year Value
$32.5B in 2025 (MMA Primary Research Dataset, August 2026)
Forecast Period
2026 to 2036, eleven discrete annual values
CAGR
5.4% base case. Bull 6.6%. Bear 4.2%.
Fastest Growth Segment
Multilayer Barrier Preforms: 8.1% CAGR
Fastest Growth Country
India: 9.2% CAGR
Fastest Growth Region
South Asia and Pacific: 7.6% CAGR
Largest Region
East Asia: 30% of 2025 global value
Market Leaders
Alpla. Plastipak Holdings. Amcor. Indorama Ventures. Retal Industries. Source: MMA Analysis based on company annual reports.
Primary Survey
n=3,800 procurement and R&D decision-makers, Q4 2025, six countries
Methodology
Demand-side build-up, cross-validated against public data, 47 expert interviews

PET Preform Market Forecast Scenarios

pet-preform-market-size-forecast-scenario-1787298968792
The 2020 to 2025 period was defined by resin rather than by demand. Polyethylene terephthalate pricing swung violently on feedstock and freight disruption, and converters whose contracts lacked proper indexation absorbed losses they had no way to recover. Beverage volume itself grew steadily and unremarkably throughout. A 4.4% historical rate mostly reflects resin price movement passing through the value chain rather than any change in units converted.
Three mechanisms carry the 5.4% base case. Packaged beverage volume growth across South and Southeast Asia is the largest, since these are markets where bottled water and carbonates are still expanding household penetration. Barrier construction is the second, moving juice, dairy, and beer into plastic formats that monolayer preforms cannot serve. And recycled content mandates are the third, raising value per preform because food-grade recycled resin costs more than virgin does.
The 6.6% bull case rests on beer and dairy conversion into multilayer barrier PET accelerating beyond current trials, which would move substantial glass and carton volume into this category. The 4.2% bear case is beverage taxation and single-use restriction reaching packaged water in the large Asian growth markets, removing exactly the volume the base case depends upon.

A Conversion Business Wearing a Materials Label

Resin is 79% of delivered cost, which means a preform converter is a toll processor whether it describes itself that way or not. Conversion margin runs in the high single digits, and the commercial negotiation that decides whether a contract is profitable is the resin indexation clause, not the price. Converters who accepted quarterly indexation through the recent resin swings discovered exactly how much that clause is worth.
TOP FIVE CONCENTRATION21%Highly fragmented, with regional converters serving local filling sites
RESIN COST SHARE79%Polyester resin dominates the entire delivered cost base
AVERAGE PREFORM WEIGHT9.8 gramsFor a standard half-litre still water short neck
CAPTIVE PRODUCTION SHARE46%Moulded by bottlers themselves rather than bought from converters
RECYCLED GRADE PREMIUM18%Food-grade recycled resin trades above virgin instead of below
STANDARD MOULD CAVITATION96 cavitiesTypical tooling class for high-volume water and carbonate work
The second thing that defines this business is geometry. A preform is solid and a blown bottle is roughly 95% air, so a truck carries perhaps twenty times as many preforms as finished bottles. That single fact created the traded preform industry, keeps it regional rather than global, and explains why the best converters sit inside or adjacent to the filling sites they serve.
Two forces shape the next decade. Recycled content mandates raise cost rather than lowering it, because food-grade recycled resin is scarce and trades at a premium to virgin. And cavitation economics continue pushing scale, since a 144-cavity system converts at meaningfully lower cost per unit than the 96-cavity standard. Both forces reward scale and forward contracting over technical skill, which is unusual in packaging.
"Everyone assumes recycled content saves money because recycling is supposed to be cheaper. In food-grade polyester it is the reverse, and has been for years. Converters are being mandated to buy a scarcer material at a premium, and they are being asked to do it on a contract written when recycled resin was a discount."
Director. Rigid Plastics and Conversion Practice · MMA Packaging and Rigid Plast

Market Trends

Food-Grade Recycled Resin Trades Above Virgin Consistently

European rules require recycled content in beverage bottles on a stepped timetable, and the food-grade recycled polyester needed to meet it is genuinely scarce. Bottle-to-bottle recycling capacity has not kept pace with mandated demand, so the recycled grade now carries a premium of roughly 18% over virgin resin rather than the discount everyone modelled a decade ago. That inverts the economics of compliance completely. Converters holding long-dated offtake agreements with recyclers are meeting obligations at manageable cost, and those buying on spot are absorbing a margin hit they cannot pass through.
Market Impact: India grows at 9.2% annually
Cavitation Increases Push Conversion Cost Down At Replacement

The economics of injection moulding scale with cavity count, and the industry standard has moved from 72 and 96 cavity systems toward 144 and beyond on high-volume water and carbonate work. Each step reduces conversion cost per preform by a meaningful margin through better machine utilisation and lower labour per thousand units. Systems cost several million dollars and last well over a decade, so cavitation is only revisited at replacement. Converters running older lower-cavitation tooling face a conversion cost gap they cannot close until their own replacement cycle arrives. Utilisation matters as much as cavity count itself.
Market Impact: Barrier grows at 8.1% annually

Market Opportunities and Growth Drivers

South Asian Packaged Beverage Penetration Still Has Considerable Headroom

Bottled water and carbonate consumption per head across India. Indonesia. Vietnam, and the Philippines remains a fraction of Western levels, and household penetration continues climbing as cold chain retail and organised distribution reach smaller cities. That is straightforward volume growth in a market where volume is what converts. India contributes the fastest national growth rate in this forecast at 9.2%, supported by a large independent converter base that serves regional bottlers the multinationals do not reach. Preform demand tracks filling line commissioning almost directly, and commissioning across the region remains heavy.
Market Impact: Resin is 79% of cost

Barrier Construction Moves Sensitive Products Out Of Glass

Multilayer preforms with an oxygen barrier layer or scavenger allow juice, dairy, beer, and sauces to sit in plastic for shelf lives that monolayer polyester cannot support. Each product category that converts brings volume out of glass and carton and into this market permanently. Beer is the largest remaining prize and remains partly unconverted on taste and shelf life grounds, though barrier performance has improved steadily. Barrier preforms grow at 8.1% against a market rate of 5.4%, and they carry conversion margin several points above standard monolayer work. Qualification runs per product rather than per customer.
Market Impact: Removes 46% of potential volume

Market Restraints and Challenges

Resin Indexation Clauses Decide Whether Contracts Make Money

At 79% of cost, a resin move of a few percent wipes out an entire conversion margin, and the commercial protection is the indexation clause rather than the price. The root cause is that many contracts were written during a decade of stable resin pricing and carry quarterly or even semi-annual indexation that cannot track a market moving weekly. Converters absorbed real losses through the recent volatility. Mitigation runs through weekly or fortnightly indexation, formula-based pass-through referencing published contract prices, and in some cases resin supplied free-issue by the bottler entirely.
Market Impact: Recycled resin carries 18% premium

Captive Bottler Production Removes Half The Addressable Volume

Around 46% of preforms are moulded by bottlers inside their own filling sites and never enter the merchant market at all. The root cause is simple economics: a bottler running high steady volume on a single specification captures the conversion margin itself and removes inbound freight completely. Commercial impact is that the merchant market is far smaller than beverage volume implies and skews toward variable specifications and mid-sized fillers. Converters are responding with wall-to-wall arrangements inside customer sites, which capture the freight saving while retaining the conversion relationship. The freight saving is what makes captive production work.
Market Impact: Moves standard from 96 cavities upward
4 additional market trends, 2 additional growth drivers, and 3 additional restraints and challenges are covered in the full report. Contact sales@marketmindsadvisory.com to access the complete intelligence.

Segment CAGR and Growth Architecture

Segmentation follows preform construction, because construction determines the resin system, the tooling, the thermal specification, and the conversion margin available on each run. Resin content and end beverage category both cut across every construction rather than separating them cleanly, so neither works as a primary dimension for a market this large and this commoditised.
pet-preform-market-market-share-analysis-1787298969327

Multilayer Barrier Preforms

The fastest construction at 8.1%, exactly 1.50 times the market rate, and the only one where conversion margin sits meaningfully above commodity levels. A barrier layer or oxygen scavenger between polyester skins lets juice, dairy, beer, and sauces hold shelf life that monolayer material cannot deliver, which brings volume out of glass and carton permanently rather than cyclically. Tooling and injection systems are more complex and more expensive, which limits the number of converters who can bid. Beer remains the largest partially converted category and the biggest remaining prize. The main constraint is recyclability, since multilayer construction complicates bottle-to-bottle recovery and sits awkwardly against recycled content rules. Qualification with each customer runs to several months.
CAGR 8.1%

Hot-Fill And Heat-Set Preforms

Second fastest at 6.9%, driven by ready-to-drink tea, sports drinks, and juice categories that fill hot and require a bottle that will not deform. Heat-set preforms need crystallised necks and a specific thermal history through moulding, which raises both cycle time and tooling cost relative to standard work. That complexity is exactly why conversion margin holds up better here than on commodity water preforms. Asian ready-to-drink beverage growth is the principal demand driver, with Japanese. Chinese, and Southeast Asian tea categories consuming very large volumes. Aseptic filling is the competing route and it continues taking share where fillers have made the capital investment, which caps how far this construction can run.
CAGR 6.9%
Full segment breakdown across 6 segments available in the complete report.

Regional Architecture and Country Demand Map

Preform value follows filling capacity rather than consumption, because freight density keeps conversion close to the bottling line. Two regions sit outside their framework bands: South Asia and Pacific above on beverage growth. North America below because bottlers there mould so much of their own.

East Asia

Thirty percent, the largest pool, and China alone converts more polyester preform tonnage than any other region on the strength of its bottled water and tea categories. Chinese conversion capacity is enormous, fragmented across hundreds of regional operators, and increasingly running high-cavitation systems that match Western conversion cost. Japanese and Korean demand is smaller but technically demanding, with heat-set tea bottles consuming very high volumes at tight specification. Domestic recycled polyester capacity is expanding faster here than anywhere. Growth at 6.4% runs above the global rate on continuing beverage volume expansion and on barrier construction moving dairy and juice categories out of carton formats. Export preform shipment across the region is routine.
Share: 30% | CAGR: 6.4% (2026 to 2036)

South Asia and Pacific

Fifteen percent against a framework band of seven to twelve, and the breach is genuine volume growth rather than an accounting artefact. Indian bottled water and carbonate penetration is still climbing as organised retail and cold chain reach smaller cities, and India contributes the fastest national growth rate in this forecast at 9.2%. A large independent converter base serves regional bottlers that multinational systems never reach, which makes the merchant market share unusually high here. Indonesian. Vietnamese, and Philippine demand adds substantially on identical logic. Growth at 7.6% is the highest of any region, tracking filling line commissioning almost directly across the whole region. Merchant share here is the highest of any region.
Share: 15% | CAGR: 7.6% (2026 to 2036)
Regional intelligence for 5 additional markets available in the complete report: North America, Western Europe, Latin America, Middle East and Africa, Eastern Europe. Contact sales@marketmindsadvisory.com.
pet-preform-market-country-cagr-analysis-1787298969846

Four Levers in a Toll Conversion Business

When resin is 79% of cost, nobody wins on purchasing scale because everybody buys the same polymer at broadly the same index. Margin comes from the indexation clause, from cavity count, from securing recycled grade before the mandate steps up, and from moving the moulding machine inside the customer's building. Four levers follow, and two of them are contractual.

Renegotiate Every Contract Onto Weekly Resin Indexation

Conversion margin runs in the high single digits and resin is 79% of cost, so a three percent resin move inside an unindexed quarter erases the entire margin on that volume. Many contracts still carry quarterly indexation written during a stable decade. Moving to weekly or fortnightly formula-based pass-through referencing published contract prices removes the exposure completely and costs nothing but negotiating effort. Converters who made this change through the recent volatility held margin while competitors absorbed losses of several percentage points. This is the highest-return commercial action available in the category.
Market Impact: Protects 8 to 9 points of conversion margin

Step Cavity Count Upward At Every System Replacement

Injection systems last well over a decade, so cavitation can only be revisited at replacement, and that makes each replacement a ten-year cost decision rather than a purchase. Moving from 96 to 144 cavities on high-volume water and carbonate work reduces conversion cost per thousand preforms by roughly 12 to 15% through better machine utilisation and lower labour intensity. Systems cost several million dollars either way, so the incremental capital is modest against the total. Converters running older tooling cannot close the resulting gap until their own cycle arrives. Utilisation has to follow, or the advantage never appears.
Market Impact: Cuts conversion cost by 12 to 15% overall

Contract Food-Grade Recycled Offtake Before The Next Step

Food-grade recycled polyester trades at roughly 18% above virgin because bottle-to-bottle capacity has not matched mandated demand, and the next mandated step raises required content further. Long-dated offtake agreements with recyclers secure both volume and price, and volume matters more than price when a material is genuinely short. Converters buying on spot at each mandate step will pay whatever the market asks. Agreements signed now cost a commitment; agreements signed later may not be available at all, because recycler output is already substantially contracted forward. Recycler forward books are filling faster than capacity is built.
Market Impact: Locks supply against an 18% recycled resin premium

Install Moulding Inside The Customer's Filling Site

Wall-to-wall arrangements put the injection system inside the bottler's building, feeding preforms directly to the blow moulder without any inbound freight. That captures most of the economics that push bottlers toward captive production while keeping the conversion relationship with the converter. Freight savings alone run 4 to 6% of delivered cost on a typical regional lane. It also creates switching cost that no supply contract can match, since removing the arrangement means the bottler installing its own capacity. Roughly 46% of volume already sits captive, and this is how converters compete with that.
Market Impact: Saves 4 to 6% of total delivered cost

Who Controls the Margin Pool

Concentration reaches only 21% across the top five measured on annual preform output, and the fragmentation is real rather than definitional: hundreds of regional converters serve filling sites within economic freight range. Add the 46% of volume moulded captively by bottlers and the merchant market looks smaller and more dispersed still. The gap between leaders and regional challengers is narrow on conversion cost and wide on multi-country supply capability.
Competition runs on three fronts. Indexation and contract structure is the first and it decides profitability more than price does. Cavitation and conversion cost is the second, fixed at each system replacement for a decade. Recycled resin access is the third and newest, and it currently separates converters far more sharply than any technical capability. Technical capability separates converters far less than commercial terms do.

Pressure builds from two directions. Bottlers continue taking volume in-house wherever specification is stable and volume is high enough to justify it. And recycled content mandates advantage converters with contracted recycler supply over those buying spot, which is a commercial rather than an operational distinction. Neither pressure shows up in reported output share figures, and both are reshaping who makes money.
pet-preform-market-company-positioning-matrix-1787298970367

Competitive Moat and Risk Dimensions

ALPLA

Moat: In-plant footprint at customers

A large share of output comes from moulding installed inside customer filling sites, which removes inbound freight and creates switching costs no ordinary supply contract produces. Displacing an in-plant arrangement means the bottler installing its own capacity, which is precisely the decision the arrangement was designed to prevent. That footprint took decades to build and cannot be replicated through pricing.
ALPLA

Risk: Capital tied to customer sites

Injection systems installed inside a customer's building are hard to redeploy if that customer consolidates plants, changes format, or brings conversion in-house at contract end. The asset is committed to a relationship rather than to a market. Plant closures across mature beverage networks therefore strand capital that centrally located capacity would not.
PLASTIPAK HOLDINGS

Moat: Integrated recycling and conversion

Owning bottle-to-bottle recycling capacity alongside preform conversion secures food-grade recycled resin at a moment when that material trades roughly 18% above virgin and is genuinely short. Competitors buying recycled grade on spot face both cost and availability risk at every mandated step. Integration also allows recycled content commitments to customers that a converter without secured supply simply cannot make credibly.
PLASTIPAK HOLDINGS

Risk: Recycling economics may normalise

The recycled grade premium exists because recycling capacity has lagged mandated demand, and substantial new bottle-to-bottle capacity is now being commissioned. If supply catches demand the premium compresses and integrated recycling becomes an ordinary asset. The position depends on a shortage rather than on a capability.

Players Tracked

Prominent Players

Alpla
Plastipak Holdings
Amcor
Indorama Ventures
Retal Industries

Other Key Players

Resilux
PDG Plastiques
Novapet
Taiwan Hon Chuan Enterprise
Zhuhai Zhongfu Enterprise
Manjushree Technopack
Chemco Plastic Industries
Parekhplast India
Berry Global
Greiner Packaging
Logoplaste
Envases Group
Nampak
Esterform Packaging
Petainer

Recent Developments

FEBRUARY 2025

European converter signs long-dated food-grade recycled offtake agreement

A European preform converter secured a multi-year supply agreement for food-grade recycled polyester from a bottle-to-bottle recycler, covering much of its mandated content requirement. The arrangement was a supply agreement rather than any equity investment, and it fixes volume ahead of the next mandated step.
Signal: Recycler output is being contracted forward faster than capacity is being built, and spot buyers will discover that late
MAY 2025

Indian converter commissions high-cavitation lines for regional bottlers

An Indian preform manufacturer commissioned additional injection capacity running higher cavitation tooling than its existing lines, aimed at regional water and carbonate bottlers outside the multinational filling networks. The expansion was organic capital investment funded internally rather than any partnership with an international converter. Cavity counts were not disclosed publicly.
Signal: Conversion cost parity with Western operations is arriving in India through tooling class rather than through labour cost
SEPTEMBER 2025

Beverage system extends captive preform moulding across additional sites

A large beverage bottling system installed preform injection capacity at several further filling plants, extending captive production across more of its network. The move was internal capital investment rather than any acquisition of a converter, and it removes those volumes from the merchant market permanently.
Signal: Every captive installation permanently removes merchant volume, and stable high-volume specifications are exactly what converters cannot defend

When One Input Is Four Fifths

One input dominates so completely that the others barely matter. Polyester resin runs about 79% of delivered cost, produced from purified terephthalic acid and monoethylene glycol at large plants concentrated in China. India, the Middle East, and the United States Gulf Coast. Electricity for moulding adds roughly nine percent, colourants about three percent, and the remainder is labour, tooling amortisation, and freight.
Resin volatility is therefore the entire cost story. Polyester contract prices moved sharply through the recent period on paraxylene feedstock swings and freight disruption, and EIA reporting on the underlying petrochemical markets documents the scale of it. For converters carrying quarterly indexation, a resin move of a few percent inside the quarter consumed a full conversion margin, and several regional operators were absorbed as a result.

The competitive disadvantage mechanism is contractual rather than operational. Two converters with identical plants can differ by several margin points purely on indexation frequency, and the one on quarterly terms loses money exactly when the other holds steady. Small regional converters have the least negotiating power to fix it, while those supplied free-issue resin carry no exposure at all. Recycled grade adds a second exposure, trading roughly 18% above virgin.
pet-preform-market-cost-volatility-analysis-1787298970562

Move contracts to weekly formula-based resin pass-through

Indexation frequency rather than resin price is what separates profitable contracts from unprofitable ones in this business. Weekly or fortnightly formula pass-through referencing published contract prices removes almost all of the exposure and costs nothing beyond negotiating effort. Converters who made the change during the recent volatility held margin while competitors carrying quarterly terms absorbed several points of loss.

Accept free-issue resin arrangements where customers will offer them

Under free-issue the bottler buys and owns the resin while the converter is paid for conversion alone, which removes resin exposure entirely and cuts working capital substantially. Conversion-only pricing is lower in headline terms but far more predictable. Large bottlers offer this readily; mid-sized fillers rarely have the purchasing scale to make it work.

Contract recycled grade forward rather than buying at each step

Food-grade recycled polyester carries roughly an 18% premium to virgin, and recycler output is already being contracted well forward by the converters paying attention. Securing volume ahead of the next mandated content step protects both cost and availability, and availability is much the harder problem to solve. Spot buyers may find no material at all.

Portfolio Architecture for Margin Defence

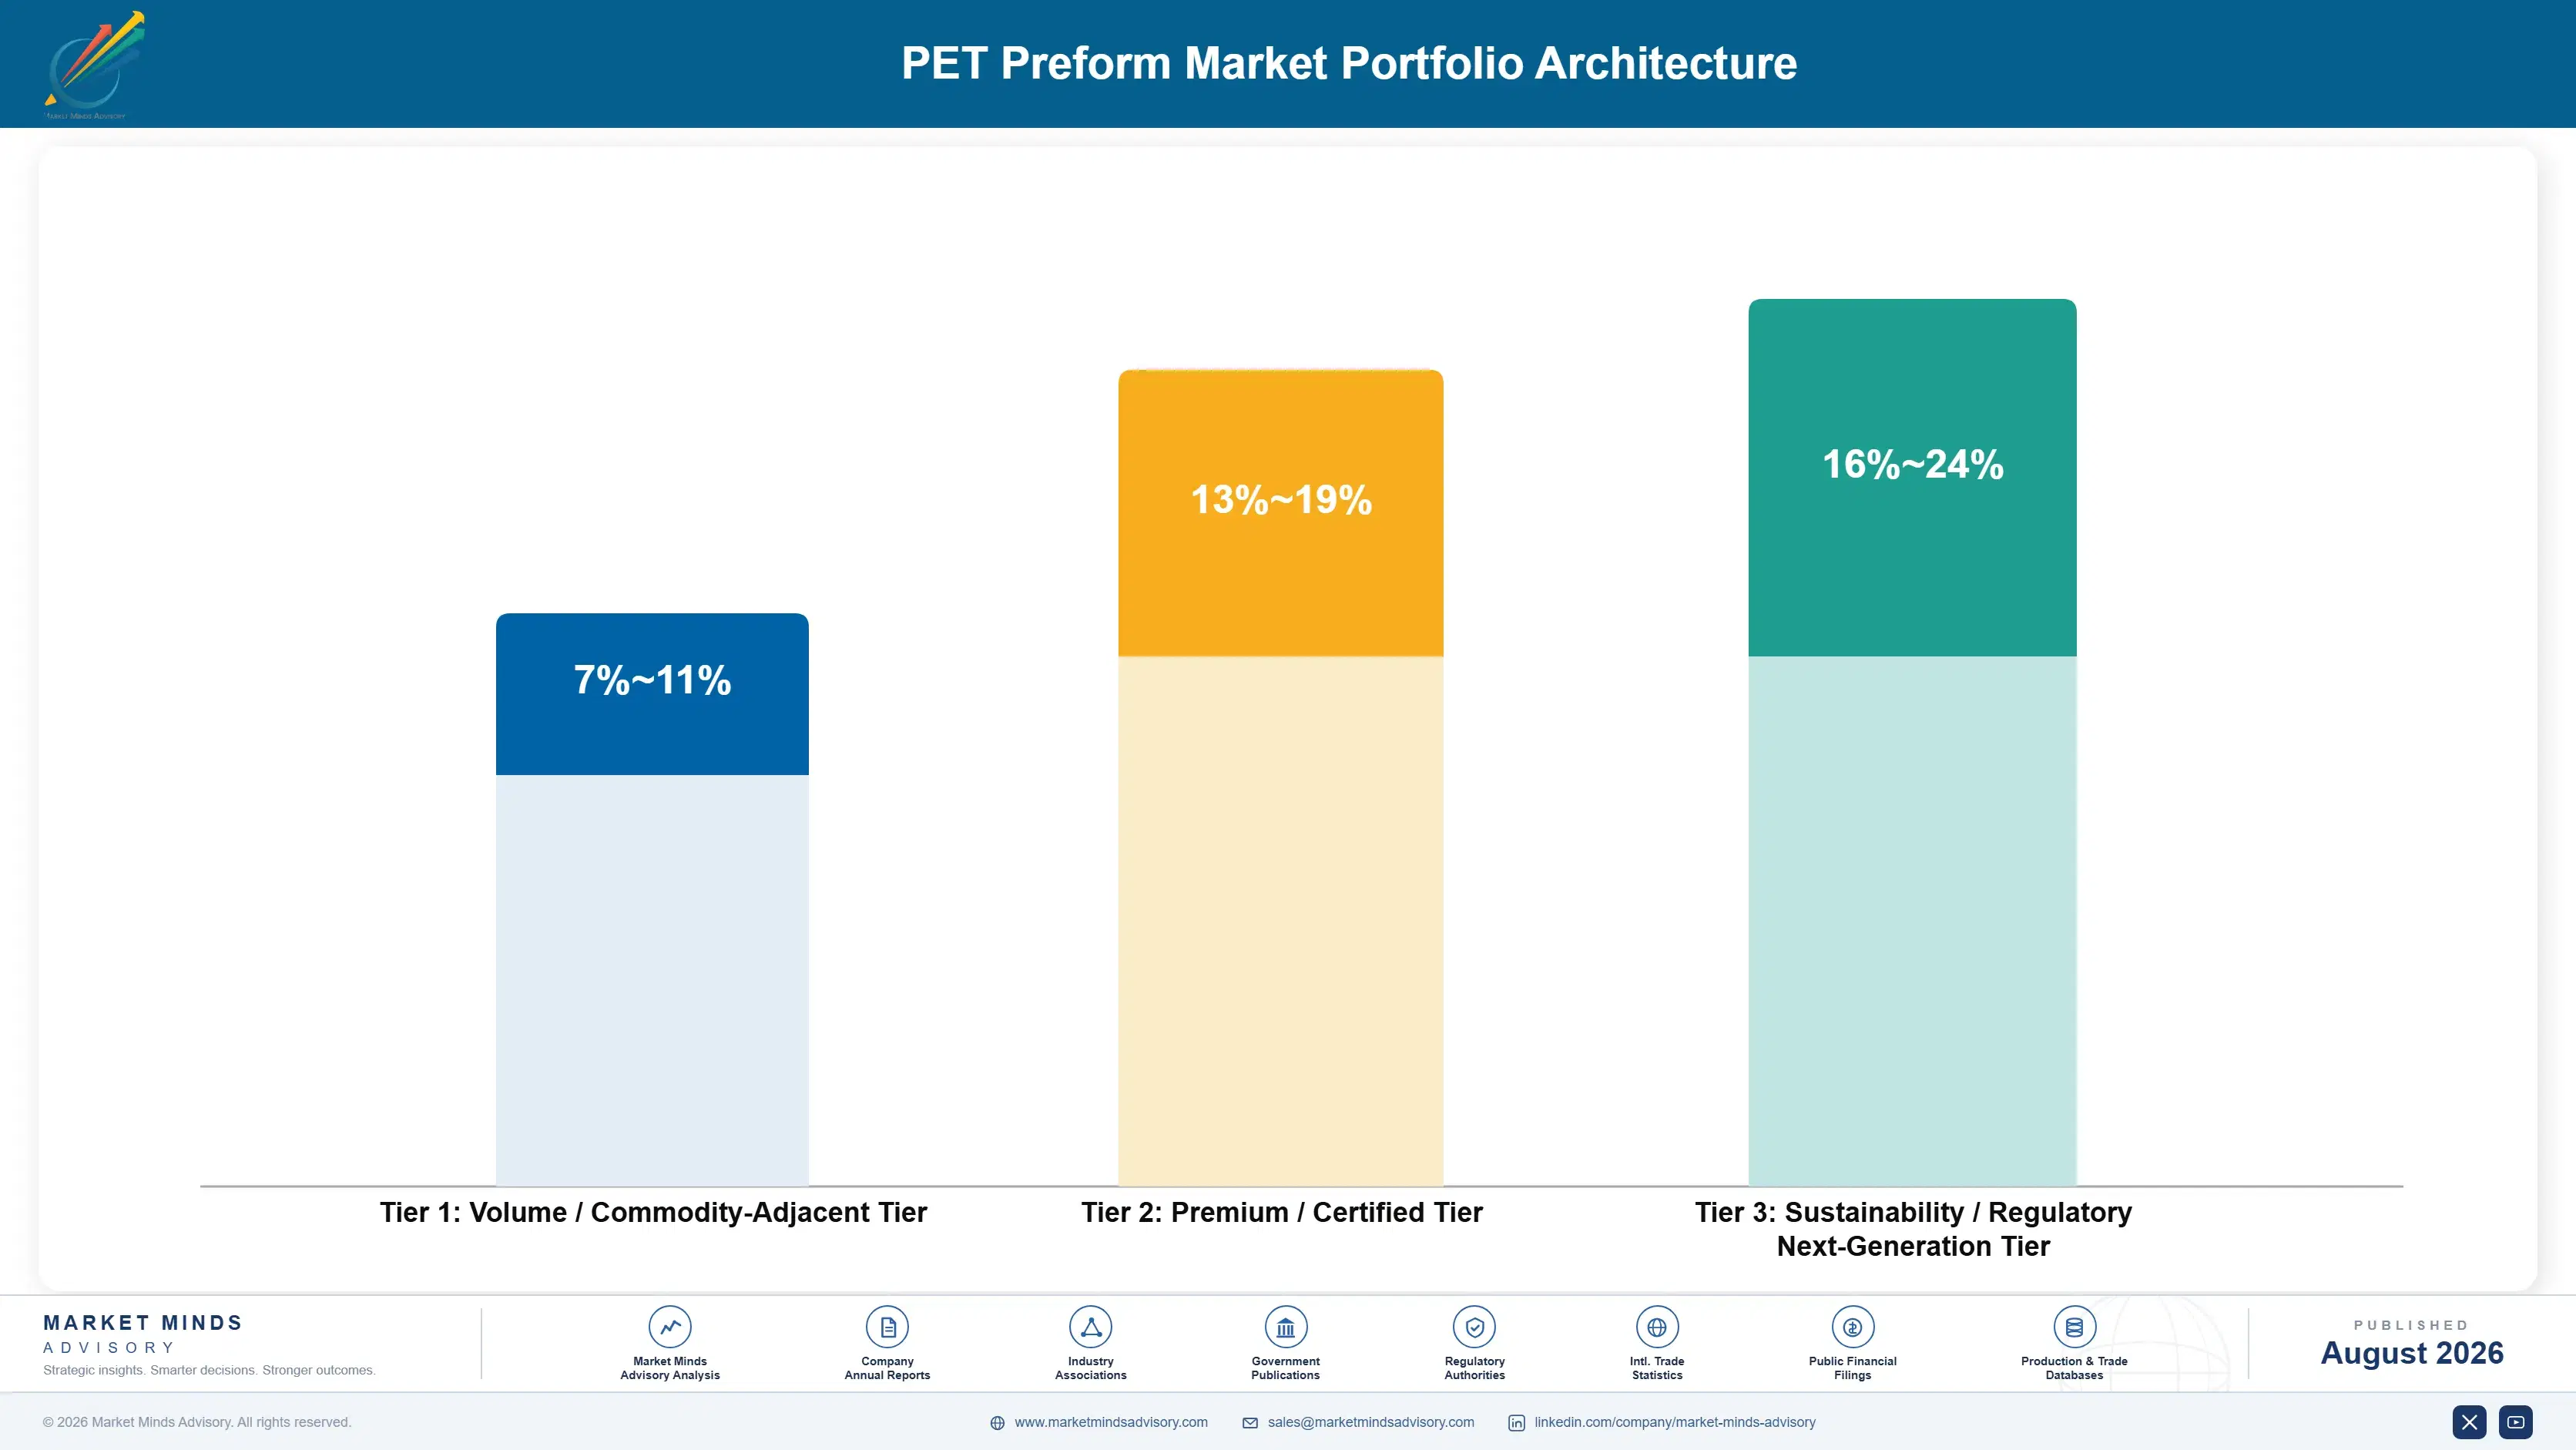
Three tiers describe this market, and because resin dominates cost so heavily the gross margin ranges look narrow against other packaging categories. Standard monolayer water and carbonate preforms are pure commodity conversion at high single digit margins. Certified and specification-controlled work, meaning hot-fill, heat-set, and tightly toleranced neck finishes, sits several points higher. And recycled-content and barrier constructions occupy a third tier where scarcity and technical difficu
The tension is that commodity volume is what fills the injection systems. A 144-cavity machine running below capacity converts at a cost that destroys the advantage its cavitation was bought to create, so converters need base-load water and carbonate work underneath the specialty runs. Several operators who chased barrier and hot-fill exclusively found utilisation falling and conversion cost per unit rising in consequence. Cavitation only pays when the machine is genuinely full.

High-value pools concentrate wherever the constraint is access rather than capability. Recycled grade supply and barrier qualification both gate participation in ways that ordinary conversion capacity does not. Both gates are commercial rather than technical in nature, which is worth understanding clearly.

Volume / Commodity-Adjacent Tier

Standard monolayer water and carbonate preforms at high cavitation, competing purely on conversion cost and freight distance. Thin margin, enormous volume, and essential to holding injection system utilisation at the level cavitation economics assume.
Gross Margin: 7-11%

Premium / Certified Tier

Hot-fill, heat-set, and tightly toleranced specification work requiring crystallised necks and controlled thermal history. Longer cycle times and higher tooling cost restrict the bidder set, which is why conversion margin holds several points above commodity levels here.
Gross Margin: 13-19%

Sustainability / Regulatory / Next-Generation Tier

Multilayer barrier constructions and high recycled-content preforms meeting mandated thresholds. Margin reflects scarcity of food-grade recycled supply and the technical difficulty of barrier moulding rather than any premium the customer volunteers.
Gross Margin: 16-24%
pet-preform-market-portfolio-architecture-1787298971060

High-value Sub-segments and Strategic Watch-out

Multilayer Barrier Preforms

Best margin and fastest growth at 8.1%, bringing juice, dairy, and eventually beer volume out of glass and carton permanently. The constraint is recyclability, since multilayer construction complicates bottle-to-bottle recovery and sits awkwardly beside recycled content rules. Beer remains the largest partially converted category, and it would be transformative.
Gross Margin: 16-24%

High Recycled-Content Preforms

Strong margin created entirely by scarcity rather than by capability, since food-grade recycled polyester trades roughly 18% above virgin. Growth is mandated rather than chosen, and the position depends on contracted recycler supply that spot buyers cannot obtain at any price. Mandated step increases raise required volumes further.
Gross Margin: 15-22%

Standard Monolayer Water Preforms

The volume core at high single digit margins, holding injection system utilisation at the level that makes cavitation economics work at all. Converters who abandoned this tier for specialty work watched conversion cost per unit rise across their whole output. Base-load volume is what makes the specialty runs viable.
Gross Margin: 7-11%

Captive In-Plant Conversion Arrangements

The strategic watch-out, since roughly 46% of volume already sits captive and every new bottler installation removes merchant volume permanently. Wall-to-wall converter arrangements compete against it, but they commit capital to a single customer relationship rather than to a market. Beverage network consolidation is the risk to that capital.
Gross Margin: 9-14%

How Preform Demand Repeats

Preform demand is as close to a pure annuity as packaging gets, because a filling line commissioned today consumes preforms at a known rate for fifteen years. Contracts run three to five years and renew routinely, since requalification and neck finish compatibility make switching genuinely disruptive. What breaks the annuity is not competitive loss but plant closure or format change. Converters therefore track their customers' network consolidation plans more closely than they track competitor p
Depth of the relationship varies enormously by customer type. Multinational beverage systems specify centrally, audit heavily, and increasingly mould captively where volume justifies it. Regional and independent bottlers rely on converters completely and switch rarely. Private label and contract fillers buy on price with short commitments and switch readily. Dairy and juice processors moving into barrier formats behave differently again, needing technical support that commodity converters cannot provide.

Buyer profiles are shifting as sustainability reporting moves preform sourcing decisions upward inside customer organisations. Recycled content percentages now appear in board-level disclosures, which changes who signs the contract. Procurement no longer decides preform sourcing alone in most large customers, and the sales conversation has changed accordingly.
pet-preform-market-end-use-penetration-index-1787298971555

What We Would Tell a Board

These are among the four positions where our research anticipates prominent divergence between winners and laggards over the coming forecast period. Each is grounded in the demand model, the regulatory perimeter, and the announced capacity pipeline.
01 / CONTRACT INDEXATION DISCIPLINE

Fix the clause before worrying about the price

Resin is 79% of delivered cost and conversion margin runs in the high single digits, so a three percent resin move inside an unindexed quarter erases the entire margin on that volume. Many contracts still carry quarterly indexation written during a stable pricing decade that has not returned, and converters who moved to weekly formula pass-through held margin through recent volatility while competitors absorbed several points of loss. This remains the highest-return commercial action available anywhere in the entire category, and it requires no capital at all.
02 / CAVITATION REPLACEMENT PLANNING

Every system replacement is a ten-year cost decision

Injection systems last well over a decade, which means cavity count can only be revisited at replacement and the choice then governs conversion cost until the following cycle. Stepping from 96 to 144 cavities on high-volume work reduces conversion cost per thousand preforms by roughly 12 to 15% for modest incremental capital against a system costing several million dollars regardless. Boards treating a system replacement as like-for-like renewal are locking in a conversion cost disadvantage they will not be able to revisit for a decade.
03 / RECYCLED SUPPLY SECURITY

Contract recycled resin now or do without later

Food-grade recycled polyester trades roughly 18% above virgin because bottle-to-bottle capacity has lagged the mandate badly, and recycler output is already being contracted well forward by the converters who are paying attention. Availability rather than price is the real problem here, and the next mandated content step raises required volumes again on a fixed and published timetable. Converters planning to buy spot at each step are relying on a market that may have nothing left to sell them when they arrive.
04 / CAPTIVE VOLUME DEFENCE

Move the machine inside the customer's building

Roughly 46% of preform volume never reaches the merchant market because bottlers mould it themselves, capturing conversion margin and eliminating inbound freight worth 4 to 6% of delivered cost. Wall-to-wall arrangements inside customer sites capture most of the same economics while keeping the conversion relationship intact, and they create switching costs that no ordinary supply contract can match. The trade is capital committed to a single customer relationship, which is a genuine risk in regions where beverage networks are actively consolidating plants.

Engagement Snapshot From the Field

A live engagement with an industry participant carrying material or product regulatory and market exposure ahead of a defining policy shift, showing how our research translates into a defensible multi-year portfolio strategy.
MARKET MINDS ADVISORY · CLIENT ENGAGEMENT SUMMARY
PET Preform Producer Strategic Portfolio Review and Transition Roadmap 2026·Investment Scenario on PET Preform Exposure Evaluation 2025-26
CLIENT PROFILE
A regional preform converter with approximately 260 million dollars in annual revenue (client-reported, unverified by MMA), operating two injection sites serving mid-sized beverage fillers and private label customers. The company ran predominantly 72 and 96 cavity systems, held quarterly resin indexation across most of its contract book, and bought all recycled grade material on spot as mandated content requirements arrived.
STRATEGIC CHALLENGE
Gross margin had deteriorated over two years despite stable volumes and a stable customer base, and management attributed the decline to competitive pricing pressure from larger converters. A capital request for a replacement injection system was pending. The board wanted independent diagnosis before approving further capital into what might be a broken commercial model.
MMA APPROACH
We reconstructed margin by contract against resin price movement across eight quarters to isolate indexation losses from pricing losses, benchmarked conversion cost per thousand preforms against comparable operators by cavity class, and modelled recycled grade cost exposure across the mandated step schedule. Customer interviews tested willingness to move to shorter indexation periods.
KEY FINDINGS
  1. Indexation lag rather than competitive pricing accounted for the large majority of margin deterioration, concentrated entirely in the quarters when resin moved most sharply against the client.
  2. Conversion cost per thousand preforms ran roughly 14% above comparable operators running 144 cavity systems, with the gap widening as competitors completed their own replacement cycles.
  3. Spot purchasing of food-grade recycled grade was costing materially more than contracted equivalents, and two recyclers indicated their forward output was already substantially committed elsewhere.
  4. Six of nine major customers indicated they would accept weekly indexation, and three said they had expected to be asked for it already and were surprised they had not been.
CLIENT PROFILE
A regional preform converter with approximately 260 million dollars in annual revenue (client-reported, unverified by MMA), operating two injection sites serving mid-sized beverage fillers and private label customers. The company ran predominantly 72 and 96 cavity systems, held quarterly resin indexation across most of its contract book, and bought all recycled grade material on spot as mandated content requirements arrived.
STRATEGIC CHALLENGE
Gross margin had deteriorated over two years despite stable volumes and a stable customer base, and management attributed the decline to competitive pricing pressure from larger converters. A capital request for a replacement injection system was pending. The board wanted independent diagnosis before approving further capital into what might be a broken commercial model.
MMA APPROACH
We reconstructed margin by contract against resin price movement across eight quarters to isolate indexation losses from pricing losses, benchmarked conversion cost per thousand preforms against comparable operators by cavity class, and modelled recycled grade cost exposure across the mandated step schedule. Customer interviews tested willingness to move to shorter indexation periods.
KEY FINDINGS
  1. Indexation lag rather than competitive pricing accounted for the large majority of margin deterioration, concentrated entirely in the quarters when resin moved most sharply against the client.
  2. Conversion cost per thousand preforms ran roughly 14% above comparable operators running 144 cavity systems, with the gap widening as competitors completed their own replacement cycles.
  3. Spot purchasing of food-grade recycled grade was costing materially more than contracted equivalents, and two recyclers indicated their forward output was already substantially committed elsewhere.
  4. Six of nine major customers indicated they would accept weekly indexation, and three said they had expected to be asked for it already and were surprised they had not been.
RECOMMENDED STRATEGY
Phase 1: Phase 1 (months one to six): renegotiate the contract book onto weekly formula-based resin pass-through, beginning with the six customers already willing. Phase 2: Phase 2 (months six to eighteen): specify the pending replacement at 144 cavities rather than like-for-like, and secure forward recycled grade offtake. Phase 3: Phase 3 (months eighteen to thirty): pursue wall-to-wall installation with the two largest customers to defend volume against captive conversion.
OUTCOME
The client renegotiated indexation across most of its book within two quarters and revised the capital specification upward on cavitation. Gross margin recovered close to its prior level within a year without any change in pricing (client-reported, unverified by MMA), and forward recycled offtake was secured before the next mandated content step took effect.

Frequently Asked Questions

Foundational context covering the market sizes, CAGR, scope, country, region and competition that inform every finding below. This section is provided to cover basics and most often pre-purchase conversations, answered from the MMA Primary Research Dataset.

What is the current size of the PET Preform Market?

The market is valued at USD 32.5 billion in 2025, rising to USD 34.26 billion in 2026. Roughly 46% of that volume is moulded captively by bottlers.

How large will the PET Preform Market be by 2036?

MMA forecasts USD 57.96 billion by 2036, an increase of USD 23.70 billion over the 2026 base. That represents an expansion multiple of 1.69 times.

What is the CAGR for the PET Preform Market 2026 to 2036?

The base case CAGR is 5.4%, with a bull case of 6.6% and a bear case of 4.2%. The historical rate from 2020 to 2025 was 4.4%.

Which segment is growing fastest?

Multilayer barrier preforms at 8.1%, exactly 1.50 times the market rate. They bring oxygen-sensitive juice, dairy, and beer volume out of glass and carton permanently.

Who are the major companies in the PET Preform Market?

Alpla, Plastipak Holdings, Amcor, Indorama Ventures, and Retal Industries lead on annual preform output. The top five together hold only 21% of a very fragmented market.

Which country is growing fastest?

India at 9.2%, driven by bottled water and carbonate penetration still climbing as organised retail reaches smaller cities. A large independent converter base serves regional bottlers directly.

Report Segmentation Architecture

The full report scope spans multiple orthogonal segmentation dimensions, with cross-tabulated demand data provided for each dimension pair. Coverage extends further to regional breakdowns, trend trajectories, and the competitive detail needed to support segment-level decision-making.

By Preform Construction

  • Standard Monolayer Cold-Fill Preforms
  • Lightweight Short-Neck Preforms
  • Multilayer Barrier Preforms
  • Hot-Fill And Heat-Set Preforms
  • Wide-Mouth And Jar Preforms
  • Handleware And Large-Format Preforms

By End-Use Industry

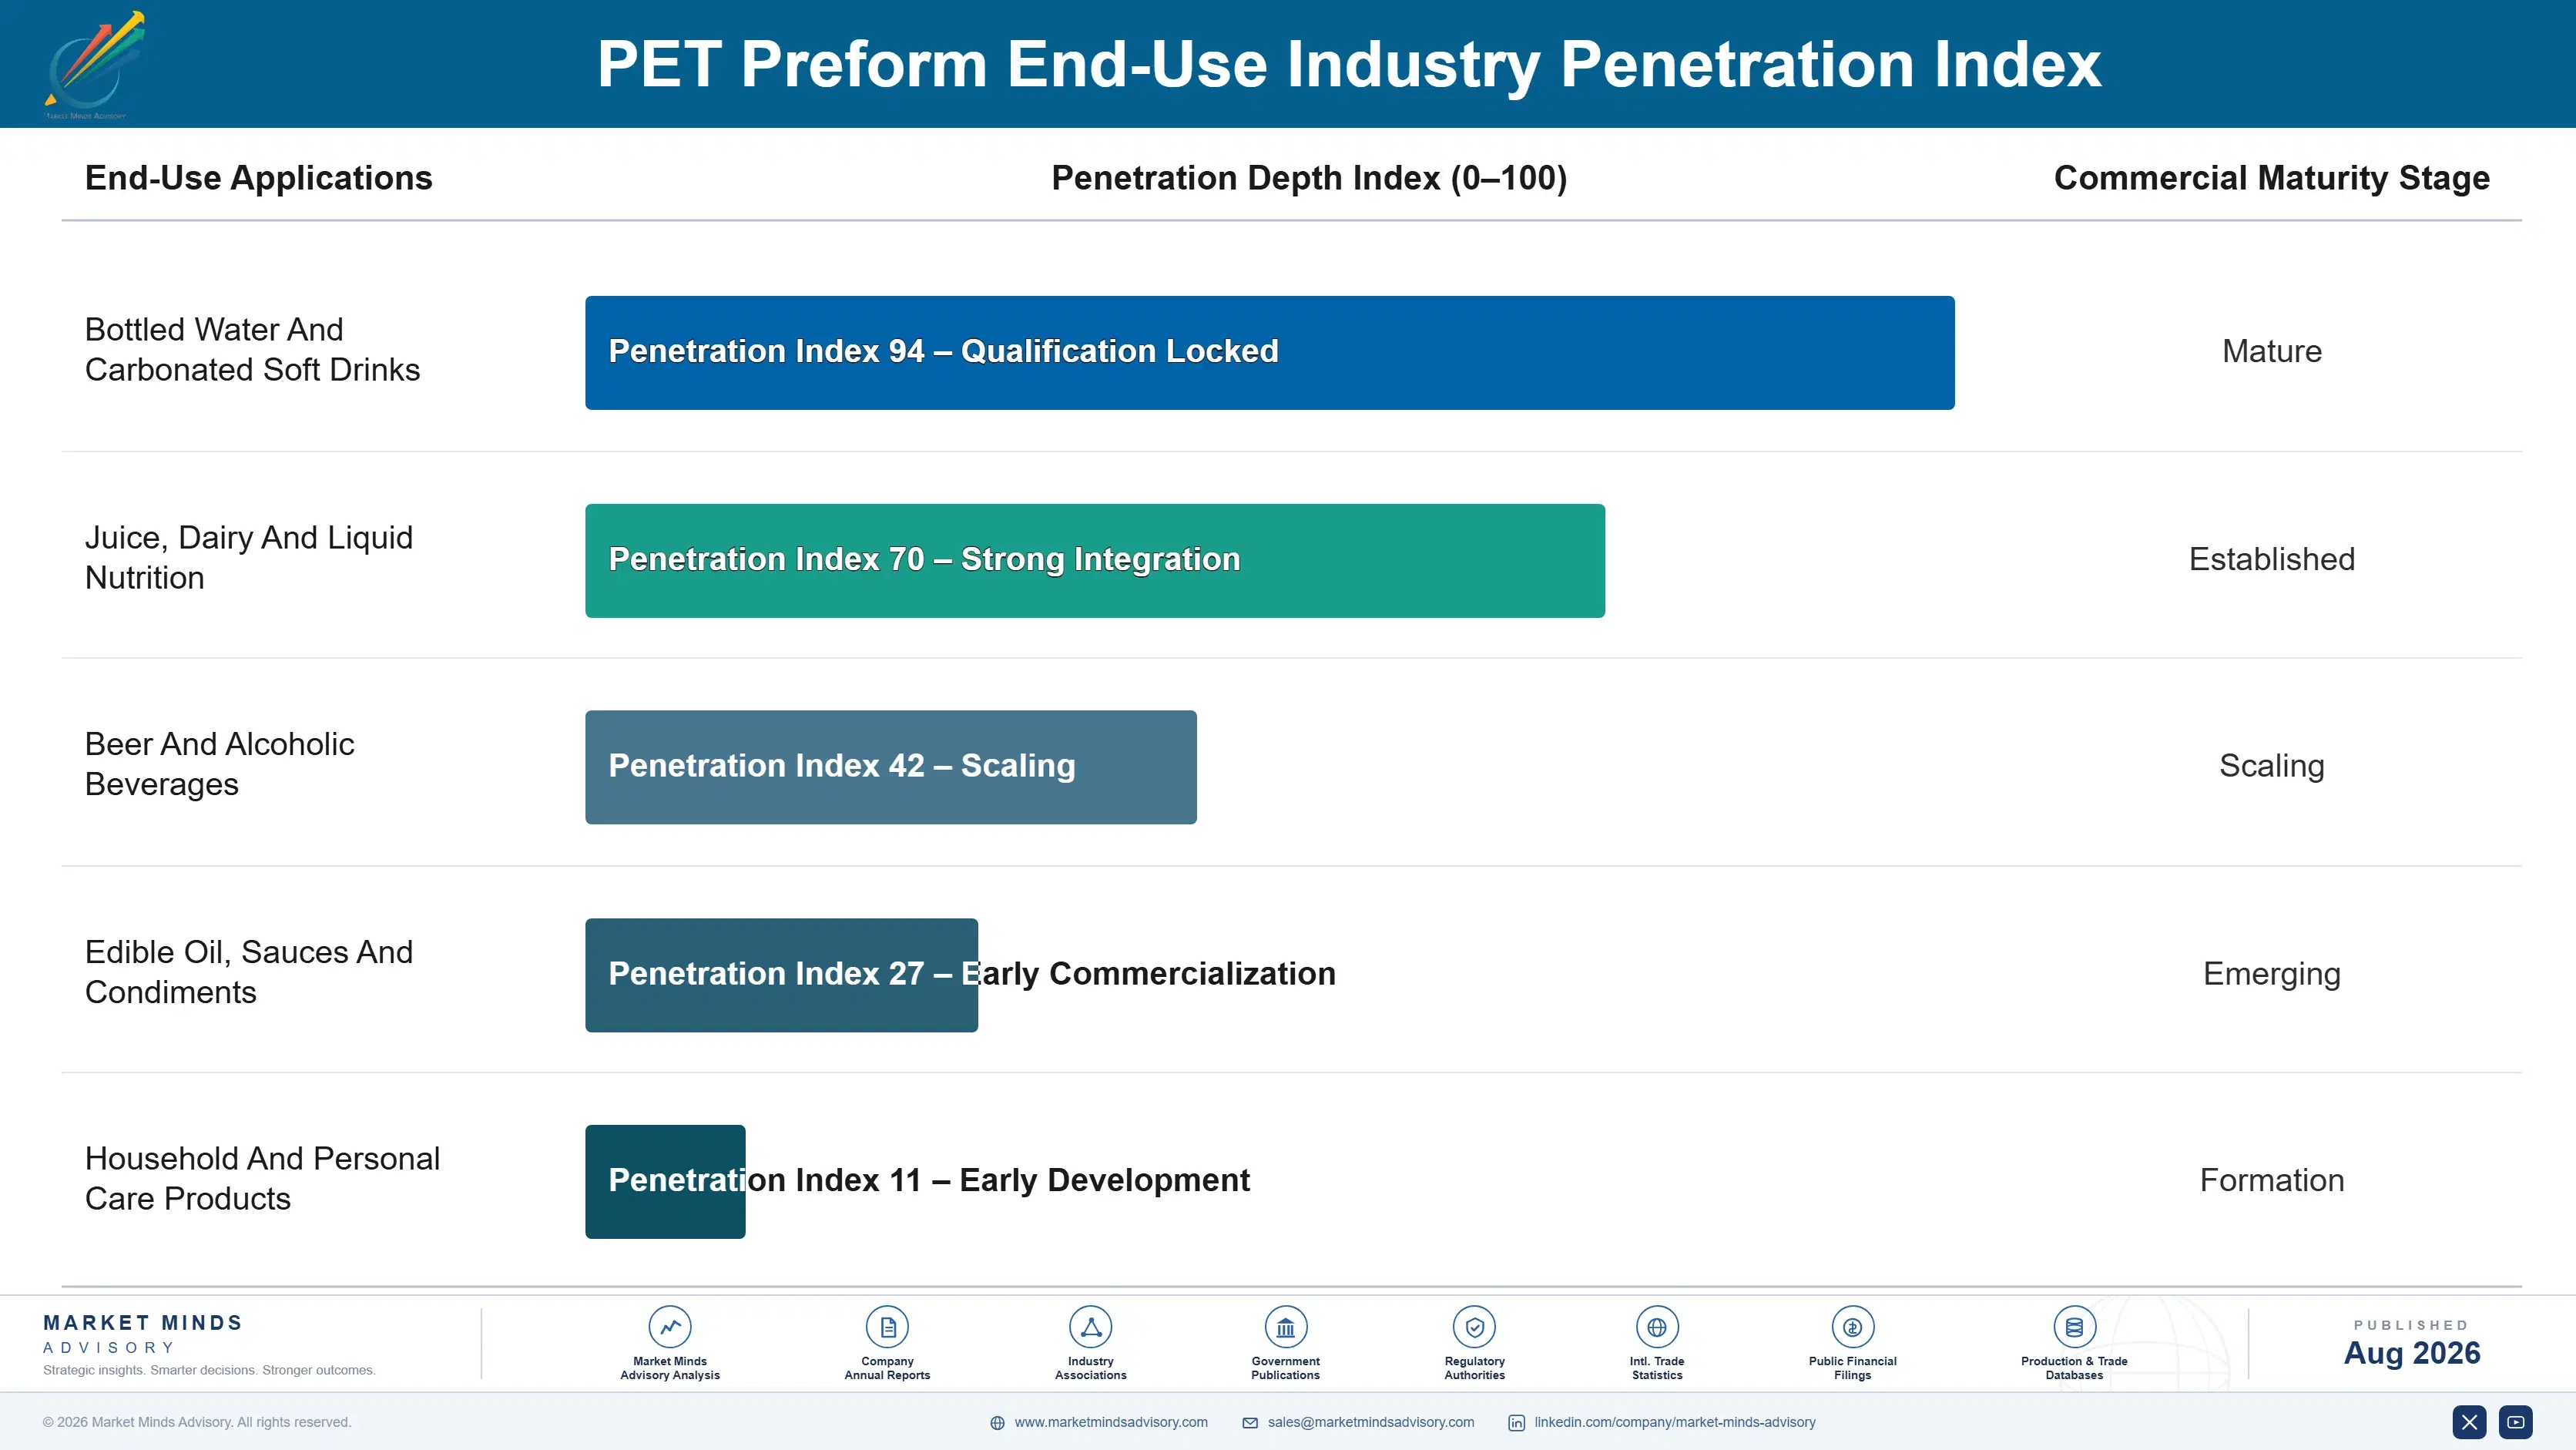
  • Bottled Water And Carbonated Soft Drinks
  • Juice, Dairy And Liquid Nutrition
  • Beer And Alcoholic Beverages
  • Edible Oil, Sauces And Condiments
  • Household And Personal Care Products

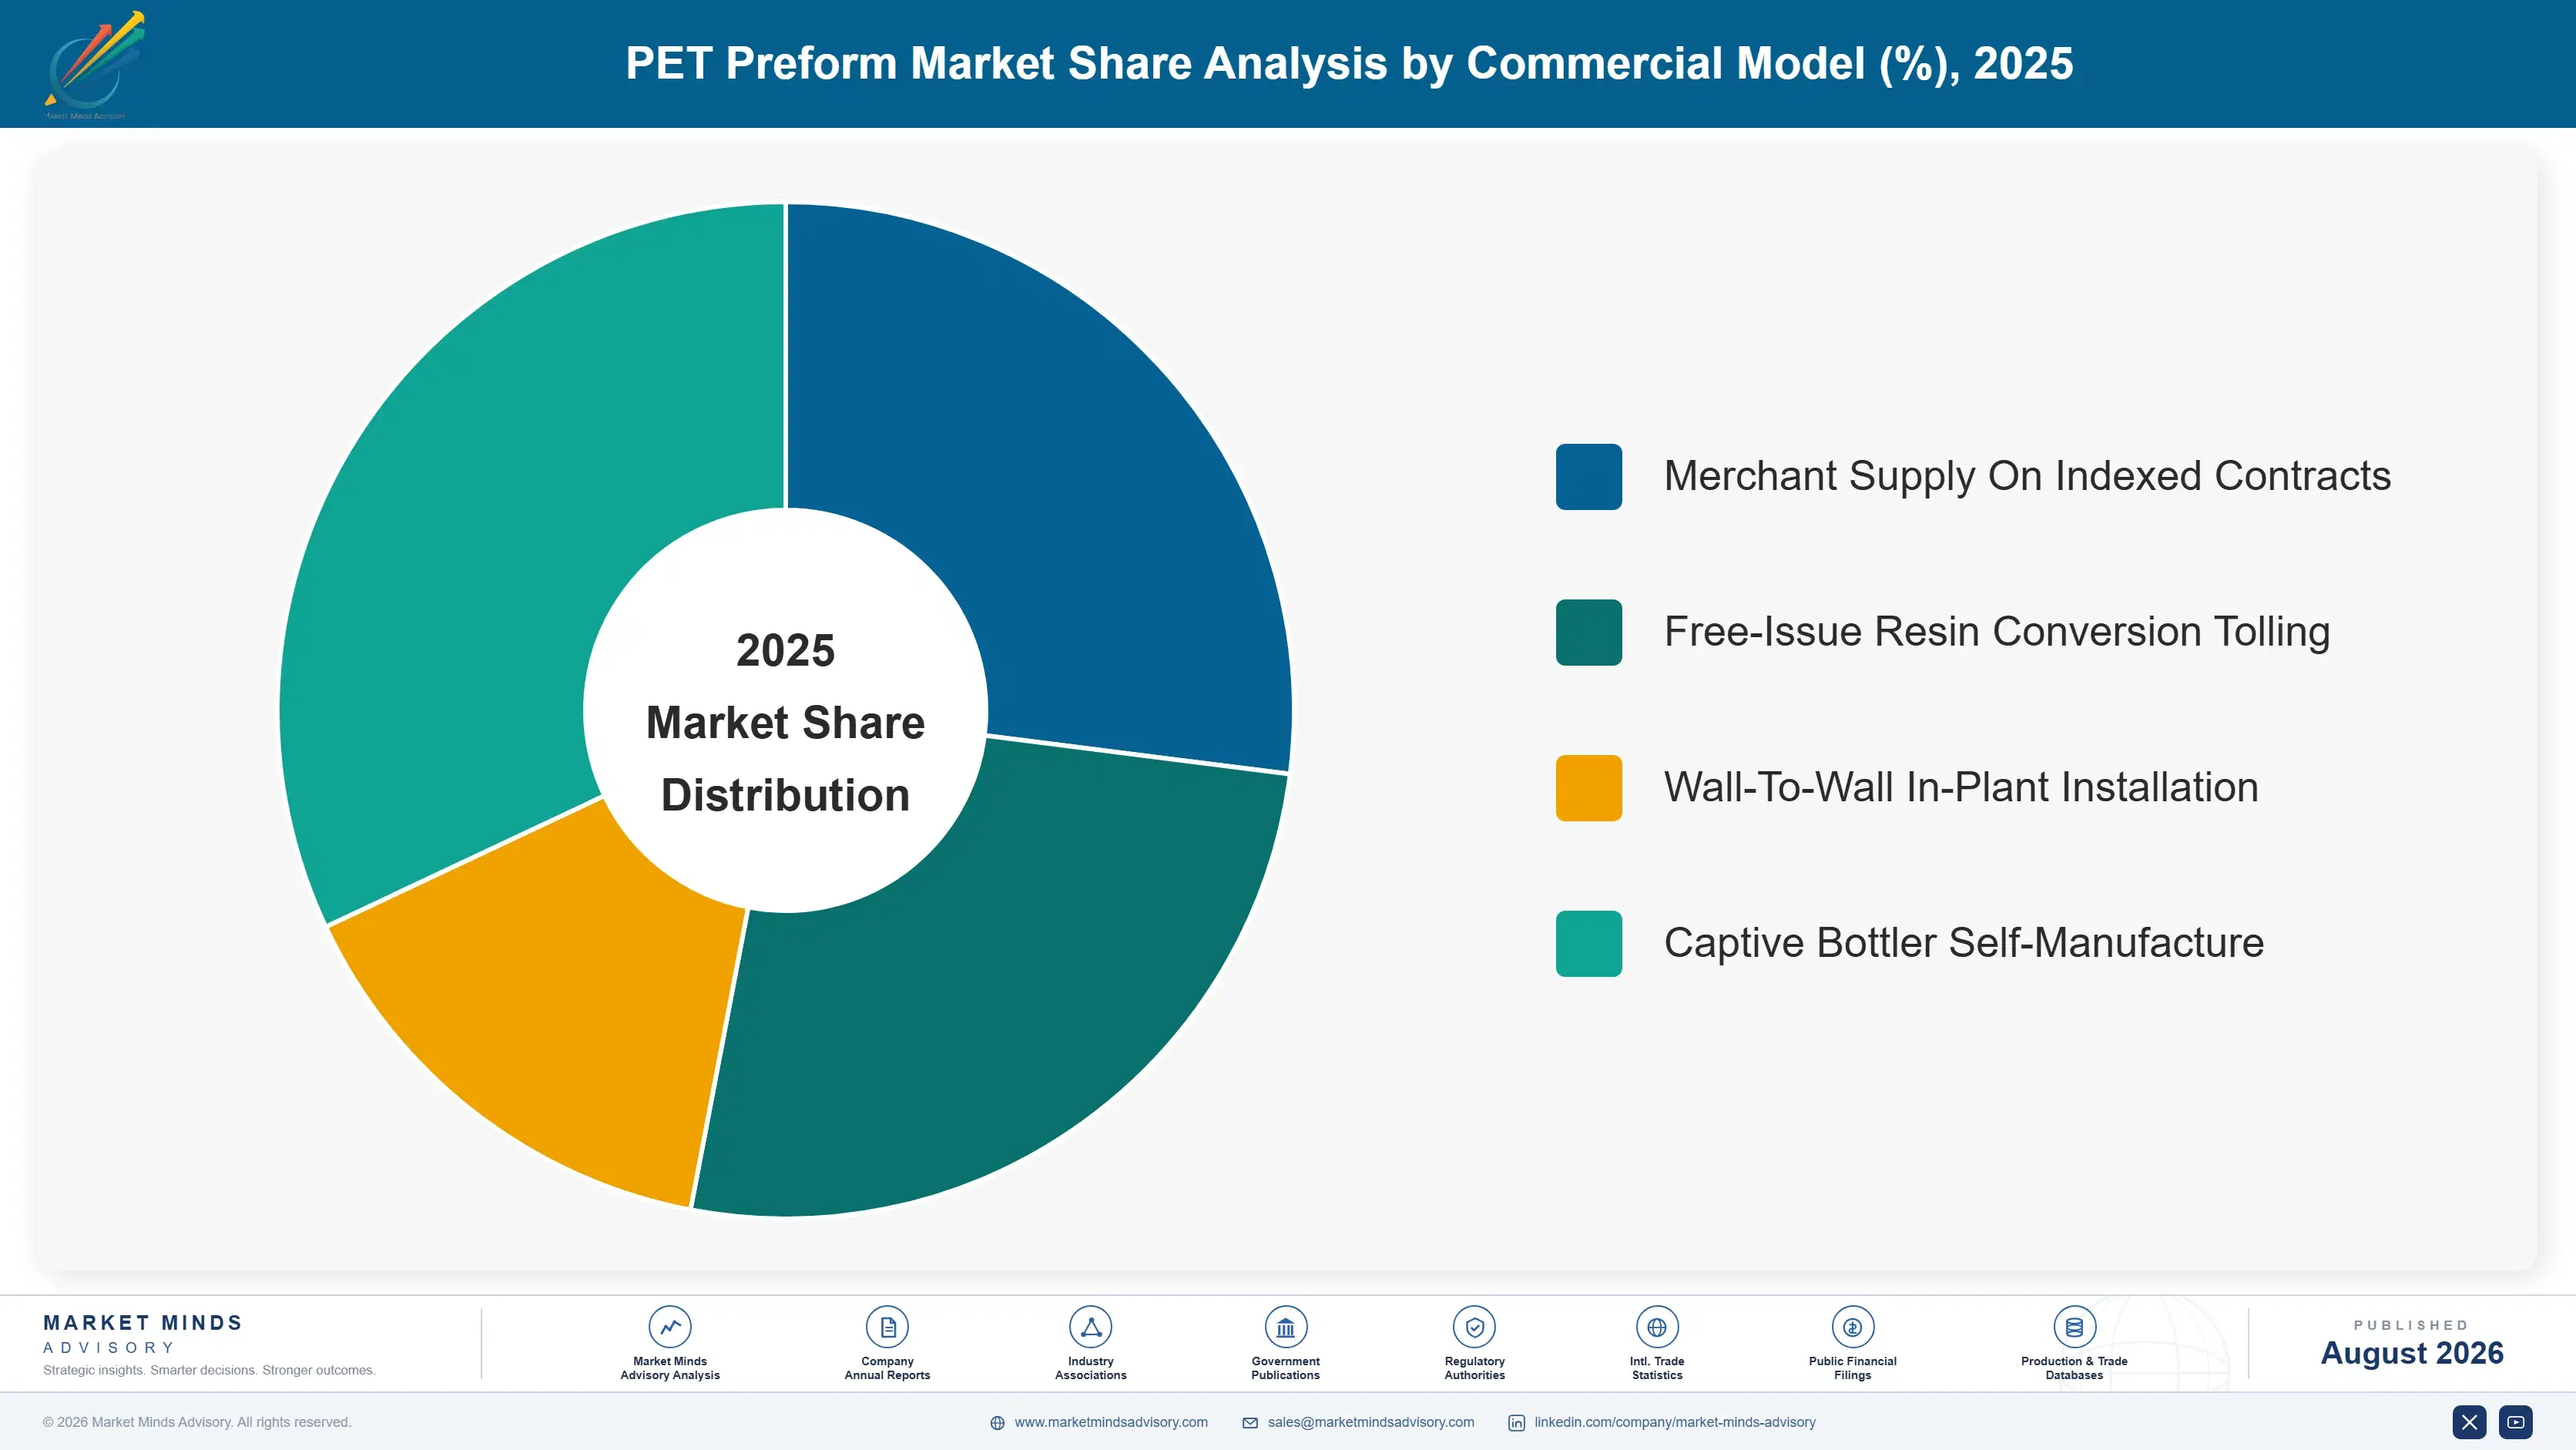
By Commercial Model

  • Merchant Supply On Indexed Contracts
  • Free-Issue Resin Conversion Tolling
  • Wall-To-Wall In-Plant Installation
  • Captive Bottler Self-Manufacture

By Region

  • East Asia
  • South Asia and Pacific
  • North America
  • Western Europe
  • Latin America
  • Middle East and Africa
  • Eastern Europe

Scope, Methodology, and Coverage

Every figure in this report is reproducible from documented input assumptions. The scope below maps the historical period, the forecast horizon, the segmentation dimensions, and the countries covered, alongside the underlying primary and qualitative methodology.
Historical Period
2020 to 2025
Forecast Period
2026 to 2036
Base Year
2025 (USD billions; MMA Primary Research Dataset, August 2026)
Market Definition
This market comprises injection-moulded polyethylene terephthalate preforms produced for subsequent stretch blow moulding into bottles and rigid containers, measured at converter realised prices for merchant volume and at equivalent transfer value for captive bottler production. Construction coverage spans standard monolayer, lightweight short-neck, multilayer barrier, hot-fill and heat-set, wide-mouth, and handleware or large-format preforms across virgin and recycled resin content. Polyester resin manufacture, finished blown bottles, closures and caps, injection and blow moulding machinery, mould tooling supply, and preforms in materials other than polyester fall outside scope.
Quantitative Units
USD billions (current prices); billion preforms shipped; average preform weight in grams
Segmentation Dimensions
By Preform Construction; By End-Use Industry; By Commercial Model; By Region
Regions Covered
East Asia, South Asia and Pacific, North America, Western Europe, Latin America, Middle East and Africa, Eastern Europe
Countries Covered
China, Japan, South Korea, Taiwan, India, Indonesia, Vietnam, Philippines, Thailand, Australia, USA, Canada, Mexico, Brazil, Argentina, Colombia, Chile, Germany, France, UK, Italy, Spain, Poland, Turkey, Saudi Arabia, UAE, Egypt, Nigeria, South Africa, and additional markets relevant to this sector
Key Companies Profiled
Alpla, Plastipak Holdings, Amcor, Indorama Ventures, Retal Industries, Resilux, PDG Plastiques, Novapet, Taiwan Hon Chuan Enterprise, Zhuhai Zhongfu Enterprise, Manjushree Technopack, Chemco Plastic Industries, Parekhplast India, Berry Global, Greiner Packaging, Logoplaste, Envases Group, Nampak, Esterform Packaging, Petainer
Quantitative Methodology
Primary survey, n=3,800 respondents, Q4 2025, six countries; demand-side model with trade association cross-validation
Qualitative Methodology
47 expert interviews, Q4 2025; applied to validate demand model assumptions, identify emerging dynamics, and assess competitive positioning
Report Format
PDF and XLSX data workbook (Word format preview document)
Publisher
Market Minds Advisory
Report Code
MMA-2026-PAC-224
Published
August 2026
Contact
sales@marketmindsadvisory.com | www.marketmindsadvisory.com

Purchase the full PET Preform Market Report (2026 to 2036).

The full report sizes the polyester preform market across six constructions, five end-use industries, four commercial models, and seven regions, with country detail for the twenty largest national markets. Merchant and captive volumes are sized separately throughout, since conflating them badly overstates the addressable market for converters. Conversion cost is modelled by cavity class across the installed injection base, and resin indexation structures are benchmarked by contract type and region. Competitive profiling covers twenty companies on annual preform output. Food-grade recycled resin availability is tracked against mandated content step schedules by jurisdiction.
Merchant and captive volumes sized separately throughout
Conversion cost modelled by cavity class and utilisation
Resin indexation structures benchmarked by contract type
Food-grade recycled availability against mandated step schedules
Preform weight trend by neck finish and application
Wall-to-wall installation economics against inbound freight cost

Built For The People Who Decide

From boardroom strategy to bench-side execution, this report is read cover-to-cover by leaders shaping the next decade of their industry, turning demand scenarios, market dynamics and valuation benchmarks into decisions.
CXOs/ Presidents/ VPs/ Managers
M&A and Corporate Development
Strategy Teams and R&D Heads
Procurement and Product Directors
Regulatory and Compliance Leaders
Investor Relations and Equity Analysts