Market Minds Advisory
Pet Monitoring Camera Market

Pet Monitoring Camera Market: Pet Monitoring Camera Market: Subscription Economics, Owner Anxiety and the Hardware That Barely Pays

Hardware margin has collapsed toward assembly cost while subscription revenue carries the entire business, and the anxiety that drives purchase fades roughly three months after the camera goes on the wall.

Lead Analyst

Published

September 2026

Make Smarter Decisions with Customized Research Insights

Request a free sample report and evaluate market opportunities, growth trends, and competitive dynamics relevant to your business needs.

2025 MARKET VALUE$1.1BMarket Size 2025
2036 FORECAST VALUE$2.9BBase Case , 2026 to 2036
CAGR 2026 TO 20369.4 %Bull 10.7% / Bear 8.1%
INCREMENTAL OPPORTUNITY$1.7BNet 10- year value creation
EXPANSION MULTIPLE2.42x2036 value over 2026 base
Strategic Levers
M&A Pipeline
Regional Outlook
Country Rankings
Competitive Intelligence
Segmental Deep-dive
Call-Us : 91 93563 13602

Executive Snapshot and Market Trajectory.

The device is bought for the owner, not the pet. Every design decision follows from that, and the ones ignoring it fail commercially. Two-way audio is the clearest example: it reassures the person holding the phone and there is credible behavioural evidence it makes canine separation distress worse.
Multi-sensor health monitoring cameras grow at 14.1%, half again the market rate of 9.4%, because respiratory rate and gait analysis from video give the purchase a reason to survive past the novelty period. Interactive play cameras follow at 11.4%. Static indoor cameras grow slowest at 6.8%, squeezed from below by general-purpose security cameras that cost a third as much and do most of the same job.
Subscription attach at roughly 34% carries the entire profit pool, since hardware gross margin now sits in the mid teens after channel cost. The problem is retention: twelve-month subscription retention runs near 41%, because the anxiety that drove the original purchase fades within about 90 days of the camera being installed. Health monitoring is the only feature set that has demonstrably changed that curve. Nothing else has moved the curve at all.
Market Definition
This market covers consumer cameras designed and marketed specifically for remote observation of companion animals, including treat-dispensing, pan-tilt-zoom, interactive play, health-sensing and outdoor pet units, together with the recurring subscription services sold against them. It includes pet-specific firmware and detection features on general-purpose hardware only where the unit is sold as a pet product. General home security cameras, GPS pet trackers, wearable collars, automatic feeders without cameras and veterinary imaging equipment are excluded.
Base Year Value
$1.1B in 2025 (MMA Primary Research Dataset, September 2026)
Forecast Period
2026 to 2036, eleven discrete annual values
CAGR
9.4% base case. Bull 10.7%. Bear 8.1%.
Fastest Growth Segment
Multi-Sensor Health Monitoring Cameras: 14.1% CAGR
Fastest Growth Country
China: 12.8% CAGR
Fastest Growth Region
South Asia and Pacific: 11.5% CAGR
Largest Region
East Asia: 30% of 2025 global value
Market Leaders
Tomofun, Anker Innovations, Petcube, Wyze Labs, Xiaomi. Source: MMA Primary Research Dataset, July 2026.
Primary Survey
n=3,800 procurement and R&D decision-makers, Q4 2025, six countries
Methodology
Demand-side build-up, cross-validated against public data, 47 expert interviews

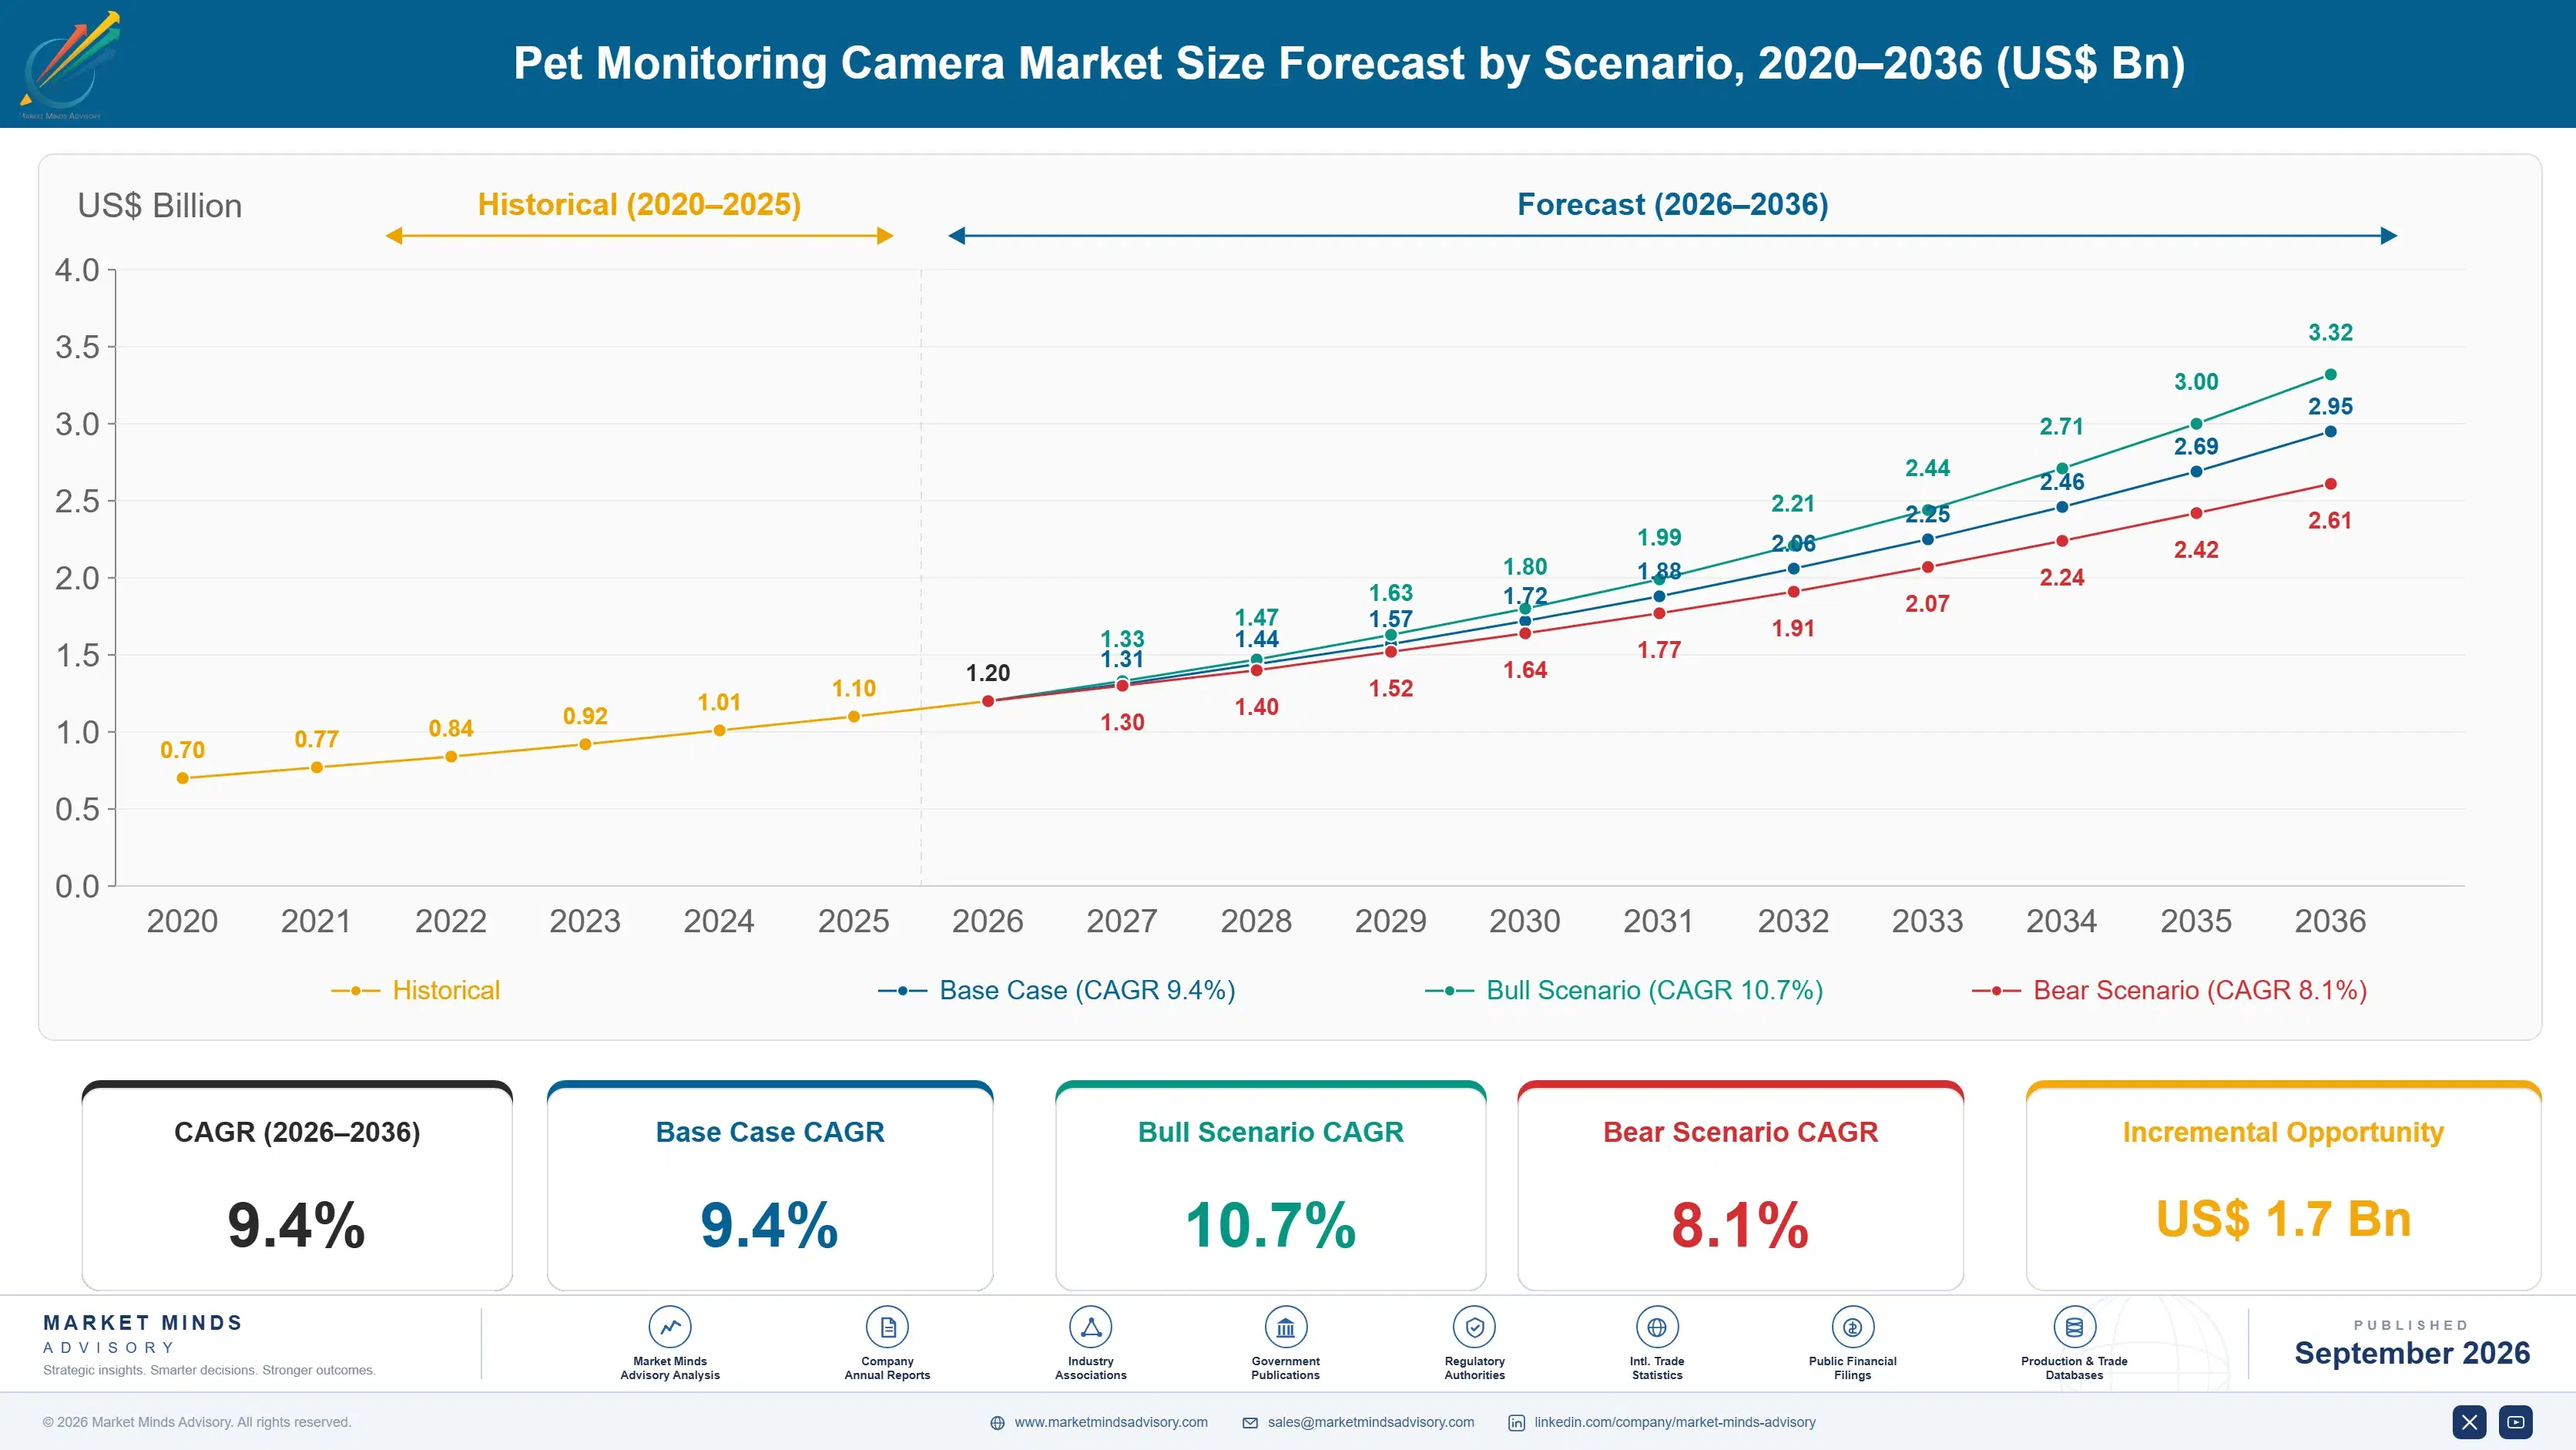
Pet Monitoring Camera Market Forecast Scenarios

pet-monitoring-camera-market-size-forecast-scenario-1790021421484
Growth of 8.3% between 2020 and 2025 came in two distinct movements rather than one trend. Pandemic pet acquisition drove a sharp unit surge through 2020 and 2021, then unit growth stalled in 2022 and 2023 as those animals stopped being novel and general-purpose cameras undercut the category on price. Recovery since has been subscription-led rather than hardware-led, which is a different business.
Three mechanisms carry the base case. Health sensing gives the subscription a clinical justification that outlasts the anxiety phase, and it is the only feature that has moved twelve-month retention. Chinese domestic pet ownership continues expanding from a base that was negligible a decade ago, and cameras are a default first accessory there rather than a considered purchase. Image sensor costs keep falling, protecting hardware margin as selling prices decline.
The bull case is veterinary integration: if health monitoring output becomes something a clinic will actually accept and bill against, retention moves from consumer-discretionary to quasi-medical and the subscription stops churning. The bear case is commoditisation from below. General-purpose cameras from TP-Link and Imou already ship pet detection as a firmware feature at a third of the price, and firmware is cheap to copy.

Hardware Sells Once, Anxiety Renews Monthly

The commercial structure here is inverted from what the packaging suggests. Hardware carries gross margin in the mid teens after retail channel cost, and several participants sell the device at or below assembled cost to acquire a subscriber. The service tier behind it runs at gross margins above 70%. That means the real product is a monthly payment and the camera is the acquisition cost. Every strategic question here resolves back to that fact.
TOP FIVE CONCENTRATION41%Combined unit share held by the five largest participants
SUBSCRIPTION ATTACH RATE34%Buyers who activate a paid service after the trial ends
AVERAGE SELLING PRICEUSD 148Weighted global selling price across all device categories
CHINA MANUFACTURING SHARE87%Units assembled in Chinese contract facilities regardless of brand origin
TWELVE MONTH RETENTION41%Subscribers still paying one year after their initial activation
REPLACEMENT CYCLE LENGTH3.4 yearsAverage interval before owners replace or abandon a unit
Retention is where the category lives or dies, and the numbers are unflattering. Twelve-month subscription retention of about 41% reflects a purchase driven by acute separation anxiety in the first weeks of pet ownership, which resolves on its own timescale. MMA survey work with 3,800 respondents across six countries found median daily app opens falling from 11 in the first month to under two by month four.
Detection quality is the other unspoken problem. Bark and motion alerts generate enough false positives that most owners disable them within weeks, and pet detection models are trained overwhelmingly on dogs, which leaves cat performance materially worse. Health sensing is the first feature that improves with use rather than degrading. Owners who disable alerts cancel within weeks.
"This category sells a device that measures how much the owner misses the animal, then charges monthly for the reassurance. The participants who understand that build for the fourth month, not the first week, and almost nobody does."
Principal Analyst, Connected Consumer Devices Practice · MMA Technology Practice · September 2026

Market Trends

Health Sensing Moves Cameras Beyond Reassurance Devices

Respiratory rate extraction from video, gait irregularity detection and activity baselining have moved from research demonstrations into shipping products over the past three years. The commercial point is not clinical accuracy, which remains limited, but retention: a subscription that reports a trend line gives the owner a reason to keep paying after separation anxiety resolves. Units carrying these features hold twelve-month retention roughly 22 points above the category average. Development cost is largely software rather than sensor hardware, which is why the feature has spread faster than most in this category.
Market Impact: Adds 120 million potential households
General Purpose Cameras Absorb The Entry Tier

TP-Link, Imou and EZVIZ now ship pet and animal detection as standard firmware on general-purpose indoor cameras priced near USD 35, against a category average selling price of USD 148. The hardware is functionally similar: same sensor class, same pan-tilt mechanism, same cloud tier. What the pet-specific brands retain is treat dispensing, interactive play and the health features, all of which require mechanical or algorithmic work the general-purpose players have not attempted. The entry tier of the pet category is disappearing into the security category and is unlikely to return.
Market Impact: Service margin exceeds 70%

Market Opportunities and Growth Drivers

Chinese Urban Pet Ownership Expands From Negligible Base

Urban companion animal populations in China have grown to well over 120 million cats and dogs from a base that barely registered fifteen years ago, and the ownership pattern differs meaningfully from Western markets. Single-occupant apartments, long commutes and small living spaces make remote observation an assumed part of pet keeping rather than an optional accessory. Domestic brands sell capable units near USD 45, so unit penetration is running well ahead of what revenue share alone suggests. China grows at 12.8%, the fastest of any single national market covered here.
Market Impact: App opens fall 82%

Subscription Attach Economics Justify Hardware Sold At Cost

Service tiers run at gross margins above 70% against hardware in the mid teens, which changes what a participant can rationally pay to acquire a customer. Several brands now sell devices at or below assembled cost during promotional periods, treating the camera as customer acquisition spend rather than as a product. Attach rate of about 34% makes that arithmetic work at current retention. It stops working immediately if either number falls, which is why health sensing has attracted development budget out of proportion to its current usage. The arithmetic is fragile in both directions at once.
Market Impact: Cat accuracy trails by 18 points

Market Restraints and Challenges

Owner Anxiety Fades Long Before Subscription Renewal

The purchase trigger is acute separation distress in the owner during the first weeks of pet ownership, and it resolves naturally. MMA survey work across 3,800 respondents in six countries found median daily app opens dropping from 11 in month one to below two by month four. The root cause is that the device solves an emotional state rather than a persistent need, and emotional states have a half-life. Participants are responding with health trend reporting, veterinary data export and multi-pet household features that give the subscription a function beyond watching.
Market Impact: Lifts retention 22 points higher

Detection Models Perform Materially Worse On Cats

Pet detection and behaviour classification models are trained overwhelmingly on dog video, because dog owners generated most of the early training data and dogs are easier to segment against furniture. Cat detection accuracy runs roughly 18 points below dog accuracy in MMA testing across leading platforms. The commercial impact is real: cats outnumber dogs in several major markets and their owners churn faster after experiencing repeated missed events. Vendors are addressing it with cat-specific training sets and by adding thermal or depth sensing, but neither approach ships at volume yet.
Market Impact: Undercuts category price by 76%
4 additional market trends, 3 additional growth drivers, and 2 additional restraints and challenges are covered in the full report. Contact sales@marketmindsadvisory.com to access the complete intelligence.

Segment CAGR and Growth Architecture

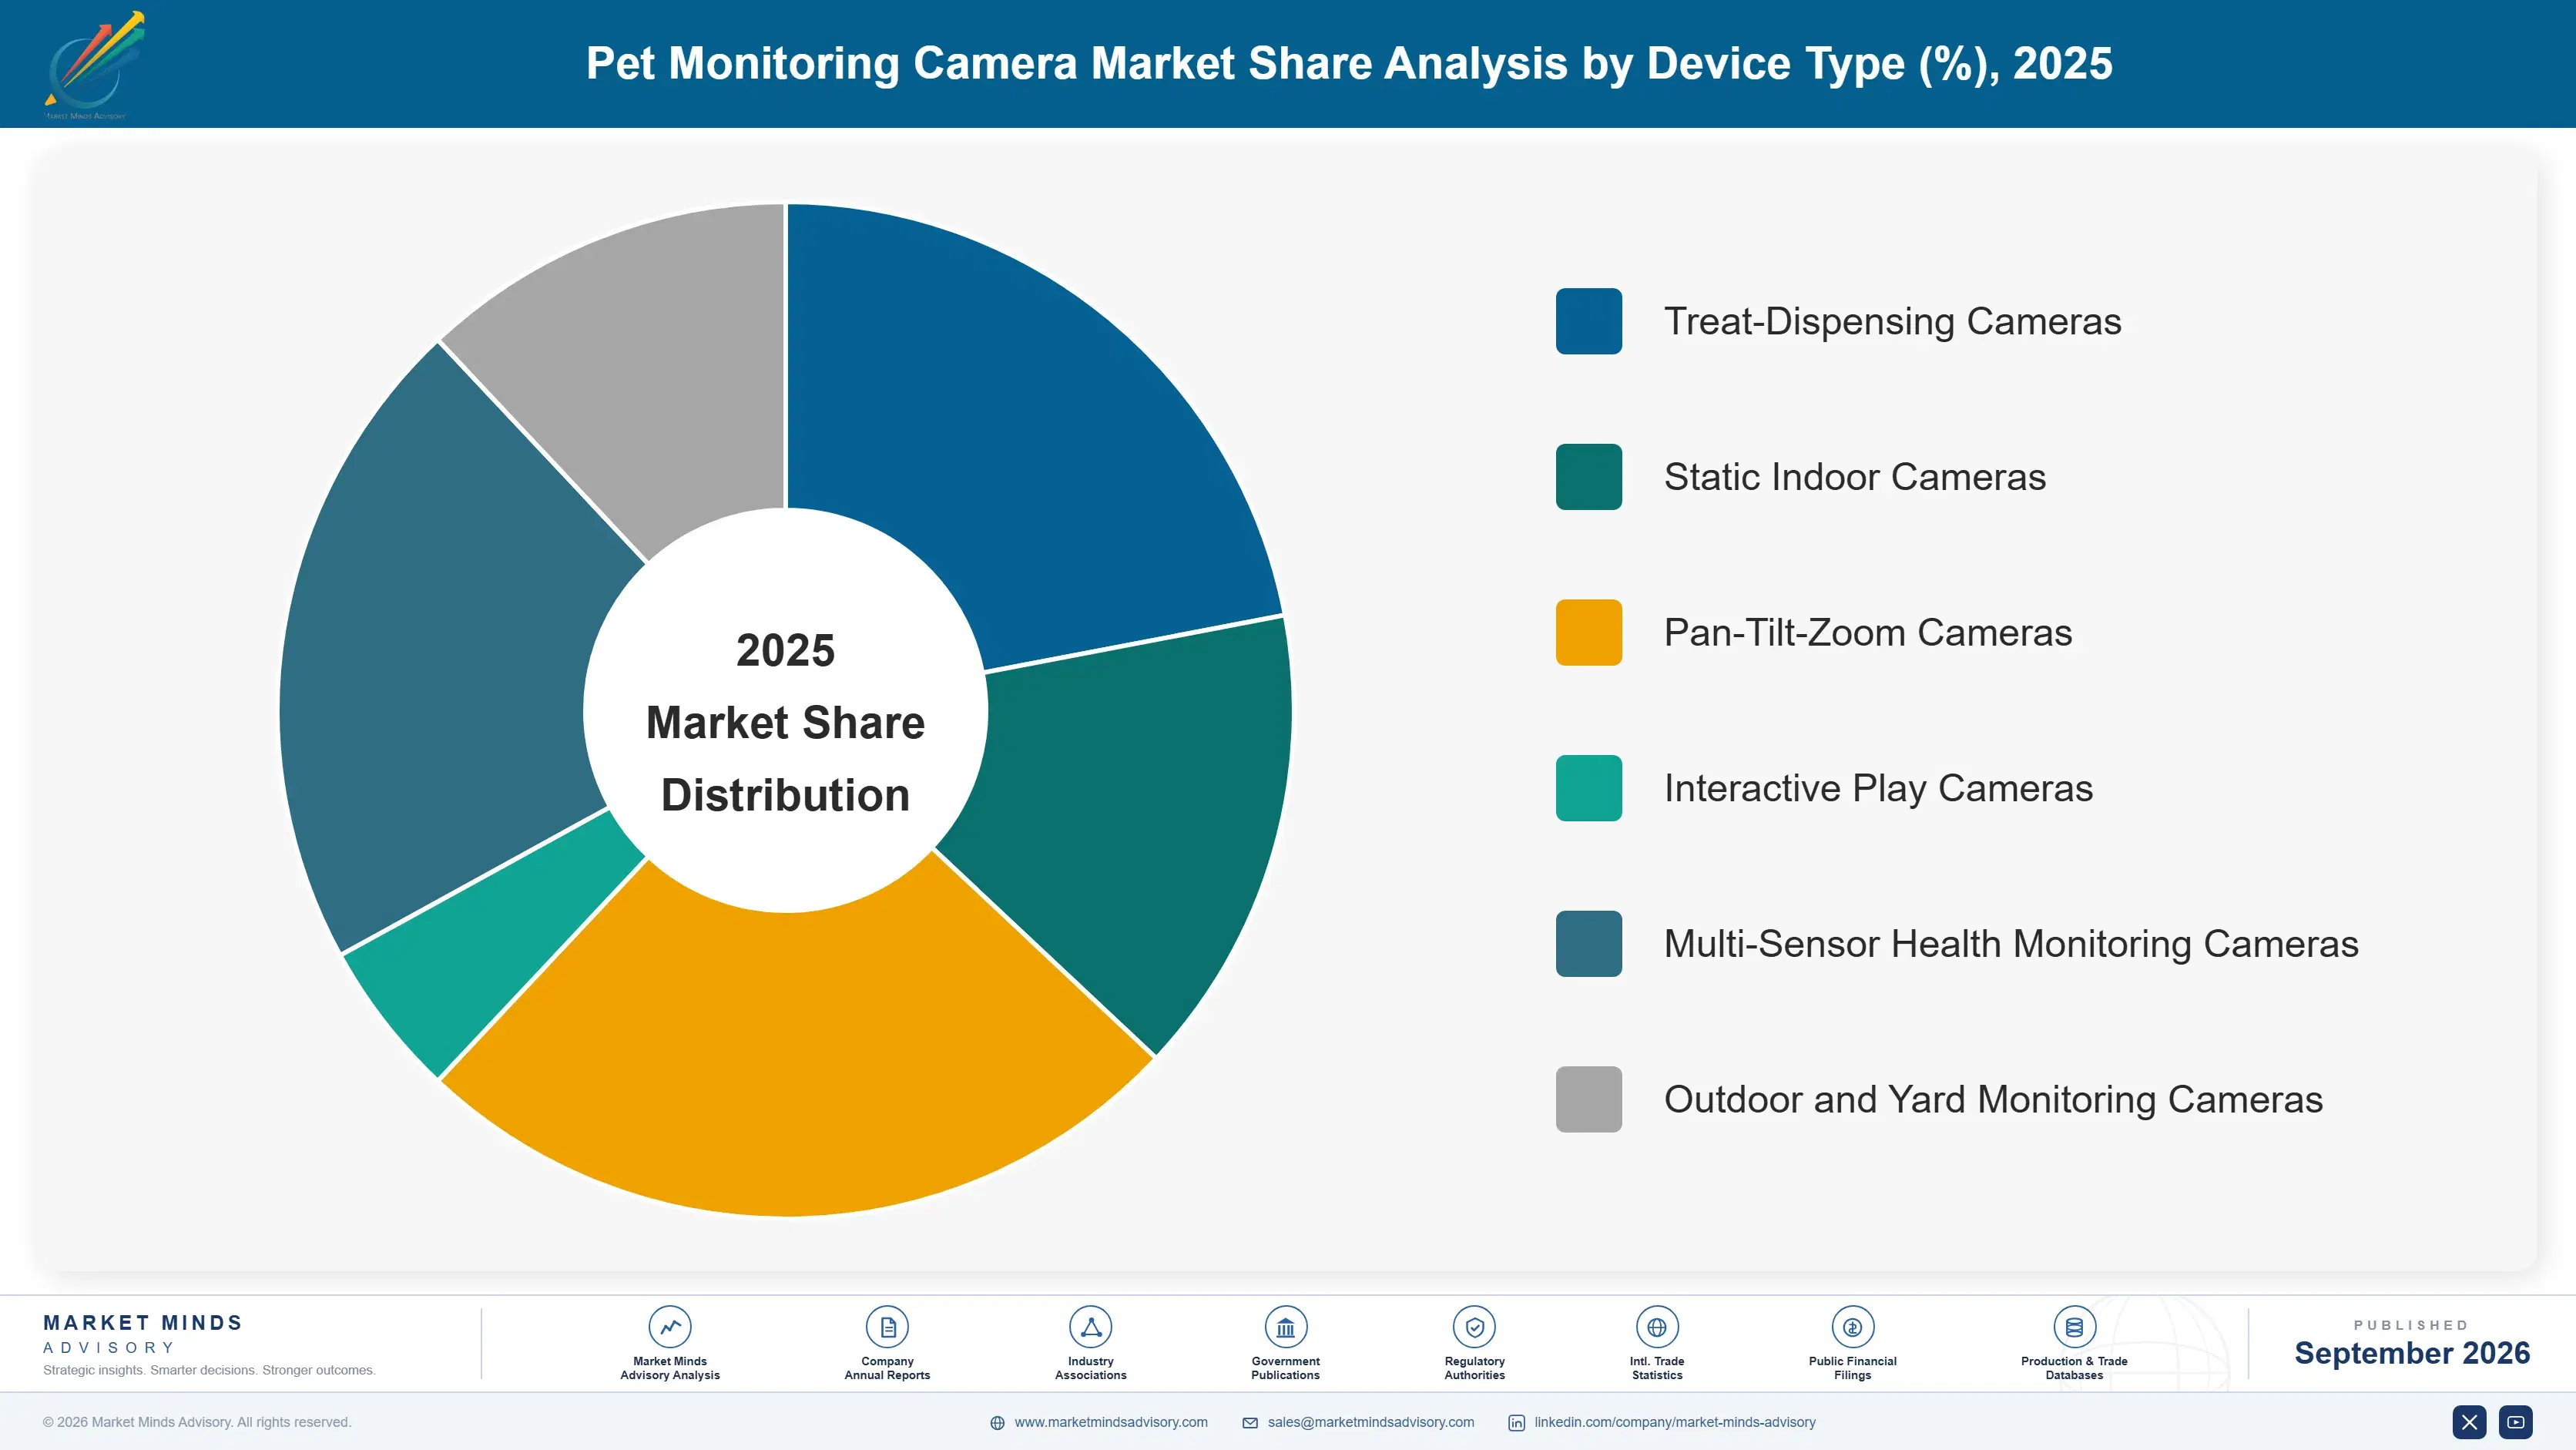
Segmentation follows device type, the dimension on which bill of materials, mechanical design and retail positioning all divide in this category. Six device types are assessed. Wearable trackers, camera-free feeders, general home security hardware and veterinary imaging equipment fall outside the defined scope. Subscription revenue is sized against the device type that generated it.
pet-monitoring-camera-market-market-share-analysis-1790021422047

Multi-Sensor Health Monitoring Cameras

Health monitoring units grow at 14.1%, half again the market rate of 9.4%, and the reason is retention rather than capability. Respiratory rate from video, gait irregularity flagging and activity baselining are all approximate, and none would satisfy a veterinarian on their own. What they do is produce a trend line, and a trend line gives the owner a reason to keep paying after the separation anxiety that prompted the purchase has resolved. Units with these features hold twelve-month retention around 22 points above category average. Development cost sits mostly in software rather than sensors, which is why the feature has spread quickly across the premium tier. Sensor hardware is largely unchanged from the tier below.
CAGR 14.1%

Interactive Play Cameras

Interactive units with laser pointers, moving toys or remote-triggered play mechanisms grow at 11.4% on a smaller base, and they solve a different owner problem than observation does. Guilt rather than worry drives the purchase, and the ability to do something rather than only watch sustains engagement longer than passive units manage. Cat owners buy these disproportionately, which partly offsets the detection accuracy problem elsewhere in the category. Mechanical complexity is the constraint: moving parts fail, laser modules degrade and treat mechanisms jam, and warranty return rates run several points above static units across every brand assessed. Laser modules degrade, treat mechanisms jam, and repair economics never work at these price points.
CAGR 11.4%
Full segment breakdown across 6 segments available in the complete report.

Regional Architecture and Country Demand Map

Regional demand is measured at end-user level in United States dollars, which understates East Asian unit volume considerably because domestic Chinese devices sell near a third of Western prices. Every region sits inside its standard share band in this market. Shares therefore reflect spend rather than adoption.

East Asia

China supplies the demand and the hardware, which is unusual and gives the region its 30% position. Urban companion animal populations have passed 120 million cats and dogs from a base that barely existed fifteen years ago, and small apartments with long commutes make remote observation an assumed part of pet keeping. Domestic brands including Xiaomi, Imou and Skymee sell capable units near USD 45, so penetration runs well ahead of revenue share. Japanese demand skews heavily toward cat-specific and elderly-pet health features, reflecting an older animal population. Korean growth comes from single-occupancy households, the fastest-expanding demographic segment there. Shenzhen contract manufacturing supplies roughly 87% of global units regardless of which brand appears on the box.
Share: 30% | CAGR: 10.6% (2026 to 2036)

North America

At 28% this remains the highest-value region per unit rather than the largest by volume, and average selling prices near USD 210 explain most of the gap. Subscription attach is strongest here at roughly 44%, well above the global average, because United States buyers are already conditioned to monthly service fees on connected home hardware. Treat-dispensing formats dominate the premium tier, with Furbo and Petcube holding the specialty retail position and eufy expanding through general electronics channels. Canadian demand mirrors the United States pattern closely. Veterinary integration pilots are furthest advanced in this region and remain small. Health monitoring tiers attach best in this region, and the cohort acquiring pets since 2023 subscribes considerably higher than the pandemic cohort did.
Share: 28% | CAGR: 8.2% (2026 to 2036)
Regional intelligence for 5 additional markets available in the complete report: Western Europe, South Asia and Pacific, Latin America, Middle East and Africa, Eastern Europe. Contact sales@marketmindsadvisory.com.
pet-monitoring-camera-market-country-cagr-analysis-1790021422573

Four Moves That Change Retention

Each of these four addresses the retention problem rather than the acquisition problem, because acquisition in this category is already efficient and retention is not. All four have been executed by at least one participant with measurable results, and all four operate on software, notification logic and pricing rather than on sensor hardware or manufacturing arrangements.

Ship Health Trend Reporting At Every Price Point

Health sensing currently sits behind premium hardware, which limits its retention benefit to the customers least likely to churn anyway. Respiratory rate and activity baselining run on video that entry-level sensors already capture, so the constraint is product positioning rather than capability. Participants extending trend reporting down the range hold twelve-month retention around 22 points above category average across the whole installed base. The cost is a firmware update and additional cloud processing. The revenue effect compounds, since every retained subscriber at month twelve is worth roughly four times an acquisition.
Market Impact: Raises twelve month retention by 22 full points

Build The Fourth Month Into Onboarding

Median daily app opens fall from 11 in month one to below two by month four, and almost no participant designs for that transition. A scheduled shift in notification character around week ten, from event alerts toward weekly summaries and health trends, holds engagement materially better than letting the alert volume simply become annoying. Participants running this pattern report month-four engagement roughly 1.9 times that of default onboarding. It costs nothing to build beyond notification logic. The alternative is a customer who disables alerts and then cancels. Cancellation clusters tightly in months five and six across every household type examined.
Market Impact: Raises month four engagement to 1.9 times higher

Train Detection Models Specifically On Cats

Cat detection accuracy runs about 18 points below dog accuracy across leading platforms, and cats outnumber dogs in several major markets. Cat owners consequently churn faster after repeated missed events, which is a solvable data problem rather than a sensor limitation. Building a cat-weighted training set from existing customer footage, with consent, closes most of the gap within a release cycle. The commercial return concentrates in Japan, Western Europe and the United States, where feline households are numerous and every major participant currently serves them measurably worse than canine ones.
Market Impact: Closes an 18 point feline detection accuracy gap

Price Subscriptions In Local Currency Everywhere

Dollar-denominated subscription pricing in Brazil, Mexico, Poland and India produces cancellation spikes whenever the local currency moves, which is frequently. Participants who moved to local currency pricing report churn in those markets falling by roughly 27% within two quarters, with no change to the underlying service. The obstacle is billing infrastructure rather than commercial logic, and it is a one-time engineering cost against a permanent retention gain. Emerging market volume is where growth sits, and dollar pricing quietly taxes it. Cancellation spikes track exchange rate movements almost exactly, which makes the diagnosis straightforward once anyone looks.
Market Impact: Cuts emerging market subscription churn by roughly 27%

Who Controls the Margin Pool

Concentration is moderate at 41% held by the top five, measured on unit shipments of pet-specific monitoring cameras into consumer channels rather than on revenue. The leader to challenger gap is wide in subscription infrastructure and detection model quality, both of which take years and installed base to build, and almost absent in hardware, where the same Shenzhen contract manufacturers serve nearly everyone.
Competition runs on three dimensions at present. Detection accuracy decides whether alerts get disabled, which decides retention. Subscription pricing and packaging decide attach rate at the point of sale. Retail shelf position in specialty pet channels still matters in North America and Western Europe, where the category is bought as a pet product rather than as an electronics purchase, though that is weakening each year.

Pressure is building from general-purpose camera makers who now ship pet detection as firmware at a third of the price, and that is where rankings will move. Participants holding only entry-tier hardware positions face the sharpest exposure. The defensible ground is health sensing and mechanical interaction, since neither is a firmware feature a security camera vendor can add without redesigning the product.
pet-monitoring-camera-market-company-positioning-matrix-1790021423100

Competitive Moat and Risk Dimensions

TOMOFUN

Moat: Detection Data And Brand

Furbo has accumulated years of labelled dog behaviour footage that no competitor can replicate quickly, and detection accuracy on dogs is measurably better as a result. The brand also holds specialty pet retail placement in North America and Japan that electronics-channel competitors struggle to obtain, since buyers there treat the purchase as a pet decision.
TOMOFUN

Risk: Dog Focused Data Advantage

The same training data concentration that produces class-leading dog detection leaves cat performance well behind, and feline households outnumber canine ones in Japan and several European markets. Correcting it means building a comparable cat dataset from a much smaller installed base, which takes time the general-purpose competitors are using to close the gap.
ANKER INNOVATIONS

Moat: Manufacturing Scale And Channel

The eufy position benefits from Anker's existing consumer electronics manufacturing scale and its established general retail distribution across North America, Europe and Asia. Component costs land below what pet-specialty brands achieve at their volumes, which supports the local-storage proposition that Western European regulation has made commercially important.
ANKER INNOVATIONS

Risk: Local Storage Undermines Subscriptions

Positioning around local storage without monthly fees wins buyers in privacy-sensitive markets and forfeits the 70% margin service tier that funds everyone else's development. Growing hardware share while the profitable half of the business model sits with competitors is a difficult position to hold if hardware pricing continues falling.

Players Tracked

Prominent Players

Tomofun
Anker Innovations
Petcube
Wyze Labs
Xiaomi

Other Key Players

Arlo Technologies
TP-Link
Amazon
Google
Skymee
Pawbo
Radio Systems
Dogness International
Reolink
Dahua Technology
Hikvision
Waggle
Enabot
SwitchBot
Aqara

Recent Developments

FEBRUARY 2025

Anker Innovations introduces on-device pet detection processing

The company launched eufy pet camera models running detection entirely on device rather than in cloud infrastructure. This was a product introduction rather than any partnership or acquisition, and it directly targets Western European privacy requirements that have suppressed subscription attach there. Cloud recording remains available as an option.
Signal: European regulation now shapes hardware architecture itself rather than only the data handling policies written around it.
AUGUST 2024

Tomofun restructures Furbo Nanny subscription pricing tiers

The company revised its service pricing, separating health monitoring features into a higher tier and reducing the entry price of basic cloud recording. The change was a unilateral commercial decision with no external party involved at any point. Existing subscribers migrated on renewal rather than immediately.
Signal: Health sensing is being priced as the retention feature rather than bundled as a general premium addition.
NOVEMBER 2024

Dogness International commissions additional Guangdong manufacturing capacity

The company brought new production capacity online at its Guangdong facility covering connected pet products including camera units. This was organic capital expenditure funded internally, not a joint venture, and it serves both own-brand and contract manufacturing demand. The facility already produced feeders and connected collars before the expansion.
Signal: Contract manufacturing capacity is expanding ahead of demand, which suggests further hardware price compression. Hardware prices have further to fall.

What The Bill Of Materials Hides

Image sensor and system-on-chip together account for roughly 38% of bill of materials, sourced almost entirely from Sony Semiconductor Solutions, OmniVision and a small group of Chinese SoC designers. Injection-moulded ABS enclosure and the pan-tilt mechanism add about 19%, with mechanical content considerably higher on interactive and treat-dispensing units. Cloud storage and video egress sit outside the bill of materials entirely and consume roughly 14% of subscription revenue.
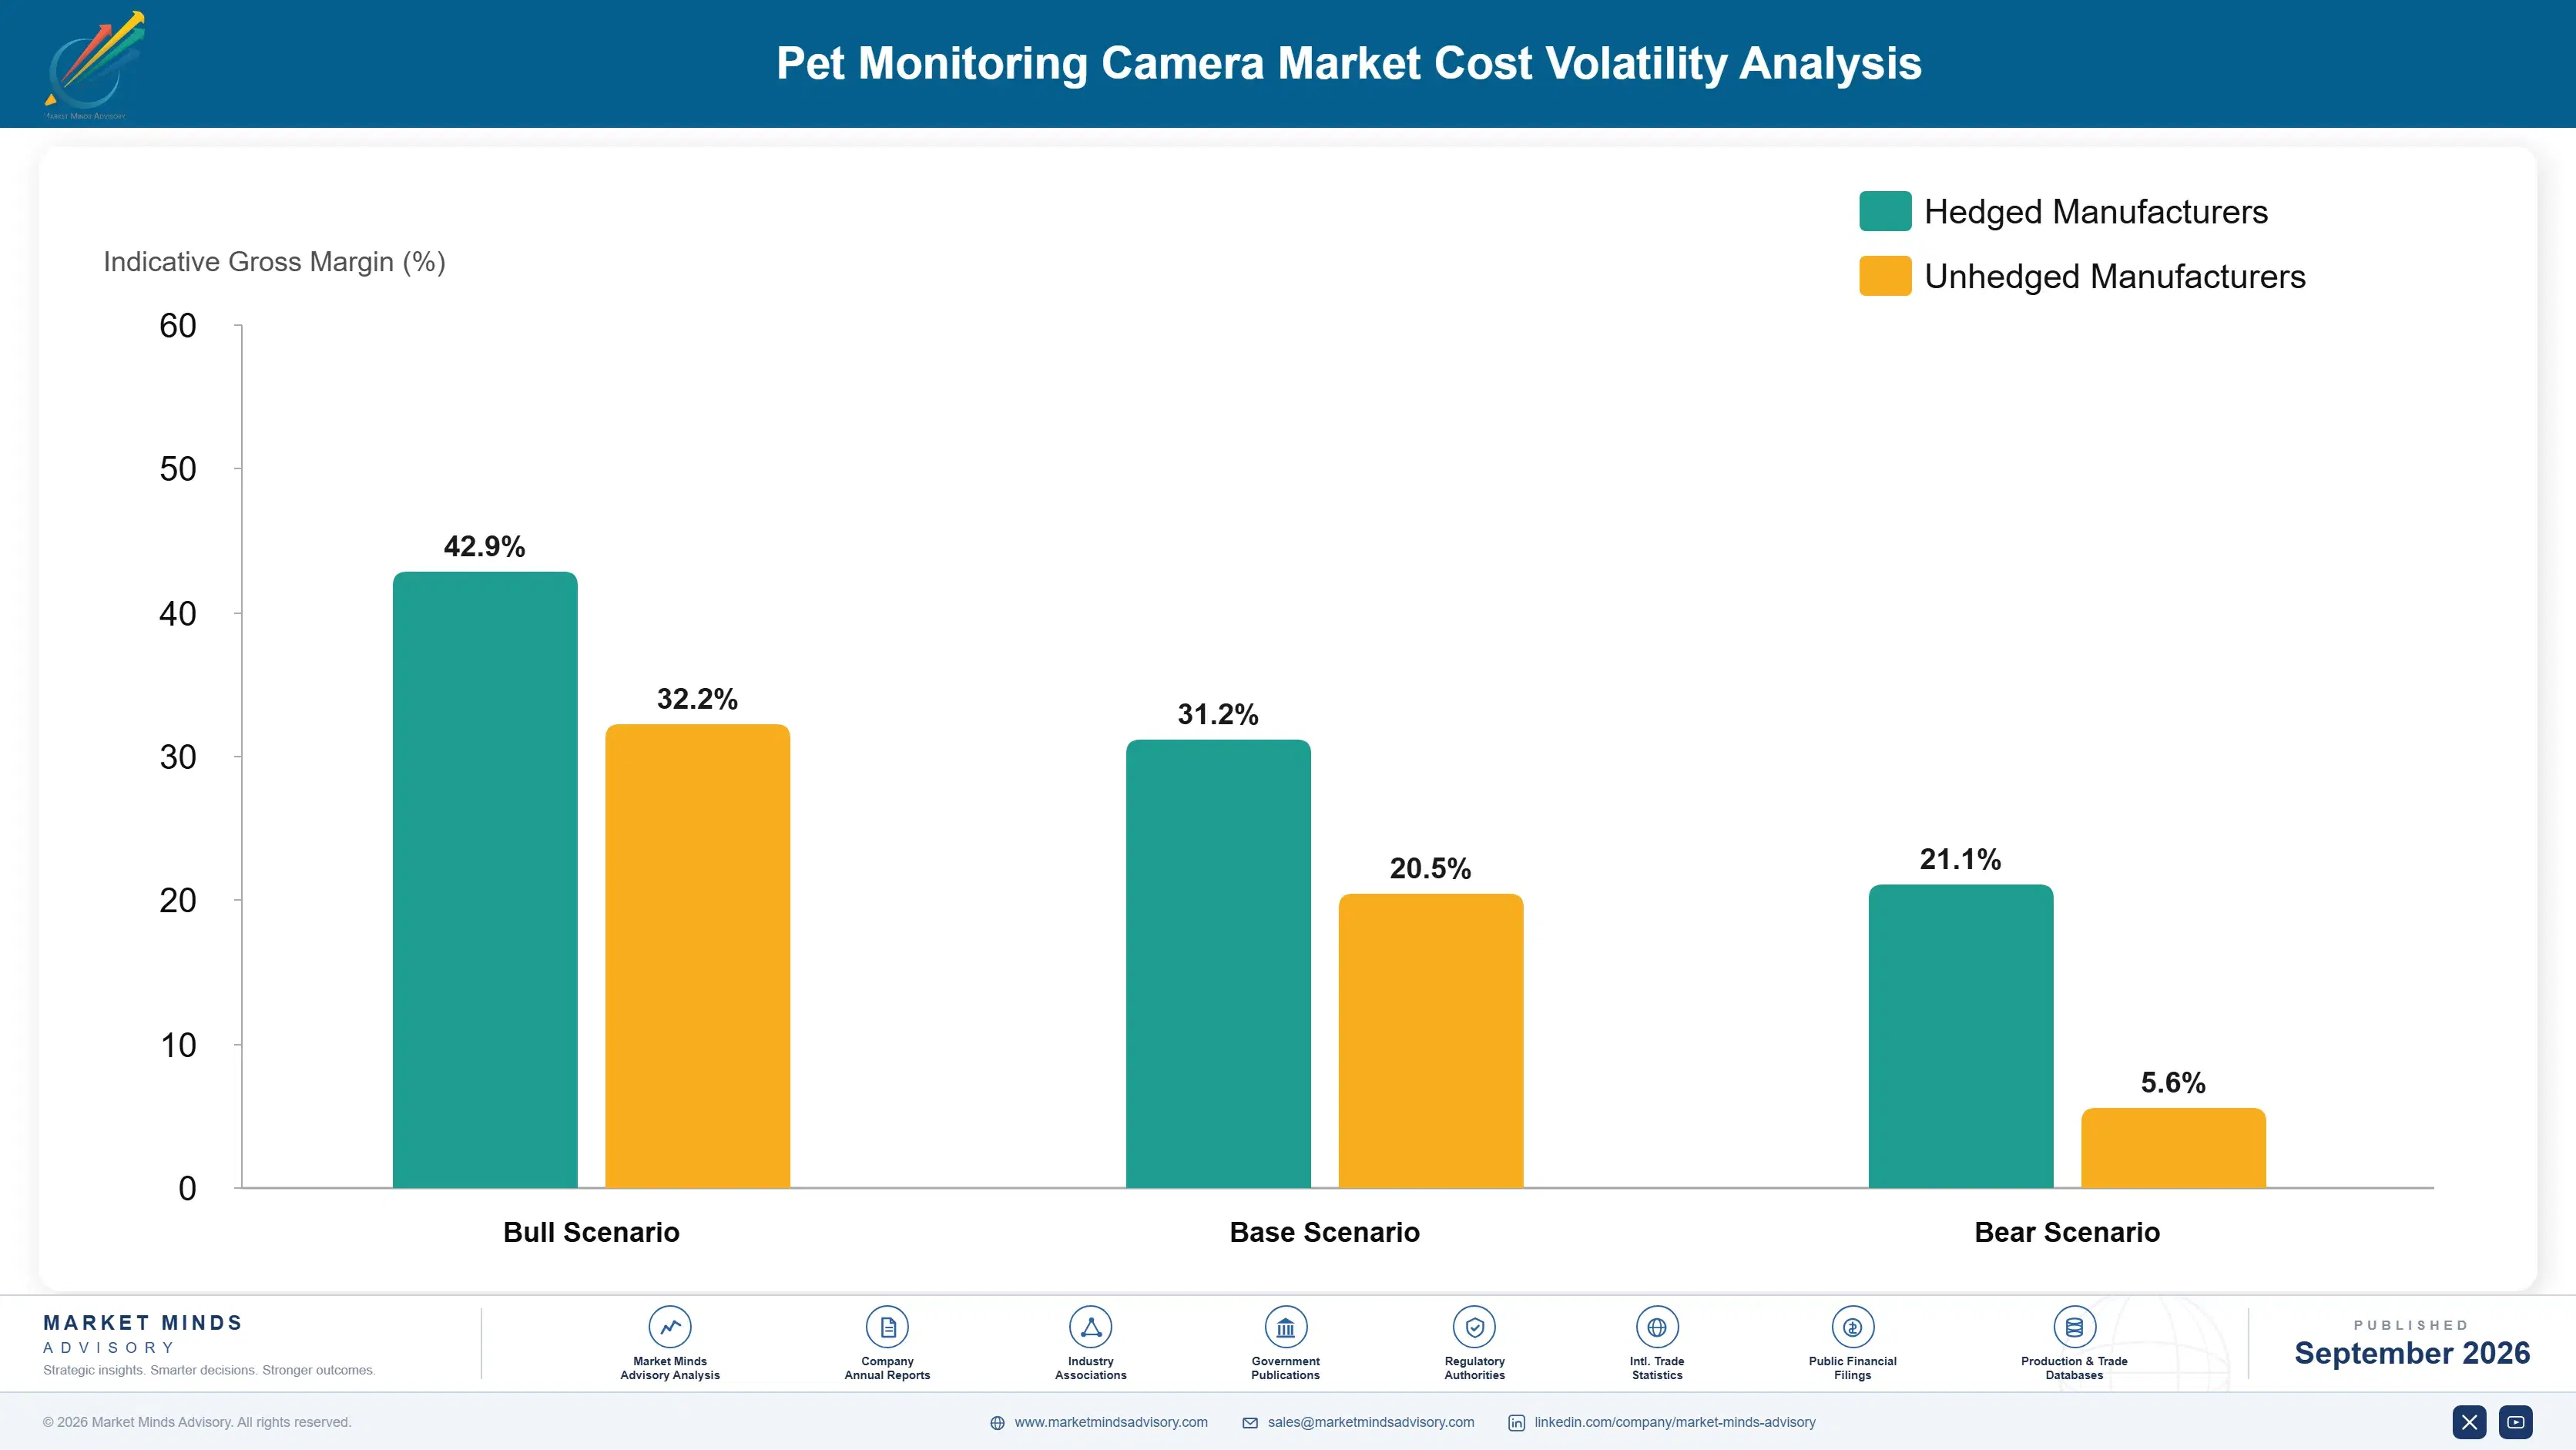
The 2021 to 2022 image sensor shortage demonstrated how exposed this structure is. CMOS sensor allocation moved toward automotive and smartphone customers, and consumer camera makers saw lead times extend past forty weeks while spot pricing on comparable sensors roughly doubled. Sony's annual reports for those years describe capacity allocation decisions favouring higher-value applications, and several participants shipped reduced specifications rather than miss a holiday season.

Exposure varies sharply by participant type and it decides who survives a price war. Brands with electronics manufacturing scale buy sensors on annual contracts at volumes that command allocation priority. Pet specialty brands buy through contract manufacturers at whatever terms are available, which is why their hardware margin sits several points lower. Chinese domestic brands using local SoC designs avoid the exposure almost entirely.
pet-monitoring-camera-market-cost-volatility-analysis-1790021423297

Qualify a second sensor supplier before allocation tightens

Dual-sourcing image sensors across Sony and OmniVision equivalents requires firmware work and a separate certification pass, and most participants only begin once they have already been caught short. Qualifying ahead of shortage costs a development cycle. Not qualifying costs a selling season, which is considerably more expensive in a category this seasonal. Seasonality punishes hesitation here.

Move detection processing on device to cut egress cost

Video egress and cloud storage consume roughly 14% of subscription revenue, and most of that traffic is footage nobody watches. Running detection on device and uploading only flagged events cuts that cost substantially while also addressing European privacy requirements. The trade is a more expensive processor against permanently lower recurring infrastructure cost. Both benefits arrive from one decision.

Standardise mechanical parts across the interactive product range

Treat mechanisms, pan-tilt assemblies and laser modules currently differ between models at most participants, which multiplies tooling and spare part cost across a range that already carries elevated warranty returns. Common mechanical platforms across interactive units reduce both. Mechanical failure is the largest single warranty driver in this category by a wide margin. Tooling cost falls alongside it.

Portfolio Architecture for Margin Defence

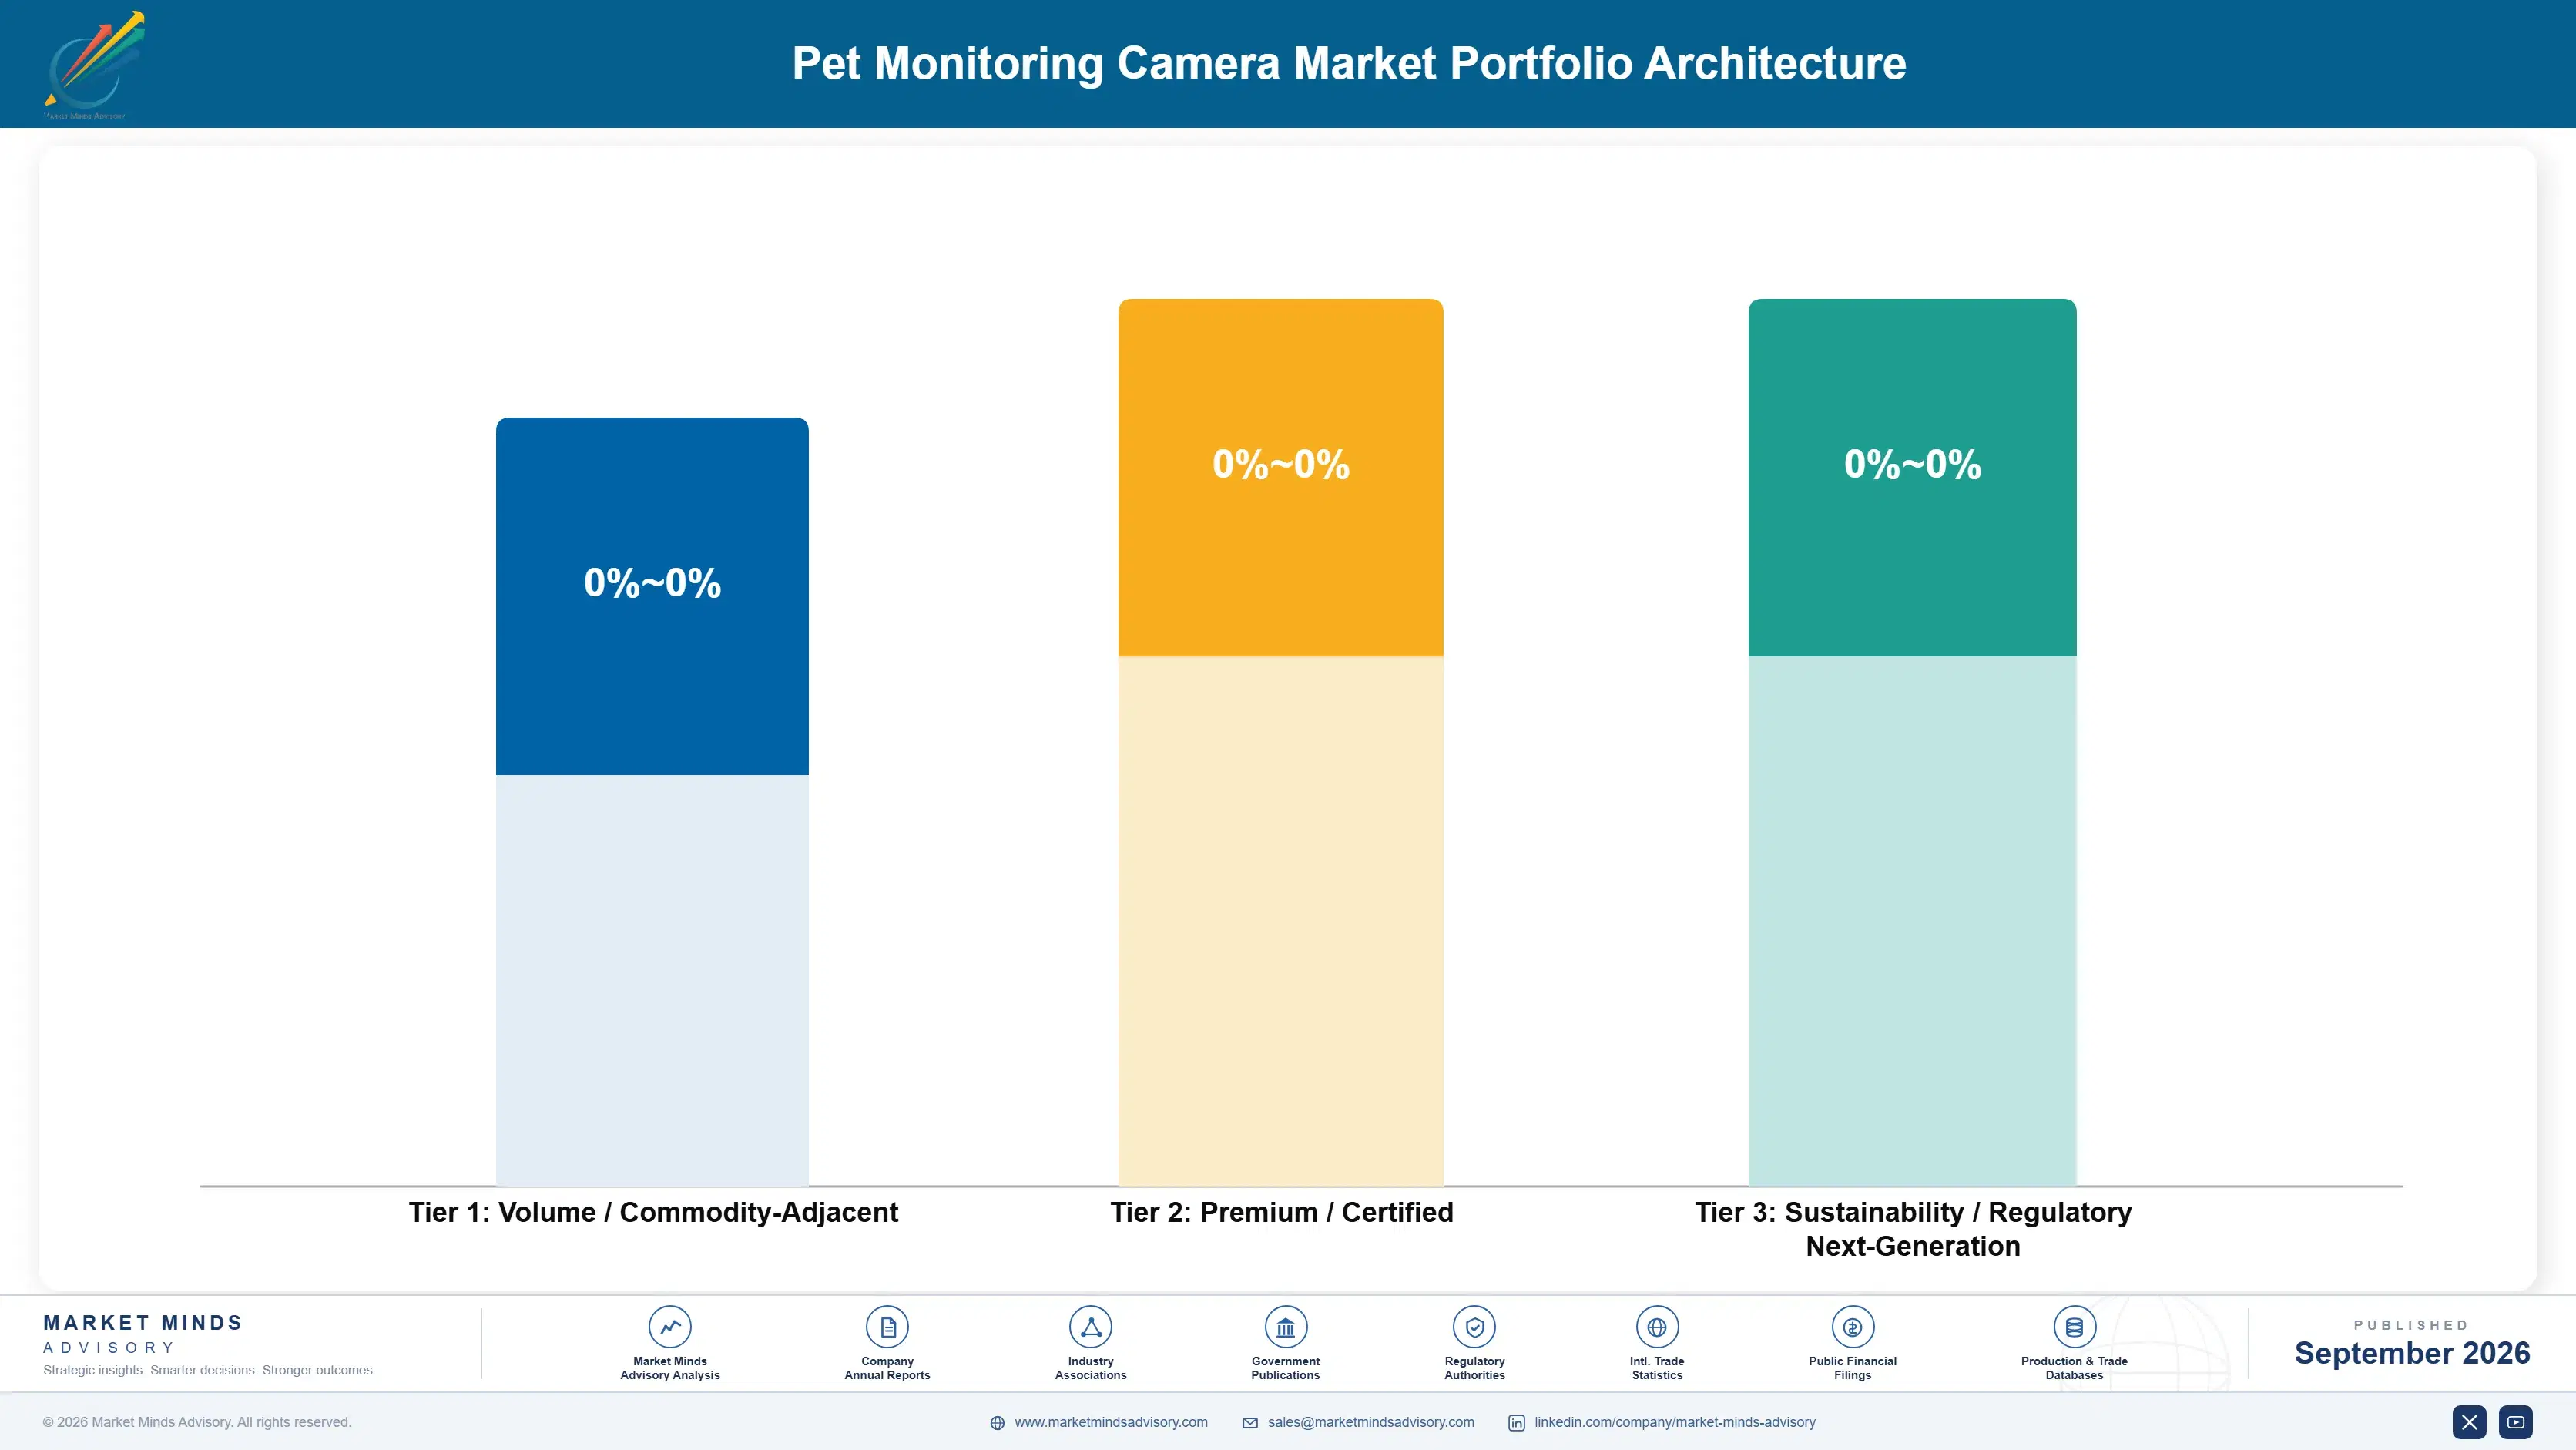
Margin architecture divides between hardware and service in a way few consumer categories match. Entry-tier hardware runs at gross margins in the low to mid teens after channel cost, and several participants deliberately sell below assembled cost during promotional periods because a subscriber is worth more than a device sale. There is no path to widening that spread while general-purpose cameras ship pet detection at a third of the price.
Premium hardware carrying mechanical interaction or health sensing holds gross margins in the high twenties to mid thirties, and the spread reflects warranty exposure more than anything else. Interactive units with moving parts return at several points above static units, which eats the apparent margin advantage. Treat dispensing sits in the middle: mechanically simpler than laser play, and still the feature buyers most often name.

The high-value pool is the subscription and it is not close. Service tiers run above 70% gross margin with marginal delivery cost near zero, which is why every participant is chasing attach rate and retention rather than unit share. Health monitoring subscriptions carry the highest realised value per user in the category. Hardware exists to place a subscriber.

Volume / Commodity-Adjacent

Static and basic pan-tilt units sold through general electronics retail. Competes directly against general-purpose cameras carrying pet detection firmware at a third of the price, so pricing power is essentially absent at this tier.
Gross Margin: 12 to 18%

Premium / Certified

Treat-dispensing and interactive play units sold through pet specialty channels. The seven-point range reflects warranty return rates, which run several points higher on models with moving mechanical parts than on sealed static units.
Gross Margin: 28 to 35%

Sustainability / Regulatory / Next-Generation

Subscription service tiers including cloud recording and health trend reporting. The twelve-point range is wide because health tiers price well above basic recording while carrying similar delivery cost, and attach mix varies substantially by region.
Gross Margin: 62 to 74%
pet-monitoring-camera-market-portfolio-architecture-1790021423797

High-value Sub-segments and Strategic Watch-out

Health Monitoring Subscription Tiers

High value and high growth at 14.1%. Twelve-month retention sits roughly 22 points above category average because a trend line gives the owner a reason to keep paying once separation anxiety resolves. Delivery cost barely differs from basic recording. This is the profit pool of the entire category.
Gross Margin: 70 to 74%

Interactive Play Hardware

High value and moderate growth at 11.4%. Cat owners buy these disproportionately, which partly offsets weak feline detection elsewhere. Mechanical failure is the constraint, with warranty returns running several points above static units across every brand assessed here. Repair economics never work at these price points.
Gross Margin: 28 to 33%

Static Indoor Cameras

Volume core, growing slowest at 6.8% and losing ground continuously to general-purpose security hardware. It exists to place subscribers and to hold retail shelf space. Nobody in the category makes meaningful money on these units any longer. Shelf presence is the only remaining argument for continuing.
Gross Margin: 12 to 16%

Local Storage Non-Subscription Models

Strategic watch-out. European privacy regulation is pushing volume toward these units, and every one sold forfeits the 70% margin service tier permanently. Growth here looks like share gain and behaves like margin erosion across the whole installed base. Nobody has found a way to monetise these buyers yet.
Gross Margin: 18 to 24%

Why The Subscription Churns

The annuity in this category is emotional rather than operational, and that is its central weakness. A camera generates recurring revenue only for as long as the owner wants to look at it, and MMA survey work across 3,800 respondents in six countries found median daily app opens falling from 11 in month one to below two by month four. Nothing operational forces the renewal.
Stickiness varies sharply by household type. Multi-pet households retain considerably better, because there is always something happening and the alert stream stays interesting. Households with elderly or chronically ill animals retain best of all, since health trend reporting becomes a genuine clinical reference rather than reassurance. Single healthy adult dogs churn fastest, which is unfortunate given that they represent the largest acquisition cohort in every market covered.

Buyer profiles have shifted in one specific way since 2020. Owners who acquired pets during the pandemic bought cameras as anxiety management and churned accordingly. Owners entering the category since 2023 skew toward health motivation from the start, often after a veterinary event, and they subscribe to higher tiers and stay materially longer. That second cohort is now the majority of new activations.
pet-monitoring-camera-market-end-use-penetration-index-1790021424293

Where This Category Actually Earns

These are among the four positions where our research anticipates prominent divergence between winners and laggards over the coming forecast period. Each is grounded in the demand model, the regulatory perimeter, and the announced capacity pipeline.
01 / RETENTION ENGINEERING DISCIPLINE

Design the product for month four, not week one

Median daily app opens fall from 11 in month one to under two by month four, and almost no participant designs for that transition deliberately. Shifting notification character around week ten from event alerts toward weekly summaries and health trends holds engagement roughly 1.9 times better than default onboarding does. The build cost is notification logic and nothing else, which makes this the highest-return change available anywhere in the category today, and it works on the existing installed base without any hardware change whatsoever.
02 / HEALTH SENSING EXTENSION

Push trend reporting down the entire product range

Health monitoring currently sits behind premium hardware, which limits its retention benefit to customers who were least likely to churn in the first place. Respiratory rate and activity baselining run on video that entry-level sensors already capture, so the constraint is positioning rather than capability. Participants extending trend reporting across the range hold twelve-month retention around 22 points above category average, on a firmware update and modest additional cloud processing cost, which makes it among the cheapest retention gains available to anyone in this category.
03 / FELINE DETECTION PARITY

Close the cat accuracy gap before competitors do

Cat detection accuracy runs about 18 points below dog accuracy across every leading platform tested, because training data came overwhelmingly from early dog-owning customers. Cats outnumber dogs in Japan and several European markets, and their owners churn faster after repeated missed events. Building a cat-weighted training set from consented customer footage closes most of the gap within a single release cycle, at data cost rather than hardware cost, and the competitive window for doing it first is measured in quarters rather than years.
04 / LOCAL CURRENCY BILLING

Stop taxing emerging market growth with dollar pricing

Dollar-denominated subscriptions in Brazil, Mexico, Poland and India produce cancellation spikes every time the local currency moves against the dollar. Participants who shifted to local currency pricing report churn falling by roughly 27% within two quarters, with no change whatever to the underlying service being delivered. The obstacle is billing infrastructure, a one-time engineering cost set against a permanent retention gain in exactly the regions growing fastest, where subscription growth is currently being taxed by a decision nobody revisits deliberately.

Engagement Snapshot From the Field

A live engagement with an industry participant carrying material or product regulatory and market exposure ahead of a defining policy shift, showing how our research translates into a defensible multi-year portfolio strategy.
MARKET MINDS ADVISORY · CLIENT ENGAGEMENT SUMMARY
Pet Monitoring Camera Producer Strategic Portfolio Review and Transition Roadmap 2026·Investment Scenario on Pet Monitoring Camera Exposure Evaluation 2025-26
CLIENT PROFILE
A North American pet camera manufacturer with three hardware models, a two-tier subscription service and annual revenue of approximately USD 62 million (client-reported, unverified by MMA). Roughly 71% of revenue came from hardware and the remainder from subscriptions, an inversion of the profit pool the company had not examined. Subscriber base was near 240,000, with attach and churn tracked but never analysed together.
STRATEGIC CHALLENGE
Subscriber growth had stalled despite record hardware unit sales, and management assumed the problem was attach rate at the point of sale. Marketing spend had been increased twice against that assumption with no effect. Nobody had examined what happened to subscribers after the first ninety days, or why hardware growth was not converting into service revenue.
MMA APPROACH
MMA analysed anonymised app engagement telemetry for 240,000 accounts across their first eighteen months, segmented churn by household composition and animal type, and interviewed 34 cancelled subscribers about their reasons. Detection accuracy was tested independently on cat and dog footage against three competing platforms to establish whether missed events correlated with cancellation timing.
KEY FINDINGS
  1. Attach rate at point of sale was healthy at 38%; the problem was that twelve-month retention sat at 36%, well below what the company's own internal reporting had suggested.
  2. Median daily app opens fell from 11 in month one to 1.7 by month four, and cancellation clustered tightly in months five and six across every household type examined.
  3. Cat-owning households churned 21 points faster than dog-owning households, and independent testing confirmed feline detection accuracy trailing canine accuracy by roughly 18 points.
  4. Subscribers on the health-reporting tier retained at 61% against 31% on basic recording, yet health features were available on only one of the three hardware models sold.
CLIENT PROFILE
A North American pet camera manufacturer with three hardware models, a two-tier subscription service and annual revenue of approximately USD 62 million (client-reported, unverified by MMA). Roughly 71% of revenue came from hardware and the remainder from subscriptions, an inversion of the profit pool the company had not examined. Subscriber base was near 240,000, with attach and churn tracked but never analysed together.
STRATEGIC CHALLENGE
Subscriber growth had stalled despite record hardware unit sales, and management assumed the problem was attach rate at the point of sale. Marketing spend had been increased twice against that assumption with no effect. Nobody had examined what happened to subscribers after the first ninety days, or why hardware growth was not converting into service revenue.
MMA APPROACH
MMA analysed anonymised app engagement telemetry for 240,000 accounts across their first eighteen months, segmented churn by household composition and animal type, and interviewed 34 cancelled subscribers about their reasons. Detection accuracy was tested independently on cat and dog footage against three competing platforms to establish whether missed events correlated with cancellation timing.
KEY FINDINGS
  1. Attach rate at point of sale was healthy at 38%; the problem was that twelve-month retention sat at 36%, well below what the company's own internal reporting had suggested.
  2. Median daily app opens fell from 11 in month one to 1.7 by month four, and cancellation clustered tightly in months five and six across every household type examined.
  3. Cat-owning households churned 21 points faster than dog-owning households, and independent testing confirmed feline detection accuracy trailing canine accuracy by roughly 18 points.
  4. Subscribers on the health-reporting tier retained at 61% against 31% on basic recording, yet health features were available on only one of the three hardware models sold.
RECOMMENDED STRATEGY
Phase 1: Phase one: extend health trend reporting to all three hardware models by firmware update, and restructure tiers so health sits at the volume price point. Phase 2: Phase two: rebuild notification logic to shift from event alerts to weekly summaries at week ten, before alert fatigue drives disabling. Phase 3: Phase three: build a cat-weighted detection training set from consented customer footage and ship improved feline accuracy within two releases.
OUTCOME
Twelve-month retention rose from 36% to 54% across the following four quarters (client-reported, unverified by MMA), with subscription revenue overtaking hardware revenue for the first time. Cat-owning household churn narrowed to within seven points of dog-owning households after the detection update shipped. Hardware unit volume was unchanged throughout the period.

Frequently Asked Questions

Foundational context covering the market sizes, CAGR, scope, country, region and competition that inform every finding below. This section is provided to cover basics and most often pre-purchase conversations, answered from the MMA Primary Research Dataset.

What is the current size of the Pet Monitoring Camera Market?

The market was valued at USD 1.1 billion in 2025, rising to USD 1.2 billion in 2026. Subscription services account for a disproportionate share of profit despite representing a minority of revenue.

How large will the Pet Monitoring Camera Market be by 2036?

MMA forecasts USD 2.9 billion by 2036, an increase of USD 1.7 billion over the 2026 base. That represents expansion of 2.42 times across the forecast period.

What is the CAGR for the Pet Monitoring Camera Market 2026 to 2036?

The base case CAGR is 9.4%, with a bull case of 10.7% and a bear case of 8.1%. Historical growth between 2020 and 2025 ran at 8.3%.

Which segment is growing fastest?

Multi-sensor health monitoring cameras grow at 14.1%, half again the market rate, because health trend reporting sustains subscriptions after owner anxiety fades. Interactive play cameras follow at 11.4%.

Who are the major companies in the Pet Monitoring Camera Market?

Tomofun, Anker Innovations, Petcube, Wyze Labs and Xiaomi lead on unit shipments, holding a combined 41% of the market. General-purpose camera makers including TP-Link and Hikvision are taking the entry tier.

Which country is growing fastest?

China grows fastest at 12.8%, driven by urban companion animal populations passing 120 million cats and dogs from a negligible base fifteen years ago. India follows closely on metropolitan pet adoption.

Report Segmentation Architecture

The full report scope spans multiple orthogonal segmentation dimensions, with cross-tabulated demand data provided for each dimension pair. Coverage extends further to regional breakdowns, trend trajectories, and the competitive detail needed to support segment-level decision-making.

By Device Type

  • Treat-Dispensing Cameras
  • Static Indoor Cameras
  • Pan-Tilt-Zoom Cameras
  • Interactive Play Cameras
  • Multi-Sensor Health Monitoring Cameras
  • Outdoor and Yard Monitoring Cameras

By End-Use Setting

  • Single-Occupancy Apartments
  • Family Households
  • Multi-Pet Households
  • Elderly and Chronic Care Animals
  • Professional Pet Boarding
  • Veterinary and Clinical Observation

By Distribution Channel

  • Pet Specialty Retail
  • General Electronics Retail
  • Direct-to-Consumer Online
  • Marketplace Platforms
  • Veterinary Clinic Referral
  • Telecommunications Carrier Bundles

By Region

  • East Asia
  • North America
  • Western Europe
  • South Asia and Pacific
  • Latin America
  • Middle East and Africa
  • Eastern Europe

Scope, Methodology, and Coverage

Every figure in this report is reproducible from documented input assumptions. The scope below maps the historical period, the forecast horizon, the segmentation dimensions, and the countries covered, alongside the underlying primary and qualitative methodology.
Historical Period
2020 to 2025
Forecast Period
2026 to 2036
Base Year
2025 (USD billions; MMA Primary Research Dataset, September 2026)
Market Definition
This market covers consumer cameras designed and marketed specifically for remote observation of companion animals, spanning treat-dispensing, static indoor, pan-tilt-zoom, interactive play, multi-sensor health monitoring and outdoor pet units, together with the recurring subscription services attached to them. Pet detection firmware on general-purpose hardware is included only where the unit is sold and packaged as a pet product. General home security cameras, GPS pet trackers, wearable collars, camera-free automatic feeders and veterinary imaging equipment are excluded.
Quantitative Units
USD billions at end-user level; volume in millions of units; subscription attach and retention as percentages.
Segmentation Dimensions
Device type, end-use setting, distribution channel, and geographic region.
Regions Covered
East Asia, North America, Western Europe, South Asia and Pacific, Latin America, Middle East and Africa, Eastern Europe
Countries Covered
United States, China, Germany, Japan, India, Brazil
Key Companies Profiled
Tomofun, Anker Innovations, Petcube, Wyze Labs, Xiaomi, Arlo Technologies, TP-Link, Amazon, Google, Skymee, Pawbo, Radio Systems, Dogness International, Reolink, Dahua Technology, Hikvision, Waggle, Enabot, SwitchBot, Aqara
Quantitative Methodology
Primary survey, n=3,800 respondents, Q4 2025, six countries; demand-side model with trade association cross-validation
Qualitative Methodology
47 expert interviews, Q4 2025; applied to validate demand model assumptions, identify emerging dynamics, and assess competitive positioning
Report Format
PDF and XLSX data workbook (Word format preview document)
Publisher
Market Minds Advisory
Report Code
MMA-2026-TEC-763
Published
September 2026
Contact
sales@marketmindsadvisory.com | www.marketmindsadvisory.com

Purchase the full Pet Monitoring Camera Market Report (2026 to 2036).

The full report sizes the pet monitoring camera market across six device types, six end-use settings and six distribution channels for all seven global regions. It includes the complete engagement decay analysis drawn from 3,800 survey respondents across six countries, tracking app usage from activation through month eighteen. Independent detection accuracy testing compares feline and canine performance across leading platforms. Subscription economics are modelled separately from hardware, with attach rate, retention and delivery cost broken out by tier and region. Competitive assessment covers 20 participants on a consistent unit shipment basis.
Engagement decay tracked across 3,800 survey respondents
Feline versus canine detection accuracy testing
Subscription economics modelled separately from hardware margin
Six device types sized through 2036
Twenty participants assessed on unit shipments
Regional subscription attach and retention benchmarks

Built For The People Who Decide

From boardroom strategy to bench-side execution, this report is read cover-to-cover by leaders shaping the next decade of their industry, turning demand scenarios, market dynamics and valuation benchmarks into decisions.
CXOs/ Presidents/ VPs/ Managers
M&A and Corporate Development
Strategy Teams and R&D Heads
Procurement and Product Directors
Regulatory and Compliance Leaders
Investor Relations and Equity Analysts